
Risk factors and quality of life of dyslipidemic patients in Lebanon: A cross-sectional study
- DOI
- 10.1016/j.jegh.2016.10.001How to use a DOI?
- Keywords
- Dyslipidemia; Lebanese population; Quality of life; SF-36
- Abstract
The main objective of this study was to identify the risk factors of dyslipidemia and measure its impact on patients’ quality of life (QOL). Secondary objectives were to determine the percentage of dyslipidemia and assess the predictive factors affecting patients’ QOL. A cross-sectional study was conducted in a sample of Lebanese population. A standardized questionnaire was developed to assess the QOL using the Short form-36 (SF-36) score. A total of 452 individuals were interviewed, of which 59.5% were females. The mean age was 43.3 ± 15.6 years, and 24.8% had dyslipidemia. The results show a lower overall QOL score among dyslipidemic patients compared with controls (57.9% and 76.5%, respectively; p < 0.001). Waterpipe smoking [adjusted odds ratio (ORa) = 4.113, 95% confidence interval (CI): 1.696–9.971, p = 0.002], hypertension (ORa = 3.597, 95% CI: 1.818–7.116, p < 0.001), diabetes (ORa = 3.441, 95% CI: 1.587–7.462, p = 0.002), cigarette smoking (ORa = 2.966, 95% CI: 1.516–5.804, p = 0.001), and passive smoking (ORa = 2.716, 95% CI: 1.376–5.358, p = 0.004) were significantly associated with dyslipidemia in individuals older than 30 years. A higher overall QOL score (p = 0.013) was observed in patients treated with statins in comparison with other lipid-lowering medications. In addition to clinical and economical consequences, dyslipidemia may have a significant impact on patients’ QOL. Further research is needed to confirm the impact of treatment on dyslipidemic patients’ QOL in order to maximize the overall benefits of therapy.
- Copyright
- © 2016 Ministry of Health, Saudi Arabia. Published by Elsevier Ltd.
- Open Access
- This is an open access article under the CC BY-NC-ND license (http://creativecommons.org/licenses/by-nc-nd/4.0/)
1. Introduction
According to the recommendations of the European Society of Cardiology in 2011, dyslipidemia is defined as abnormal levels of lipids in the blood (cholesterol, triglycerides, phospholipids, and free fatty acids) [1]. The sixth edition of the survey ObEpi Roche [2], conducted in France between January and March 2012, in a sample of more than 25,000 individuals aged 18 years and over, has shown 15.9% of the French population to be treated for dyslipidemia. In the United States, 49% of adults have a total cholesterol level of ⩾200 mg/dL [3].
Dyslipidemia is considered a major risk factor for cardiovascular complications [4]. Many studies such as those conducted by the World Health Organization and “Framingham” created the association of plasma cholesterol level with the risk of cardiovascular disease [5,6]. This association is also confirmed in the results of a meta-analysis of 10 cohort studies, which stated that for a reduction of 0.6 mmol/L of serum total cholesterol in adults aged over 60 years, the risk of fatal cardiovascular disease decreases by 27% [7]. Risk factors for dyslipidemia are well documented, including lifestyle choices such as high-fat diet, smoking, alcohol consumption, physical inactivity, metabolic disorders such as obesity and diabetes, family history, and genetic differences [8–11].
Moreover, it was demonstrated that dyslipidemia may have an impact on the quality of life (QOL) of patients [12,13]. The World Health Organization defines QOL as “an individual’s perception of their position in life in the context of culture and value systems in which they live and in relation to their goals, expectations, standards and concerns.” This definition implies that the concept of QOL is subjective and multidimensional, including positive and negative elements [14]. In 2001, Lalonde et al. [15] have shown that patients with dyslipidemia had low QOL. This may be due to rigid dietary prescriptions, medication side effects, the need for regular medical care [15], and psychological effect.
Improvement of QOL would be very important in the management of patients with dyslipidemia. The increasing trend in the numbers of patients with dyslipidemia makes this evaluation highly relevant, in order to better manage dyslipidemic patients and consequently improve their QOL [16]. However, a few studies have investigated the impact of detection and treatment of dyslipidemia on QOL. Identification of clinical variables that reduce QOL should help in adopting healthcare measures with greatest impact on target populations [13]. The impact of dyslipidemia on the QOL of Lebanese patients has never been studied until now.
Therefore, a pilot study was conducted in this context. Its main objective was to identify dyslipidemia risk factors and measure the impact of this disease on patients’ QOL. Secondary objectives were to determine the percentage of dyslipidemia and assess the predictive factors affecting QOL.
2. Materials and methods
2.1. Study design and population
This is an observational cross-sectional study, conducted in all districts of Lebanon. Our sample was constructed from community pharmacies. One percent (26 pharmacies) of total Lebanese pharmacies was included in our study. These 26 pharmacies were randomly chosen from the list of pharmacies in Lebanon, obtained from the Order of Lebanese Pharmacists.
Lebanese people of both genders, aged 18 years and above, were included. Individuals having a temporary illness (such as cold); those suffering from cancer, and neurological and psychological diseases; and pregnant women were excluded. Since there are no published data on the prevalence of dyslipidemia in Lebanon, sample size was not previously calculated.
2.2. Data collection
Data were collected using a structured questionnaire. Questionnaires were delivered to the included pharmacies. In each pharmacy, the first five patients, who agreed to participate, were selected. Oral consent was obtained from each patient. A self-administered questionnaire was completed by the participants themselves. Privacy and anonymity were respected.
The survey was conducted between March and June 2014, using a standardized Arabic questionnaire containing 98 questions most of which were closed.
2.2.1. Questionnaire
The questionnaire was divided into five parts: sociodemographic, life style, diseases, medications, and QOL. The first two parts of the questionnaire were developed from general questions and previously documented risk factors [8–11]. It extracted information regarding sex, age, district, employment, active and passive smoking, physical activity, monitoring of fat, fasting, medical history, and medications taken at home.
2.3. QOL measurement
An Arabic validated version of the Short form-36 (SF-36) was used as described by Sabbah et al. [17]. QOL was assessed by the SF-36, a short form of the Medical Outcome Study [18]. It contains 36 questions. The SF-36 assesses eight health dimensions: physical functioning, role physical limitation, bodily pain (BP), general health, social functioning, role emotional limitation, mental health, and vitality. From these eight scales, it is possible to calculate two summary scores, physical component summary (PCS) (physical functioning, role physical limitation, bodily pain and general health) and mental component summary (MCS) (social functioning, role emotional limitation, mental health and vitality), and also the overall QOL.
Dimensions, summary scores, and the overall QOL are presented in percentages, which vary from 0% to 100%. Higher scores represent better QOL, indicating higher levels of functioning or well-being.
2.4. Statistical analysis
Questionnaire data were collected and processed by Statistical Package for the Social Sciences, Version 22. Categorical variables were presented in frequencies and percentages, and continuous variables as means with standard deviations.
Then the participants were classified into two groups. Individuals diagnosed with dyslipidemia by a physician were considered as cases. Controls were those who did not suffer from dyslipidemia.
A bivariate statistical analysis was conducted using chi-square, Fisher exact, t test, and analysis of variance.
In addition, two multivariate regressions were conducted to eliminate confounders. Logistic regression (backward logistic regression) was performed to identify the risk factors of dyslipidemia. The dependent variable was dyslipidemia, and variables giving a p value of <0.2 in the bivariate analysis were independent variables. The Hosmer and Lemeshow test was not significant (p = 0.681), indicating that this logistic regression can be used, and the model is adequate to the data. The value of Nagelkerke R2 (0.595) suggest that 64.9% of the achievement by dyslipidemia were explained by the independent variables introduced.
Similarly, a linear regression was performed to determine predictive factors affecting the QOL. The dependent variables were QOL, PCS, MCS, and all variables giving a p value of <0.2 in the bivariate analysis as independent variables. Conditions of normality, linearity, and homoscedasticity were checked for the linear regressions.
Finally, a subgroup analysis was also performed. An association was considered significant for p < 0.05.
3. Results
The questionnaire was administered to 581 individuals. The response rate was 78% (454 participants). Among the 452 individuals included, 269 were females (59.5%). The age of the population ranged from 18 years to 84 years, with a mean value of 43.3 ± 15.6 years. Approximately one-quarter of the sample (24.8%) was treated for dyslipidemia and diagnosed for more than 3 months.
3.1. Variables associated with dyslipidemia
Association of sociodemographic and life style variables with dyslipidemia was investigated using a bivariate analysis (Table 1). Among dyslipidemic patients, males (p = 0.032), patients with a body mass index (BMI) of >30 kg/m2 (p < 0.01), active and passive smokers (p < 0.01), and alcohol consumers (p < 0.01) had significantly higher percentages. Among the control individuals, significantly higher percentages were seen in those practicing sports and fasting (p < 0.01).
| Case, n (%) | Control, n (%) | p | |
|---|---|---|---|
| Sex | 0.032 | ||
| Male | 55 (30.1) | 128 (69.9) | |
| Female | 57 (21.2) | 212 (78.8) | |
| BMI | <0.001 | ||
| Underweight | 0 (0) | 10 (100) | |
| Normal | 20 (8.6) | 213 (91.4) | |
| Overweight | 58 (37.9) | 95 (62.1) | |
| Obesity | 34 (60.7) | 22 (39.3) | |
| District | 0.094 | ||
| Beirut | 18 (22.8) | 61 (77.2) | |
| Mont Lebanon | 19 (25) | 57 (75) | |
| Bekaa | 20 (26.7) | 55 (73.3) | |
| North Lebanon | 18 (25.4) | 53 (74.6) | |
| Nabatieh | 20 (25.6) | 58 (74.4) | |
| South Lebanon | 17 (23.3) | 56 (76.7) | |
| Income | 0.081 | ||
| <675,000 LP | 56 (31.1) | 124 (68.9) | |
| 675,000–,000,000 LP | 16 (20.5) | 62 (79.5) | |
| 1,000,000–2,000,000 LP | 24 (19.4) | 100 (80.6) | |
| >2,000,000 LP | 16 (22.9) | 54 (77.1) | |
| Cigarette smoking | <0.001 | ||
| Yes | 62 (47.7) | 68 (52.3) | |
| No | 50 (36.3) | 272 (63.7) | |
| Waterpipe smoking | 0.065 | ||
| Yes | 19 (28.4) | 48 (71.6) | |
| No | 93 (28.7) | 292 (71.3) | |
| Passive smoking | <0.001 | ||
| Yes | 76 (34.2) | 146 (65.8) | |
| No | 36 (15.7) | 194 (84.3) | |
| Sport | <0.001 | ||
| Yes | 24 (13) | 160 (87) | |
| No | 88 (32.8) | 180 (67.2) | |
| Omega | 0.183 | ||
| Yes | 20 (33.3) | 40 (66.7) | |
| No | 92 (20.8) | 300 (79.2) | |
| Fasting | <0.001 | ||
| Yes | 84 (21.4) | 314 (78.6) | |
| No | 28 (51.9) | 26 (48.1) | |
| Alcohol | <0.001 | ||
| Yes | 17 (58.6) | 12 (41.4) | |
| No | 95 (16.9) | 328 (83.1) |
BMI = body mass index.
p-value in bold i < 0.05 is statistical significant.
Variables in dyslipidemic (case) and nondyslipidemic (control) participants.
3.2. Quality of life
The bivariate analysis showed that the eight dimensions, their two component summaries (PCS and MCS), and the overall QOL score were significantly lower among patients with dyslipidemia (p < 0.001) than among nondyslipidemic individuals (Figure 1).
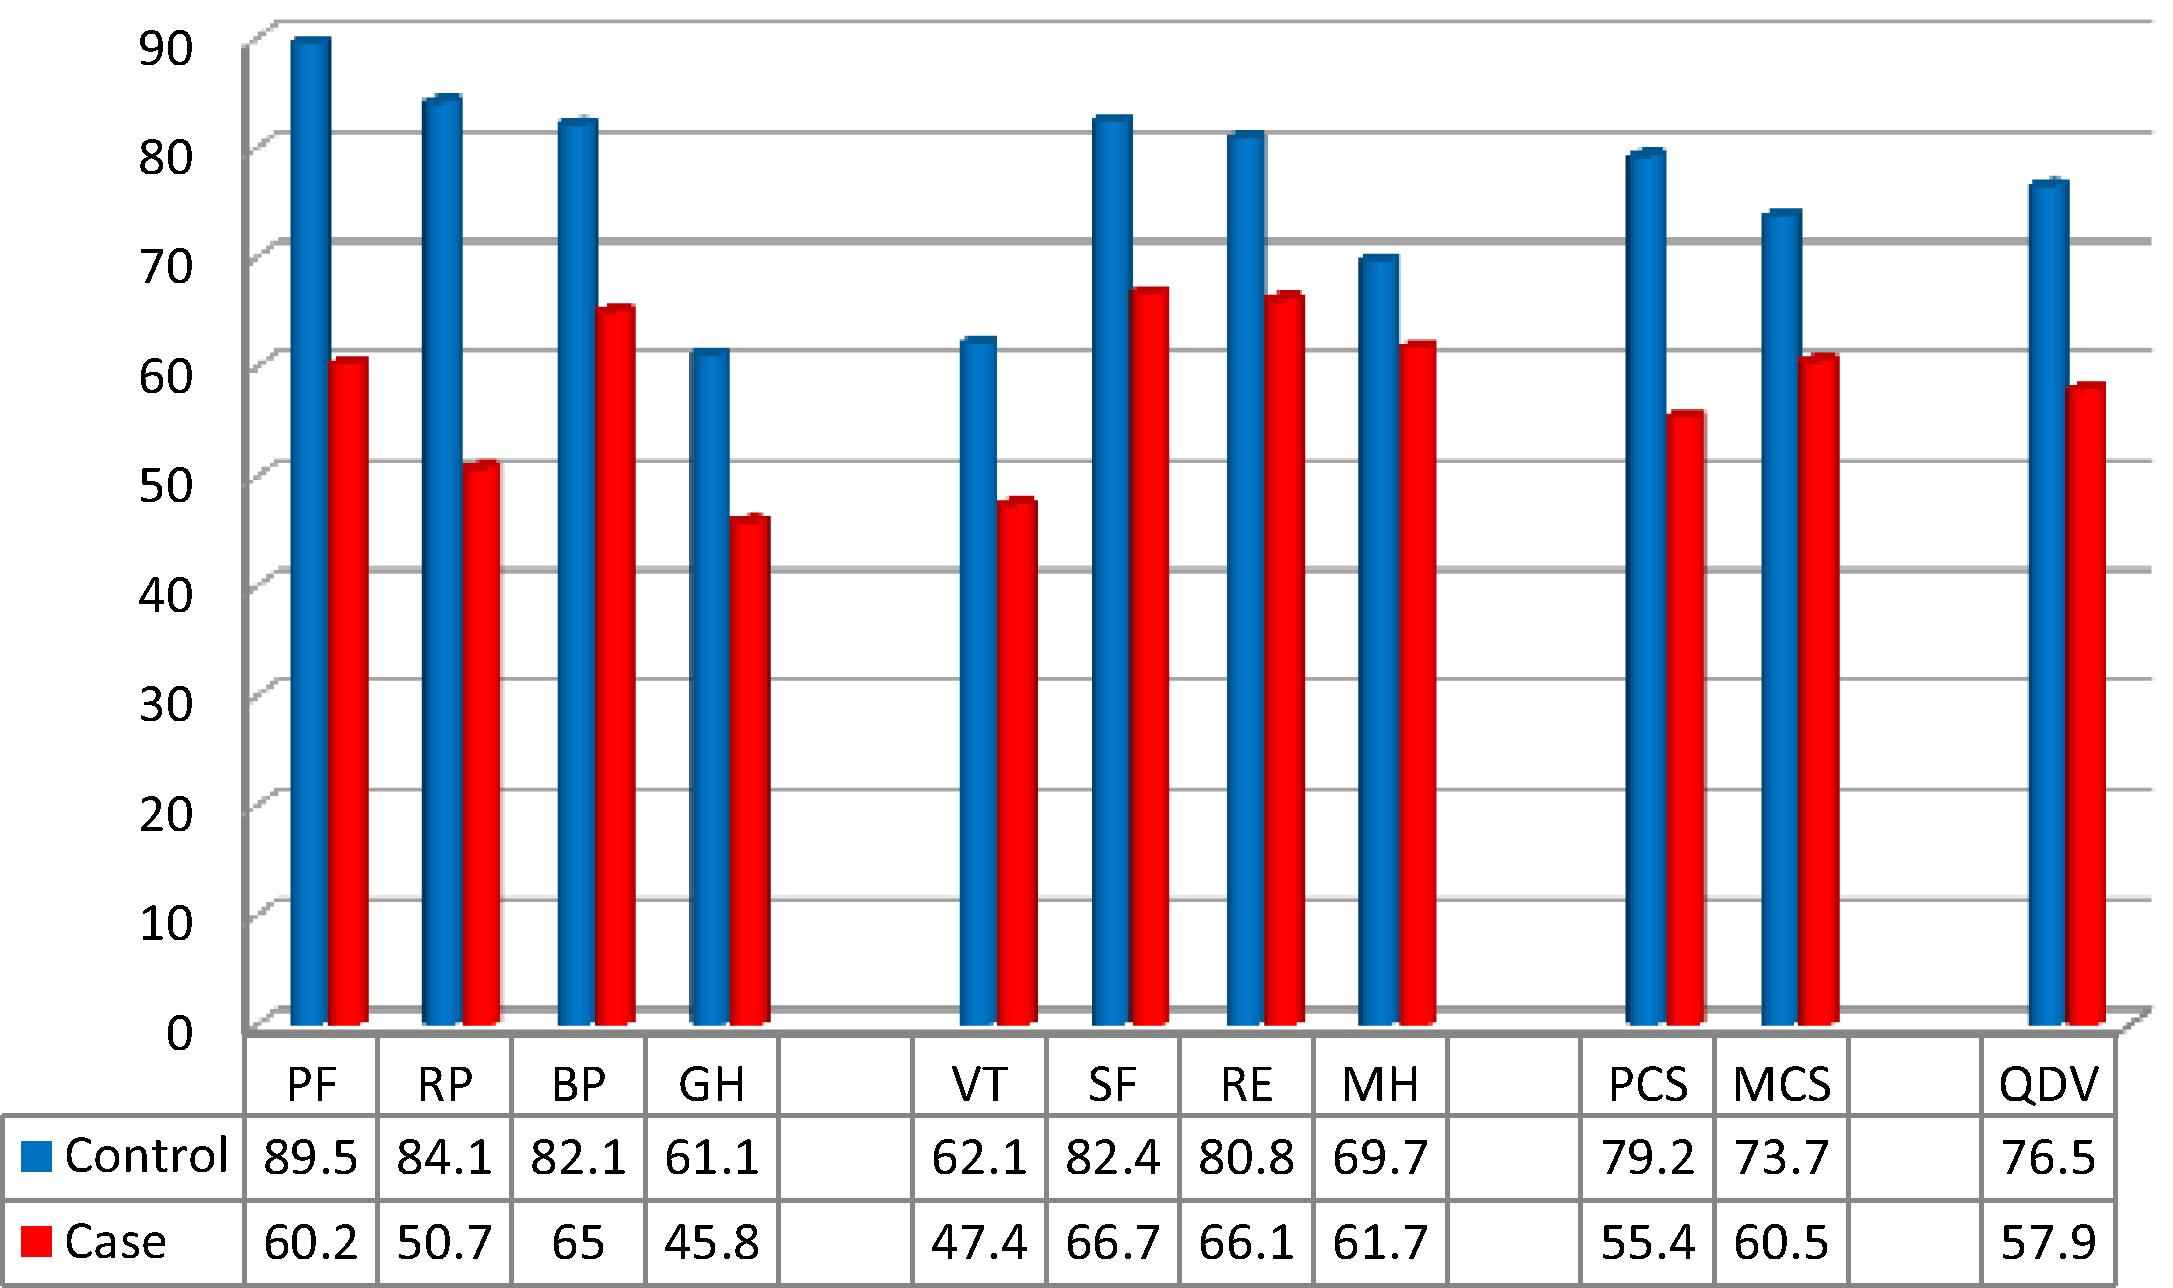
Mean scores of the eight dimensions, physical and mental component summaries, and the overall score of quality of life of the SF-36, comparing dyslipidemia and control groups. BP = bodily pain; GH = general health; MCS = mental component summary; MH = mental health; PCS = physical component summary; PF = physical functioning; RE = role emotional limitation; RP = role physical limitation; SF = social functioning; VT = vitality.
3.3. Multivariate analysis
3.3.1. Logistic regression
A logistic regression to identify risk factors of dyslipidemia was performed on individuals older than 30 years (73.2% of participants), including 110 cases and 221 controls.
In the last step of the regression (backward logistic regression), the variables remained significantly associated with dyslipidemia, as presented in Table 2.
| Risk factors | p | ORa | CI (95%) |
|---|---|---|---|
| Passive smoking | 0.004 | 2.716 | 1.376–5.358 |
| Monitoring fat | <0.001 | 0.319 | 0.199–0.513 |
| Cigarette smoking | 0.001 | 2.966 | 1.516–5.804 |
| Waterpipe smoking | 0.002 | 4.113 | 1.696–9.971 |
| Hypertension | <0.001 | 3.597 | 1.818–7.116 |
| Diabetes | 0.002 | 3.441 | 1.587–7.462 |
| BMI class (2) | <0.001 | 0.056 | 0.020–0.161 |
| BMI class (3) | 0.007 | 0.281 | 0.112–0.704 |
BMI class (2) = 18.5–24.99 kg/m2 and BMI class (3) = 25–29.99 kg/m2 compared with BMI > 30 kg/m2.
BMI = body mass index; CI = confidence interval; ORa = adjusted odds ratio.
Dyslipidemia risk factors in adults aged over 30 years.
Variables such as stimulant or alcohol consumption, sport practice, and sex were not significantly associated with dyslipidemia.
Results of the logistic regression showed that waterpipe smoking [adjusted odds ratio (ORa) = 4.113, 95% CI: 1.696–9.971, p = 0.002], hypertension (ORa = 3.597, 95% CI: 1.818–7.116, p < 0.001), diabetes (ORa = 3.441, 95% CI: 1.587–7.462, p = 0.002), cigarette smoking (ORa = 2.966, 95% CI: 1.516–5.804, p = 0.001), and passive smoking (ORa = 2.716, 95% CI: 1.376–5.358, p = 0.004) were significantly associated with dyslipidemia.
3.3.2. Linear regression
Results of the linear regression (Table 3) showed that factors such as sports (p < 0.001), high salary (>2 million LP, compared with a salary of <2,000,000 LP; p = 0.013), taking omega (p = 0.004), and dwelling in Bekaa (p < 0.001) and Mount Lebanon (in comparison with Beirut; p = 0.009) increased the PCS. However, dyslipidemia (p = 0.001), passive smoking (p < 0.001), unemployment (p < 0.001), and fasting decreased the PCS. Variables such as cigarette and waterpipe smoking, alcohol and stimulant consumption, sex, and BMI were not significantly associated with the PCS.
| Dependent variable | Predictors | Unstand. β | Stand. β | CI (95%) | p |
|---|---|---|---|---|---|
| PCS | Age | −0.617 ± 0.054 | −0.453 | −0.723; −0.510 | <0.001 |
| Sport | 6.456 ± 1.492 | 0.149 | 3.524; 9.387 | <0.001 | |
| Unemployment | −5.985 ± 1.541 | −0.133 | −9.013; −2.956 | <0.001 | |
| Passive smoking | −5.712 ± 1.401 | −0.134 | −8.464; −2.959 | <0.001 | |
| Bekaa/Beyrouth | 7.934 ± 1.873 | 0.138 | 4.253; 11.614 | <0.001 | |
| Dyslipidemia | −6.495 ± 1.910 | −0.132 | −10.248; −2.741 | 0.001 | |
| Omega | 4.912 ± 1.677 | 0.094 | 1.616; 8.209 | 0.004 | |
| Fasting | −6.295 ± 2.218 | −0.096 | −10.655; −1.936 | 0.005 | |
| ML/Beirut | 4.934 ± 1.869 | 0.086 | 1.261; 8.606 | 0.009 | |
| Salary > 2,000,000 | 5.012 ± 2.012 | 0.085 | 1.057; 8.966 | 0.013 | |
| MCS | Age | −0.203 ± 0.061 | −0.155 | −0.323; −0.084 | 0.001 |
| Passive smoking | −9.105 ± 1.7 | −0.221 | −12.477; −5.764 | <0.001 | |
| Unemployment | −9.049 ± 1.825 | −0.208 | −12.637; −5.462 | <0.001 | |
| Sport | 8.069 ± 1.804 | 0.193 | 4.524; 11.613 | <0.001 | |
| BMI > 25 | −4.609 ± 1.841 | −0.112 | −8.227; −0.992 | 0.013 | |
| Bekaa/Beirut | 4.917 ± 2.251 | 0.089 | 0.493; 9.340 | 0.029 | |
| QOL | Age | −0.394 ± 0.055 | −0.316 | −0.502; −0.286 | <0.001 |
| Sport | 7.337 ± 1.537 | 0.184 | 4.317; 10.357 | <0.001 | |
| Passive smoking | −7.430 ± 1.437 | −0.190 | −10.255; −4.605 | <0.001 | |
| Unemployment | −8.453 ± 1.522 | −0.205 | −11.444; −5.462 | <0.001 | |
| Bekaa/Beirut | 5.843 ± 1.887 | 0.111 | 2.134; 9.551 | 0.002 | |
| BMI > 25 | −4.458 ± 1.537 | −0.114 | −7.479; −1.437 | 0.004 | |
| Cigarette | −3.648 ± 1.752 | −0.088 | −7.091; −0.204 | 0.038 |
BMI = body mass index; CI = confidence interval; MCS = mental component summary; ML = Mount Lebanon; PCS = physical component summary; QOL = quality of life; Stand. = standardized; Unstand. = unstandardized.
Predictors of PCS, MCS, and QOL.
In addition, sports (p < 0.001) or dwelling in Bekaa (in comparison with Beirut; p = 0.029) affect the MCS positively. However, passive smoking (p < 0.001), unemployment (p < 0.001), and being overweight or obese (BMI > 25 kg/m2 compared with BMI < 25 kg/m2; p = 0.013) affect the MCS negatively. Variables such as cigarette and waterpipe smoking, alcohol and stimulant consumption, sex, income, fasting, taking omega, and dyslipidemia were not significantly associated with the MCS.
The QOL score is increased by sports (p < 0.01) and dwelling in Bekaa (in comparison with Beirut) (p = 0.002), and decreased by unemployment (p < 0.001), being overweight or obese (BMI > 25 kg/m2 compared with BMI < 25 kg/m2; p = 0.004), cigarette smoking (p = 0.038), as well as passive smoking (p < 0.001). Confounders were waterpipe smoking, alcohol and stimulant consumption, sex, income, fasting, taking omega, and dyslipidemia.
3.4. Subgroup analysis
3.4.1. Subgroup of dyslipidemic patients (cases)
Table 4 shows higher QOL scores in dyslipidemic patients treated with statins compared with those treated with other antidyslipidemic medications. This difference was found to be statistically significant, especially for the PCS (p = 0.005) and the total QOL (p = 0.013).
| PCS | MCS | QOL | ||||
|---|---|---|---|---|---|---|
| % | p | % | p | % | p | |
| Taking a statin | ||||||
| Yes | 57.6 ± 21.2 | 0.005 | 61.9 ± 22.3 | 0.074 | 59.7 ± 20.3 | 0.013 |
| No | 40.2 ± 18.9 | 50.7 ± 16.6 | 45.5 ± 15.4 | |||
| Number of drugs for dyslipidemia | ||||||
| 1 | 55.7 ± 21.7 | 0.739 | 61.4 ± 21.5 | 0.254 | 58.5 ± 20.0 | 0.797 |
| 2 | 53.6 ± 21.4 | 54.2 ± 25.1 | 53.9 ± 22.6 | |||
| Compliance with dyslipidemia treatment | ||||||
| Yes | 55.5 ± 21.6 | 0.905 | 61.3 ± 21.8 | 0.286 | 58.4 ± 20.1 | 0.522 |
| No | 54.8 ± 22.4 | 54.6 ± 22.8 | 54.7 ± 21.9 | |||
| Visiting doctor regularly | ||||||
| Yes | 55.4 ± 21.9 | 0.979 | 60 ± 22.3 | 0.568 | 57.7 ± 20.7 | 0.747 |
| No | 55.5 ± 20.6 | 63.4 ± 20.2 | 59.5 ± 18.5 | |||
MCS = mental component summary; PCS = physical component summary; QOL = quality of life.
p-value in bold i < 0.05 is statistical significant.
Comparison of scores in the subgroup of cases.
In contrast, this difference was not significant with respect to the number of medications, treatment compliance, and regular visits to the physician.
3.4.2. Subgroup of patients with chronic diseases
Figure 2 shows that among patients with chronic diseases, a significant difference exists only in the MCS between dyslipidemic patients (60.5 ± 22) and those with other chronic disease(s) (58 ± 25.2; p = 0.039).
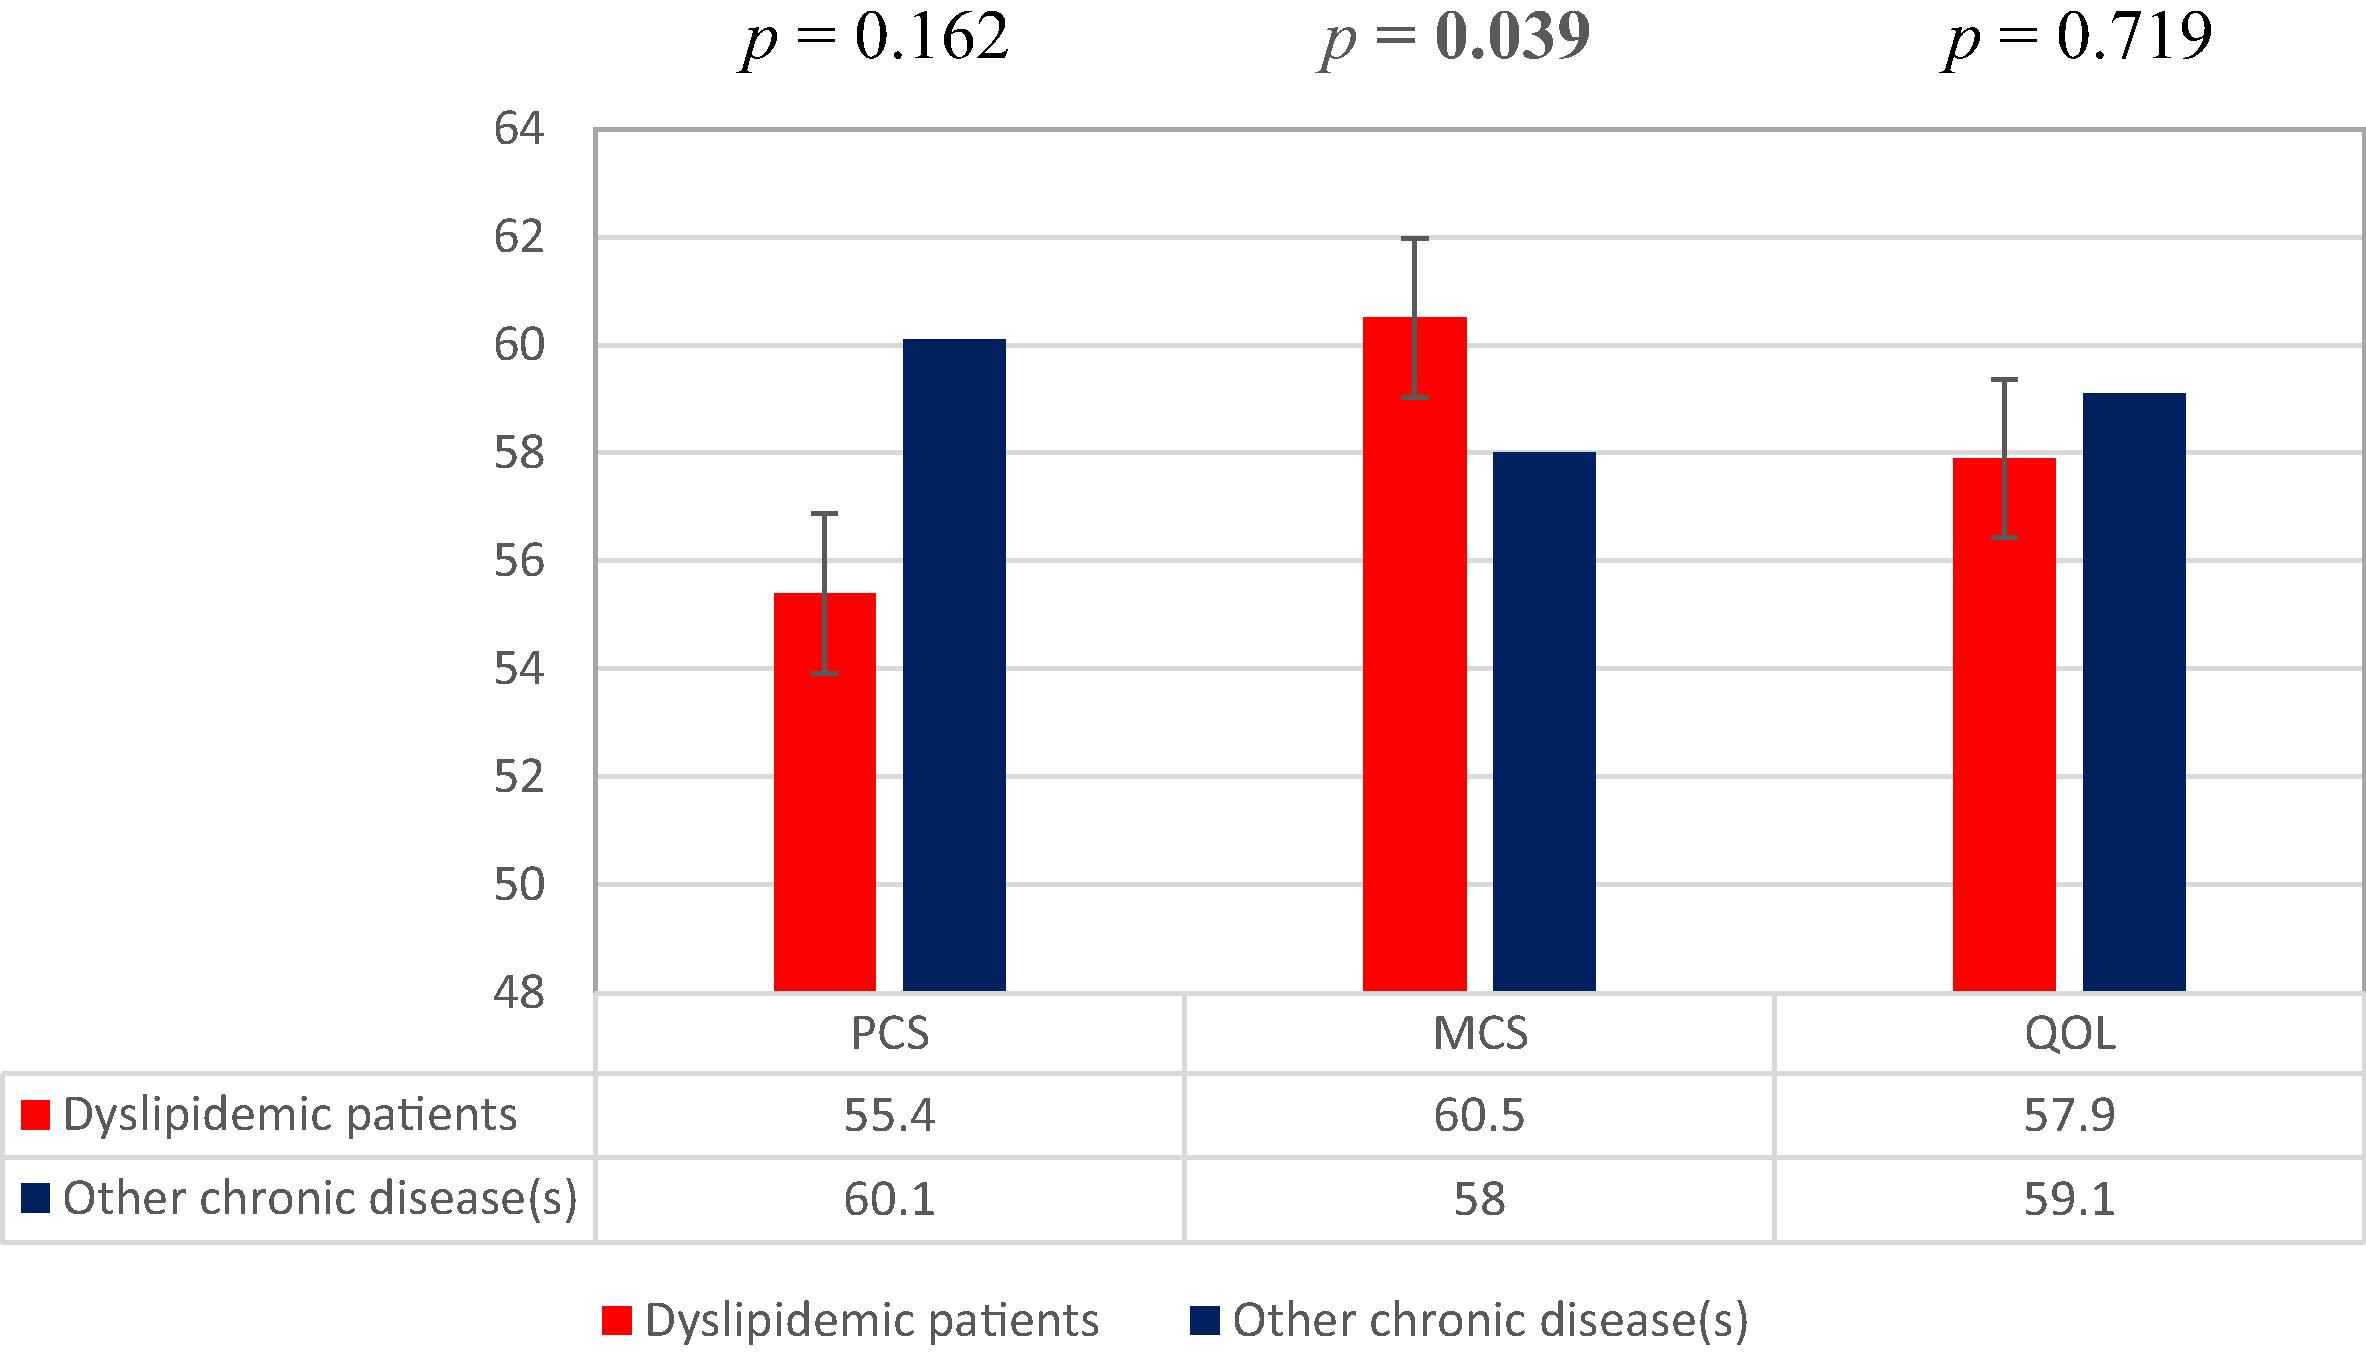
Comparison of scores in the subgroup of patients with chronic diseases. MCS = mental component summary; PCS = physical component summary; QOL = quality of life.
4. Discussion
The objectives of this study were to determine the risk factors of dyslipidemia and its percentage, measure QOL and analyze their predictive factors among a sample of the Lebanese population.
This study showed that patients with dyslipidemia had significantly lower QOL than individuals without dyslipidemia (p < 0.001). This finding is consistent with a Canadian study conducted in hospitals [15], where patients (reporting high levels of blood lipids, as confirmed by a physician, and receiving treatment for dyslipidemia) had lower scores of QOL (measured by the SF-36) than the control group.
Indeed, few studies have evaluated the impact of dyslipidemia on QOL. Most studies assess the impact of chronic diseases in general [19], cardiovascular disease [13,15] and especially hypertension [16,20–23], on the QOL of patients. Chronic diseases [24] affect QOL and physical, emotional, and social well-being of patients. Therefore, measuring QOL is considered an important factor in assessing the health of individuals.
Results of the linear regression showed that age, passive smoking, smoking cigarettes, a BMI of >25 kg/m2, and not having an occupation affect QOL negatively, while sports improve QOL. The same results were shown in previous studies with respect to overweight and obesity [13,20,25–27], smoking [20,28], unemployment [29], and sports [13,30].
The percentage of dyslipidemic patients in this study was 24.8%. A study conducted in “Hôtel-Dieu de France” hospital [30] in 1999 to determine the lipid profile of the Lebanese population has reported percentages of individuals with significantly high blood lipids than recommended: 19% for total cholesterol and 27% for low-density lipoprotein.
Results of the logistic regression reported that smoking waterpipe is the most important risk factor of dyslipidemia. Waterpipe smokers were four times more at risk to develop dyslipidemia than non-waterpipe smokers. Similarly, hypertension and diabetes increase the risk of being dyslipidemic by 3.5 times. Active and passive cigarette smokers were 2.9 and 2.7 times more likely to develop dyslipidemia, respectively. By contrast, having a normal BMI or being overweight decreases the risk compared with obese individuals. Monitoring of dietary fat is also considered a protective factor.
Our results are concordant with those of other studies that identified diabetes [31–35], hypertension [31,32,34–36], cigarette smoking [31,35,36], and higher BMI [32–36] as risk factors for dyslipidemia. Diet was identified as a protective factor [31].
This study had some limitations. The participants themselves completed the questionnaires, so the results of the survey are based on self-reported data. Among the questions, respondents were asked to evaluate themselves with two obstacles: difficulty of self-assessment and possibility of cheating. Therefore, information bias cannot be absent. QOL is directly related to subjective health status of patients, functions of daily life, and disease severity [37]. The degree of consensus between the desired and real-life situations is the QOL [38].
However, this study was randomly conducted in all regions of Lebanon, which could minimize selection bias. One of the strong points of this study is the use of SF-36, which is the best choice, in comparison with the short-form 8 and 12 questionnaires SF-8 and SF-12 (items obtained from the SF-36), although it is lengthier. The SF-36 is the original version. It is a widely used tool to measure the QOL of patients in different populations, including aspects such as function, dysfunction, and emotional and physical well-being [28].
A high acceptance rate (78%) could be a strong point for this study. Good cooperation of the participants was noted, except for those who refused to participate in the survey due to either a lack of time or a lack of confidence, or for the fear of disclosing information, which they described as too personal. In addition, questionnaires filled by those who agreed to participate had very few “missing values.”
Being conducted for the first time in Lebanon, this study was a preamble to organize larger studies in the future in order to confirm the impact of treatment on dyslipidemic patients’ QOL, and eventually to maximize the overall benefits of therapy.
5. Conclusion
The eight dimensions, their two components summaries (PCS and MCS), and the overall QOL score were significantly lower among patients with dyslipidemia (p < 0.001) than among nondyslipidemic individuals.
The results of our study show that active and passive smoking (waterpipe and cigarette) and suffering from hypertension or diabetes are risk factors for dyslipidemia. Avoiding exposure to these risk factors can prevent the development of dyslipidemia. On the contrary, having a normal BMI or being overweight, compared with obese individuals, as well as monitoring of dietary fat are considered protective factors.
This study allowed us to make some suggestions on factors negatively affecting QOL, such as active and passive smoking, a BMI of >25 kg/m2, and unemployment, but sports were shown to improve QOL.
Conflicts of interest
No potential conflicts of interest were disclosed.
Acknowledgments
The authors thank the Lebanese University for supporting this project. This work was supported by the Doctoral School of Sciences and Technologies at the Lebanese University. It had no role in the study design, collection of data, analysis and interpretation of results, writing of the report, and decision to submit the article for publication.
References
Cite this article
TY  - JOUR
AU  - Akram Farhat
AU  - Amal Al-Hajje
AU  - Samar Rachidi
AU  - Salam Zein
AU  - Mayssam Bou Zeid
AU  - Pascale Salameh
AU  - Wafaa Bawab
AU  - Sanaa Awada
PY  - 2016
DA  - 2016/11/11
TI  - Risk factors and quality of life of dyslipidemic patients in Lebanon: A cross-sectional study
JO  - Journal of Epidemiology and Global Health
SP  - 315
EP  - 323
VL  - 6
IS  - 4
SN  - 2210-6014
UR  - https://doi.org/10.1016/j.jegh.2016.10.001
DO  - 10.1016/j.jegh.2016.10.001
ID  - Farhat2016
ER  -