
Patients’ Satisfaction after Primary Health Care Centers’ Integration with Ministry of Health Hospitals, Jeddah
- DOI
- 10.2991/jegh.k.190522.001How to use a DOI?
- Keywords
- Hospitals; integration; patients’ satisfaction; primary health care centers; PSQ18
- Abstract
In today’s competitive and media-influenced health care environment, resource utilization is driven by patient outcome. A key criterion to evaluate the quality of health care services is to assess patients’ satisfaction. The objectives of this study were to compare patients’ satisfaction in the first and last quarters after Primary Health Care Centers’ (PHCCs) integration with Ministry of Health (MOH) hospitals in Jeddah, and to identify the factors contributing toward patient’s satisfaction in first and last quarters. This cross-sectional study was conducted among patients visiting PHCCs in the first and last quarters. Randomly selected participants were interviewed using a validated closed-ended questionnaire, part of which also included modified Patient Satisfaction Questionnaire (PSQ18) with its subscales and standard cutoffs. Chi-squared test and multinomial logistic regression analysis were run to find the factors associated with satisfaction. The overall satisfaction in our study participants was 66.3% in the first quarter as compared with 83% in the last quarter. The mean scores of most PSQ18 subscales in the first and last quarters after the integration showed significant difference. Multinomial logistic regression analysis of the first quarter after integration showed three to fourfold increase in satisfaction of individuals who perceive an improvement in registration counters’ load, cleanliness of centers, satisfaction with the staff’s behavior, and ease in referral as compared with non-satisfaction [OR 3.60 (p = 0.018); OR 4.33 (p = 0.001); OR 2.47 (p = 0.055); and OR 4.45 (p = 0.005), respectively]. However, in the last quarter those satisfied with the staff’s behavior (OR 2.48, p = 0.038), and dental facilities (OR 2.74, p = 0.043) had an odds ratio of ≥2. PHCCs integration with the hospitals is an effective strategy, which not only has improved functionality but has a significant effect on patient’s satisfaction. Treating patients served by PHCCs integrated with hospitals is thus recommended.
- Copyright
- © 2019 Atlantis Press International B.V.
- Open Access
- This is an open access article distributed under the CC BY-NC 4.0 license (http://creativecommons.org/licenses/by-nc/4.0/).
1. INTRODUCTION
A rapid expansion in use of the term “patient satisfaction” not only in health care vernacular, but also at community level is noted in the recent past. In the walk of this expansion, patients’ subjective experience of care, commonly referred to as “patient satisfaction” is now acknowledged as a top priority for health care managers and policy makers [1]. Feedback and input from patients have gained increasing attention as a meaningful and an essential source of information for identifying perceived gaps. This becomes essential for both evaluation and appraisal of the existing health services [1,2]. Patients’ honest opinions and direct feedback are considered the best way to measure the quality of their experiences [3,4]. As patients are the only ones who experience the entire journey of care; considering either their positive feedback or even critique is the key to understanding the overall quality of care in any health care setting [4,5]. The concept “patient satisfaction” is not clearly defined in the literature. However, one basic definition states, “the patient’s personal evaluation of the care he or she has experienced, reflecting both care realities and patient characteristics,” is commonly accepted and used [6].
In the last three or four decades, health care industry has witnessed mega/massive drives aiming toward continuous quality improvement. These quality improvement movements gained momentum since Donabedian’s declaration for incorporating patients’ perception into quality assessment [5,6]. To improve the quality and performance in today’s health care environment, turning patient satisfaction surveys into a quality improvement tool plays a vital role [4,6,7]. Therefore, it is important to ensure that quality improvement initiatives are focused on the areas where they are most needed. Whenever future strategies in health and patient care services are being designed; all health care leaders who endeavor to achieve excellence take patient perception and feedback into account [7,8].
However, a visible change in public opinion and their perception about health care system is also noted in the recent past. Increase in public awareness and knowledge about their basic rights owing to repeated advocacy campaigns and media projection, it would be unrealistic to expect health services to remain undisputed [7,8]. Increase in patient load, their high demands/expectations, and fiscal restraints have resulted in debates about the best approach to organize and deliver primary care [8].
Convenience of services such as accessibility and availability, health care providers’ technical competence especially his or her interpersonal skills and the physical environment including general cleanliness wherein services are delivered; all are important to measure patients’ satisfaction [9]. Although patient’s satisfaction is measured over these wide range of health service dimensions, yet some of them are debatable [9]. Whether this assessment, evaluation, and ratings by the patient reflect or suggest anything about technical excellence and quality of health care professional or it is simply based on the interpersonal skills of the providers remains controversial [9,10]. Some studies also suggest that the clinical characteristics, symptoms, and disease severity are linked to satisfaction scores rather than technical competence and quality [10]. The rate of patient’s dissatisfaction reported in different studies vary from 11% to 65% based on their experience and quality of care they received [11].
Surveying patients’ experiences during their health care facility visit guides authorities and gives an insight into areas that are working effectively and the practices that can be improved and redesigned [8,11]. Three interrelated benefits are created by shaping the health care facilities around patient satisfaction and experience that include [9,10]:
- a)
Better patient experience,
- b)
Better provider experience, and
- c)
Improved efficacy and quality.
The primary health care approach is a relatively new concept in the Kingdom of Saudi Arabia (KSA). In 1978, KSA adopted the strategy of “Health for All for the year 2000” [12]. Patients’ first contact with the health care system is through these Primary Health Care Centers (PHCCs). These PHCCs incorporate all the essential and basic health care services to be provided at the grassroots level; thus, the role of the PHCCs become vital for attaining an acceptable level of health for general public [12]. Therefore, it is recommended that the PHCC services should be easily accessible and available in all geographical locations at a very low/no cost for the whole population, regardless of their economic or social class [12,13].
Jeddah PHCCs were under the administration of “Public Health Directorate” which have recently been shifted under MOH hospitals’ supervision. In Saudi Arabia, studies have been conducted on patient satisfaction in primary care setups. However, after the recent integration of PHCCs with the hospitals, there is a lack of knowledge about the level of patient’s satisfaction. The aim of this study was to investigate changes in patient satisfaction after PHCCs’ integration with MOH hospitals of Jeddah. To expand and improve the provision of health care services, factors and predictors of dissatisfaction must be identified and addressed. The feedback received would likely help policymakers in identifying and recognizing potential areas for service improvement leading to better patient management.
2. METHODOLOGY
This study was conducted in the PHCCs integrated with hospitals present in Jeddah working under the Ministry of Health (MOH). We used cross-sectional interview-based design comparing two time intervals after PHCCs’ integration with the MOH hospitals (i.e., first and last quarters). Matching was done using the same locations and similar population (same age group, gender, same PHCCs, and using the same tool). Adult patients Saudi or non-Saudi, male or female, having a file (already being registered), and being served in the same PHCC (for a period of at least 10 months) were included. (This 10-months duration was considered because it has been > 8 months that PHCCs have been integrated with King Abdul Aziz Hospital). Attendants with the patients visiting PHCCs were excluded.
The study duration was around 1 year from January 1st, 2018 to December 31st, 2018. The evaluation of patient satisfaction was done in two phases. The first phase was after 3 months of integration in the first quarter of 2018. The second was in the last quarter of 2018 for the assessment of patient satisfaction using the same validated questionnaire. A period of 2 months for data collection in each quarter after the approval from Internal Review Board.
The sample of PHCCs and patients was selected using the multistage stratified random sampling technique. Jeddah is divided into five administrative units, each having a tertiary care hospital with affiliated PHCCs. PHCCs were stratified based on their integration with the governmental hospitals near them. From each strata, we selected two PHCCs through a simple random selection approach, and included patients within these PHCCs through systematic sampling with a random start approach. To estimate patients’ satisfaction of the selected PHCCs, we calculated the sample size using EpiTools online sample size calculator (http://epitools.ausvet.com.au/content.php?page=SampleSize). The satisfaction was considered to be 80% (from the previous regional study [12]), keeping confidence interval (CI) at 95%, and the desired precision as 0.05. The calculated sample size was thus 246 patients for each time period. We used a design effect of two to account for clustering of patients; almost doubled the sample size to 500 across the selected PHCCs. We took at least 50 participants from each PHCC. We approached around 500 patients, but 17 patients did not complete the questionnaire/give consent so were not included in the first quarter analysis, whereas in the last quarter 13 patients were excluded.
The questionnaire was developed after a careful review of the literature and translated it into Arabic [9–11]. The translation was performed by two bilingual professional translators who understand the content. The translated instrument was then back-translated into English by two other bilingual translators and compared with its original version. This procedure ensured clarity and comprehensibility of items. Any discrepancies in comparison were discussed, and minor adjustments were made. To test the questionnaire content validity, it was then revised by two family medicine and three community medicine consultants. A pilot study was conducted to test the wording and reliability of the constructed questionnaire. This pilot study was conducted at PHCCs other than the PHCCs that constitute the study setting and its results were not included.
The tool we used for data collection consisted of three parts; the first part was about the personal information of the participant, second part included questions regarding general patient satisfaction, and the third part was the Arabic version of widely accepted, modified, and validated Patient Satisfaction Questionnaire (PSQ-18).
- •
General patient satisfaction. The primary outcome was general satisfaction, constructed as a composite variable from the mean of the total score of three question items adopted from a study conducted in Uganda [9]. Cutoffs for the total scores were <60% = “not satisfied”; 60–80% as “moderately satisfied” and >80% as “highly satisfied” [9].
- •
PSQ-18. PSQ-18 is a reliable and valid tool with seven subscales adapted from different studies [13–16]. The PSQ-18 yields separate scores for each subscale. It has 18 questions, but two were omitted that were covering financial aspects as this research was planned in governmental setups where the treatment is free. The participants were asked to rank the same questions before and after integration. Response to each question was invited in a five-point Likert response format (strongly agree to strongly disagree). All items were scored so that high scores reflect satisfaction with medical care. After item scoring, items within the same subscale were averaged together to create the six subscale scores as shown in Table 1. The range of scores for each subscale was from one (1) to five (5) with a median of 2.5. Scores more than the median value were considered good scores, which means “more satisfaction.” The statements on the PSQ are not all worded in the same direction, so some items (i.e., 1, 2, 3, 5, 6, 9, 13, and 16) were adjusted for their scored value.
| PSQ-18 scale scores | |
|---|---|
| Scale/Domains covered in PSQ | Average of these items |
| 1. General satisfaction | 3, 15 |
| 2. Doctors’ technical quality and competence | 2, 4, 5, 12 |
| 3. Interpersonal manner | 8, 9 |
| 4. Communication skills | 1, 11 |
| 5. Time spent with doctor | 10, 13 |
| 6. Accessibility and convenience | 6, 7, 14, 16 |
Creating PSQ-18 subscale scores
Data were collected and compiled in soft and hard copies. The main areas of interest were overall satisfaction, availability of vaccines, medicines and staff, registration and record maintenance, referral rate, dental, and laboratory facilities, etc. In addition to PSQ-18, few statements were related to patient’s general satisfaction. Data analysis was performed using IBM SPSS Statistics for Windows, version 23 (IBM Corp., Armonk, NY, USA). Overall PSQ-18 mean scores were calculated and compared using the independent t-test. Categorical variables were used for descriptive epidemiology. Chi-squared test was used to analyze categorical variables. Variables were described using mean with standard deviation or frequencies/percentage where appropriate. Multinomial logistic regression analysis was used to assess and compare the effect of different variables on overall patient satisfaction.
Ethical approval was granted by the ethics committee of MOH and Directorate of Health Affairs Jeddah (H-02-J-002-A00544). Permission was also granted from the administration of each PHCC. Before the interview informed consent was obtained from the patients and confidentiality of data was ensured.
3. RESULTS
Our study included 970 patients. We interviewed 483 in the first quarter with a mean age of 40.86 ± 13.24 years and 487 in the last quarter with a mean age of 42.80 ± 12.85 years. Most patients (n = 916, 94.4%) were Saudi nationals. Around 73% (n = 713) participants were married. No significant difference was noted in the level of education and overall satisfaction in the two quarters (first quarter: p = 0.175; last quarter: p = 0.467). Other demographic data are given in Table 2.
| Demographic variables | First quarter (n = 483) | Last quarter (n = 487) |
|---|---|---|
| Number (%) | Number (%) | |
| Gender | ||
| Male | 275 (56.9) | 254 (52.2) |
| Female | 208 (43.1) | 233 (47.8) |
| Age group | ||
| <40 | 255 (52.8) | 230 (47.2) |
| 40–60 | 193 (40.0) | 212 (43.5) |
| >60 | 35 (7.2) | 45 (9.2) |
| Nationality | ||
| Saudi | 463 (95.9) | 453 (93.0) |
| Non-Saudi | 20 (4.1) | 34 (7.0) |
| Marital status | ||
| Single | 65 (13.5) | 49 (10.1) |
| Married | 349 (72.3) | 364 (74.7) |
| Divorced | 54 (11.2) | 60 (12.3) |
| Widow | 15 (3.1) | 14 (2.9) |
| Educational status | ||
| No formal education | 38 (7.9) | 66 (13.6) |
| Primary | 70 (14.5) | 97 (19.9) |
| High school | 194 (40.2) | 172 (35.3) |
| University | 176 (36.4) | 148 (30.4) |
| Post-graduation | 5 (1.0) | 4 (0.8) |
| Length of the period a participant has been visiting the same PHCC | ||
| 10 months to 1 year | 54 (11.2) | 5 (1.0) |
| 1–2 years | 82 (17.0) | 123 (25.3) |
| <2 years | 347 (71.8) | 359 (73.7) |
| History of any chronic condition | ||
| Yes | 200 (41.4) | 247 (50.7) |
| No | 283 (58.6) | 240 (49.3) |
Demographic profile of study participants (n = 970)
The overall satisfaction (moderate + high) with the PHCC treatment and care in our study participants was 66.3% in the first quarter as compared with 83% in the last quarter. Significant (p < 0.001) improvement in the overall satisfaction was noted in the last quarter as shown in Figure 1.
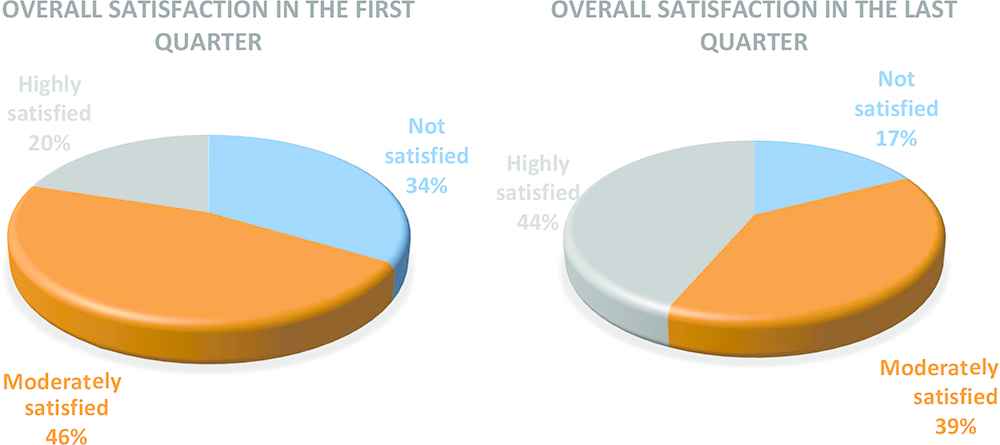
Comparison of overall patients’ satisfaction in the two quarters.
Around 402 (41.5%) participants had the knowledge about PHCC integration with the hospitals, whereas a majority of 568 (58.5%) were unaware. A statistically significant difference was also noted in the overall patients’ satisfaction levels stratified according to the clusters. A major improvement of highly satisfied patient category was noted in the PHCCs affiliated with Thaghr (68%), followed by East Jeddah (48%), and King Fahd (46%) hospitals as given in Table 3.
| Quarter | Variables | Cluster (Hospital name) | p-value | ||||
|---|---|---|---|---|---|---|---|
| King Abdul Aziz, n (%) | King Abdullah, n (%) | King Fahd, n (%) | Thaghr, n (%) | East Jeddah, n (%) | |||
| First quarter | Total participants (n = 483) | 94 (19.4) | 98 (20.2) | 107 (22.1) | 97 (20.1) | 87 (18.0) | |
| Last quarter | Total participants (n = 487) | 98 (20.1) | 102 (20.9) | 97 (19.9) | 100 (20.5) | 90 (18.4) | |
| First quarter | Not satisfied | 30 (31.9) | 32 (32.7) | 44 (41.1) | 44 (45.4) | 12 (13.8) | <0.001 |
| Moderately satisfied | 47 (50.0) | 45 (45.9) | 35 (32.7) | 40 (41.2) | 57 (65.5) | ||
| Highly satisfied | 17 (18.1) | 21 (21.4) | 28 (26.2) | 13 (13.4) | 18 (20.7) | ||
| Last quarter | Not satisfied | 39 (39.7) | 9 (8.8) | 12 (12.3) | 10 (10) | 15 (16.6) | <0.001 |
| Moderately satisfied | 25 (25.5) | 71 (69.6) | 40 (41.2) | 22 (22.0) | 32 (35.5) | ||
| Highly satisfied | 34 (34.6) | 22 (21.5) | 45 (46.3) | 68 (68.0) | 43 (47.7) | ||
Clusterwise overall satisfaction with PHCC services (n = 970)
Chi-square analysis for satisfaction with PHCC services in the two quarters after integration showed statistically significant improvement in almost every functional domain in the last quarter. These include less overcrowding at the registration counters (p = 0.004), overall improvement in PHCC cleanliness (p = 0.003), improved overall general behavior of the staff (p = 0.025), and promptness of services (p = 0.003). At the beginning of the first quarter, vaccine availability was less, which improved significantly in the last quarter (p < 0.001). However, minor improvement was reported for some other available services such as availability of medicines (p = 0.102), laboratory services (p = 0.419), and dental facilities (p = 0.544). Figure 2 shows overall patients’ experience after the integration in the first and last quarters with the hospitals.
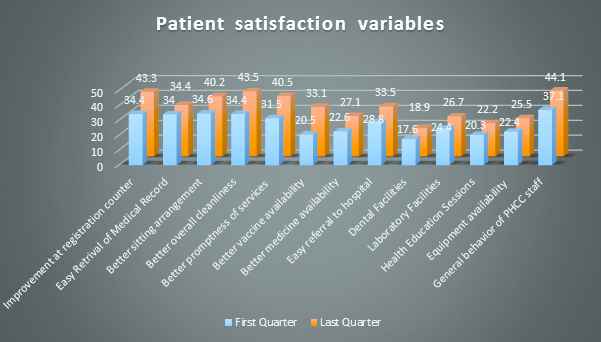
Comparison of participant’s experience in the first and last quarters (n = 970).
Similarly, Chi-square analysis showed a statistically significant difference in three satisfaction categories both in the first and last quarters. Only availability of vaccines and medicine had no significant difference between satisfaction categories as given in Table 4.
| Chi-square values for different satisfaction categories in the first quarter (n = 483) | ||||
| Variables | Not satisfied | Moderately satisfied | Highly satisfied | p-value |
| Improvement seen in (only ‘Yes’ responses) | ||||
| Registration counter overcrowded (n = 166) | 23 (13.9) | 92 (55.4) | 51 (30.7) | <0.001 |
| Easy retrieval of medical record (n = 164) | 24 (14.6) | 92 (56.1) | 48 (29.3) | <0.001 |
| Sitting room/waiting arrangement (n = 167) | 34 (20.4) | 90 (53.9) | 43 (25.7) | <0.001 |
| General cleanliness of PHCC (n = 166) | 24 (14.5) | 89 (53.6) | 53 (31.9) | <0.001 |
| General behavior of PHCC staff (n = 179) | 28 (15.6) | 103 (57.5) | 48 (26.8) | <0.001 |
| Promptness in services (n = 152) | 26 (17.1) | 90 (59.2) | 36 (23.7) | <0.001 |
| Vaccine availability (n = 99) | 29 (29.3) | 46 (46.5) | 24 (24.2) | 0.418 |
| Medicine availability (n = 109) | 34 (31.2) | 49 (45.0) | 26 (23.9) | 0.525 |
| Referrals procedure (n = 139) | 14 (10.1) | 76 (54.7) | 49 (35.3) | <0.001 |
| Dental facilities (n = 84) | 8 (9.5) | 55 (65.5) | 21 (25.0) | <0.001 |
| Laboratory facilities (n = 118) | 18 (15.3) | 70 (59.3) | 30 (25.4) | <0.001 |
| Health education sessions (n = 98) | 13 (13.3) | 61 (62.2) | 24 (24.5) | <0.001 |
| Instruments/equipment availability (n = 108) | 13 (12.0) | 69 (63.9) | 26 (24.1) | <0.001 |
| Chi-square values for different satisfaction categories in the last quarter (n = 487) | ||||
| Registration counter overcrowded (n = 211) | 20 (9.5) | 81 (38.4) | 110 (52.1) | <0.001 |
| Easy retrieval of medical record (n = 167) | 16 (9.6) | 53 (31.7) | 98 (58.7) | <0.001 |
| Sitting room/waiting arrangement (n = 196) | 18 (9.2) | 66 (33.7) | 112 (57.1) | <0.001 |
| General cleanliness of PHCC (n = 212) | 23 (10.8) | 73 (34.4) | 116 (54.7) | <0.001 |
| General behavior of PHCC staff (n = 215) | 28 (13.0) | 58 (27.0) | 129 (60.0) | <0.001 |
| Promptness in services (n = 197) | 23 (11.7) | 59 (29.9) | 115 (58.4) | <0.001 |
| Vaccine availability (n = 161) | 26 (16.1) | 69 (42.9) | 66 (41.0) | 0.472 |
| Medicine availability (n = 132) | 22 (16.7) | 54 (40.9) | 56 (42.4) | 0.869 |
| Referrals procedure (n = 163) | 16 (9.8) | 50 (30.7) | 97 (59.5) | <0.001 |
| Dental facilities (n = 92) | 6 (6.5) | 25 (27.2) | 61 (66.3) | <0.001 |
| Laboratory facilities (n = 130) | 12 (9.2) | 31 (23.8) | 87 (66.9) | <0.001 |
| Health education sessions (n = 108) | 13 (12.0) | 27 (25.0) | 68 (63.0) | <0.001 |
| Instruments/equipment availability (n = 124) | 15 (12.1) | 26 (21.0) | 83 (66.9) | <0.001 |
Satisfaction categories in the two quarters (n = 970)
Mean scores for the six PSQ-18 subdomains in the first and last quarters after the integration were calculated and have been presented in Table 5. An independent t-test showed a significant difference in five PSQ-18 domains in the first and last quarters. However, no improvement was reported in doctors communication skills (p = 0.576).
| PSQ18 subscales (Average scores) | First quarter (n = 483) | Last quarter (n = 487) | 95% confidence interval | p-value | |
|---|---|---|---|---|---|
| Mean (SD) | Mean (SD) | Lower | Upper | ||
| General satisfaction | 2.96 (0.804) | 3.36 (0.834) | −0.509 | −0.302 | <0.001 |
| Doctors’ technical quality and competence | 3.38 (0.592) | 3.52 (0.635) | −0.224 | −0.069 | <0.001 |
| Interpersonal skills | 3.44 (0.789) | 3.67 (0.793) | −0.330 | −0.130 | <0.001 |
| Communication skills | 3.59 (0.808) | 3.56 (0.775) | −0.071 | 0.128 | 0.576 |
| Time spent with doctor | 3.04 (0.876) | 3.19 (0.864) | −0.263 | −0.043 | 0.006 |
| Accessibility and convenience | 2.88 (0.748) | 3.24 (0.652) | −0.447 | −0.270 | <0.001 |
PSQ-18 domains mean scores before and after the integration (n = 970)
Pseudo R-squared value in multinomial logistic regression analysis for the overall satisfaction in first and last quarters showed 24% and 21% variation in the model due to the independent variables, respectively. In the first quarter, those who think there is an overall improvement and the situation after the integration is better, such as reduction in registration counters load, better cleanliness of centers and toilets, satisfaction with the staff’s behavior, and improvement and ease in the referral rates were around three to four times more highly satisfied as compared with non-satisfaction and think the condition has worsened now [OR 3.60 (p = 0.018); OR 4.33 (p = 0.001); OR 2.47 (p = 0.055); and OR 4.45 (p = 0.005), respectively]. However, in the last quarter of the integration, those satisfied with the staff’s behavior and dental facilities had an odds ratio of more than two [OR 2.48 (p = 0.038) and 2.74 (p = 0.043), respectively] as given in Table 6.
| Multinomial logistic regression model assessing odds of first quarter (n = 483) | ||||
| Variables | Moderately satisfied | Highly satisfied | ||
| OR (95% CI) | p-value | OR (95% CI) | p-value | |
| Less overcrowding of registration counters | ||||
| Yes | 2.24 (0.93–5.41) | 0.071 | 3.60 (1.24–10.47) | 0.018 |
| No | Reference | Reference | ||
| General cleanliness of center and toilets | ||||
| Yes | 2.03 (0.97–4.28) | 0.060 | 4.33 (1.81–10.38) | 0.001 |
| No | Reference | Reference | ||
| Staff behavior | ||||
| Yes | 2.35 (1.01–5.50) | 0.047 | 2.74 (0.97–7.71) | 0.055 |
| No | Reference | Reference | ||
| Ease in referral | ||||
| Yes | 1.55 (0.60–3.96) | 0.357 | 4.45 (1.5–12.604) | 0.005 |
| No | Reference | Reference | ||
| Multinomial logistic regression model assessing odds of last quarter (n = 487) | ||||
| Less overcrowding of registration counters | ||||
| Yes | 2.32 (1.02–5.28) | 0.044 | 1.25 (0.54–2.85) | 0.594 |
| No | Reference | Reference | ||
| General cleanliness of center and toilets | ||||
| Yes | 1.12 (0.49–2.52) | 0.784 | 1.09 (0.49–2.41) | 0.826 |
| No | Reference | Reference | ||
| Staff behavior | ||||
| Yes | 1.10 (0.48–2.53) | 0.807 | 2.48 (1.17–5.95) | 0.038 |
| No | Reference | Reference | ||
| Ease in referral | ||||
| Yes | 1.51 (0.72–3.15) | 0.270 | 1.71 (0.83–3.51) | 0.144 |
| No | Reference | Reference | ||
| Dentist | ||||
| Yes | 1.94 (0.69–5.43) | 0.207 | 2.74 (1.03–7.49) | 0.043 |
| No | Reference | Reference | ||
Multinomial logistic regression model assessing odds of moderately and highly satisfied relative to non-satisfied for the first and last quarters (n = 970)
4. DISCUSSION
This survey indicated patients’ satisfaction in the first and last quarters after the integration with MOH hospitals. The findings of this study gave an insight into identification and exploration of the factors affecting patients’ satisfaction. A major improvement in the highly satisfied category was reported in the last quarter, highlighting the efforts of MOH. A majority of the study participants (83%) in the last quarter were satisfied with the treatment and care given to them in PHCCs, with a much higher satisfaction than 60% and 69% satisfaction rates mentioned in some previous studies conducted in Saudi Arabia [17] and India [18], respectively. Literature shows that the overall patients’ satisfaction in some neighboring countries range between 60% and 80%, which was less than that of our study participants (83%) [17].
Clusterwise satisfaction analysis showed statistically significant difference among hospitals. Much improvement was seen in the Thaghr and East Jeddah hospital PHCCs; however, King Abdullah hospital participants did not show much difference in the highly satisfied category. Introduction of one specialist clinic (such as ENT and pediatrics) per week in some of their allied PHCCs by hospitals might be a possible reason of this high satisfaction. Further studies need to be conducted for satisfaction evaluation based on this to replicate it in other clusters.
A study conducted in Iran [19] showed higher satisfaction levels among patients getting treatment from private setups when compared with public setups. These levels were marginally above the overall satisfaction in our study participants. It shows the trust and level of confidence Saudi population has on its public sector services. Agarwal and Biswas [18] and Chakraborty et al. [20] highlighted the lack of services/facilities and equipment in the health centers as a major cause for dissatisfaction (42.4%). This is attributed to the lack of funding for the health care sector in developing countries [20]. In contrast to this, the majority of our study participants in the last quarter (70%) was satisfied with the equipment and facilities in our centers.
Literature shows the level of education tends to affect patients’ satisfaction. Bahrampour et al. [19] in their study showed education being a predictor for satisfaction with more dissatisfied patients among the highly educated group. However, our study demonstrated that there was no significant difference between the satisfaction levels of highly educated and less/uneducated patients, which was consistent with the finding of Ayatollahi et al. [21]. These findings were not in accordance with the results of some other studies conducted in Kuwait [22] and Saudi Arabia [23].
Patient satisfaction questionnaire-18 score for the two quarters show a significant difference in almost every subscale. However, no significant change was noted in doctors’ communication skills. As compared with the individual subscale scores of studies conducted in India [24] and Nigeria [25] (where the mean score was around four in each subscale), our subscale scores were slightly less, thus implying less satisfaction of our study participants. Another study conducted by Chakraborty et al. [20] showed the average scores in each subscale to be almost consistent with our study findings. The average score for the time spent by our PHCC doctors (above three in both quarters) was more than that spent by the doctors in India (2.92) [18]. In India, a shorter consultation time is because of huge patient load [18,20]. The doctor–patient communication scores in our study were almost similar to those of an Iranian study [26]. Lowest scores were seen in the financial subgroup in most of the studies [18,24,26], which was not calculated in our study because of the free treatment provided in our centers; PHCCs being governmental entity.
Regression analysis showed that some of the strongest predictors of patients’ satisfaction were registration counters being less overcrowded, general cleanliness of PHCC and toilets, satisfaction with the staff’s behavior and improvement and ease in the referral rate. Overcrowding in any setup increases the load on the health care staff, compromising on factors such as depth of relationship and lack of consultation time, which can affect patients’ outcome [17]. Although, an improvement in the consultation time was noted in the last quarter, it needs more attention. Studies show that satisfaction can be enhanced if physicians allow sufficient time for exchanging information with the patients [17,27]. Physician sensitivity to patients’ satisfaction can be improved by training them in time management and communication skills [28]. Overcrowding is also a major contributor toward physicians’ burnout [17]. Bawakid et al. [17,29] showed a positive correlation between the number of patients per day and physicians’ burnout. Similarly, general cleanliness of the hospital or a health care center is also recognized as a positive predictor not only for the patients’ satisfaction, but also as it affects the staff working in it [17]. Improvement and ease in the referral rate to their respective tertiary care hospitals just after the integration was notable, but it decreased considerably in the last quarter. Patients were highly satisfied with the ease in referral procedures at the beginning. However, streamlining the referral procedures took some time and effort after the integration, which is considered much better than the situation before the integration.
In this study, although an improvement was noted in the availability of vaccines and medicines comparing the two quarters, no statistical significance in these two parameters was reported, which needs to be looked into. Similar findings were seen in other regional studies [17,26]. Patients visiting any health care facility expect to get proper treatment and medication from there. Lack/unavailability of some routine vaccines and medicines force them either to revisit or to buy from their own pocket, thus affecting their satisfaction [17]. A recently conducted study in Jeddah highlighted the lack of dental and laboratory facilities as major factors contributing toward dissatisfaction of patients [17]. These findings are not in accordance to our study findings, as improvement in the dental facilities in last quarter was one of the satisfaction predictors.
The limitation of this study was that the satisfaction of patients visiting private setups was not assessed and compared. Similarly, increase in the health care staff work load and their satisfaction after integration should also be assessed. The clinical expertise in making a diagnosis and procedural skills were not assessed in our study, which are important factors contributing to patients’ satisfaction. A few open-ended questions should have been asked for in-depth understanding.
5. CONCLUSION
This study concludes that PHCCs’ integration with hospitals is an effective strategy, which has not only improved the functionality of PHCCs, but has a significant effect on patients’ satisfaction. Our results provide evidence and highlight the positive and significant effects of the integration on patients’ satisfaction. Although majority of the patients were found to be satisfied, yet a significant proportion were dissatisfied. Thus, there is a need to address the issues particularly in the domains where satisfaction scores were low, such as consultation time and laboratory facilities, etc. Improving health care services can help build an optimistic image of our PHCCs in the minds of the people. Future studies should cover patients’ satisfaction keeping in loop the other parameters such as support services and PHCC physician’s burnout. Improvement in patient satisfaction after the integration suggests replication of this approach in other cities.
CONFLICTS OF INTEREST
None declared.
AUTHORS’ CONTRIBUTION
Mashal Mesfer Alsayali designed the study/basic concept, proof read. Abdullah J Alsahafi conceptualized and designed the study, designed the methodology, literature review, interpretation of results, proof reading. Najlaa Mandoura contributed to the writing of the manuscript and assisted the interpretation of results. Hassan Bin Usman Shah wrote the first draft, analyzed and interpreted the data, designed the methodology, literature review. Ola Akram Abdul Rashid proof read, designed the study/basic concept. Khalid Al Sharif designed the study/basic concept, proof read. Amany Hamed Abo Zayed proof read, designed the study/basic concept, data collection. Adel Ibrahim analyzed the data. Abdullah Alzahrani and Fatima Algarni proof read, data collection. Mahmoud Madani Alali and Abdullah Al-Garni proof read, conceptualized, and designed the study. Mohammed Assiri proof read, data collection, overall supervision of the program. Assiri Ibrahim Mohammad proof read, collected data.
FUNDING SOURCE
This research did not receive any specific grant from funding agencies in the public, commercial, or not-for-profit sectors.
We declare that the manuscript has not been published earlier and is not under consideration for publication in any other journal.
All authors approved the manuscript for its submission to the journal.
ACKNOWLEDGMENT (PARTICIPATING INVESTIGATORS)
We thank the Department of Medical Research and Studies, Jeddah; KSA for the ethical approval of this study; and General Directorate Departments of health in Jeddah MOH, Saudi Arabia for facilitating the data collection of this survey. We also thank Khalthhom Ebrahim Alkardaliy, Fawzian Hamad, and Anood Alzahrani for their help in data collection.
REFERENCES
Cite this article
TY  - JOUR
AU  - Mashal Mesfer Alsayali
AU  - Abdullah Al-Sahafi
AU  - Najlaa Mandoura
AU  - Hassan Bin Usman Shah
AU  - Ola Akram Abdul Rashid
AU  - Khalid AlSharif
AU  - Amany Hamed Abo Zayed
AU  - Adel Ibrahim
AU  - Abdullah Al-Zahrani
AU  - Fatima Al-Garni
AU  - Mahmoud Madani Alali
AU  - Abdullah Al-Garni
AU  - Mohammed Assiri
AU  - Assiri Ibrahim Mohammad
PY  - 2019
DA  - 2019/06/11
TI  - Patients’ Satisfaction after Primary Health Care Centers’ Integration with Ministry of Health Hospitals, Jeddah
JO  - Journal of Epidemiology and Global Health
SP  - 135
EP  - 142
VL  - 9
IS  - 2
SN  - 2210-6014
UR  - https://doi.org/10.2991/jegh.k.190522.001
DO  - 10.2991/jegh.k.190522.001
ID  - Alsayali2019
ER  -