
Predictors of Persistent Body Weight Misclassification from Adolescence Period to Adulthood: A Longitudinal Study
- DOI
- 10.2991/jegh.k.190518.002How to use a DOI?
- Keywords
- Adolescent; adult; body weight; predictor; weight perception
- Abstract
This study examined whether body weight misclassification continues from adolescence to adulthood and the associated predictors behind that misclassification. Data are from a sample of a longitudinal Australian birth-cohort study. Data analyses were restricted to 2938 participants whose measured and perceived body weights were recorded during their adolescence and adulthood follow-ups. To identify misclassification, we objectively compared their measured and perceived body weights at each follow-up. Potential predictors during early life or adolescence periods were included in data analyses. At each follow-up, underestimation was recorded more often among overweight and obese participants, whereas overestimation was mostly recorded among underweight ones. Over 40% males and females were able to correctly estimate their body weight at one follow-up, whereas almost 30% males and 40% females were able to do so in more than one follow-ups. One-third females and 45% males underestimated their body weight at one follow-up, whereas 13% females and a quarter of males were able to do so in more than one follow-ups. Being female, dieting, being overweight, having an overweight mother, and having poor mental health were the most significant predictors for more than one follow-up misclassifications. Further studies are needed to evaluate the impact of persistent misclassification on population health benefits.
- Copyright
- © 2019 Atlantis Press International B.V.
- Open Access
- This is an open access article distributed under the CC BY-NC 4.0 license ( http://creativecommons.org/licenses/by-nc/4.0/).
1. INTRODUCTION
Inaccurate perception of one’s own body weight is a relatively common phenomenon observed in adolescents and adults [ 1– 8]. It has been suggested that body weight misclassification may begin from adolescence and continue to adulthood [ 9– 11], and that body weight misclassification may enhance vulnerability to some physical and mental health problems including increase in body weight, following unhealthy diet, anxiety, and depression [ 1, 12– 16]. Arguably, the adolescent period is a particularly sensitive stage of life. It is a stage of life when body shape may be of a particular concern [ 17– 19]. It is a period when perceiving oneself as physically attractive may be critically important. Few earlier studies have discussed the issue of body weight misclassification, and none to our knowledge has described body weight misclassification extending from the adolescent period to young adulthood.
Comparing studies of adolescent and adult weight misclassification, it is unclear whether misclassification is more or less common among adults than among adolescents, particularly for people who are overweight or obese [ 1, 2, 4– 7]. Several studies have reported that body weight misclassification among overweight and obese adults ranges from 37% to 62%, whereas others show that from 44.7% to 80.9% overweight and obese adolescents misclassified their body weight [ 1, 5, 8, 20]. The magnitude of weight misclassification prevalence might vary depending on the methods used to measure weight perception (e.g., word or verbal descriptions, sketch, or figures). Some studies have found that using sketch or figures (silhouette) may be associated with a decrease in body weight misclassification when compared with that using a verbal description [ 21, 22], whereas other studies have found the reverse to be the case [ 23].
In the context of measuring the persistence of weight misclassification, which is a longitudinal pattern of body weight underestimation and of overestimation from the adolescent period to adulthood, one large-scale population study ( N = 9623) among Danes ranging in age from 15 to 75 years (weight misclassification was defined as inaccurate overweight perception among overweight participants), the authors found that, after they followed participants at three time points (baseline, after 5–9 years, and then 10–13 years), body mass index (BMI)-defined overweight trend was found to increase, but overweight misclassification decreased over the study period for both genders. This weight misclassification change through the study period was significant in men (from 77.5% to 71.4%, p = 0.001) but not in women (from 54.8% to 51.9%, p = 0.24) [ 24]. We have not been able to find any earlier study which examines the persistence of under- and overweight misclassifications from adolescence to young adulthood; that is, the period of the life course when the rate of weight gain is proportionally the highest [ 25, 26].
In general, research related to body weight misclassification tends to emphasize body weight under and overestimation. The significance of correct body weight estimation has not been explored much. Therefore, further research is needed to know more about correct body weight estimation over the life course.
Several studies have suggested that weight misclassification is associated with some physical and mental health problems including an unhealthy diet, as well as depression and anxiety [ 1, 12, 15, 27]. Little is known about the factors that predict the accuracy of weight estimation from adolescence to adulthood, but some studies suggest that parental obesity, dieting to lose weight, and mental health problems may be predictors of weight misclassification [ 1, 3, 4, 28– 30]. These factors have also been found to be associated with body shape dissatisfaction and a preoccupation with ideal body weight image [ 1, 12, 18, 31, 32]. However, it is yet to be studied whether factors such as body weight dissatisfaction, parent–child communication, weight bullying and teasing, leisure time, and family eating habits might also influence weight misclassification.
Although it is established that weight misclassification affects a large minority of adolescents and adults, whether weight misclassification may persist from adolescence to adulthood is yet to be discerned besides the predictors associated with that misclassification. Realizing the continuity of weight misclassification during life stages might contribute to efforts to diminish the adverse effects of its associated factors such as body weight and mental health.
This study investigates body weight misclassification from adolescence to adulthood and the physical and mental health predictors associated with it.
2. METHOD
The data for this study were drawn from the Mater-University of Queensland Study of Pregnancy and its outcome (MUSP), which is a mother–offspring pair birth cohort study that commenced in 1981 in Brisbane, Australia. A total of 7223 pregnant women who gave birth to a live singleton child at the Mater Misericordiae Hospital were recruited to this study between 1981 and 1983. The mothers and their children have been followed-up prospectively at child birth, 3–5 days post-delivery, 6 months, 5, 14, and 21 years. At 27 years, only mothers were followed up, whereas only offspring were followed up at 30 years. Mothers completed details of their offspring’s physical, mental, behavioral, and developmental characteristics at each follow-up to 14 years, whereas offspring completed their own physical, mental, lifestyle, and welfare questionnaires from 21 years onward. Details of the study can be found in Najman et al. [ 33, 34].
The study sample is limited to the offspring for whom relevant data were available at two or three follow-ups (14-, 21-, and 30-year follow-ups). The analytical sample is restricted to 2938 offspring for whom their perceived and measured body weights were recorded at least during two follow-ups at 14-, 21-, and 30-year follow-ups.
Each phase of the study was approved by the ethics committee of the hospital and/or from the University of Queensland. Up to the 14-year follow-up, written formal consent was obtained from the mothers as well as their children for their participation. Later, mothers and their offspring provided their own consent at each phase of the study.
2.1. Measurement
2.1.1. Weight and height
At the 14-year follow-up, to record respondent’s body weight, the average of two measures were recorded on a scale accurate to 0.2 kg, with respondents wearing light-weight clothes. Height was measured using a portable stadiometer. At 21- and 30-year follow-ups, the current measured body weight and height were collected from respondents’ questionnaires.
2.1.2. Body weight
At the 14-year follow-up, BMI cut-off values were identified using Cole et al. international survey standard definition for overweight and obesity [ 35]. For the purpose of this study, <10% of respondents were classified as underweight. At 21- and 30-year follow-ups, BMI cut-off values for underweight, normal weight, overweight, and obesity were calculated based on the WHO’s standard definition for Western populations.
2.1.3. Accurate weight status
Body mass index cut-off values were used to categorize participants in their body weight category (i.e., underweight, normal weight, overweight, or obese) at each phase of the study.
2.1.4. Weight perception
Details of perceived body weight were drawn from the participants’ questionnaires at 14-, 21-, and 30-year follow-ups. At each follow-up, weight perception was measured by asking respondents a similar question to describe their own body weight with response options ranging from very underweight to obese. At 14-year follow-up, participants were asked, “Do you think of yourself as” with response options “very underweight,” “underweight,” “about the right weight,” “overweight,” or “very overweight.” Similarly, at 21- and 30-year follow-ups, the participants were asked, “How would you describe yourself now” with response options same as those at 14-year follow-up. For the purpose of analysis, weight perception was divided into four categories (i.e., underweight, normal, overweight, and obese) to make them compatible with the four accurate (BMI) actual body weight categories.
2.1.5. Weight misclassification
Weight status categories were compared with weight perception categories to identify weight misclassification of participants’ body weight at each phase of the study. Weight misclassification of participants’ body weight was segregated into three categories: not misclassified (correct estimation), under, and overestimation. Estimation of participant’s body weight was considered to be correct when the weight status category matched the weight perception category. When a respondent’s perceived body weight category was lower than his/her actual body weight category it was considered as underestimation. When a respondent’s perceived body weight was higher than his/her actual body weight, it was considered as overestimation of a respondent’s body weight. For example, respondents who were of normal weight but perceived their body weight as underweight, were recorded in the ‘underestimation’ category. Respondents who were of normal weight but perceived of their body weight as overweight, were recorded in the ‘overestimation’ category.
2.2. Predictors
The following predictors that were included in this analysis were considered based on previous scientific literature suggesting they might be predictors of weight misclassification [ 4, 12, 36– 42]. These predictors were organized as follows according to the data collection period:
- 1.
First clinical visit (prepregnancy): Maternal height and weight, maternal education, and parental racial origin, which were collected either from maternal obstetric records or the recruitment questionnaires. Maternal BMI was divided based on BMI standard definition [ 43]; maternal education was categorized into three categories (“incomplete high school,” “complete high school,” and “post high school”) and racial origin of parents (“White,” “Asian,” “Aboriginal Islander”).
- 2.
Birth delivery follow-up: Birth weight was categorized into “low birth weight” or “normal”; whereas head circumference data were divided into three categories (“small,” “normal,” and “large”).
- 3.
Five-year follow-up: Children’s BMI cut-off values were defined according to Cole et al.’s international survey definition for overweight and obesity [ 35]. For the purpose of analysis, BMI was classified into “normal” and “overweight” categories.
- 4.
Fourteen-year follow-up: Frequency of a child going on a diet to lose weight was divided into two categories (“most or a few times a year,” or “rarely/never”). Pubertal development was divided into five stages using Tanner stages [ 44, 45]. For the purpose of analysis, the first two stages were combined into a single category as were the last two stages. Child internalizing (i.e., depression and anxiety) and externalizing (delinquent and aggressive) behaviors were assessed using Achenbach’s Youth Self Report (YSR) [ 46]. After summing up an adolescents’ responses to the above scale, the 90th percentile was used as a cut-off point to determine a “case.” Other factors included in the analysis at this follow up were: time spent viewing television (“<3 h” or “>3 h”); gross family income (participants earned <AU$ 20,799 per annual were recorded as they have an income consistent with poverty). Others were categorized as “higher income.” Leisure physical activity during the last week was categorized as (“0–1 day,” “2–3 days,” “4–5 days,” and “6–7 days”).
2.3. Statistical Analysis
At each follow-up, we compared respondent’s perceived weight with their measured weight to determine the occurrence of their weight misclassification. After compiling all body weight estimations’ results for each respondent at each follow-up, respondents who correctly estimated their body weight were categorized into one of four categories reflecting how often they were correct; i.e., never, one, two, or three follow-ups. Similar analyses were performed for respondents who underestimated as well as overestimated their body weights.
In addition, in bivariate analysis, the Chi-square test ( χ 2) was used to examine respondent’s body weight misclassification with each abovementioned factor. The factors which appeared significant in bivariate analysis ( p < 0.05) were included in the multinomial logistic regression model [ 47]. In this model, we performed a series of analyses for each significant factor with each category of weight misclassification (correct, under, and overestimation) independently, where “never” was the reference group and one and two or three follow-ups were used to determine the predictors of correct, under-, and overestimation. Finally, the factors that remained significant in the unadjusted models were included in the adjusted models and were used in the multivariate model as the potential predictors of the outcome.
All analyses were performed using SAS Version 9.4 (SAS Institute Inc., Cary, NC, USA).
3. RESULTS
Figure 1 shows the participants’ body weight misclassifications pattern from 14- to 30-year follow-ups across different BMI categories. Normal weight participants were more likely to estimate their body weight correctly as compared with other participants (underweight, overweight, and obese) at each follow-up. Underweight participants were more likely to overestimate their body weight as compared with other participants, whereas overweight and obese participants were more likely to underestimate their body weight as compared with their normal or underweight counterparts at each follow-up. For example, among normal weight groups, >60% of participants at 14- and 21-year follow-ups and nearly 90% of participants at 30-year follow-up were able to correctly estimate their body weight at each follow-up. Also, among BMI-based obese groups, >80% at 30- and 21-year follow-ups as well as nearly 70% of participants at 14-year follow-ups underestimated their body weight at each follow-up.
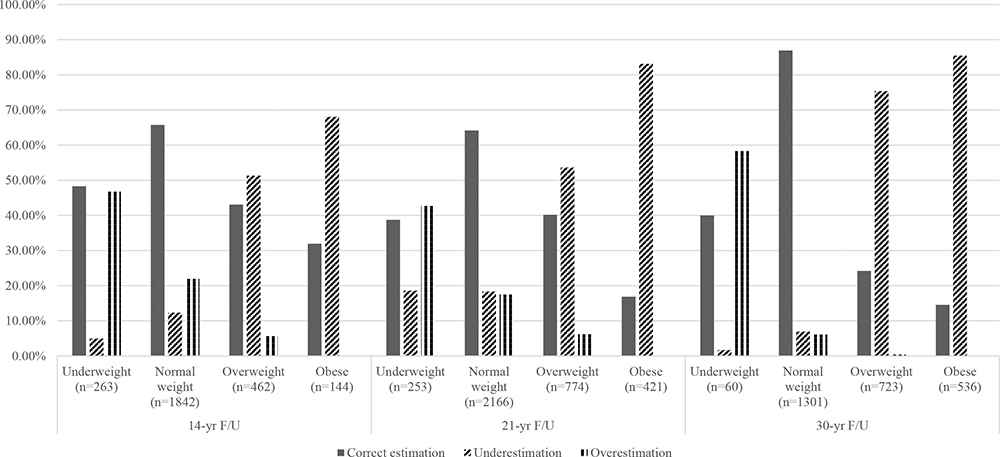
Body weight misclassifications patterns from 14- to 30-year follow-up across different BMI categories.
Table 1 shows the frequency of body weight misclassification categories (correct, under-, and overestimation) among males and females. The percentages of male (45%) and of female (55%) participants appeared to be almost similar at each body weight misclassification category. There were various significant associations between males and females at each misclassification category ( p < 0.0001). More than 45% of males were able to correctly estimate their body weight at one follow-up, whereas more than a quarter of them correctly estimated their body weight at two or three follow-ups. Similar analysis occurred in male’s underestimation category. However, almost 40% of females correctly estimated their body weight at one follow-up, whereas almost a quarter of females were able to do so at two or three follow-ups. Few females were never able to correctly estimate their body weight. More than a third of females had ever underestimated their body weight, whereas only 13% of them had underestimated their body weight at two or three follow-ups. In overestimation analysis, the vast majority of males and females never overestimated their body weight at each follow-up, but almost 30% of females appeared to overestimate their body weight at one follow-up.
| Number of weight misclassification’s times | Correct estimation * | Underestimation * | Overestimation * | |||
|---|---|---|---|---|---|---|
|
|
|
|
||||
| Male (%) | Female (%) | Male (%) | Female (%) | Male (%) | Female (%) | |
| Never | 24.41 | 19.10 | 30.51 | 53.95 | 84.69 | 63.71 |
| One F/U | 45.80 | 41.13 | 45.14 | 32.96 | 14.03 | 29.09 |
| Two or three F/U | 29.79 | 39.77 | 24.35 | 13.09 | 1.28 | 7.20 |
| Total | 1262 | 1471 | 1265 | 1520 | 1326 | 1612 |
p < 0.0001.
F/U, follow-up.
Frequency of male and female body weight misclassifications at two or three consecutive follow-ups (14-, 21-, and 30-year follow-ups)
In multivariate analysis, Tables 2– 4 show the predictors of body weight correct, under-, and overestimation at one follow-up and at two or three follow-ups for each body weight misclassification category accordingly. As compared with males, females were found to be more likely to correctly estimate their body weight at two or three follow-ups [aOR 1.73 (95% CI: 1.27, 2.38)] and they were also observed to be more likely to overestimate their body weight at one [aOR 2.60 (95% CI: 2.10, 3.21)] and at two or three follow-ups [aOR 6.14 (95% CI: 3.60, 10.47)]. However, females were found to be less likely to underestimate their body weight at one and at two or three follow-ups as compared with their males counterparts. Overweight children at 5-year follow-up were found more likely to underestimate their body weight at two or three follow-ups [aOR 2.65 (95% CI: 1.78, 3.95)] as compared with their normal weight counterparts. Also, in correct estimation analysis, overweight children were less likely to correctly estimated their body weight at two or three follow-ups [aOR 0.34 (95% CI: 0.22, 0.51)] as compared with other children. In overestimation analyses, going on a diet to lose weight was more characteristic of those who overestimated their body weight at two or three follow-ups [aOR 2.24 (95% CI: 1.46, 3.45)] as compared with those who never or rarely went on a diet to lose weight. Other significant predictors such as maternal BMI, race, and YSR externalizing behaviors do not appear significant in all body weight misclassification categories. For example, participants who came from an Asian background were more likely to overestimate their body weight at follow-ups [aOR 2.77 (95% CI: 1.37, 5.26)] as compared with their White race counterparts. Also, participants with overweight mothers are more likely to underestimate their own body weight at two or three follow-ups [aOR 2.35 (95% CI: 1.57, 3.53)] as compared with those who have underweight and normal weight mothers. However, maternal BMI does not appear to be a significant predictor in overestimation analysis.
| Predictors | N | Never | Correct estimation | |||
|---|---|---|---|---|---|---|
|
|
||||||
| One F/U | Two or three F/U | |||||
|
|
|
|||||
| Unadjusted OR | Adjusted OR † | Unadjusted OR | Adjusted OR † | |||
| Gender ** (birth F/U) | 1 | |||||
| Male | 1262 | 1 | 1 | 1 | 1 | 1 |
| Female | 1471 | 1 | 1.15 (0.94, 1.40) | 1.12 (0.83, 1.52) | 1.71 (1.39, 2.10) | 1.73 (1.27, 2.38) |
| BMI ** (5-year F/U) | ||||||
| Normal | 1612 | 1 | 1 | 1 | 1 | 1 |
| Overweight | 359 | 1 | 0.55 (0.42, 0.72) | 0.66 (0.47, 0.94) | 0.32 (0.23, 0.43) | 0.34 (0.22, 0.51) |
| Go on diet * (14-year F/U) | ||||||
| Never or rarely | 1798 | 1 | 1 | 1 | 1 | 1 |
| Most of the time/a few times a year | 351 | 1 | 0.71 (0.54, 0.94) | 0.76 (0.51, 1.12) | 0.43 (0.32, 0.59) | 0.56 (0.37, 0.86) |
| Maternal BMI ** (prepregnancy F/U) | ||||||
| Normal | 1820 | 1 | 1 | 1 | 1 | 1 |
| Underweight | 332 | 1 | 0.93 (0.67, 1.28) | 0.66 (0.42, 1.04) | 1.14 (0.82, 1.57) | 1.00 (0.64, 1.56) |
| Overweight | 417 | 1 | 0.70 (0.54, 0.91) | 0.53 (0.37, 0.77) | 0.51 (0.38, 0.68) | 0.47 (0.32, 0.71) |
Adjusted for the other variables in this table.
p < 0.05.
p < 0.0001.
F/U, follow-up; BMI, body mass index; OR, odds ratios.
Odds ratios and 95% confidence interval of persistent body weight correct estimation at one follow-up and two or three follow-ups ( N = 2733)
| Predictors | N | Never | Underestimation | |||
|---|---|---|---|---|---|---|
|
|
||||||
| One F/U | Two or three F/U | |||||
|
|
|
|||||
| Unadjusted OR | Adjusted OR † | Unadjusted OR | Adjusted OR † | |||
| Gender ** (birth F/U) | 1 | |||||
| Male | 1265 | 1 | 1 | 1 | 1 | 1 |
| Female | 1520 | 1 | 0.41 (0.35, 0.49) | 0.43 (0.34, 0.55) | 0.30 (0.25, 0.38) | 0.27 (0.19, 0.38) |
| BMI ** (5-year F/U) | ||||||
| Normal | 1683 | 1 | 1 | 1 | 1 | 1 |
| Overweight | 341 | 1 | 1.15 (0.87, 1.51) | 1.18 (0.83, 1.68) | 2.56 (1.90, 3.45) | 2.65 (1.78, 3.95) |
| Go on diet * (14-year F/U) | ||||||
| Never or rarely | 1879 | 1 | 1 | 1 | 1 | 1 |
| Most of the time/a few times a year | 323 | 1 | 1.15 (0.88, 1.51) | 1.45 (1.02, 2.08) | 1.53 (1.12, 2.11) | 1.52 (0.92, 2.43) |
| YSR externalizing * (14-year F/U) | ||||||
| Normal | 2505 | 1 | 1 | 1 | 1 | 1 |
| Cases | 215 | 1 | 1.37 (1.00, 1.89) | 1.27 (0.82, 1.97) | 1.79 (1.24, 2.59) | 1.80 (1.06, 3.05) |
| Maternal BMI ** (prepregnancy F/U) | ||||||
| Normal | 1878 | 1 | 1 | 1 | 1 | 1 |
| Underweight | 342 | 1 | 1.01 (0.79, 1.30) | 0.92 (0.65, 1.30) | 0.77 (0.54, 1.09) | 0.98 (0.61, 1.60) |
| Overweight | 401 | 1 | 1.49 (1.16, 1.91) | 1.29 (0.91, 1.82) | 1.96 (1.47, 2.61) | 2.35 (1.57, 3.53) |
Adjusted for the other variables in this table.
p < 0.05.
p < 0.0001.
F/U, follow-up; BMI, body mass index; OR, odds ratios.
Odds ratios and 95% confidence interval of persistent body weight underestimation at one and two or three follow-ups ( N = 2785)
| Predictors | N | Never | Overestimation | |||
|---|---|---|---|---|---|---|
|
|
||||||
| One F/U | Two or three F/U | |||||
|
|
|
|||||
| Unadjusted OR | Adjusted OR † | Unadjusted OR | Adjusted OR † | |||
| Gender ** (birth F/U) | 1 | |||||
| Male | 1326 | 1 | 1 | 1 | 1 | 1 |
| Female | 1612 | 1 | 2.76 (2.28, 3.33) | 2.60 (2.10, 3.21) | 7.06 (4.45, 12.50) | 6.14 (3.60, 10.47) |
| Race * (prepregnancy F/U) | ||||||
| White | 2657 | 1 | 1 | 1 | 1 | 1 |
| Asian | 105 | 1 | 1.06 (0.66, 1.71) | 0.97 (0.56, 1.66) | 2.62 (1.35, 5.09) | 2.77 (1.37, 5.26) |
| Aboriginal-Islander | 96 | 1 | 1.06 (0.66, 1.71) | 1.04 (0.60, 1.83) | 0.48 (0.12, 1.97) | 0.31 (0.04, 2.32) |
| TV watching * (14-year F/U) | ||||||
| <3 h | 1042 | 1 | 1 | 1 | 1 | 1 |
| >3 h | 1812 | 1 | 0.92 (0.77, 1.11) | 1.03 (0.84, 1.26) | 0.58 (0.41, 0.83) | 0.73 (0.50, 1.06) |
| Go on diet ** (14-year F/U) | ||||||
| Never or rarely | 1984 | 1 | 1 | 1 | 1 | 1 |
| Most of the time/a few times a year | 370 | 1 | 1.77 (1.38, 2.26) | 1.36 (1.04, 1.78) | 3.34 (2.24, 4.98) | 2.24 (1.46, 3.45) |
| YSR internalizing * (14-year F/U) | ||||||
| Normal | 2583 | 1 | 1 | 1 | 1 | 1 |
| Cases | 289 | 1 | 1.48 (1.12, 1.95) | 1.26 (0.92, 1.73) | 1.71 (1.03, 2.84) | 1.12 (0.64, 1.98) |
Adjusted for the other variables in this table.
p < 0.05.
p < 0.0001.
F/U, follow-up; OR, odds ratios.
Odds ratios and 95% confidence interval of persistent body weight overestimation at one and two or three follow-ups ( N = 2938)
Overall, factors such as being overweight, following a diet to lose weight, having an overweight mother, and having externalizing behaviors were predictors for a higher likelihood to persistently misclassify body weight (two or three follow-ups) independently.
Additional supplementary analyses of weight misclassifications are presented in supplementary Tables S1 and S2 to quantify the mean difference of BMI between correction estimation and misclassifications. Except for the obese group, most of those who misclassified their body weight have a mean BMI that deviates up to 1.68 mean BMI unit from the mean BMI of correct estimation. However, at 21 and 30 years, this difference is substantial for those who were obese but underestimated their weight.
4. DISCUSSION
The results of this Australian longitudinal study have described body weight misclassification patterns from adolescence to young adulthood and investigated predictors of body weight misclassification at one follow-up point or persistent body weight misclassification (at two or three follow-ups points). Correct body weight estimation appeared consistently higher among normal weight participants at each follow-up as compared with their underweight and overweight counterparts. Also, at each follow-up, underweight participants are more likely to overestimate their body weight as compared with other subjects whereas overweight and obese participants are more likely to underestimate their body weight as compared with other subjects. These results are consistent with those of other studies that have investigated the adolescent’s body weight misclassification [ 2, 38, 48] and the adult’s body weight misclassification [ 5, 6].
Male and female body weight misclassification patterns from adolescent to adulthood appear to be different. In correct estimation analysis, 60% of females persistently estimated their body weight correctly whereas, in underestimation analysis, more than 40% of males persistently underestimated their body weight (at two or three follow-ups). Also, in overestimation analysis, the vast majority of males and females have never overestimated their body weight, but more than a third of females overestimated their body weight at one follow up (at adolescent or at one of the young adulthood follow-ups).
Several early-life and cross-sectional predictors were significant with the body weight misclassification at one follow-up or persistent weight misclassification (at two or three follow-ups). As compared with males, in misclassification and persistent misclassification analysis, females are less likely to underestimate their body weight and more likely to overestimate their body weight at one or at two or three follow-ups. Several studies among adolescent and adults reported different patterns of misclassification among females and males. Whereas some studies reported that overestimation is common in females and underestimation is common in males [ 1, 3, 12, 48, 49], others disagree [ 2, 50].
Overweight and obesity are reported to be consistently associated with body weight misclassification. In our findings, overweight is also longitudinally associated with persistent body weight misclassifications; 5-year-old overweight children are more likely to persistently underestimate their body weight as compared with their normal weight counterparts. Similarly, participants with overweight mothers are more likely to persistently underestimate their own body weight as compared with their counterparts who have normal weight mothers.
It is known that racial differences exist for body weight misclassifications [ 37, 51]. This research shows that Asian participants were more than two times more likely to persistently overestimate their body weight as compared with their White participants, which is consistent with other similar studies that show that Asians, particularly females, tend to overestimate their body weight [ 52], even when compared with other racial groups [ 6].
Media may play an important role in promoting thin body image stereotypes and this has been suggested to be associated with ideal body image and body weight misclassification [ 53, 54]. In this study findings, watching TV, which is part of media, was not significantly associated with body weight misclassification in adjusted analysis. Accessibility and variability of media are much feasible nowadays as compared with the study time when TV watching variable was reported at 14-year follow-up in mid-1990s. Several factors that may accompany TV watching and might significantly influence TV watching findings were not included in this study; for example, what are the types of advertisements (body image) the participants had viewed during TV watching and whether TV watching replaced the participant’s physical activity?
It has been suggested that depression and anxiety are associated with body weight misclassification [ 15, 27]. This study found that depression and anxiety are not associated with persistent body weight overestimation after adjustment analysis. However, aggressive and delinquent behaviors were found to be significantly associated with persistent body weight underestimation on adjusted level. Some studies have reported that aggressive behaviors were found to be associated with obesity [ 55], which is associated with body weight underestimation [ 38].
The bulk of research in the area of weight misclassification concentrates mainly on the adolescent period and are based on cross-sectional analyses. This longitudinal research involves a large representative sample and followed adolescents till their young adulthood to clarify the weight misclassification trend across different BMI categories, considering longitudinal predictor of weight misclassification during early life and adolescence. Another advantage of this research is the application of a similar method of measurement on the same participants during adolescence and the adulthood. This is important as weight perception is subjective judgment, and such a judgment may change over the life course. Also, measuring predictors of weight misclassification over a specific measurement of weight misclassification would give a strength to predictor analysis credibility.
Limitations of this study include the effect of missing data on 14-, 21-, and 30-year follow-ups on study analysis, which could affect the magnitude of our analysis results. In general, participants who did not appear for most follow-ups were more likely to have a low birth weight, mothers with poor education, low family income at delivery, poor mental health of mothers, and their mothers smoked during pregnancy [ 33, 34]. However, several previous MUSP study papers show that the impact of missing data do not significantly alter the findings, even after adjusting using multiple imputation and inverse probability weighting [ 33, 34, 56]. Our study findings did not significantly change when multiple imputation analyses were performed. The second limitation is that we use one question to measure weight misclassification at each follow-up. Using more than one question with different formats (e.g., sketch or figure description) might be helpful to measure how participants perceive their weight depending on the method of measurement. Finally, for the purpose of analysis, at 21- and 30-year follow-up, we used self-reported weight and height that might affect the precision of weight misclassification measurement.
This research identifies body weight misclassification categories based on body weight perception and BMI values. Arguably, BMI cut-off values are less precise than body fat measurement to define body weight misclassification categories. Several researches show that BMI is not always a precise indicator for adiposity, especially among individuals whose BMI values are around the cut-off values as compared with those that are around the midpoint of their BMI category [ 57– 60]. In this paper, our additional analyses ( Tables S1 and S2) showed that most of those who perceived themselves normal or just overweight but were misclassified using the observed BMI, their mean BMI were not substantially different from the correct estimation group. However, these differences were substantial (3.79 BMI unit at 21-year follow-up and 6.82 BMI unit at 30-year follow-up) for those who were obese but underestimated their body weight. This result suggests that using WHO BMI cut-off may not be the best way to define misclassification, especially those who are underweight or overweight based on their measured BMI. Further research is needed to identify weight misclassification based on weight perception and body fat composition, and determine the predictors of that misclassification.
This study findings indicate that weight misclassifications appear to be persistent from adolescence to adulthood, which might imply a significant effect on weight control management. Recognition of body weight might be helpful to adopt a healthy lifestyle and healthy weight control management programs [ 1, 16, 50]. Also, this study indicates that some early life factors (e.g., children overweight) might have an effect on enhanced weight misclassification development during the later stage of life course.
Overall, females were more likely to correctly estimate and overestimate their body weight as compared with males, whereas males appeared to be more likely to underestimate their body weight as compared with their female counterparts. A significant percent of males and females are more likely to misclassify their body weights persistently. Being overweight during early childhood period, having poor mental health, and having an overweight mother were found to be the most significant predictors of persistent weight misclassification to adulthood. Further research is needed to examine the extent of weight misclassification during a life course and evaluate harm and benefit of addressing weight misclassification during early life stage.
SUPPLEMENTARY TABLES
| BMI/weight misclassification | Male | Female | ||||
|---|---|---|---|---|---|---|
|
|
|
|||||
| N | Mean (SD) | Mean difference * (95% CI) | N | Mean (SD) | Mean difference * (95% CI) | |
| Underweight | ||||||
| Correct estimation | 76 | 15.8 (0.54) | 0 | 64 | 15.87 (0.53) | 0 |
| Overestimation | 75 | 15.6 (0.81) | −0.20 (−0.42, 0.02) | 48 | 15.81 (0.78) | −0.06 (−0.30, 0.19) |
| Normal weight | ||||||
| Correct estimation | 693 | 19.16 (1.44) | 0 | 518 | 19.39 (1.55) | 0 |
| Underestimation | 142 | 18.14 (1.21) | −1.02 (−1.28, −0.77) | 85 | 18.29 (1.47) | −1.10 (−1.46, −0.75) |
| Overestimation | 124 | 20.84 (1.46) | 1.68 (1.40, 1.96) | 280 | 20.97 (1.57) | 1.58 (1.35, 1.80) |
| Overweight | ||||||
| Correct estimation | 84 | 23.88 (1.04) | 0 | 115 | 24.76 (1.37) | 0 |
| Underestimation | 141 | 24.78 (1.53) | 0.90 (0.53, 1.27) | 96 | 25.83 (1.49) | 1.08 (0.69, 1.46) |
| Overestimation | 4 | 23.90 (0.86) | 0.02 (−1.03, 1.07) | 22 | 24.57 (0.67) | −0.19 (−0.79, 0.40) |
| Obese | ||||||
| Correct estimation | 12 | 30.88 (2.64) | 0 | 34 | 32.51 (2.96) | 0 |
| Underestimation | 55 | 29.52 (2.0) | −1.36 (−2.71, 0) | 43 | 30.64 (2.47) | −1.87 (−3.10, –0.63) |
Mean difference: Mean BMI values of misclassified group compared with mean BMI values of correct estimation group.
BMI, body mass index; SD, standard deviation; CI, confidence interval.
Mean, standard deviation, and mean difference of males and females BMI groups across body weight misclassification categories at 14-year follow-up
| BMI/weight misclassification | 21-year F/U | 30-year F/U | ||||
|---|---|---|---|---|---|---|
|
|
|
|||||
| N | Mean (SD) | Mean difference * (95% CI) | N | Mean (SD) | Mean difference * (95% CI) | |
| Underweight | ||||||
| Correct estimation | 145 | 17.44 (0.77) | 0 | 25 | 17.92 (0.44) | 0 |
| Overestimation | 108 | 17.52 (0.79) | 0.08 (−0.12, 0.27) | 35 | 16.71 (1.94) | −1.22 (−0.20, −0.42) |
| Normal weight | ||||||
| Correct estimation | 1391 | 21.87 (1.66) | 0 | 897 | 22.31 (1.66) | 0 |
| Underestimation | 397 | 20.70 (1.50) | −1.17 (−1.35, −0.98) | 72 | 20.78 (1.50) | −1.53 (−1.92, −1.13) |
| Overestimation | 380 | 22.82 (1.52) | 0.95 (0.77, 1.14) | 64 | 23.70 (1.04) | 1.40 (0.98, 1.81) |
| Overweight | ||||||
| Correct estimation | 313 | 26.84 (1.35) | 0 | 178 | 26.58 (1.01) | 0 |
| Underestimation | 415 | 27.30 (1.45) | 0.46 (0.25, 0.67) | 545 | 27.36 (1.45) | 0.78 (0.55, 1.01) |
| Overestimation | 48 | 26.44 (0.74) | −0.39 (−0.78, 0) | 3 | 27.30 (1.49) | 0.72 (−0.45, 1.89) |
| Obese | ||||||
| Correct estimation | 72 | 37.75 (8.04) | 0 | 77 | 41.66 (5.64) | 0 |
| Underestimation | 350 | 33.95 (3.95) | −3.79 (−5.04, −0.55) | 458 | 34.84 (7.63) | −6.82 (−8.60, −5.03) |
Mean difference: Mean BMI values of misclassified group compared with mean BMI values of correct estimation group.
BMI, body mass index; F/U, follow-up; CI, confidence interval.
Mean, standard deviation, and mean difference of BMI groups across body weight misclassification categories at 21- and 30-year follow-ups
CONFLICTS OF INTEREST
None of the authors declared any conflicts of interest.
AUTHOR CONTRIBUTIONS
AA and AAM conceive the idea. AA performed analyses and drafted the manuscript. JN designed the study. AAM and JN guided to explain the results. All authors critically edited, the manuscript.
ACKNOWLEDGMENTS
The MUSP has been funded by the National Health and Medical Research Council and Australian Research Council (NHMRC). We thank all participants who shared their data in this study, and a special thanks to Greg Shuttlewood who provided us with the required data. The views expressed in the paper are those of the authors and none of the funding resources played any part in the conception or preparation of the manuscript.
REFERENCES
Cite this article
TY  - JOUR
AU  - Abdulaziz Dakhel Aloufi
AU  - Jake Moses Najman
AU  - Abdullah Al Mamun
PY  - 2019
DA  - 2019/06/01
TI  - Predictors of Persistent Body Weight Misclassification from Adolescence Period to Adulthood: A Longitudinal Study
JO  - Journal of Epidemiology and Global Health
SP  - 116
EP  - 124
VL  - 9
IS  - 2
SN  - 2210-6014
UR  - https://doi.org/10.2991/jegh.k.190518.002
DO  - 10.2991/jegh.k.190518.002
ID  - Aloufi2019
ER  -