
Prevalence of Glaucoma in Patients with Obstructive Sleep Apnea
- DOI
- 10.2991/jegh.k.190816.001How to use a DOI?
- Keywords
- Glaucoma; sleep; sleep-disordered breathing; intraocular pressure
- Abstract
To determine the prevalence of glaucoma in obstructive sleep apnea (OSA) patients and compare it with that of patients without OSA. Patients investigated for OSA using polysomnography at the sleep center of King Abdulaziz University Hospital were invited to participate in this cross-sectional case series study. American Academy of Sleep Medicine guidelines were used to diagnose OSA. Recruitment of patients with and without OSA was conducted from December 2013 to September 2015. Exclusion criteria included topical and systemic steroid use and presence of other ocular diseases. Two criteria, cup/disc ratio and visual field defects, were necessary for a glaucoma diagnosis. Among 84 adults enrolled, 44 (52%) had a confirmed diagnosis of OSA. Glaucoma prevalence was higher among individuals with OSA (16%) than among non-OSA individuals (8%), a difference that was not statistically significant. A consistent trend, which was not statistically significant after adjusting for cofounders, toward more glaucomatous changes was observed in OSA subjects. Although a trend toward higher glaucoma prevalence was observed in OSA patients, the difference was not statistically significant. As many variables contribute to the development of the two conditions, larger cohorts are needed to evaluate associations between glaucoma and OSA.
- Copyright
- © 2019 Atlantis Press International B.V.
- Open Access
- This is an open access article distributed under the CC BY-NC 4.0 license (http://creativecommons.org/licenses/by-nc/4.0/).
1. INTRODUCTION
Glaucoma is a common and serious progressive disease of the optic nerve. It is characterized by optic neuropathy that develops due to the progressive degeneration of retinal ganglion cells and their axons, leading to unique visual field defects and increased cupping of the optic disc [1]. Primary Open Angle Glaucoma (POAG) is estimated to be responsible for 50% of glaucoma cases [2].
When left unnoticed and untreated, glaucoma can lead to blindness as the changes are irreversible. According to World Health Organization analysis, glaucoma is the second leading cause of blindness worldwide and is responsible for 12.3% of cases [3]. Globally, approximately 60 million people are diagnosed with glaucomatous optic neuropathy, and an estimated 8.4 million people are blind because of glaucoma. These numbers are predicted to increase to 80 and 11.2 million, respectively, by 2020. Therefore, screening may be pertinent to aid early detection. However, screening the general population may not be cost-effective. Hence, identifying at-risk groups to guide screening efforts for early detection may be worthwhile. Factors associated with glaucoma include elevated Intraocular Pressure (IOP), low perfusion pressure to the optic disc due to fluctuating systemic blood pressure, advanced age, a thin central cornea, racial background, and a positive family history [4]. Glaucoma can still occur in the absence of elevated IOP, which is known as Normal Tension Glaucoma (NTG) [5]. Associations among diabetes mellitus, hypertension, ischemic vascular disorders, and glaucoma remain unclear [6]. Gender is not a known risk factor for glaucoma [7].
One area of recent interest is the association between sleep apnea and glaucoma in adults. Obstructive Sleep Apnea (OSA), OSA syndrome (OSAS), which affects 3–7% of men and 2–5% of women, is characterized by recurrent episodes of upper airway collapse, resulting in frequent arousal during sleep and hypoxemia [8]. An association between POAG and sleep apnea has recently been proposed [9]. Researchers are still debating whether OSA increases the risk of developing glaucoma or has a direct causative effect. The pathophysiological mechanism underlying the development of glaucoma supports the hypothesis that OSA may have a role in the development or progression of the disease. A link between the two disorders has been postulated to be due to the effect of hypoxia and impaired autoregulation of optic nerve perfusion in OSA [10]. A mechanical hypothesis linking increased IOP to the supine position during sleep and obesity has also been proposed [11].
In our study, we aim to determine the prevalence of glaucoma among individuals with OSA and to compare it with that of individuals without OSA. In addition, we explore the association between OSA and glaucoma before and after adjusting for potential confounders among an adult population in a tertiary center in Saudi Arabia.
2. MATERIALS AND METHODS
2.1. Study Design, Participants, and Ethics
Obstructive sleep apnea is defined according to the most recent American Academy of Sleep Medicine (AASM) recommendations (2014), i.e., A – an apnea/hypopnea index (AHI) of ≥15 determined by polysomnography (PSG) or B – an AHI of ≥5 but <15 events, in addition to one of the following: (1) daytime sleepiness, non-restorative sleep, fatigue or insomnia symptoms; (2) incidences of waking up with gasping or choking sensations; (3) reported snoring, breathing interruptions or both during sleep; or (4) a known history of hypertension, mood or cognitive dysfunction, coronary artery disease, stroke, congestive heart failure, atrial fibrillation, or diabetes mellitus. AHI was also used to determine the severity of OSA, as follows: mild (5–15), moderate (15–30), and severe (>30) [12].
Our target population was patients who were referred to the Sleep Medicine and Research Center at King Abdulaziz University (KAU) Hospital in Jeddah, Saudi Arabia. All patients underwent PSG at the center. The exclusion criteria were the use of topical and systemic steroids, having a narrow angle of the anterior chamber, or having other ocular inflammatory diseases, cataracts, diabetic retinopathy, or keratoconus. At the time of testing, patients were not using home continuous positive airway pressure therapy or another treatment for OSAS.
Accordingly, 100 subjects diagnosed with OSA were eligible for recruitment, but only 44 agreed to participate (OSA group). Of the 110 subjects who underwent PSG and were free from OSA, 39 agreed to be enrolled and met our criteria (OSA-free group). Recruitment was conducted from December 2013 to September 2015. Informed consent was obtained from all participants and approval was granted by the Ethical Committee at KAU Hospital.
2.2. Data Collection
Sociodemographic characteristics and medical histories were collected from all patients (A flowchart is provided in Figure 1). In the first visit, we measured the best-corrected visual acuity, IOP by applanation tonometry, and cup/disc (CD) ratio by directly visualizing the fundus with the help of a 78D lens in all subjects. Patients whose CD ratio was >0.3 vertically, with rim thinning, notching, or asymmetrical between C/D ratio >0.2 mm between both eyes, with or without increased IOP, were scheduled for a second visit for a visual field assessment by Humphrey 750 Visual field machine (Ophthalmology Clinic at King Abdulaziz University) using SITA-STANDARD 24-2 program.
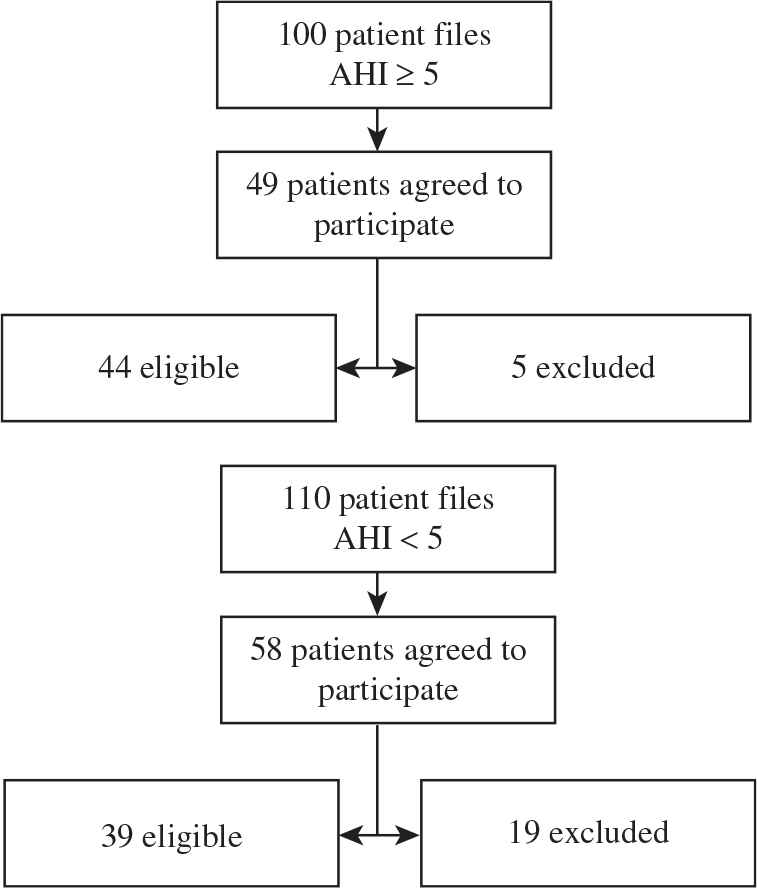
Method used to recruit patients with OSA and control subjects. Forty-nine patients with OSAS agreed to participate, five of whom were excluded. In the OSA-free group, 58 patients agreed to participate, 19 of whom were excluded.
In the second visit, optical coherence tomography (OCT) of the optic nerve were used to accurately measure the optic nerve head and nerve fiber layer thickness (Cirrus HD-OCT 500, Carl Zeiss Meditec, Inc.). Pachymetry was performed to measure the central corneal thickness and to exclude a false high IOP (Figure 2). A participant was diagnosed with glaucoma when both an increased CD ratio (>0.3) with vertical cupping or asymmetry in C/D ratio between both eyes >0.2 mm, thinning superior/inferior nerve fiber layer by OCT, and characteristic glaucomatous visual field changes were present such as: paracentral scotoma, nasal step, and arcuate scotoma [1].
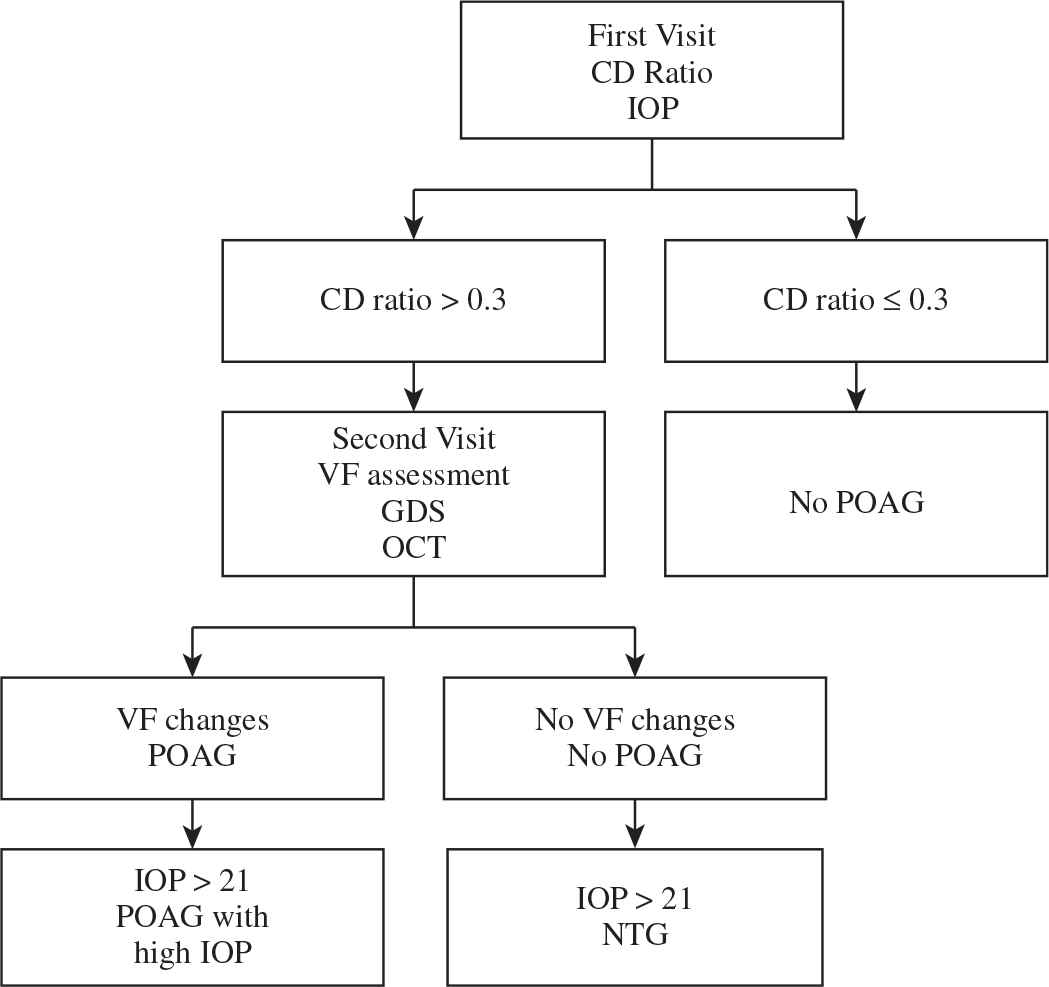
Methods used to screen POAG. IOP: intraocular pressure; CD ratio: cup to disc ratio; VF: visual field; GDS: glaucoma diagnosis scan; OCT: optical coherence tomography; CCT: central corneal thickness; POAG: primary open angle glaucoma; NTG: normal tension glaucoma.
2.3. Variables
2.3.1. Outcome variables
Intraocular pressure in the right (OD) and left (OS) eye, and the CD ratios in the right and left eye were all used as continuous variables in the analysis. Increased ratio was defined as >0.3 vertically in at least one eye. Visual field defects, characteristic of glaucoma, were assessed and reported by a single Glaucoma Specialist expert after looking at variables like mean deviation, pattern deviation, and pattern standard deviation (SD).
2.3.2. Main independent variables
Obstructive sleep apnea was diagnosed based on a level I overnight PSG using the AASM guidelines [12]. OSA was a dichotomous variable (0 = no, 1 = yes).
2.3.3. Co-variables
A group of variables were considered as potential confounders in the association between OSA and POAG. These factors were: sex (0 = male, 1 = female), age (continuous in years), body mass index (BMI; continuous in kg/m2), a diagnosis of diabetes (0 = no, 1 = yes) or hypertension (0 = no, 1 = yes), a family history of glaucoma (0 = no, 1 = yes), and smoking status (0 = non-smoker, 1 = smoker).
2.4. Data Analysis
A descriptive overview of the baseline characteristics of the study population is presented. The means and standard deviations for continuous variables and numbers with column percentages for categorical variables were analyzed. Chi-square and independent sample t-tests assuming equal or unequal variances were used as appropriate to assess how the outcome variables differed between the OSA and OSA-free groups. The normality and variance of all the continuous ocular measurement variables were assessed using q–q plots and Levene’s test of the equality of the variances. However, the t-test is considered a robust test even when the normality assumption is violated. We performed unadjusted and adjusted linear and logistic regression models to assess the association between OSA and glaucoma. Coefficients (for linear regression) and odds ratios (ORs; for logistic regression) with 95% confidence intervals (CIs) are presented. The significance level of the analysis was set at 0.05. All statistical analyses were performed with STATA version 13 (StataCorp, College Station, TX, USA).
3. RESULTS
The study sample consisted of 84 adults, 44 (52%) of whom had a confirmed diagnosis of OSA: eight had mild, 12 had moderate, and 25 had severe OSA. The OSA-free group consisted of 39 individuals. About 65% of the participants were male. The mean age was 44 years (SD 14.8; range 19–76), and the mean BMI was 34 kg/m2. Demographic characteristics and relevant medical histories of the participants are presented in Table 1. Mean age, BMI, and the prevalence of diabetes and hypertension were significantly higher among the OSA group than among the OSA-free group (p < 0.05). The respiratory parameters obtained from PSG, including AHI, minimum O2 saturation, mean O2 saturation, and percentage of sleep time with O2 saturation <90%, are also presented in Table 1.
| Variables | OSAS | p-value | |
|---|---|---|---|
| No | Yes | ||
| n = 39 | n = 45 | ||
| Age in years (mean ± SD) | 35.4 ± 13 | 51.6 ± 12 | <0.001 |
| Sex, n (%) | |||
| Male | 21 (54) | 34 (76) | 0.037 |
| Female | 18 (46) | 11 (24) | |
| BMI in kg/m2 (mean ± SD) | 30.1 ± 9 | 37.4 ± 9 | <0.001 |
| Smoking status, n (%) | |||
| Non- or ex-smoker | 30 (79) | 38 (84) | 0.517 |
| Smoker | 8 (21) | 7 (16) | |
| Diabetes, n (%) | |||
| No | 32 (82) | 25 (56) | 0.010 |
| Yes | 7 (18) | 20 (44) | |
| Hypertension, n (%) | |||
| No | 29 (74) | 13 (29) | <0.001 |
| Yes | 10 (26) | 32 (71) | |
| Family history of glaucoma, n (%) | |||
| No | 32 (82) | 41 (91) | 0.220 |
| Yes | 7 (18) | 4 (9) | |
| AHI (mean ± SD) | 2.3 ± 1.7 | 36.2 ± 21.5 | <0.001 |
| Minimum O2 saturation (mean ± SD) | 88.2 ± 8.7 | 74.7 ± 13.6 | <0.001 |
| Mean O2 saturation (mean ± SD) | 95.6 ± 2.2 | 90.2 ± 7.8 | <0.001 |
| % Sleep time with O2 saturation <90% (mean ± SD) | 1.7 ± 6.8 | 33.3 ± 37.3 | <0.001 |
| Epworth sleepiness scale score (mean ± SD) | 11.1 ± 6.2 | 11.9 ± 5.1 | 0.528 |
Characteristics of the study population
In Table 2, we present a comparison of the relevant eye examination parameters between participants with OSA and participants without OSA. Individuals with OSA had a significantly higher IOP in the left eye (p < 0.05) and a p-value close to significance for the IOP level in right eye (p = 0.051). The mean CD ratios among subjects with OSA were similar to the ratios of participants without OSA: 0.24 vs. 0.25 in the right eye and 0.25 vs. 0.24 in the left eye, and the p-values were not statistically significant. As shown in Table 2, a greater proportion of individuals with OSA were diagnosed with glaucoma (16%) than of participants without OSA (8%). However, the difference was not statistically significant.
| Variables | OSAS | p-value | |
|---|---|---|---|
| No | Yes | ||
| n = 39 | n = 45 | ||
| IOP of the OD (mean ± SD) | 13 ± 3.7 | 14.5 ± 3.4 | 0.052 |
| IOP of the OS (mean ± SD) | 13.1 ± 3.3 | 14.8 ± 3.3 | 0.023 |
| CD ratio of the OD (mean ± SD) | 0.25 ± 0.15 | 0.24 ± 0.20 | 0.892 |
| CD ratio of the OS (mean ± SD) | 0.24 ± 0.13 | 0.25 ± 0.22 | 0.760 |
| Cupping >0.3 in either eye, n (%) | 7 (18) | 8 (18) | 0.984 |
| Glaucoma diagnosis, n (%) | 3 (8) | 7 (16) | 0.267 |
Comparison of glaucoma diagnosis and eye parameters in individuals with and without OSAS. Continuous variables are presented as means with standard deviations, whereas categorical variables are presented as n and column percentages
Regarding IOP, only one patient was found to have ocular hypertension (>21 mmHg) in the OSA group and none of the patients in the control group had elevated IOP. The eye parameters of the group of participants with severe OSA (AHI > 30) were an IOP of 14.8 for the OD, an IOP of 15.1 for the OS, a CD ratio of 0.26 for the OD, and a CD ratio of 0.27 for the OS. A comparison of these parameters with that measured in individuals without OSA (not presented in a table) shows a similar trend as the findings presented in Table 2. The only significant difference was observed for IOP of the OS (p = 0.033).
In Table 3, we present the findings of unadjusted and adjusted regression models assessing the association between glaucoma, eye exam parameters, and OSA. Each outcome is regressed individually, first with regard to the OSA status without adjusting for confounders and then after controlling for age, sex, BMI, smoking, diabetes, hypertension, and a family history of glaucoma. ORs associated with having a diagnosis of glaucoma for OSA patients compared with OSA-free individuals were 2.21 (crude OR) and 1.71 (adjusted OR), which were not statistically significant. The only significant coefficient from the linear regression models was the IOP for OS (p < 0.05) in which individuals with OSA had a significant increase in their IOP, although the difference was not statistically significant after adjusting for confounders.
| Continuous outcomes | OSAS | |||
| n = 84 | ||||
| Unadjusted coeff. (95% CI) | Adjusted coeff.# (95% CI) | |||
| IOP of the OD | 1.51 (−0.02 to 3.04) | 0.84 (−1.2 to 2.9) | ||
| IOP of the OS | 1.68* (0.23 to 3.12) | 1.08 (−0.91 to 3.07) | ||
| CD ratio of the OD | −0.005 (−0.08 to 0.07) | −0.06 (−0.16 to 0.05) | ||
| CD ratio of the OS | 0.01 (−0.07 to 0.09) | −0.03 (−0.15 to 0.08) | ||
| Categorical outcomes | Unadjusted OR (95% CI) | Adjusted OR# (95% CI) | ||
| Cupping | OSA | No | 1.00 | 1.00 |
| Yes | 0.99 (0.32–3.03) | 0.72 (0.15–3.35) | ||
| Glaucoma | OSA | No | 1.00 | 1.00 |
| Yes | 2.21 (0.53–9.21) | 1.71 (0.25–11.6) | ||
The adjusted model was adjusted for: age, sex, BMI, smoking, diabetes, hypertension, and a family history of glaucoma.
p < 0.05. IOP, intra-ocular pressure; CD ratio, cup to disc ratio; OR, odds ratio.
Unadjusted and adjusted coefficients and ORs of eye exam parameters and glaucoma diagnosis for OSAS status (coefficients are presented with 95% CIs in parentheses, n = 84)
4. DISCUSSION
In this study, the prevalence of glaucoma in the OSA group was higher than that in the OSA-free group (16% vs. 8%). However, this difference was not statistically significant. The prevalence of glaucoma in the OSA-free group (8%) was higher than the value published in 2014 for the normal population in the “Global Prevalence of Glaucoma and Projections of Glaucoma Burden through 2040” meta-analysis (3.54%) [13]. Our higher prevalence may be attributable to the different cohort of patients used in our study, as all the patients who were referred were suspected of having sleep disorders. Another explanation may be the larger sample size utilized in the global study [13].
In our study, the prevalence of glaucoma among the OSA group was higher than that reported in similar studies conducted in Switzerland, Italy, Taiwan, and Turkey but less than that reported in the United States (Table 4). This finding may indicate a racial contribution in the development of POAG in patients with OSA. People of African ancestry are more likely to develop glaucoma than people of European ancestry [14].
| Reference | Study design | N | Type of patients | PSG | Results | POAG | POAG with increased IOP | NTG | Country | Sig. |
|---|---|---|---|---|---|---|---|---|---|---|
| Bendel et al. [15] | Cross-sectional | 100 | OSA (consecutive) | Referred after + PSG | 100 with OSA | 27% (27/100) | – | – | USA | Yes |
| Lin et al. [16] | Case–control | 256 | Referred PSG | Prospective PSG | 209 with OSA | 5.7% (12/209) | 0 | 5.7% (12/209) | Taiwan | Yes |
| 38 controls | 0 | 0 | 0 | |||||||
| Sergi et al. [17] | Case–control | 51 with OSA | OSA (consecutive) and control | Referred after + PSG | 51 with OSA | 5.9% (3/51) | 0 | 5.9% (3/51) | Italy | Yes |
| 40 controls | 40 controls | 0 | 0 | 0 | ||||||
| Geyer et al. [18] | Cross-sectional | 390 | OSA | Historical + PSG | 228 with OSA | 2.2% (5/228) | 1.3% (3/228) | 0.9% (2/228) | Israel | No |
| Mojon et al. [19] | Cross-sectional | 114 | Referred PSG | Prospective PSG | 69 with OSA | 7.2% (5/69) | 4.3% (3/69) | 2.9% (2/69) | Switzerland | Yes |
| Karakucuk et al. [20] | Case–control | 31 with OSA | OSA (consecutive) and control | Referred after + PSG | 31 with OSA | 12.9% (4/31) | 3.2% (1/31) | 9.7% (3/31) | Turkey | Yes |
| 5 controls | 25 controls | 0 | 0 | 0 |
Studies investigating the prevalence of glaucoma in patients with OSA from different countries
Accumulating evidence links OSA and POAG [21], as well as NTG [22]. However, other research studies did not observe an association between OSA and POAG [23,18]. A recent study by Shi et al. [24] systematically reviewed the publications assessing an association between OSA and glaucoma. The authors performed a meta-analysis of six case–control and nine cross-sectional studies, as well as the results of a large retrospective cohort study. The pooled results showed that patients with OSA had a higher risk of developing glaucoma than patients without OSA [24]. However, as mentioned in the review, only four of the 16 studies included in the meta-analysis controlled for potential confounders, and all four studies showed a non-significant association when examined alone [24]. Therefore, we have reason to believe that an association between OSA and glaucoma is still a matter of debate, and additional studies with sufficient power as well as proper measurement and control of important confounders are needed.
The link between the two disorders has been postulated due to the effects of hypoxia and the impaired autoregulation of optic nerve perfusion in OSA [10]. A mechanistic hypothesis linking the increased IOP to the supine position during sleep and obesity has also been proposed [11].
Cardiovascular disease, obesity, and male gender are important risk factors for OSA [25]. In our study, the members of the OSA group had a higher mean BMI, were more likely to be diabetic and to be receiving treatment for hypertension, and were more likely to be male than the members of the control group (p < 0.05). These comorbidities are also risk factors for glaucoma and may contribute to our finding of a higher prevalence of glaucoma in the OSA group [6]. In addition, aging is a risk factor for glaucoma. In the study by Al-Mansouri et al. [26], patients in the 60-year age group were more likely to develop glaucoma. In our study, the ages of patients diagnosed with glaucoma ranged from 42 to 60. Patients diagnosed with POAG were older (mean age: 51.6 years) than patients without glaucoma (mean age: 35.4 years; p < 0.05).
Furthermore, we explored the association between OSA and glaucoma before and after adjusting for potential confounders (Table 3). A consistent trend toward more glaucomatous changes was observed in participants with OSA; however, these changes were not statistically significant after adjusting for cofounders. The lack of a significant difference may be due to the small sample size and hence the lack of power.
Walsh and Montplaisir [27] first noticed an association between OSA and glaucoma in five patients in two generations within the same family. However, we did not find an increased risk attributable to a family history of glaucoma. This finding is not surprising, as glaucoma is believed to be caused by multiple inherited and environmental factors [4].
Primary open angle glaucoma treatments are directed toward lowering the IOP and include pharmacotherapy, laser therapy, and surgery. As POAG is a progressive disease, the consequence of late diagnosis is further optic nerve damage and eventual blindness [28]. However, controversy exists regarding whether treating OSA improves POAG, as some studies show a positive effect and others show worsening outcomes [29].
4.1. Study Limitations
The main limitation of observation studies is the potential imbalance with regard to baseline characteristics between the two groups compared. One way to address this limitation is to adjust for baselines characteristics in a regression analysis model, which we performed in this study. Each outcome is regressed individually, first for OSAS status without adjusting for confounders and then after controlling for age, sex, BMI, smoking, diabetes, hypertension, and a family history of glaucoma. The ORs for individuals with OSAS who were diagnosed with glaucoma were 2.21 (crude OR) and 1.71 (adjusted OR).
Owing to the difficulty we encountered in recruiting patients, the sample size was smaller than we originally planned, which limited our analysis of prevalence. In addition, the control group was younger than the OSAS group; thus, we could not control for age in the selected subjects.
Lastly, bias might exist in patient selection, rendering patients who are in a tertiary center (as in ours) to be systematically different from those who are in primary care. Therefore, this study cannot be generalized to all OSAS patients. We recommend further research in primary care and community settings.
5. CONCLUSION
Although we observed a trend toward a higher prevalence of glaucoma among patients with OSA compared with the OSA-free group, the difference was not statistically significant. As many variables contribute to the development of the two conditions, larger cohorts are required to evaluate the association between glaucoma and OSA.
CONFLICTS OF INTEREST
The authors declare they have no conflicts of interest.
AUTHOR CONTRIBUTIONS
N.B., W.G. and M.M. contributed to data collection from Sleep Medicine and Research Center. A.M., H.A. and O.B. contributed to Screening Patients for Glaucoma in Ophthalmology Clinic. R.M. contributed to data analysis. S.W. and I.Q. contributed to write up of the manuscript.
ACKNOWLEDGMENTS
Special thanks are extended to the Sleep Medicine and Research Center and Ophthalmology Department for their help. This work would not have been possible without the assistance of the nursing staff in the Sleep Lab and the Ophthalmology Clinics. The research was financed and supported by the Sleep Medicine and Research Center at King Abdulaziz University.
ABBREVIATIONS
- AASM,
American Academy of Sleep Medicine;
- AHI,
apnea–hypopnea index;
- CCT,
central corneal thickness;
- CD,
cup to disc;
- CI,
confidence interval;
- CPAP,
continuous positive airway pressure therapy;
- BMI,
body mass index;
- ESS,
Epworth Sleepiness Scale;
- IOP,
intraocular pressure;
- KAU,
King Abdulaziz University;
- NTG,
normal tension glaucoma;
- OCT,
optical coherence tomography;
- OD,
right;
- OR,
odds ratio;
- OS,
left;
- OSA,
obstructive sleep apnea;
- OSAS,
obstructive sleep apnea syndrome;
- POAG,
primary open angle glaucoma;
- PSG,
polysomnography;
- SD,
standard deviation;
- VF,
visual field.
REFERENCES
Cite this article
TY  - JOUR
AU  - Nahlah Bagabas
AU  - Wafaa Ghazali
AU  - Mariam Mukhtar
AU  - Ibrahim AlQassas
AU  - Roah Merdad
AU  - Ashfaque Maniyar
AU  - Nawaf Almarzouki
AU  - Halima Afreen
AU  - Osama Badeeb
AU  - Siraj Wali
PY  - 2019
DA  - 2019/08/28
TI  - Prevalence of Glaucoma in Patients with Obstructive Sleep Apnea
JO  - Journal of Epidemiology and Global Health
SP  - 198
EP  - 203
VL  - 9
IS  - 3
SN  - 2210-6014
UR  - https://doi.org/10.2991/jegh.k.190816.001
DO  - 10.2991/jegh.k.190816.001
ID  - Bagabas2019
ER  -