
Disaster Area Detection from Synthetic Aperture Radar Images Using Convolutional Autoencoder and One-class SVM
- DOI
- 10.2991/jrnal.k.190601.001How to use a DOI?
- Keywords
- Anomaly detection; convolutional autoencoder; one-class SVM; synthetic aperture radar
- Abstract
In recent years, research on detecting disaster areas from synthetic aperture radar (SAR) images has been conducted. When machine learning is used for disaster area detection, a large number of training data are required; however, we cannot obtain so much training data with correct class labels. Therefore, in this research, we propose an anomaly detection system that finds abnormal areas that deviate from normal ones. The proposed method uses a convolutional autoencoder (CAE) for feature extraction and one-class support vector machine (OCSVM) for anomaly detection.
- Copyright
- © 2019 The Authors. Published by Atlantis Press SARL.
- Open Access
- This is an open access article distributed under the CC BY-NC 4.0 license (http://creativecommons.org/licenses/by-nc/4.0/).
1. INTRODUCTION
Japan is a country with many natural disasters such as sediment-related disasters, earthquakes, volcanic eruptions, typhoon, etc. compared with foreign countries. In order to make provisions against such natural disasters, it is important to quickly find abnormalities. Therefore, there is a demand for systems that find the anomaly as quickly as possible after disasters occur. In recent years, research on detecting disaster areas from satellite images has been conducted [1,2]. In addition, since machine learning, especially, deep learning [3] has shown distinguished abilities in image classification problems, it is expected to apply machine learning to disaster detection problems. When machine learning is used for disaster area detection, a large number of training data is required, however, we cannot obtain so much training data with correct class labels, and especially, it is quite difficult to obtain a large number of disaster area images although it is easier to obtain non-disaster area images. Therefore, in this research, we propose an anomaly detection system that finds abnormal areas that deviate from normal ones. The proposed method does not use abnormal (disaster) images for the training, but only uses normal images. The proposed method consists of a Convolutional Autoencoder (CAE) and One-class Support Vector Machine (OCSVM) [4]. First, CAE executes feature extraction from satellite images with the unsupervised learning method. Second, OCSVM is trained using the extracted features of normal areas only. Finally, anomaly detection for the testing images is carried out by the trained OCSVM. The proposed method does not need training data with correct labels of abnormal areas, thus the cost of collecting training data can be reduced.
This paper is organized as follows. Section 2 describes the proposed method including CAE and OCSVM. Section 3 introduces a satellite image taken by a Synthetic Aperture Radar (SAR) which is hereafter called SAR image. Then, the simulation conditions and results are shown. Finally, Section 4 is devoted to conclusions.
2. PROPOSED METHOD
A flowchart of the proposed method is shown in Figure 1. First, a SAR image is given as an input, CAE is trained and feature values are extracted from the input image. Then, OCSVM is trained using the feature values of normal areas. Finally, normal and abnormal areas of the testing (unknown) images are detected by the trained OCSVM.
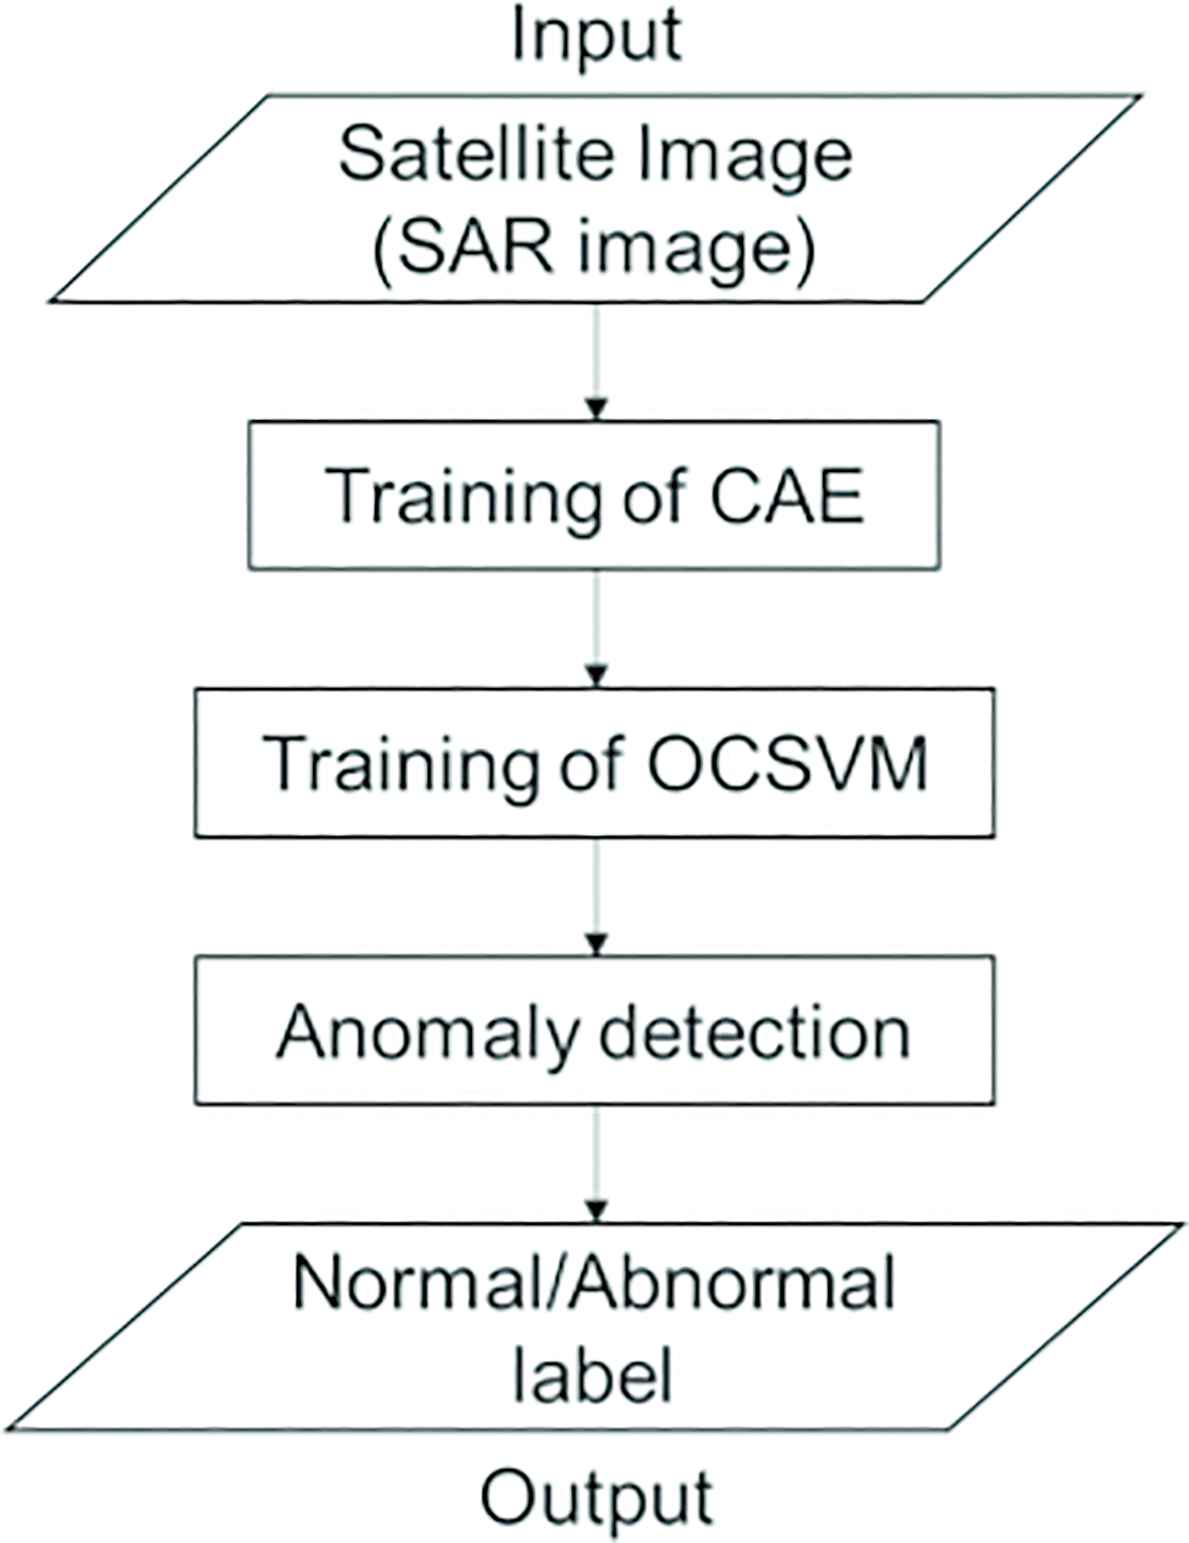
Flowchart of the proposed method.
2.1. Convolutional Autoencoder
Autoencoder [5] trains a neural network so that the input and output become the same. In the same way as the general neural network, the weights of the network are learned by stochastic gradient descent. Autoencoders have been used in dimensional reduction and expression learning. Convolutional Neural Network (CNN) [3] is known to have higher performance than the conventional neural networks such as multilayer perceptron, especially in image and speech recognition. For example, when applying CNN to the recognition of printed characters, CNN can automatically extract important shapes contained in the images such as vertical, horizontal and diagonal lines, etc. in the convolutional layers. By stacking the convolution layers, it becomes possible to identify features in complex pictures and photographs and classify each image. CAE Figure 2 is a kind of CNN that is based on unsupervised learning and executes feature extraction from input images. Figure 2 shows a CAE structure used in this paper that consists of convolution, pooling, and unpooling layers. The aim of the learning is the same as autoencoder, that is, the input images are reconstructed in the output layer. In fact, CAE can encode the input images using the layers of Convolution 1 and Pooling 1, and then decode using the layers of Convolution 2, Unpooling 1 and Convolution 3. Therefore, the values obtained at the layer of Pooling 1 can be used as feature values of the input images. The activation function is rectified linear unit [6].
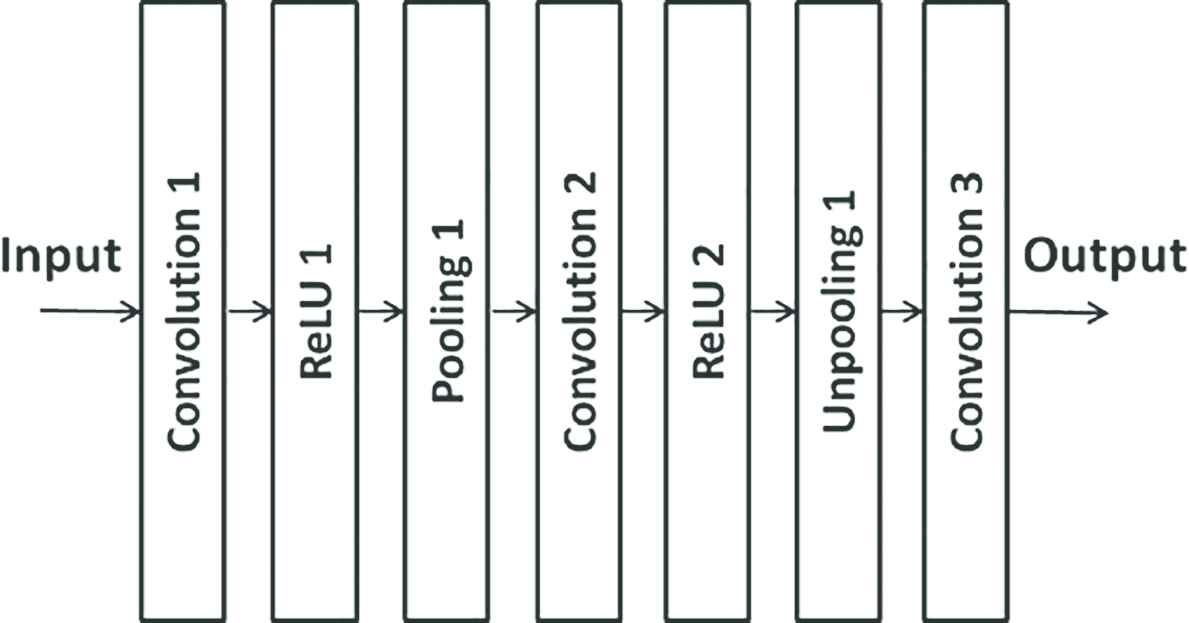
Convolutional autoencoder (CAE).
2.2. One-class SVM
Support vector machine (SVM) is originally a classification algorithm for two classes using supervised learning. OCSVM Figure 3 is an unsupervised learning algorithm that applies SVM to region discrimination problems to estimate the high-density region of data. In other words, OCSVM is an unsupervised outlier detection method. OCSVM is trained using images of normal areas only. Anomaly detection for the testing images is carried out by the trained OCSVM and abnormal images can be detected when they are out of the normal area. OCSVM has a parameter ν that determines the proportion of normal and abnormal areas. For example, when ν is set at a large value as shown in Figure 4, the normal area becomes small. In this case, only the data that is very near to the center of the normal area is regarded as normal. Conversely, when ν is small, the normal area becomes large and it is easier for the data to belong to the normal area as shown in Figure 5. Because there is a trade-off between the false positive (abnormal) and false negative (normal), the value of ν should be determined carefully.
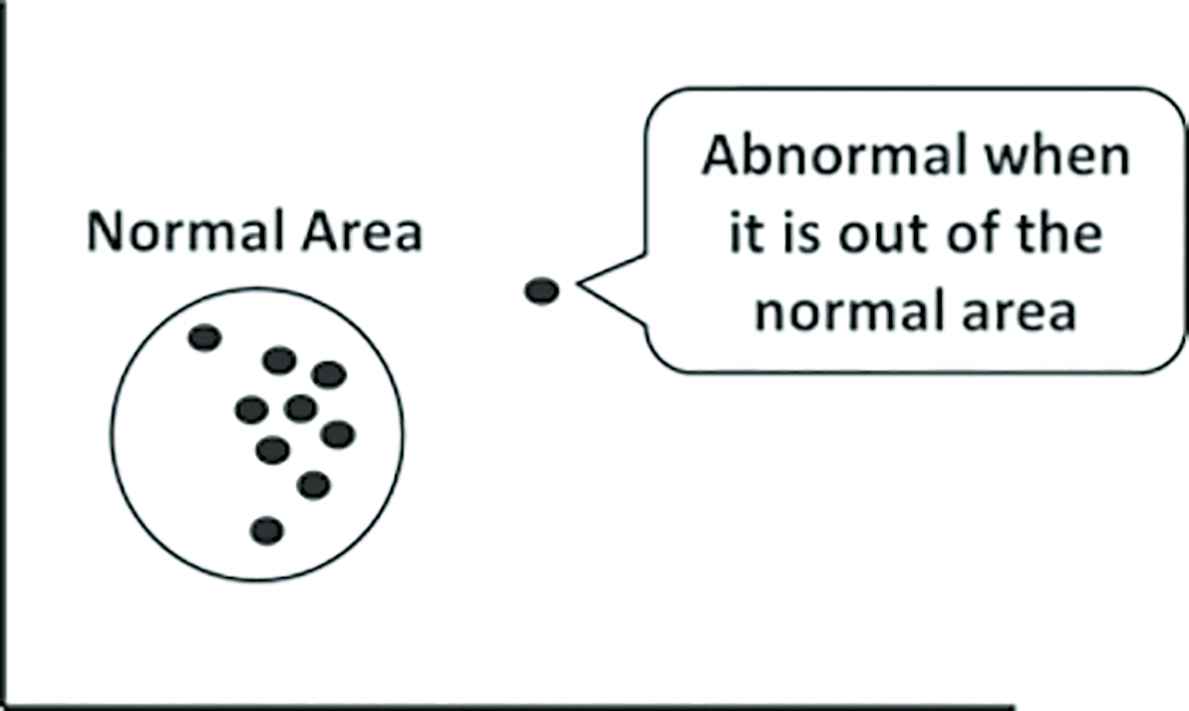
One-class SVM (OCSVM).
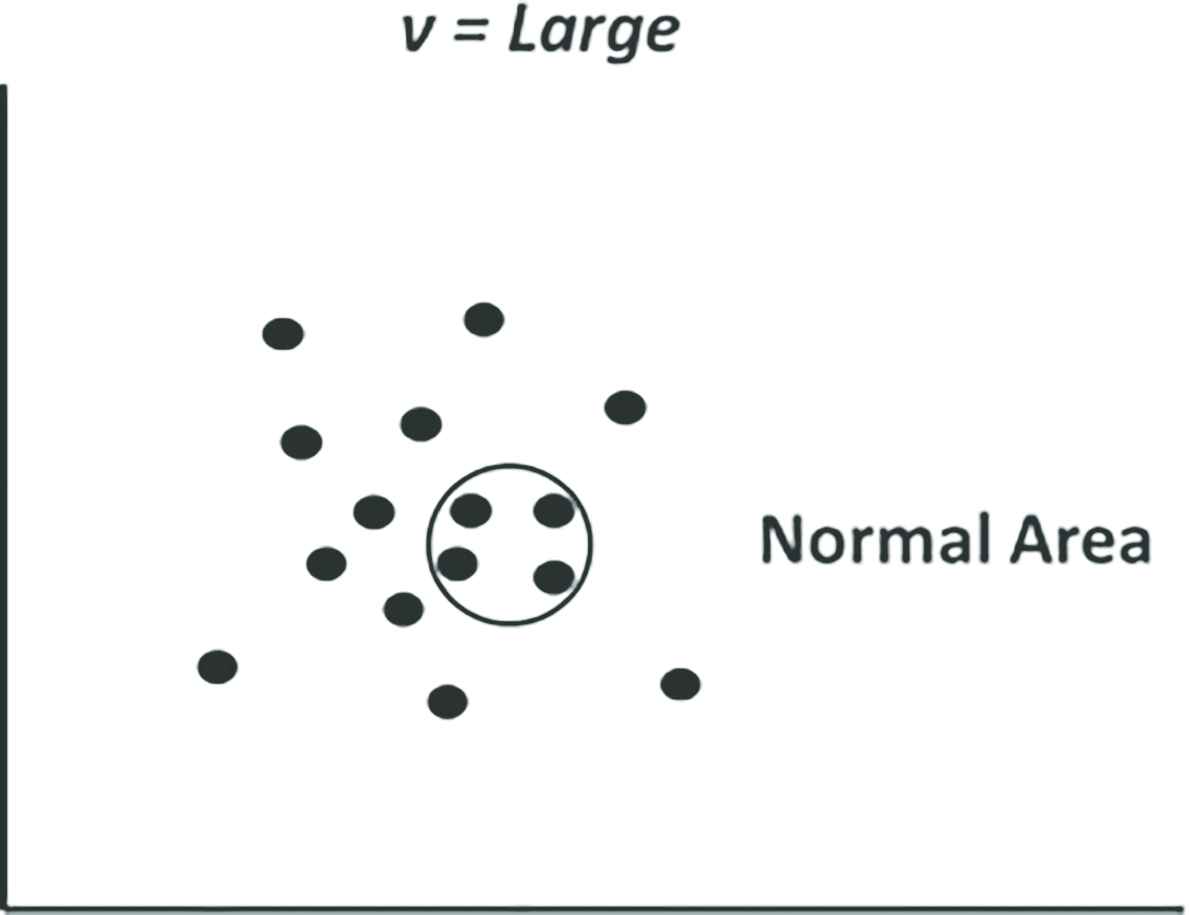
OCSVM (ν = Large).
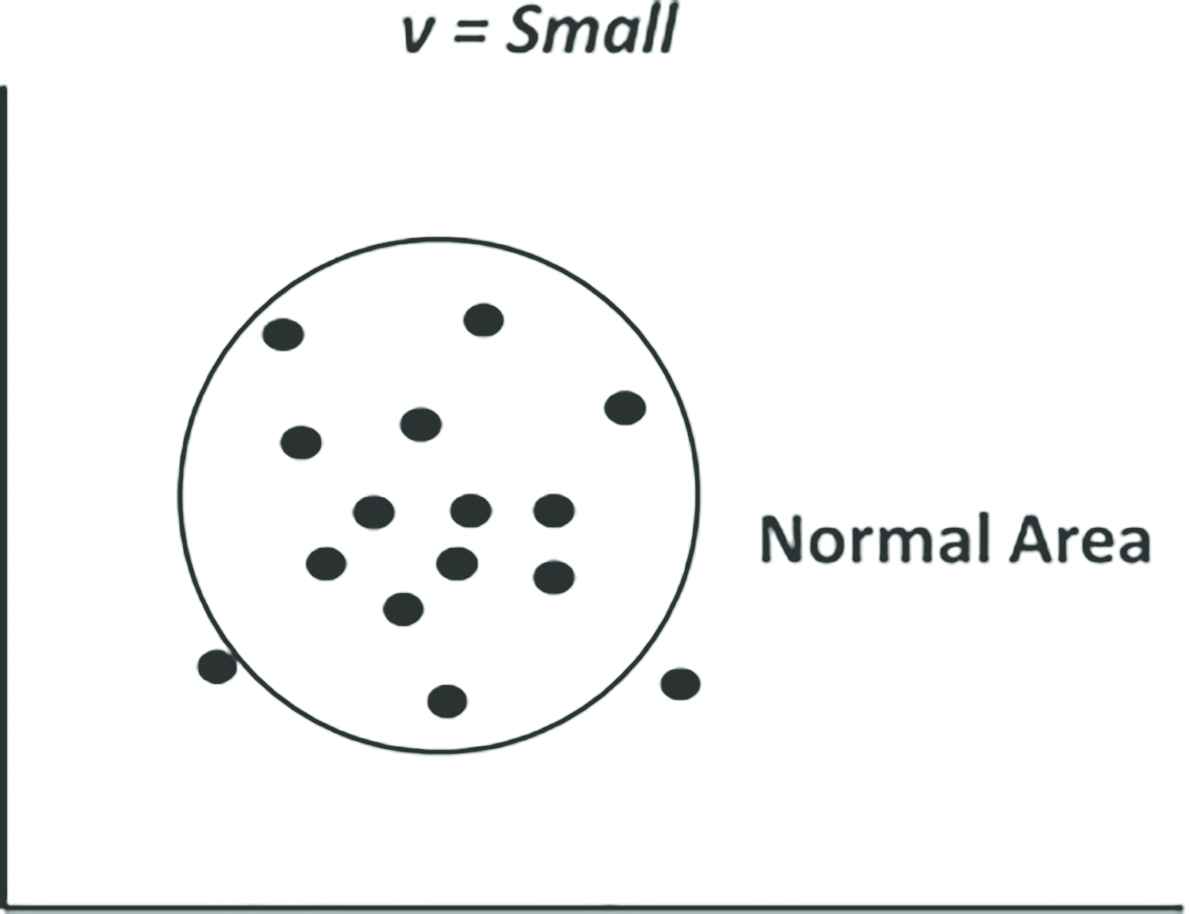
OCSVM (ν = Small).
3. SIMULATIONS
3.1. Simulation Conditions
In this paper, a SAR image of Yagi–Midorii area in Hiroshima, Japan Figure 6 is used for the evaluation of anomaly detection. In 2014, large-scale landslides occurred in this area due to the torrential rain. The SAR image was taken by Advanced Land Observing Satellite-2 (ALOS-2) that can observe the surface of the earth anytime without being influenced by day/night and weather due to its SAR [7]. Figure 6 shows the preprocessed SAR image (1327 × 900 pixel) and the lines in Figure 6 are manually traced landslide areas. The upper left shading area is excluded from the image for the simulations because that area is located on the other side of the mountain ridge from ALOS-2 and the obtained signal is weak. This image is divided into 32 × 32 pixel patch images as shown in Figure 7 and each patch is regarded as a region of interest that is classified by the proposed method. Then, the patch images are split into training data (Training), testing data 1 (Test 1) and testing data 2 (Test 2) as shown in Figure 8. “Training” contains 589 images of normal areas, “Test 1” contains 70 images of normal areas (that are not overlapped with Training), and “Test 2” contains 70 images of abnormal (landslide) areas. In the next subsection, the detection ability of the proposed method is evaluated and compared with the method using OCSVM only. We used a computer with Windows 10 Pro, Dual Intel® Xeon® CPU E5-2687W v4 @ 3.00 GHz, 128 GB RAM and NVIDIA Titan X (Pascal) GPU. The programs are implemented on Python ver. 3.6.8 with Chainer [8] ver. 4.5.0.
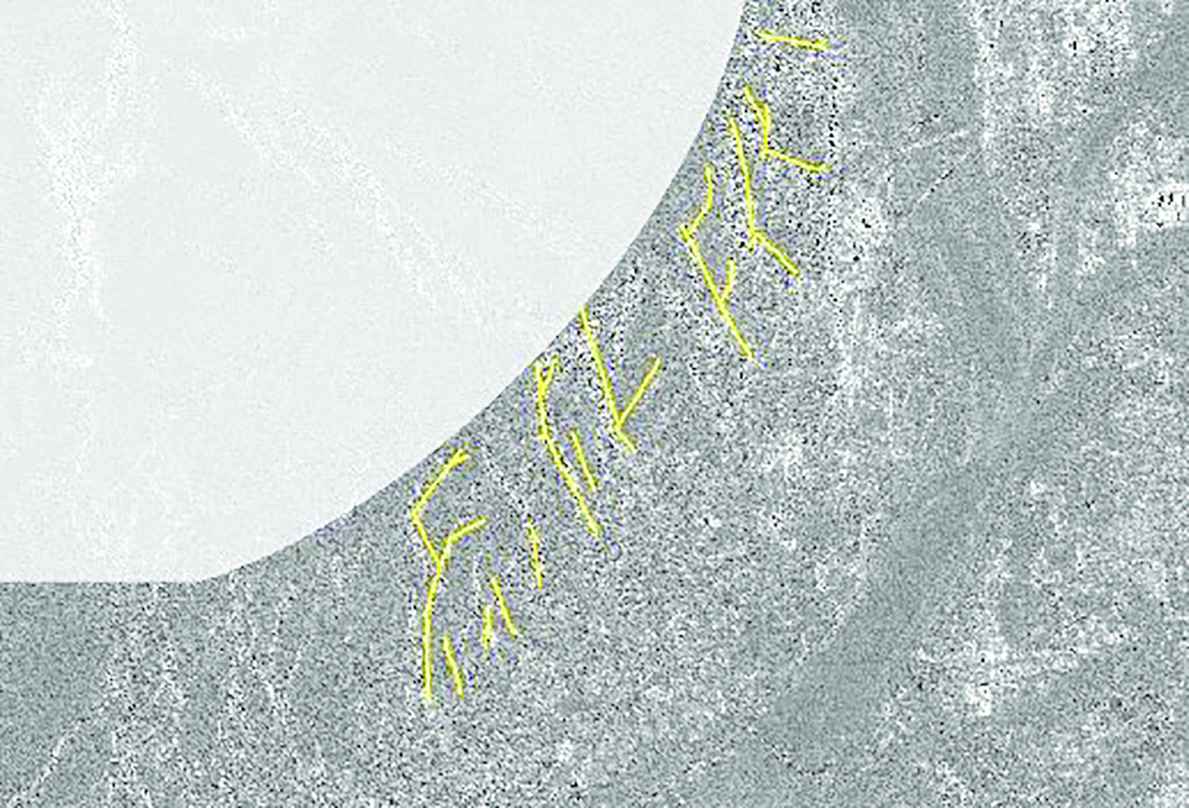
Satellite image (SAR image) and the area of the landslide (Shading area is excluded from the original image).
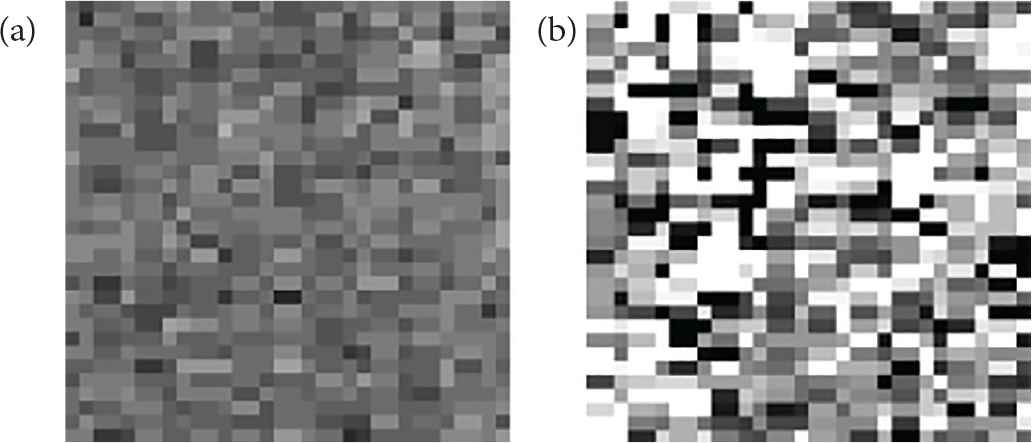
Examples of patch images (32 × 32 pixel). (a) Normal. (b) Abnormal.
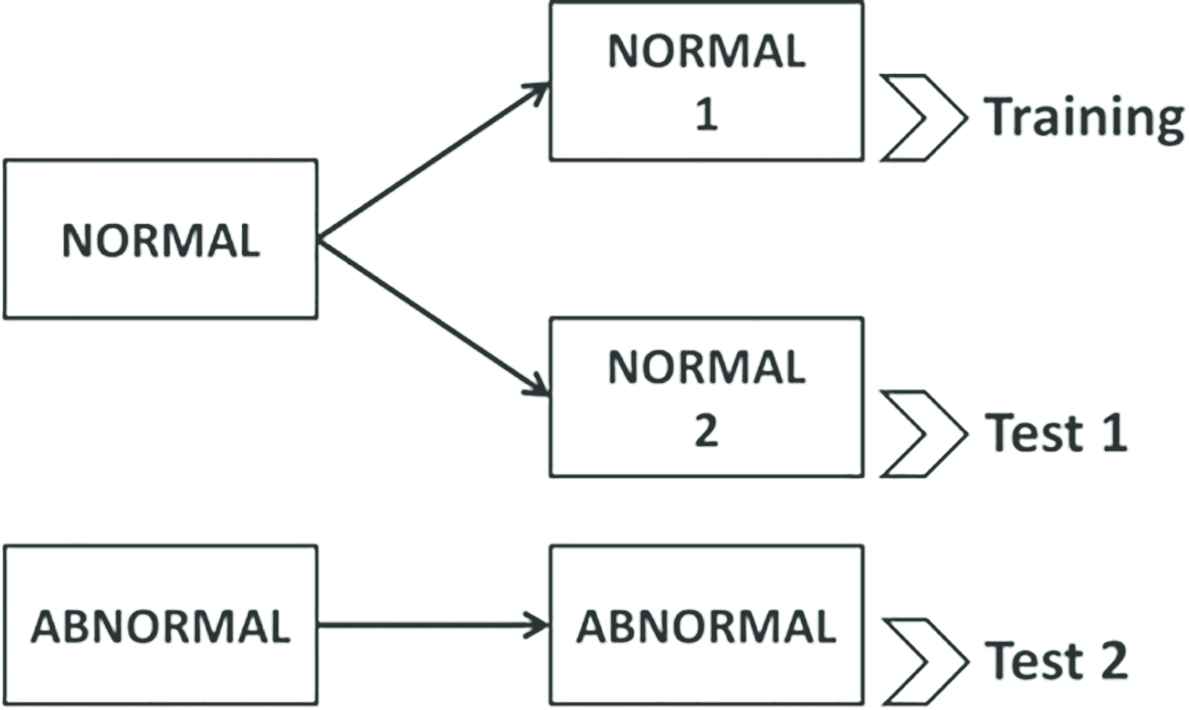
Division of data for making training and testing data.
3.2. Simulation Results
Table 1 shows the sensitivity and specificity of the detection obtained by the proposed method (CAE + OCSVM) where ν is set at various values in the range between 0.2 and 0.7. Table 2 shows the sensitivity and specificity obtained by OCSVM with the same settings of ν. From these tables, we can see that the sensitivity of the proposed method for Test 2 is better than OCSVM only for all the settings of ν, that is, the proposed method can detect (cover) abnormal areas more than OCSVM. When we pay attention to the specificity for Test 1 and sensitivity for Test 2 in Table 1, the specificity for Test 1 is better when ν is smaller, while the sensitivity for Test 2 is better when ν is larger. If more than 80% sensitivity for abnormal areas is required not to miss the disaster areas, ν should be set at 0.3 or more, and if more than 90% is required, ν should be set at 0.6 or more. However, the larger ν causes larger false positives (overdetection); thus, the value of ν has to be determined considering the balance between the false positive and false negative rates. Generally, the false negatives should be minimized not to miss the disaster areas; in this sense, larger ν is desired. In the simulations, the number of epochs for training CAE was set at 100 and the total calculation time for training and testing was 680 (s).
| ν | ||||||
|---|---|---|---|---|---|---|
| 0.2 | 0.3 | 0.4 | 0.5 | 0.6 | 0.7 | |
| Specificity for Training (normal) | 80.1 | 70.1 | 59.9 | 50.0 | 40.1 | 30.0 |
| Specificity for Test 1 (normal) | 78.7 | 69.7 | 60.3 | 45.4 | 39.6 | 31.7 |
| Sensitivity for Test 2 (abnormal) | 65.9 | 80.3 | 85.3 | 89.4 | 91.4 | 93.0 |
Sensitivity and specificity of CAE + OCSVM (proposed method)
| ν | ||||||
|---|---|---|---|---|---|---|
| 0.2 | 0.3 | 0.4 | 0.5 | 0.6 | 0.7 | |
| Specificity for Training (normal) | 80.0 | 70.0 | 60.0 | 50.0 | 39.9 | 30.0 |
| Specificity for Test 1 (normal) | 77.7 | 70.3 | 60.4 | 50.6 | 35.6 | 30.3 |
| Sensitivity for Test 2 (abnormal) | 2.9 | 11.4 | 15.7 | 21.6 | 38.0 | 56.0 |
Sensitivity and specificity of OCSVM
4. CONCLUSION
In this study, an anomaly detection algorithm using CAE and OCSVM for SAR images was proposed. CAE automatically extracts features from image data, and OCSVM detects abnormal areas. From the simulation results, the proposed method showed better detection ability of the abnormal areas comparing to the method with OCSVM only. Therefore, the effectiveness of the feature extraction by CAE was clarified. As future work, we will apply trained neural networks using ImageNet [9] such as VGG and GoogleNet for enhancing the feature extraction ability.
CONFLICTS OF INTEREST
There is no conflicts of interest.
Authors Introduction
Dr. Shingo Mabu
 He received the B.E. and M.E. degrees from Kyushu University, Japan, in 2001 and 2003, respectively, and the PhD degree from Waseda University, Japan, in 2006. From 2006 to 2007, he was a visiting lecturer at Waseda University, Japan, and from 2007 to 2012, an assistant professor at the same university. From 2012 to 2017, he was an assistant professor at Yamaguchi University, Japan. Since 2017, he has been an associate professor at the same university.
Mr. Kohki Fujita
 He received the B.E. degree from Yamaguchi University, Japan in 2016, and M.E. degree from the same university in 2018.
Dr. Takashi Kuremoto
 He received the B.E. degree from University of Shanghai for Science and Technology, China in 1986, and the M.E. and PhD degrees from Yamaguchi University, Japan in 1996 and 2014, respectively. He worked as a system engineer at Research Institute of Automatic Machine of Beijing from 1986 to 1992 and is currently an assistant professor at Yamaguchi University, Japan. He was an Academic Visitor of School of Computer Science, The University of Manchester, U.K. in 2008.
REFERENCES
Cite this article
TY  - JOUR
AU  - Shingo Mabu
AU  - Kohki Fujita
AU  - Takashi Kuremoto
PY  - 2019
DA  - 2019/06/25
TI  - Disaster Area Detection from Synthetic Aperture Radar Images Using Convolutional Autoencoder and One-class SVM
JO  - Journal of Robotics, Networking and Artificial Life
SP  - 48
EP  - 51
VL  - 6
IS  - 1
SN  - 2352-6386
UR  - https://doi.org/10.2991/jrnal.k.190601.001
DO  - 10.2991/jrnal.k.190601.001
ID  - Mabu2019
ER  -