
Dynamic Structures for Evolving Tactics and Strategies in Team Robotics
- DOI
- 10.2991/jrnal.k.191203.005How to use a DOI?
- Keywords
- Multi-robot systems; robot soccer; hypernetworks; multilevel systems; multilevel dynamics
- Abstract
The autonomous robot systems of the future will be teams of robots with complementary specialisms. At any instant robot interactions determine relational structures, and sequences of these structures describe the team dynamics as trajectories through space and time. These structures can be represented in algebraic forms that are realizable as dynamic multilevel data structures within individual robots, as the basis of emergent team data structures. Such formalisms are necessary for robots to learn new individual and collective behaviours. The theory is illustrated by the example of robot soccer where robot interactions create structures and trajectories essential to the evolution of new tactics and strategies in a changing environment.
- Copyright
- © 2019 The Authors. Published by Atlantis Press SARL.
- Open Access
- This is an open access article distributed under the CC BY-NC 4.0 license (http://creativecommons.org/licenses/by-nc/4.0/).
1. INTRODUCTION
We use team robotics as a model for the planning, design, management and control of multilevel complex socio-technical systems including organisations such hospitals, airlines, and banks, and socio-economic policy at national and international levels. We choose robot soccer as the example for team robotics because it has well-established rules, there are many games to study, and it provides a platform for experimentation and communication.
The great advantage of studying team robotics as an exemplar of complex systems is being able to focus on team interactions without being distracted by the greater complexities of human agents. For example, unless such behaviour is programmed into them, robots will not pick up the ball and run with as William Webb-Ellis is said to have done in 1823, thereby inventing the game of rugby. Thus team robotics provides a class of complex socio-technical systems that is more complex than many physical systems, but less complex than most social systems. The methodological framework developed here for team robots is intended to be extended and applied to social systems.
The challenge of robot soccer goes back more than 20 years [1], and can be simply stated as “By the middle of the 21st century, a team of fully autonomous humanoid robot soccer players shall win a soccer game, complying with the official rules of FIFA, against the winner of the most recent World Cup.” Of many varieties of robot soccer we choose to study the RoboCup simulation league. This enables us to focus on the spatio-temporal structures of the team interactions without being distracted by the considerable engineering challenges of building physical robots.
2. MULTIDIMENSIONAL STRUCTURE IN ROBOT SOCCER
Atkin [2] proposed analysing the relational structure of chess with his methodology of Q-analysis. Atkin studied the relations between the pieces and the squares of the board, e.g., in Figure 1a the black rook, black king and white knight form a structure called a knight fork while in Figure 1b they do not. However, the configuration in Figure 1b is a precursor to the knight fork, and this plays a part on the evolving structure of the game. Although not a knight fork itself, unless black moves to prevent it, the white knight can move to form the knight fork configuration of Figure 1a.
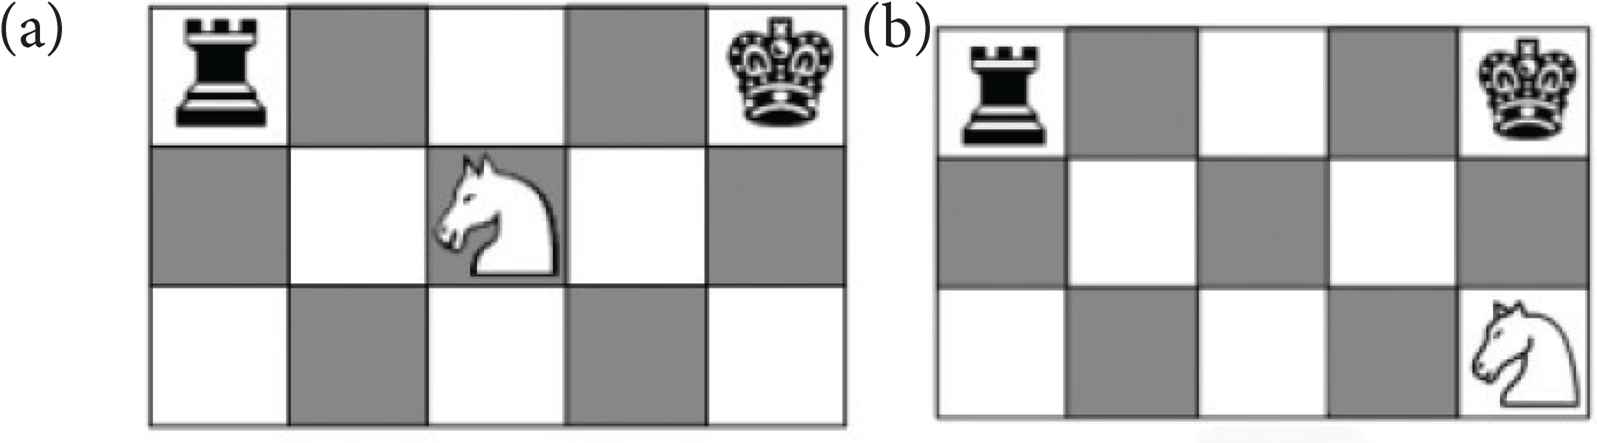
Structure in the game of chess. (a) A knight fork in chess. (b) a knight fork precursor.
Gould and Gatrell [3] suggested that Atkin’s method could be applied to soccer analysing the 1977 Football Association Cup Final in the UK. Johnson [4] suggested applying the method to robot soccer [5] and it was further developed by Johnson and Iravani [5] using Johnson’s theory of hypernetworks [6]. Recently Ramos et al. [7] showed how the hypernetwork approach can be applied in sports science.
At the heart of the hypernetwork methodology is the fact that in most complex systems the relationships of interest are not just between two elements but can be between n > 2 elements. This is illustrated in Figure 2.
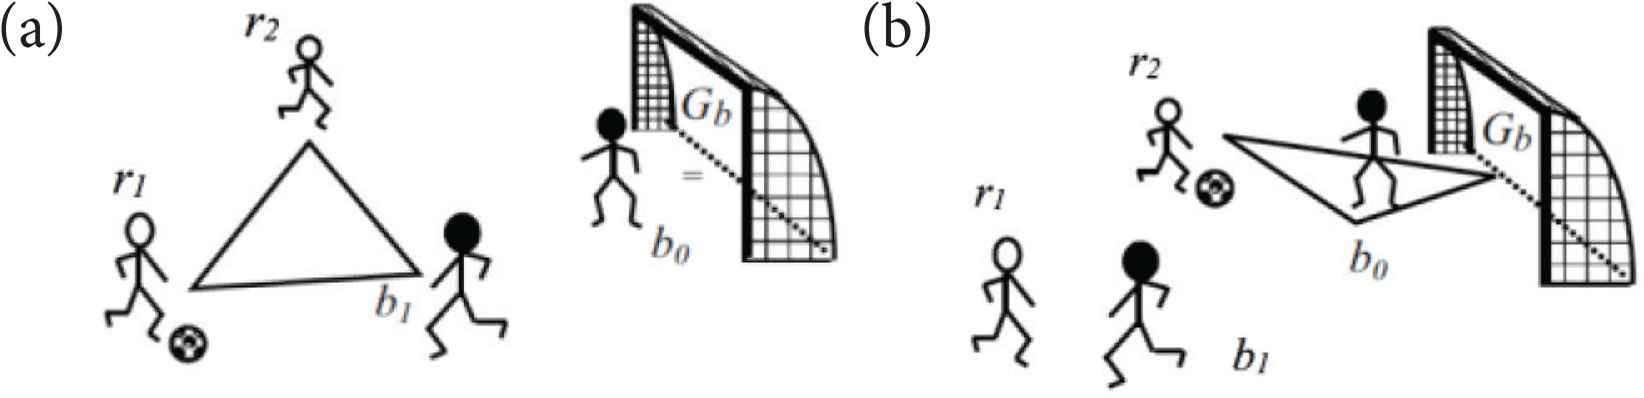
n-ary relation structures in soccer (from Johnson [6]). (a) The defender’s dilemma. (b) The goalkeeper’s dilemma.
The “defender’s dilemma” (Figure 2a) involves three players – two red team players and a blue team player. This can be written as <r1, r2, b1> which generalises the notation of network edge. In fact this structure could be written as three binary relations <r1, r2> + <r1, r2> + <r1, r2> but this would be a poor representation because the dilemma involves all the players at once, not just a combination of binary relations.
Figure 2b shows the goalkeeper’s dilemma as a 4-ary relation <r2, b0, Gb, ball> which, again, is not just a combination of 2-ary relations (Gb is the blue goal). Apart from the need to generalise networks to higher dimensional edges (which are called simplices) another essential generalisation of network theory is to include the relation symbol in the notation. Thus the defenders dilemma can be better represented by the notation <r1, r2, b1, ball; Rdefenders_dilemma> which allows the relational structure to be discriminated from other 4-ary relations on these elements – of which there may be many in a soccer match. A set of n elements with and n-ary relation between them is called a hypersimplex. A set of hypersimplices is called a hypernetwork [6].
Figure 3 shows how the binary (2-ary) relations of networks can be generalised. A 3-ary relation between three players can be represented by a triangle with three vertices; a 4-ary relation between four players can be represented by a tetrahedron with four vertices; a 5-ary relation between five players can be represented by a multidimensional polyhedron with five vertices, and so.
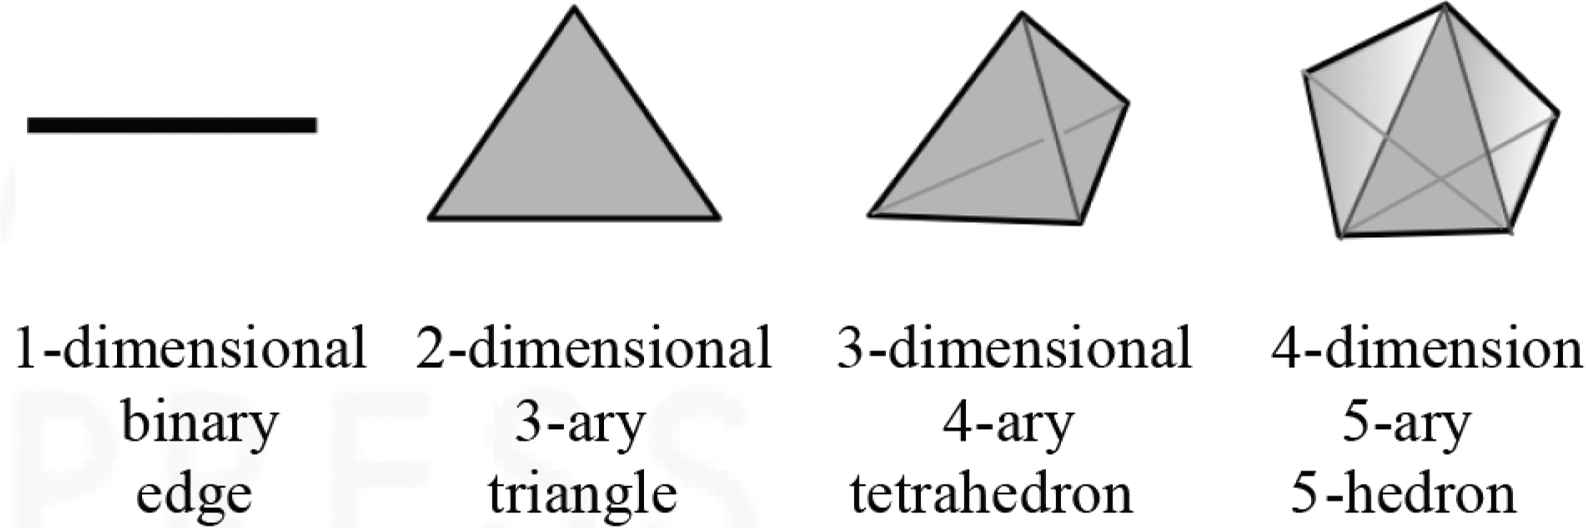
Hypersimplices as multidimensional polyhedra.
Figure 4 shows that hypersimplices can have higher dimensional connectivities, e.g. in Figure 4a the tetrahedra and triangles share edges, or one-dimensional connections. Figure 4b shows how two tetrahedra can be connected through a two-dimensional triangular face. In general simplices can be connected through multi-dimensional faces, generalising network connectivity through single vertices. This provides a new kind of connectivity structure with potential for exploitation in robot soccer.
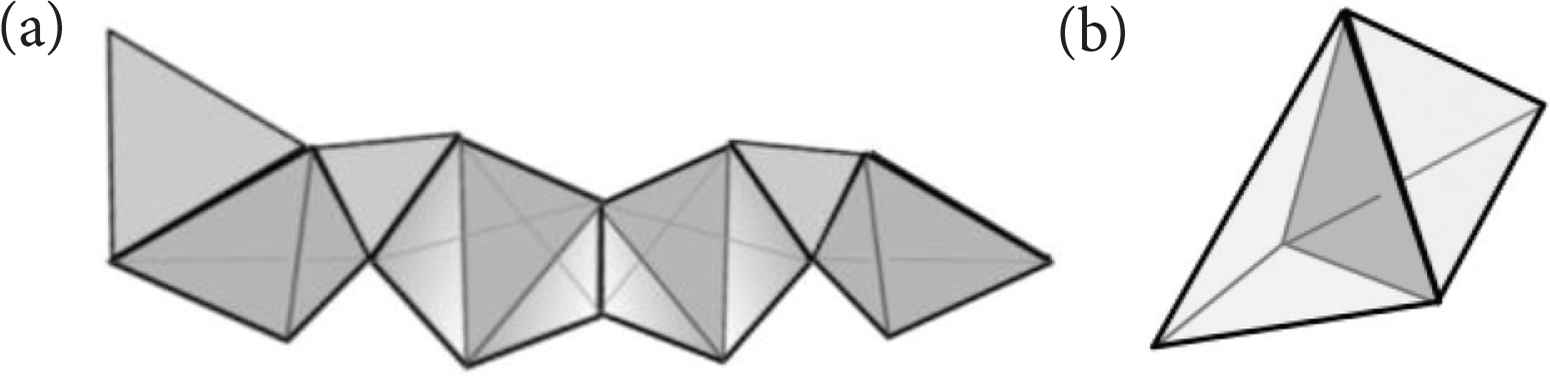
Multidimensional connectivity between hypersimplices. (a) a 1-connected chain. (b) 2-connected tetrahedra.
In soccer three kinds of neighbourhood structures can be identified:
- (i)
a player has possession of the ball.
- (ii)
a player dribbles the ball.
- (iii)
a player tackles an opponent.
The first of these is characterised by a relation between the player and the ball, <player, ball; Rpossession; z, t>.
The symbol t denotes time. In the simulation version of robot soccer in this paper the game lasts for 6000 ticks of the clock, notionally 10 min at 10 ticks per second. Let <player, ball; Rpossession; z, t> be called a possession point. The symbol z represents the position of the possession point. At its simplest we could write z = (xplayer, yplayer, xball, yball). Thus the symbols z and t represent the space-time structure of the robot soccer dynamics.
The second structure, dribbling the ball, can be denoted as a sequence of possession points involving just one player <<player, ball; Rpossession; z, t>, <player, ball; Rpossession; z; t′>; <player, ball; Rpossession; z; t″>; . . . ; Rdribble>>.
The third structure is a relation between members of opposite teams, r in the ‘red’ team and b in the ‘blue’ team, denoted <<r, ball; Rpossession; z; t>, <b, ball; Rpossession; z; t′ >; Rtackle>.
Another fundamental structure in robot soccer is
- (iv)
a player passes the ball to a team-mate
This structure can be characterised as <<player, ball; Rpossession; z; t>, <player′, ball; Rpossession; z; t′>; Rpass>. Let this be called a pass structure.
3. MULTILEVEL SYSTEMS
The structures (iii) and (iv) in the previous section are interesting because they are built on relations between two possession points, i.e. they are structures formed from more elementary structures. If the players and ball are said to be elements at Level N, a structure such as a possession point exists at Level N + 1, and a pass or a tackle exists at Level N + 2. A multilevel representation is essential for soccer because, as will be illustrated, the game is one of players trying to create ‘good’ multilevel structures and trying to destroy ‘bad’ multilevel structures.
The RoboCup simulation league soccer games that will be used for illustration last for 6000 ticks of the clock (10 min if 10 ticks represent 1 s). Although it would be possible to provide information about the whole game, e.g. the percentage time each team has possession, chunks of time naturally occur over intervals as short as a 100 ticks. Figure 5 illustrates how the 6000 ticks of a soccer game can be structured by possession between the red Gliders’ team and the blue CYRUS team.
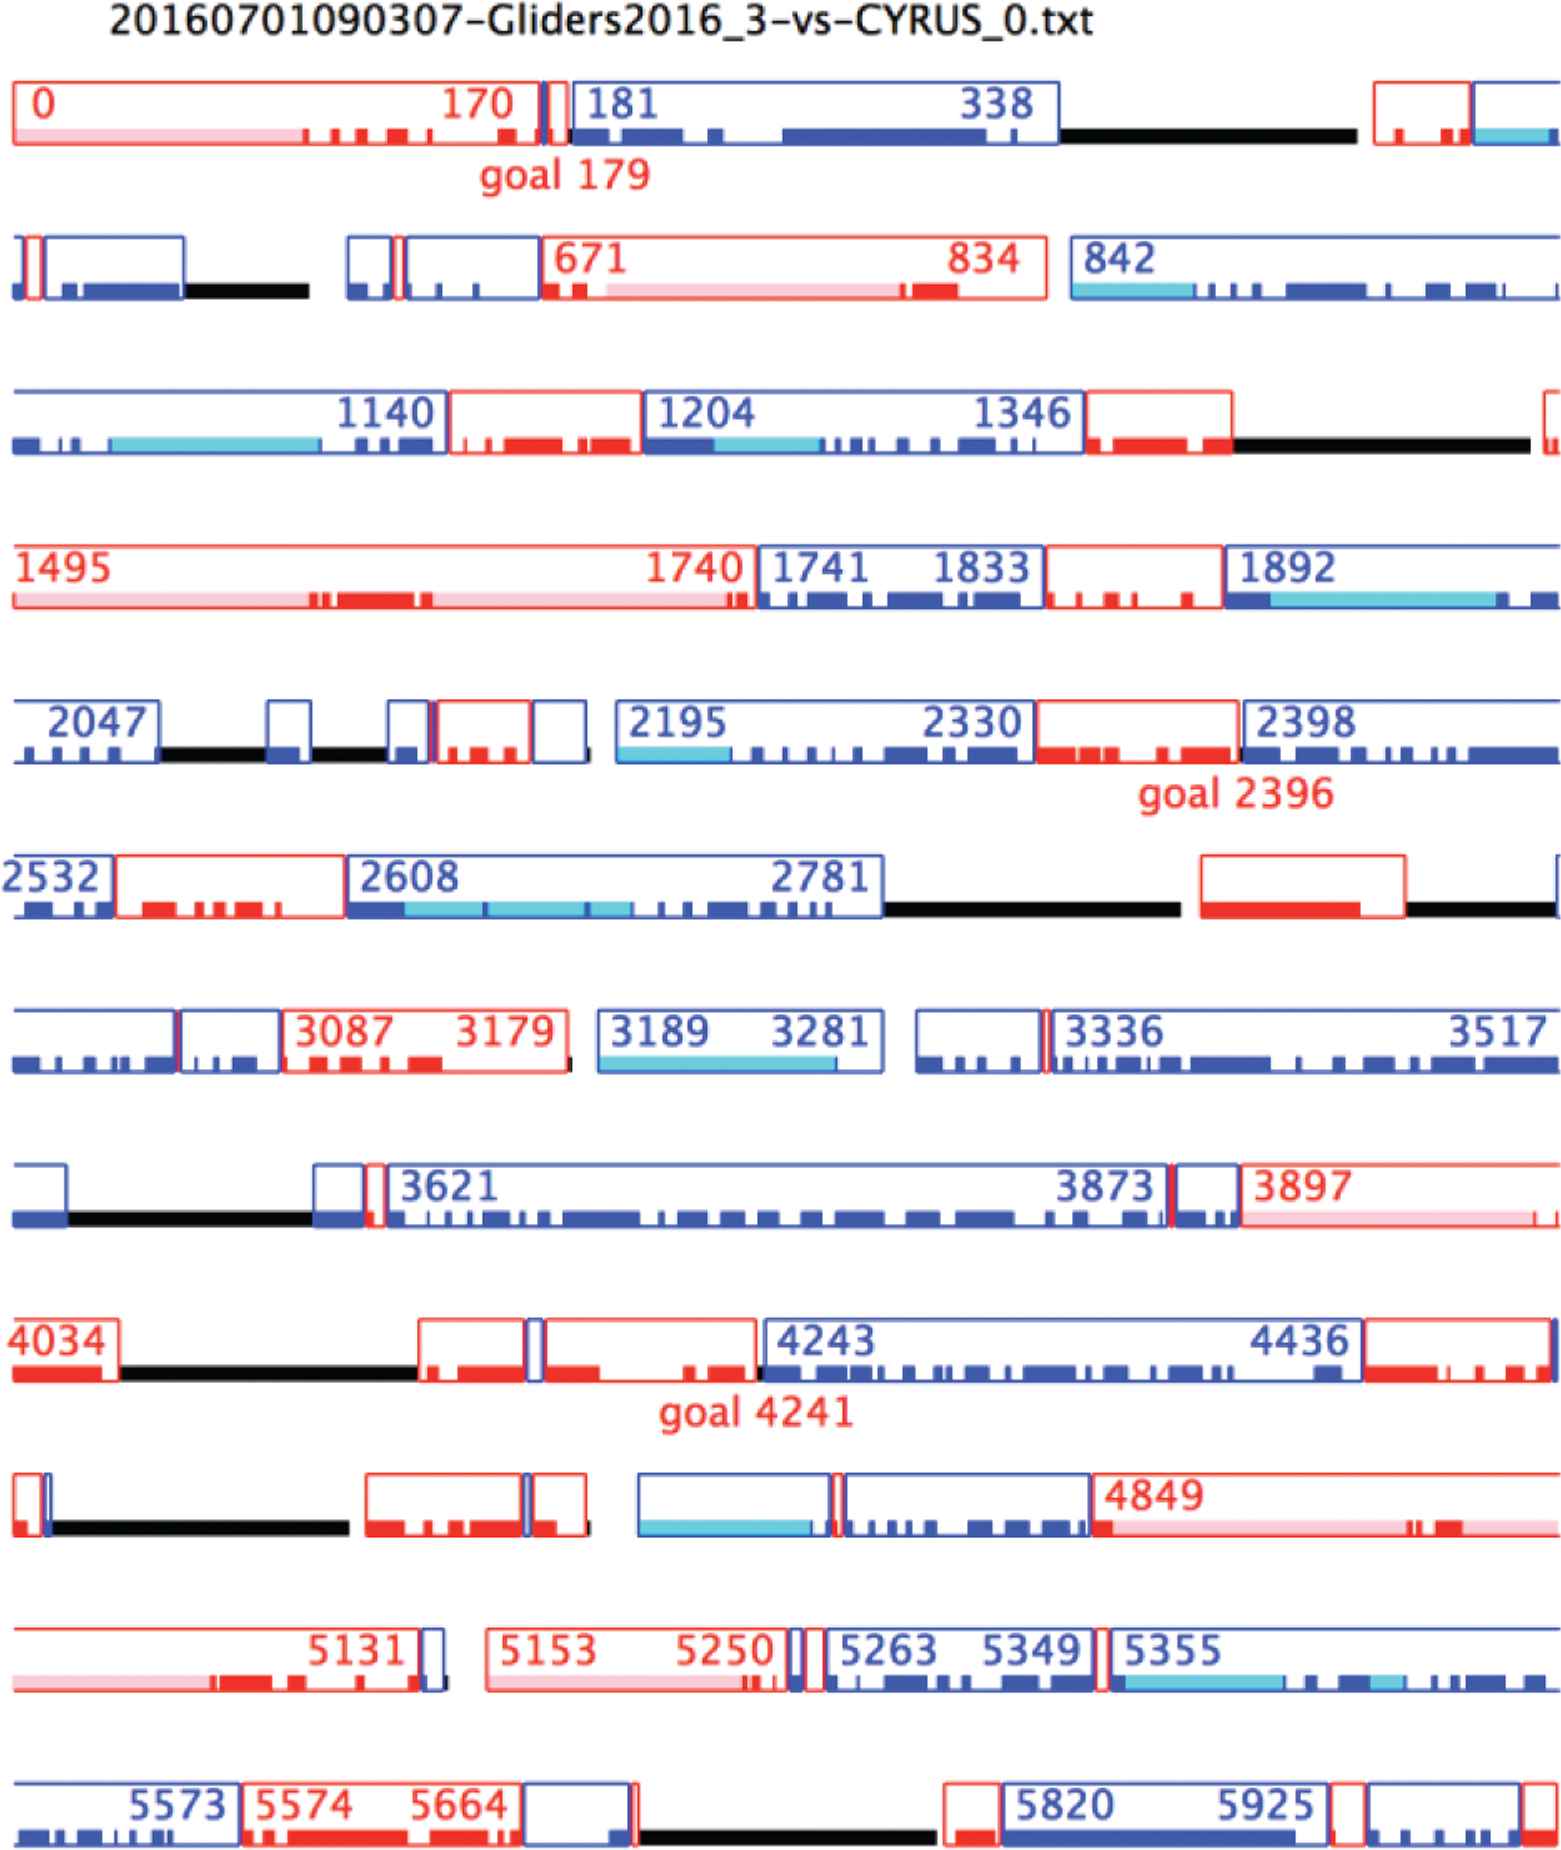
The temporal possession structure in robot soccer.
The red rectangles represent periods when the red players are closest to the ball. For example, the period 0–170 is controlled by the red team at the kick-off and the period 1204–1346 is controlled by the blue team. The pink (cyan) line at the beginning indicates that the ball is not moving, i.e. the red (blue) team is taking a long time to initiate play. The solid red (blue) rectangles are periods when red (blue) is in direct possession. The white gaps at the bottom are periods when neither red nor blue players are close enough to the ball to be in possession but, in this case, the red (blue) team controls the ball. The black lines show that the ball is out of play.
4. AN ILLUSTRATIVE EXAMPLE
Figure 6 shows a green-coloured trajectory for the ball between a throw-in at A and a goal being scored at I. The red team has players denoted r1, r2, r3, . . ., and attacks the goal on the right. The blue team has players denoted b1, b2, b3, . . ., and attacks the goal on the left. The trajectory has discernable parts beginning with AB where r5 takes the throw-in to r8.
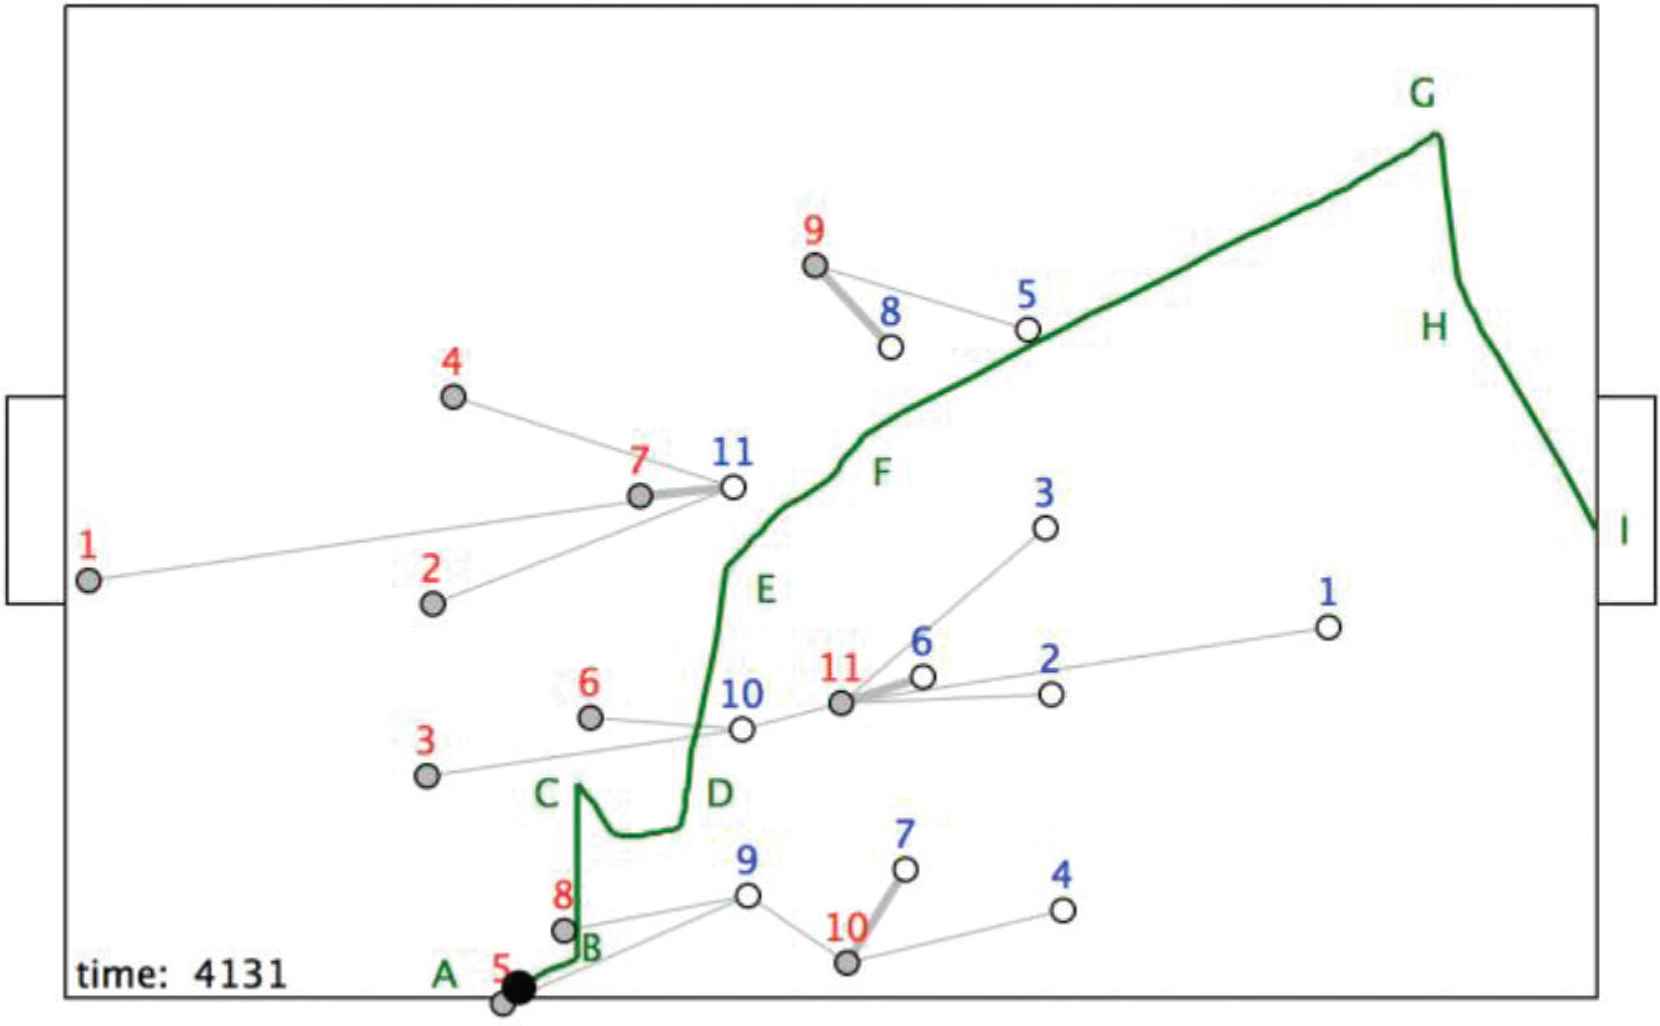
A soccer ball trajectory beginning at t = 4131.
Let Rpass be the passing relation where <r5, r8; Rpass> means that r5 passes to r8, and <r5, r8; z; t = 4131; Rp> means that r5 passes to r8 at time t = 4132.
The closest opponent relation, Rclosest, between the players at time 4131 is shown by thin grey lines. A thick grey line between players shows that they are mutually closest to each other under the relation Rmutually_closest. The closest opponent relation here results in four connected components:
Rc components at time t = 4132
C1 → <r1, r2, r4, r7, b11; z; t; Rclosest>
C2 → <r3, r6, r11, b1, b2, b3, b6, b10; z; t; Rclosest>
C3 → <r5, r8, r10, b4, b7, b9; z; t; Rclosest>
C4 → <r9, b5, b8; Rclosest>
The fundamental hypothesis is that structures such as these may be predisposed to good or bad outcomes for one or other team. In soccer the ultimate objective is to score goals, but usually goals only emerge at the end of a sequence of ‘good’ discrete structures such as that illustrated by the ball trajectory in Figure 6. The challenge is to be able to recognise structures as being ‘good’ or ‘bad’ and to move so that ‘good’ structures emerge.
From Figures 6 and 7 it can be seen that the structural change between t = 4131 and t = 4145 can be summarised as follows:
Time t = 4145 components
C1 → <r1, r2, r4, r7, b11; Rc>
C2 → <r3, r6, b10; Rc> + <r11, b1, b2, b3, b6; Rc>
C3 → <r5, r8, b9; Rc> + <r10, b4, b7; Rc>
C4 → <r9, b8; Rmc>
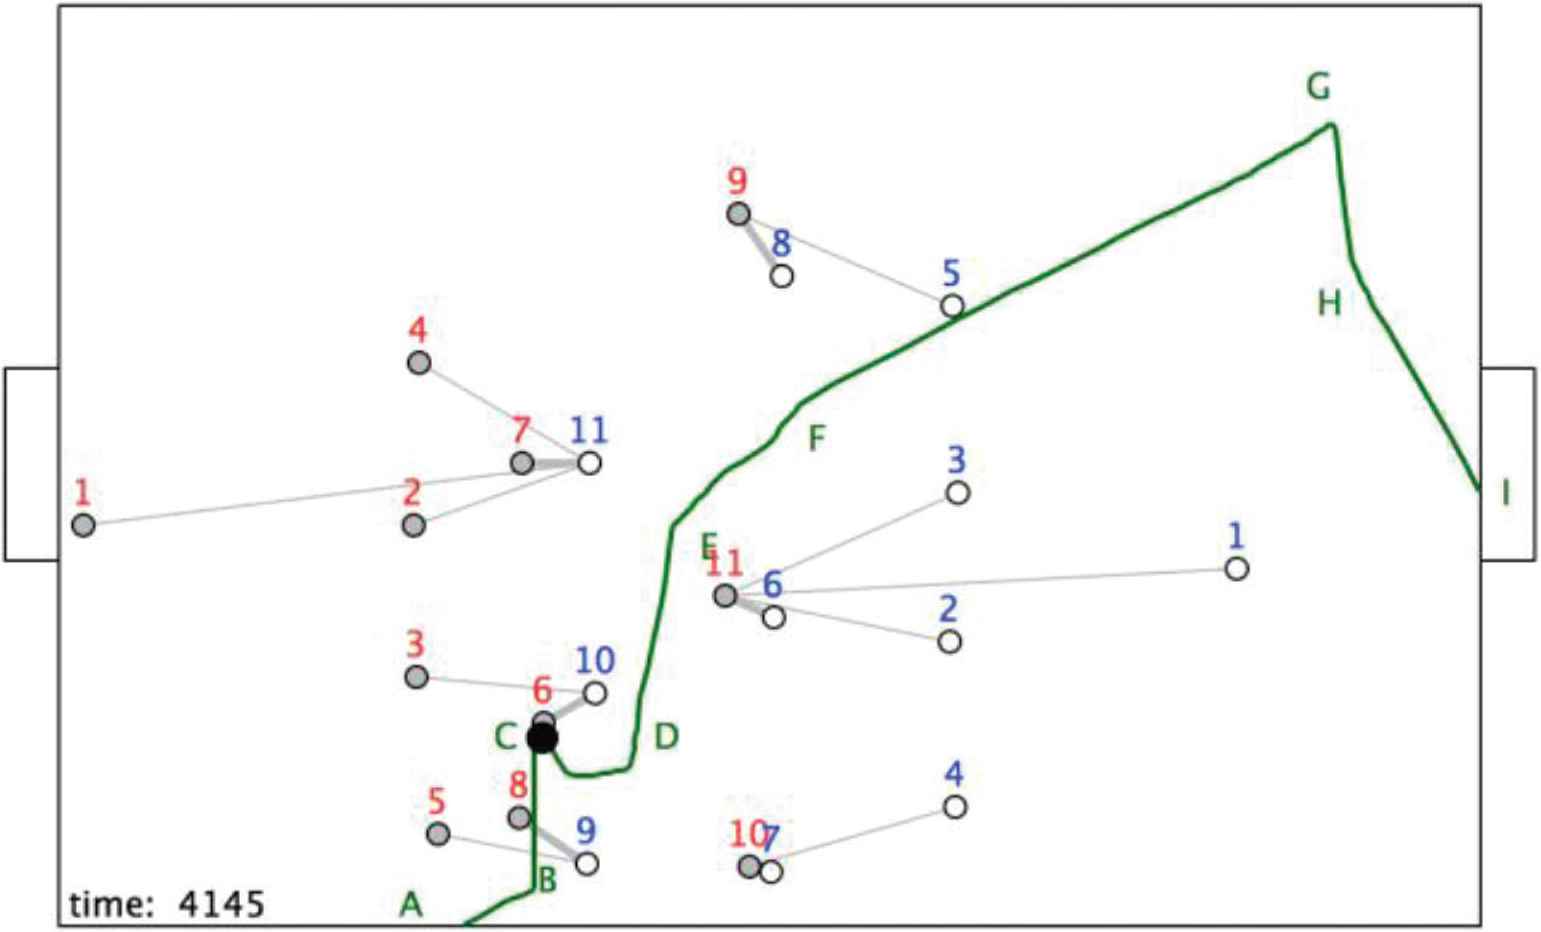
The ball position at t = 4145.
As can be seen two of the components, C1 and C4, remain unchanged while the two closest to the ball, C2 and C3, break into substructures.
Figure 8 shows the ‘closest to’ relation between the players and small areas of the pitch. At first sight this structure suggests that the red and blue teams have comparable domination of the pitch with the blue team controlling more of it.
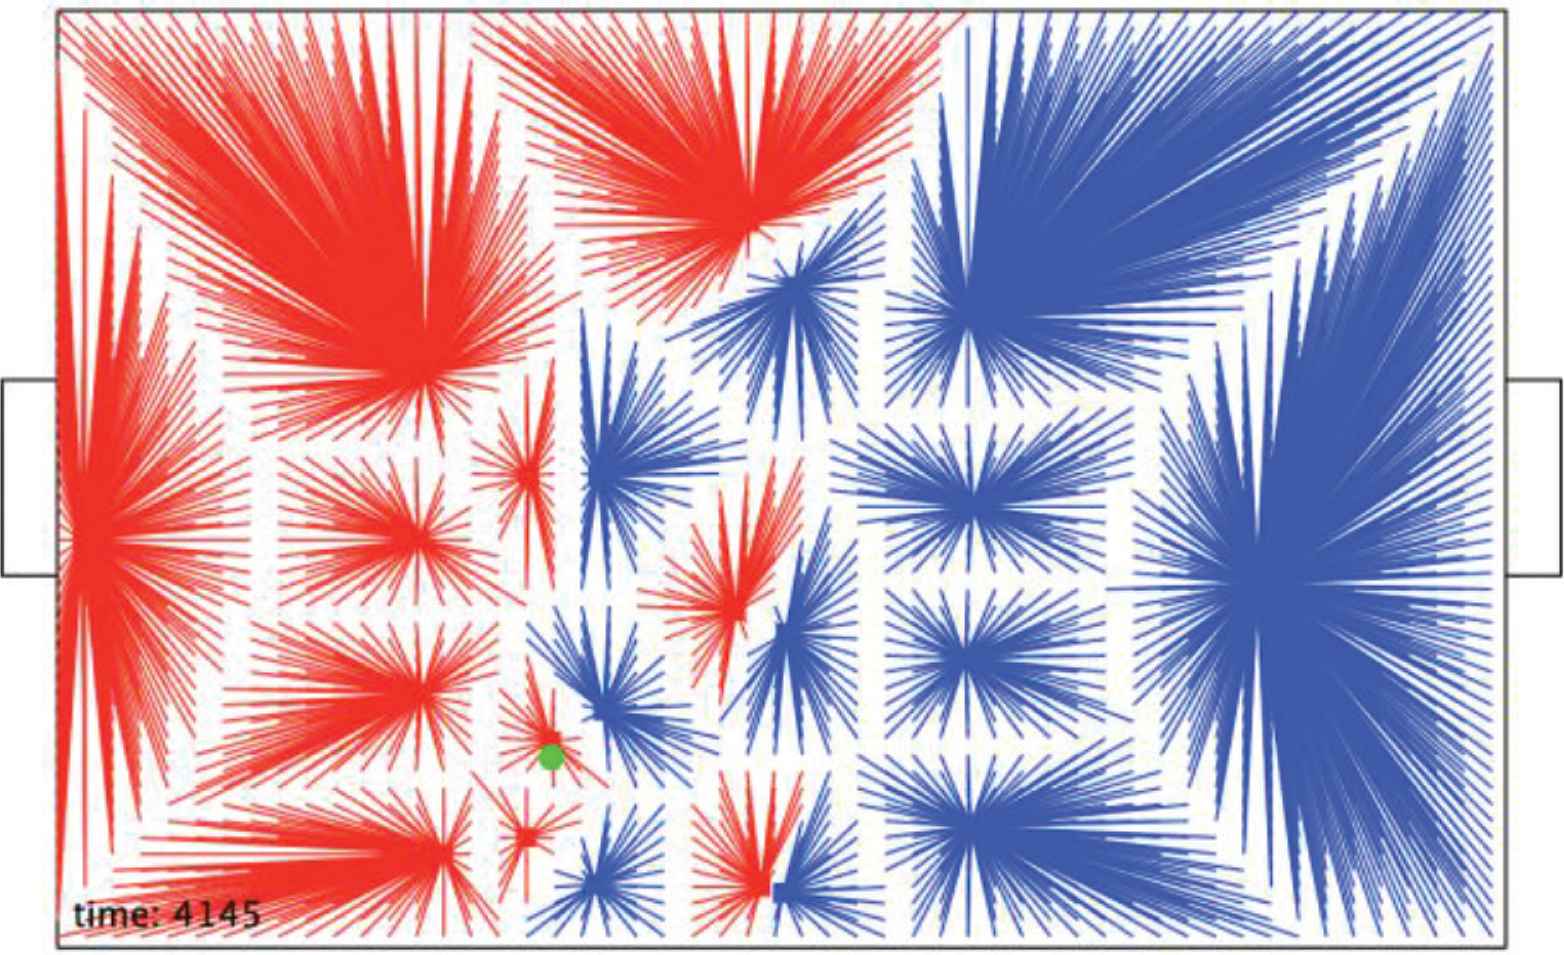
The pitch possession structure at t = 4145.
However, as Figure 9 shows player r6 has enabled new structures to emerge by dribbling the ball from C to D. During this time the configuration <r1, r2, r4, r7, b11; Rc> has changed, with b11 moving to the left and r7 moving to the right. This structural change is bad for blue since r7 now controls more space (Figure 10), enabling r6 to pass the ball to it at E.
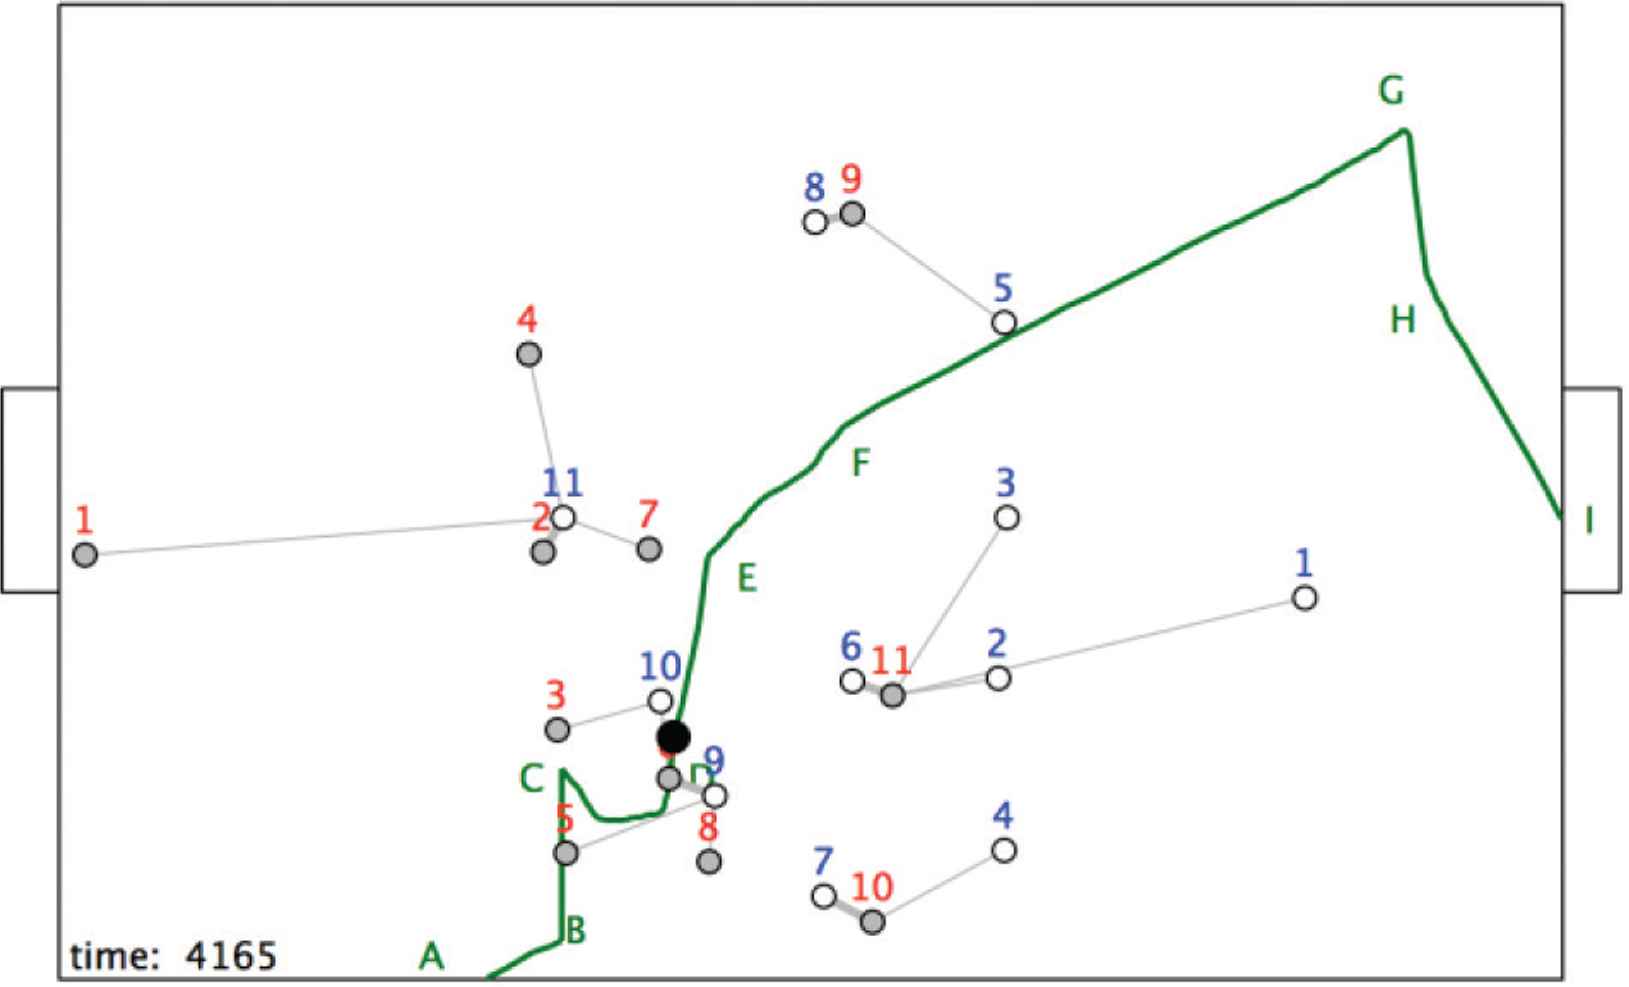
The position at t = 4165.
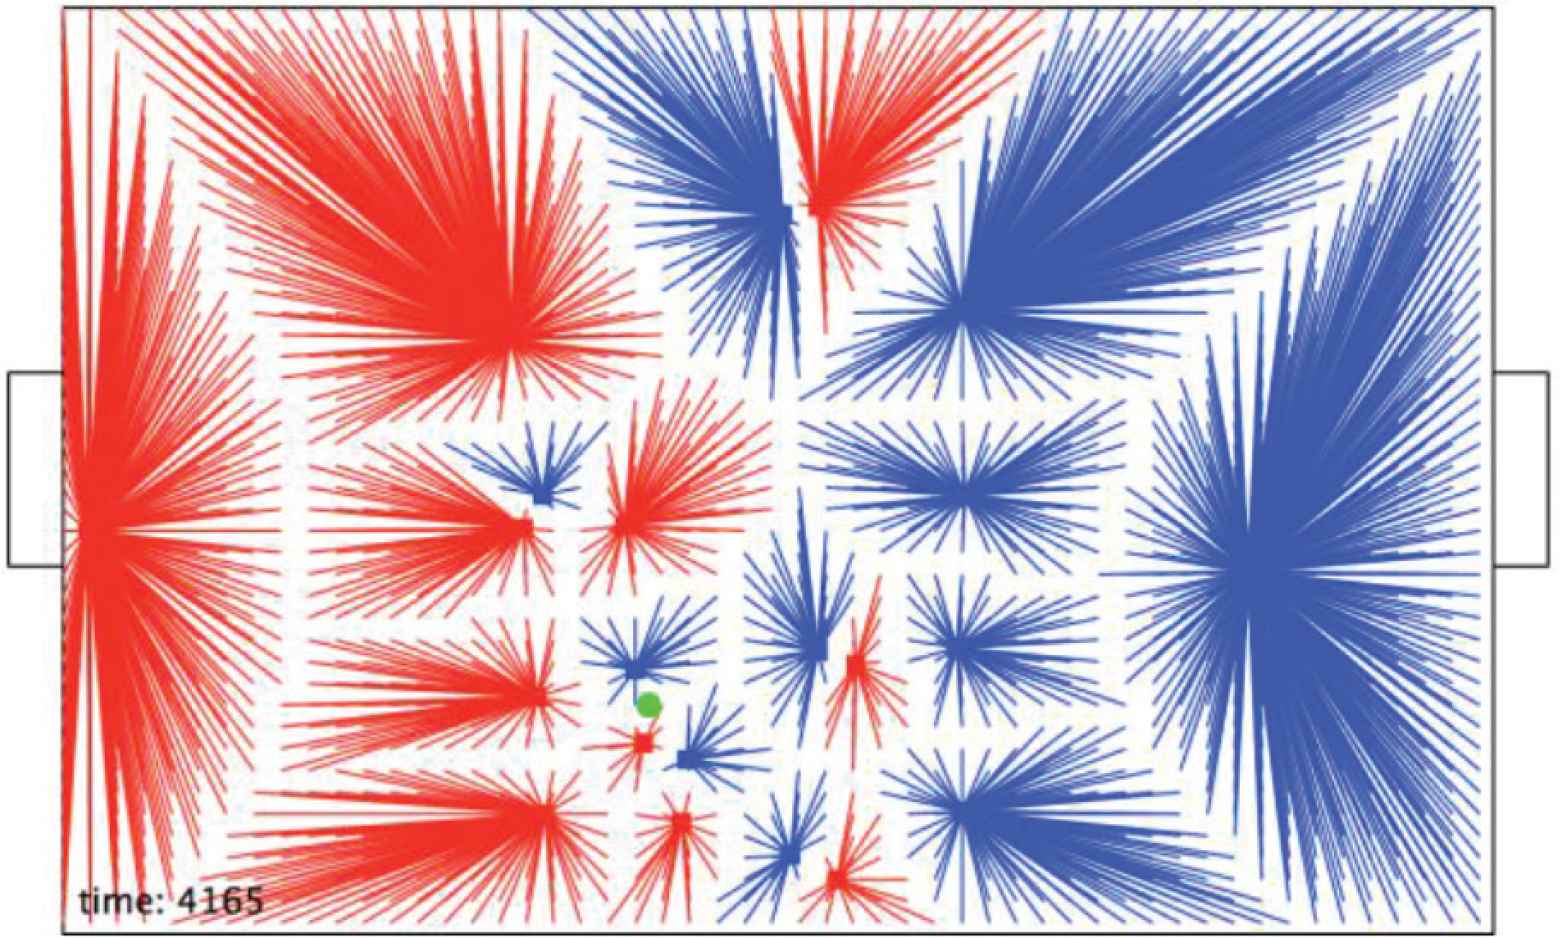
The pitch possession structure at t = 4165.
Following this pass, r7 dribbles the ball to F (Figure 11). During this time the structure <r9, b5, b8; Rc> has changed with r9 becoming closest to its target goal and b5 moving upwards – a very bad structure for blue!.
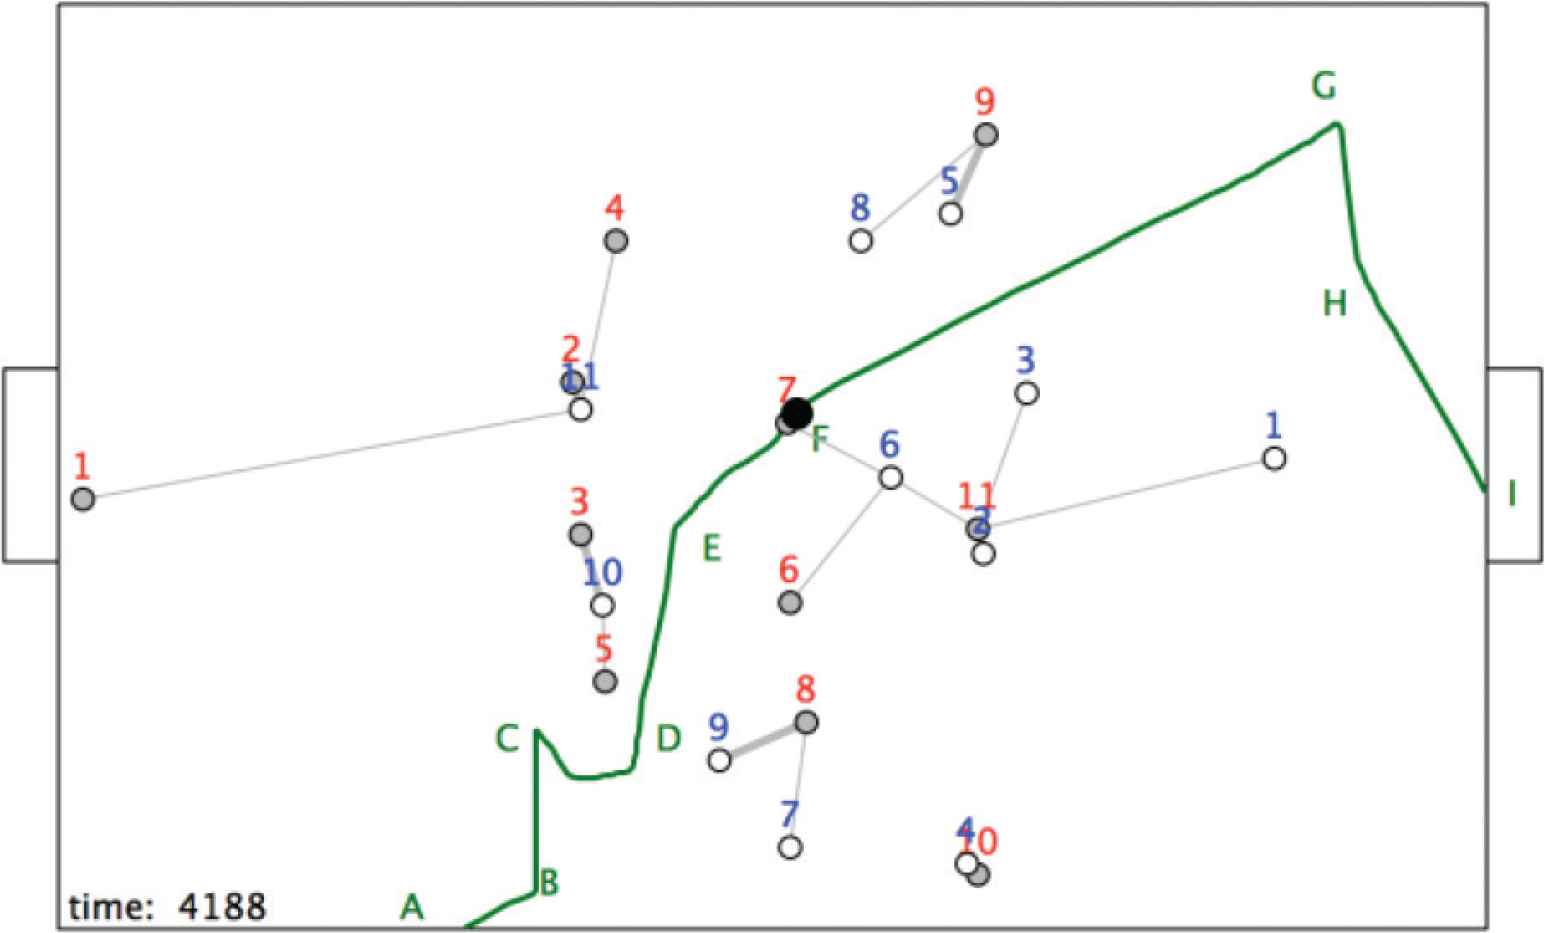
The position at t = 4188.
By moving in this way the blue team has allowed a “corridor” to emerge, shown as a yellow triangle in Figure 12. This provides a space for the ball to be passed into an area controlled by r9. As shown in Figure 13, r7 takes this opportunity and passes the ball to r9 at G.
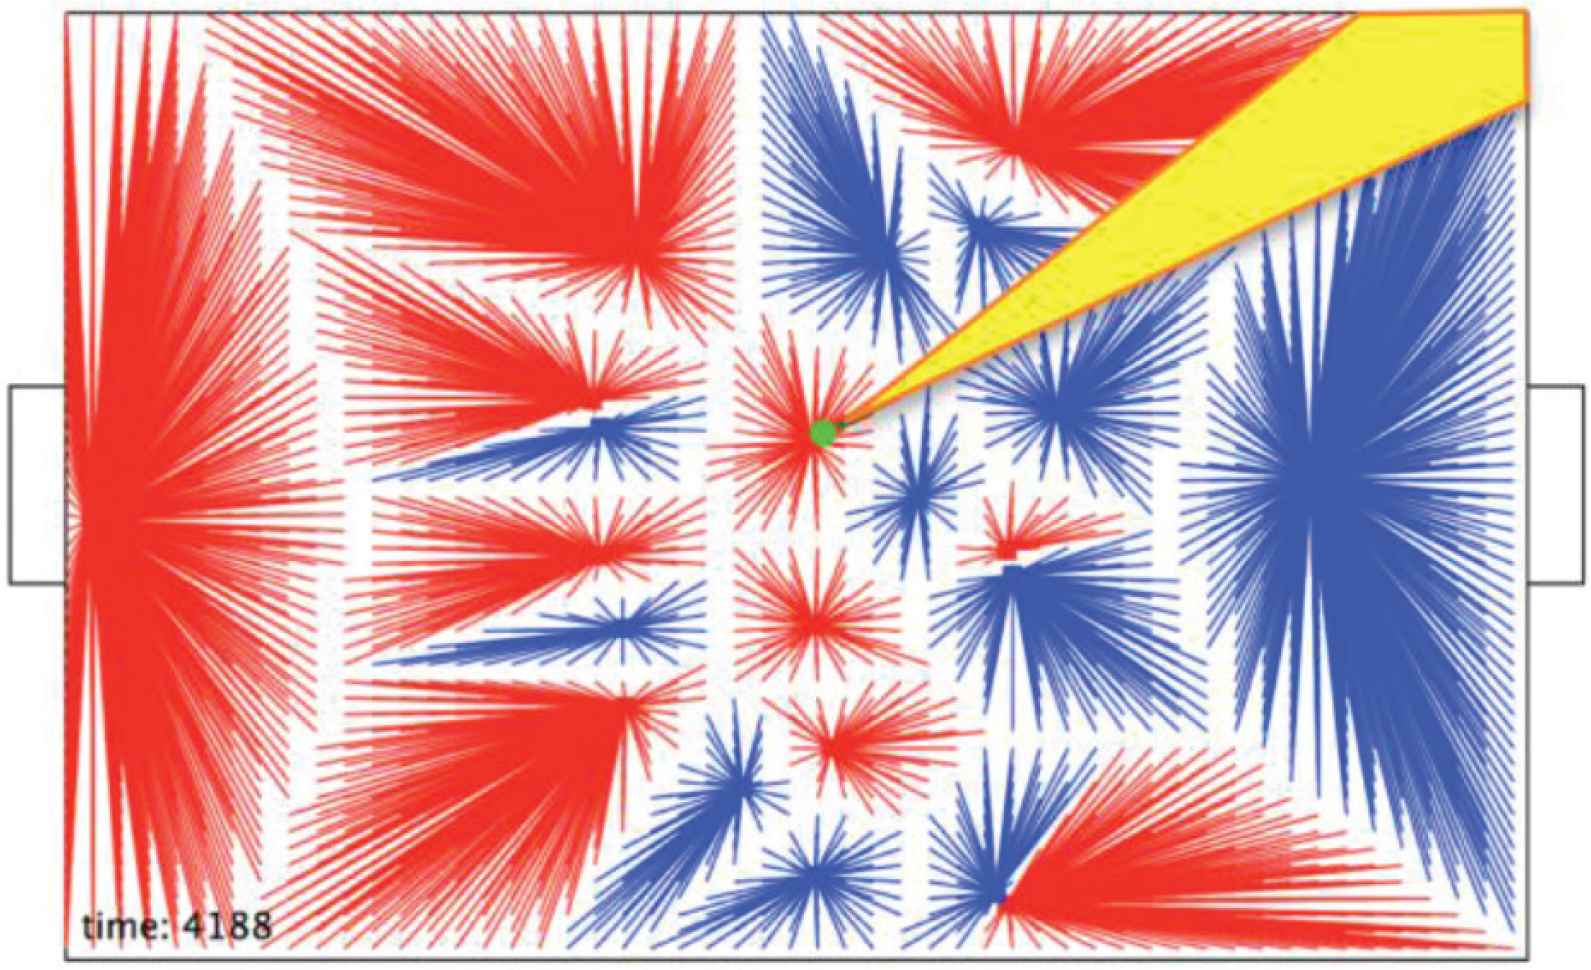
The pitch possession structure at t = 4188.
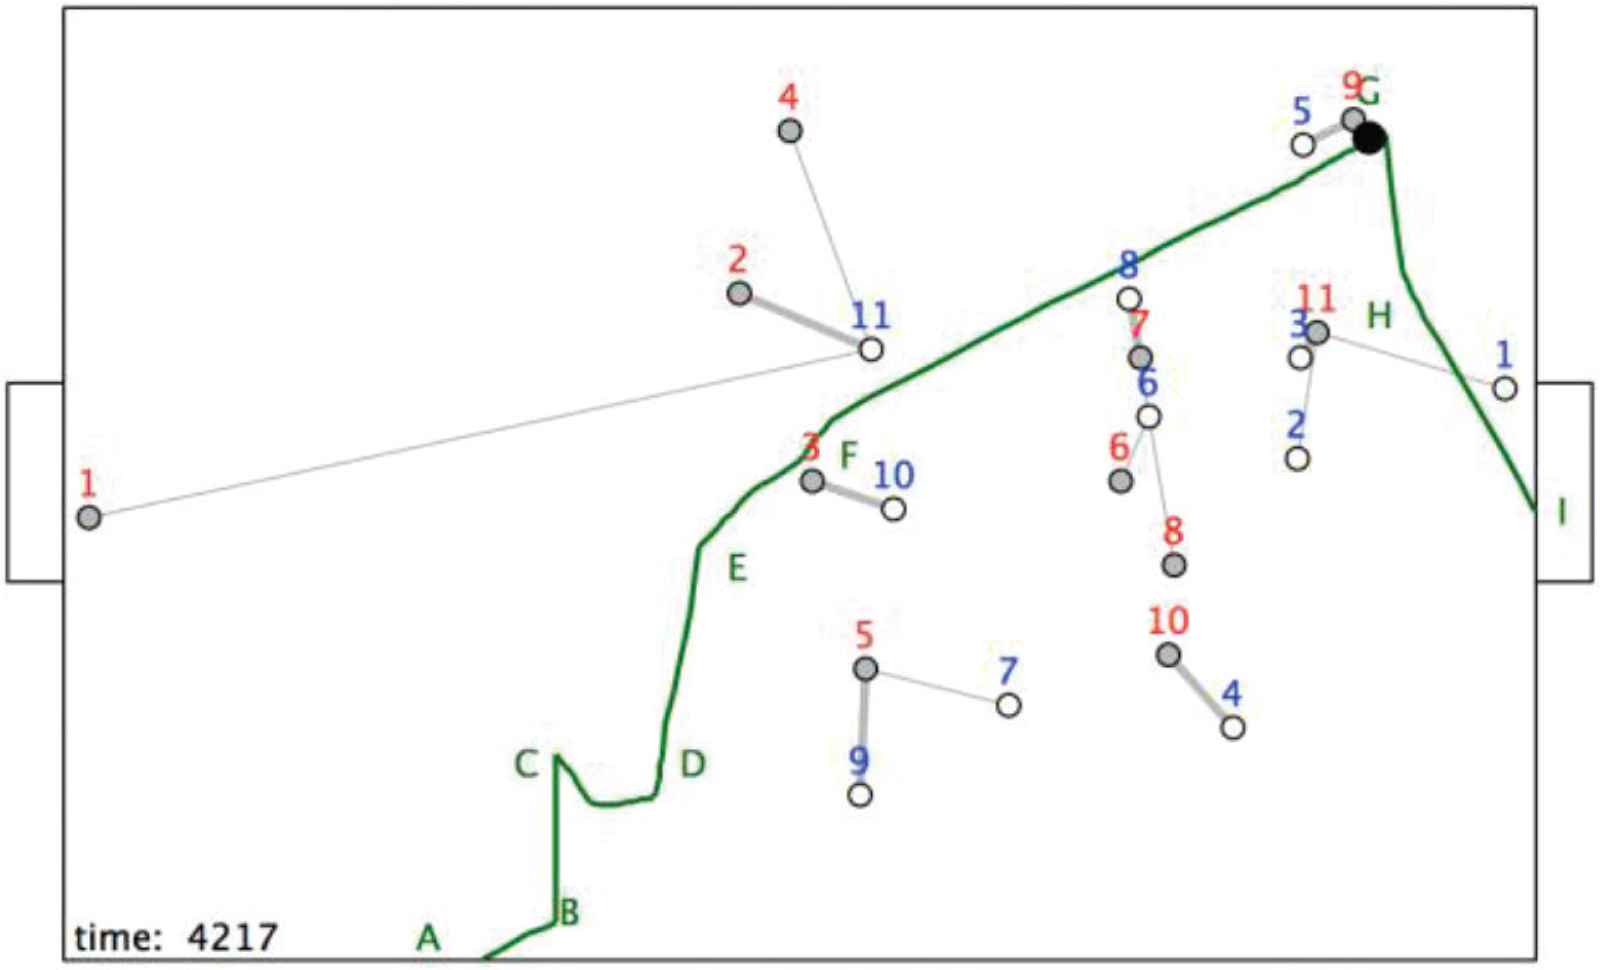
The position at t = 4217.
This involves r9 moving a considerable distance, but note too that r11 has broken free from its component at the centre of the pitch and has created space in front of the goal, connected to the space occupied by r9 and the ball (Figure 14).
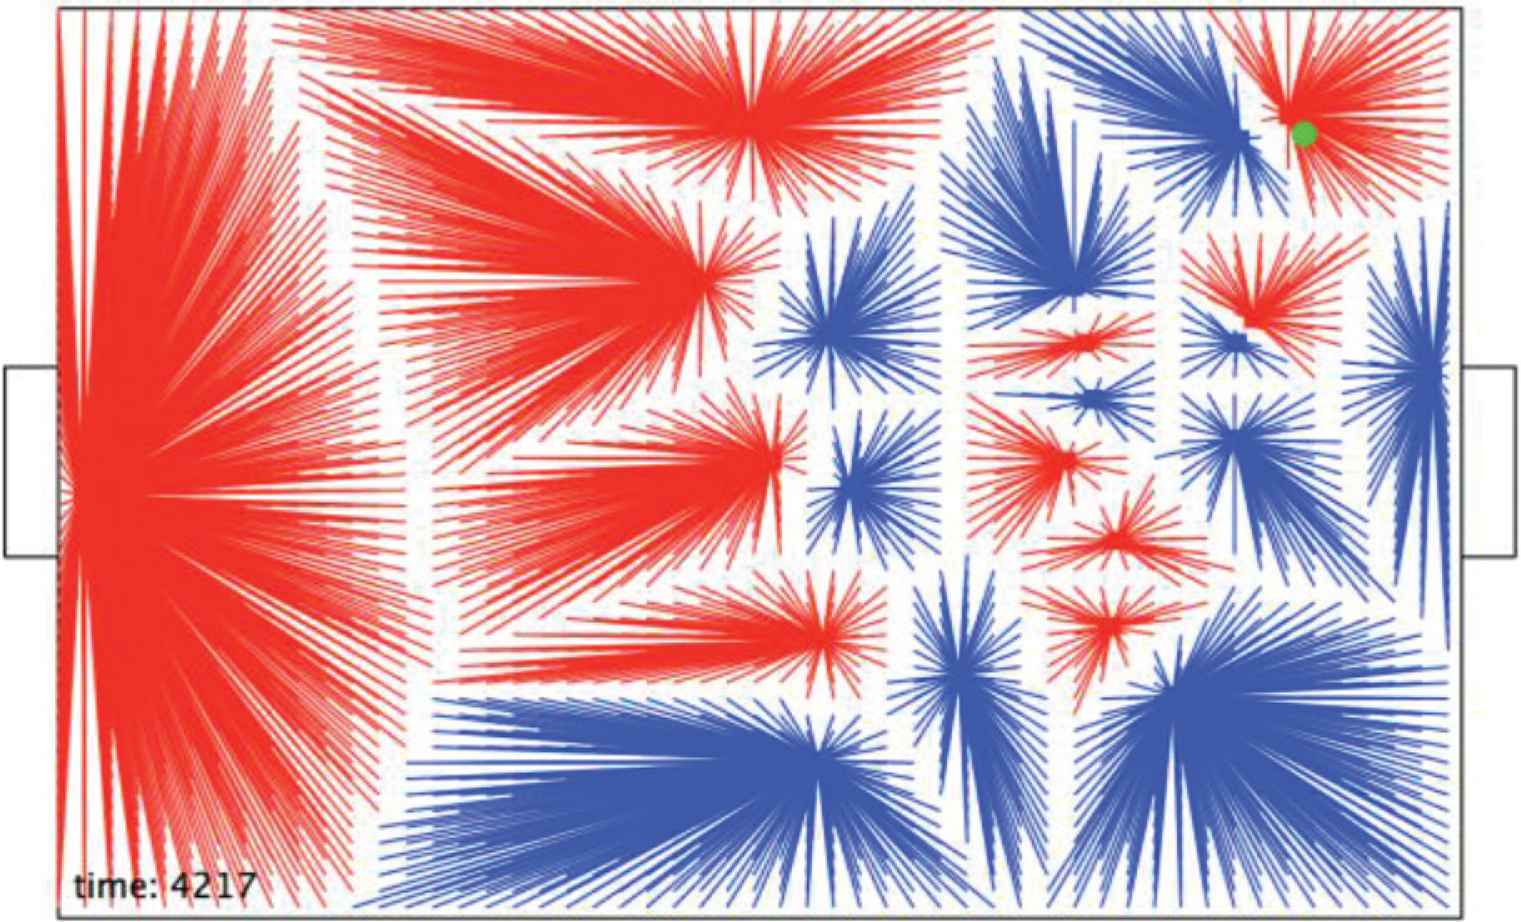
The pitch possession structure at t = 4217.
The ball is then passed from r9 to r11, who scores the goal, as shown in Figure 15.
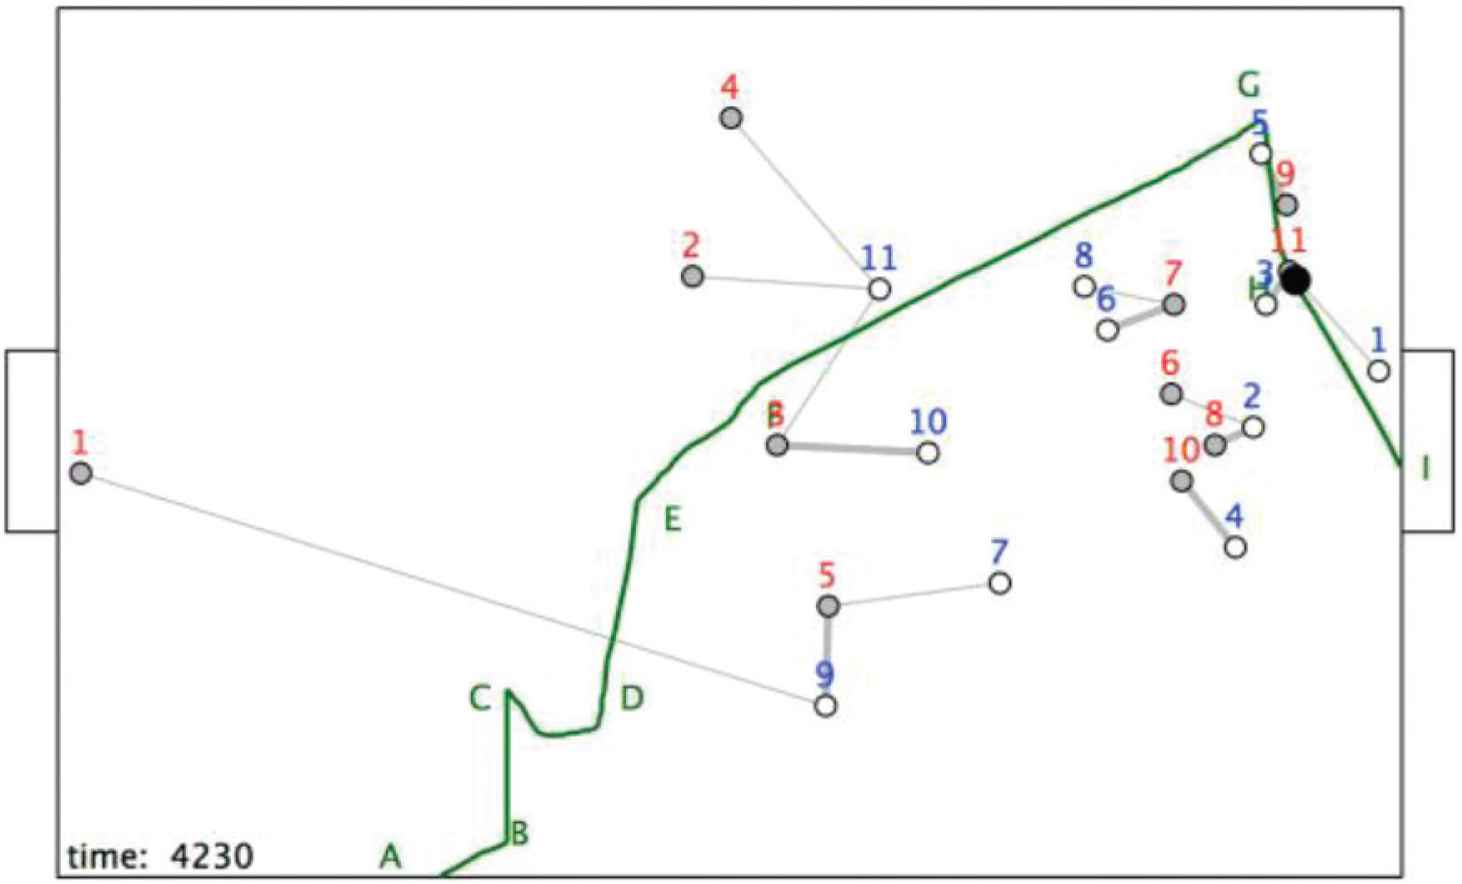
The position at t = 4230.
5. MULTIDIMENSIONAL HYPERSIMPLICES
Although the discussion in the previous section was based on the binary relations ‘r is closest to b’ and ‘b is closest to r’, the small networks induce n-ary relations on the players. Of course, n-ary relation can be defined that cannot be resolved into binary relations, as illustrated in Figure 16.
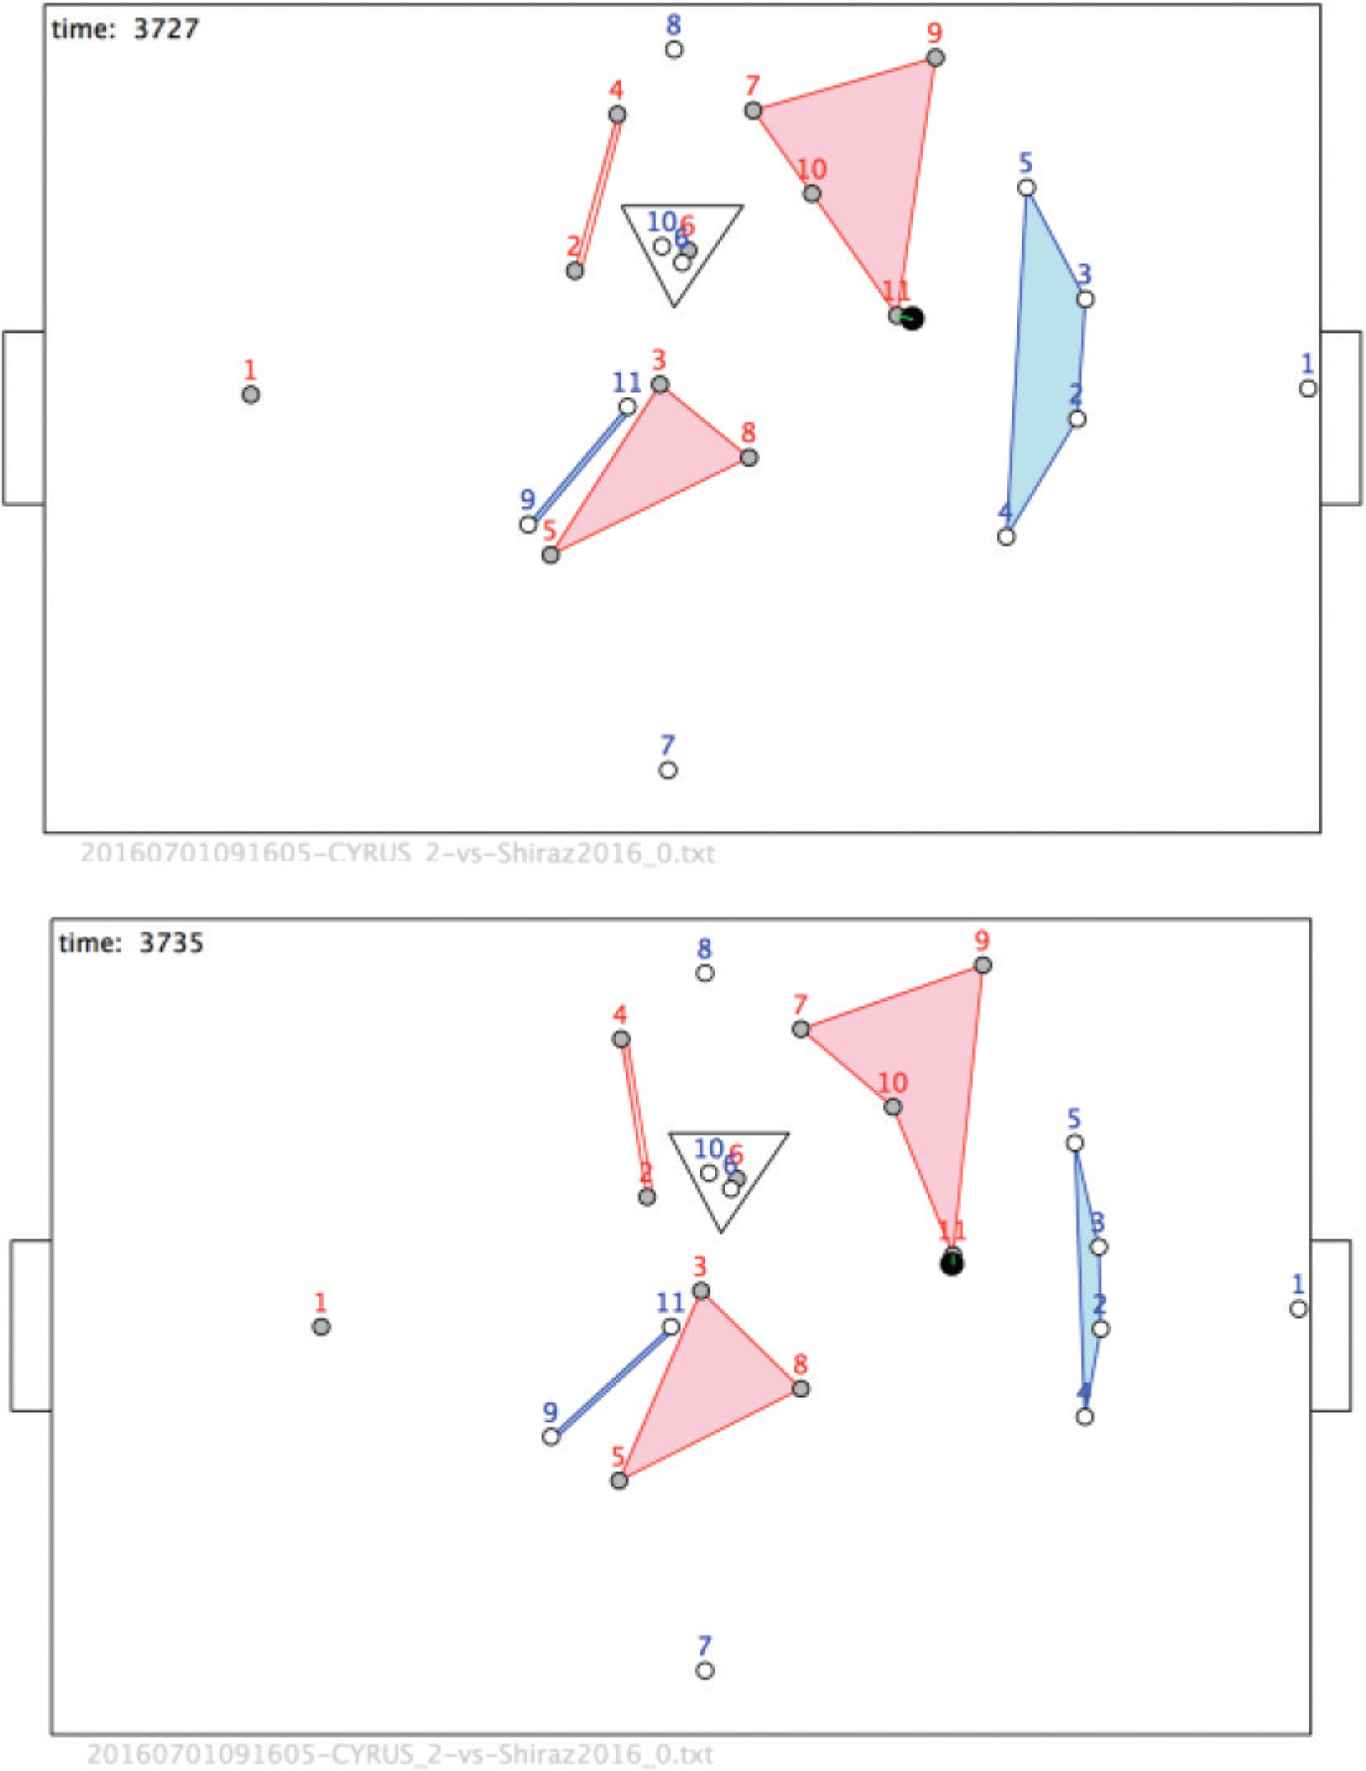
Configurations as multidimensional hypersimplices. (a) t = 3727. (b) t = 3735.
In this case a set of n players is said to be R-related if they form a polygon containing no opponents. For example, <r7, r9, r10, r11; R> is shown as a pink polygon at t = 3727. These structures are remarkably enduring in time, sometimes lasting many ticks of the clock. However, inevitably the relations change and new structure emerge. Structures of particular importance are the ‘tight’ configurations of opponent players, as illustrated by the triangle <r6, b6, b10; R>. Such configurations occur frequently in the goal area and are often precursors to scoring goals.
6. CONCLUSION
It has been shown that configurations of soccer players in the context of areas of the pitch and it goals have a multidimensional representation as hypersimplices. This leads to three major research questions:
Research Question 1: Are some hypersimplices particularly disposed to scoring goals?
Research Question 2: Can the relevant n-ary relations of robot soccer be learned from historical games, or must they be formulated by humans?
Research Question 3: How can the multidimensional connectivity of hypersimplices be exploited to plan and control the evolutionary dynamics of robot soccer?
CONFLICTS OF INTEREST
The authors declare they have no conflicts of interest.
Authors Introduction
Prof. Jeffrey Johnson
 He received his PhD in Mathematics from Essex University in 1976. He is a Professor of Complexity Science and Design in the School of Engineering and Design at the Open University in the UK. He is a Past-President of the Complex Systems Society and Vice-President of the UNESCO UniTwin Complex Systems Digital Campus. He is a chartered mathematician and a chartered engineer.
Mr. Ruggero Rossi
 He received his M.Sc. in Economics of Networks and Innovation, magna cum laude from the University of Modena and Reggio Emilia in 2009, and a degree in Business Economics from the University of Modena and Reggio Emilia, Faculty of Economics and Business. He is a research student in the School of Engineering and Innovation at the Open University in the UK.
REFERENCES
Cite this article
TY  - JOUR
AU  - Jeffrey Johnson
AU  - Ruggero Rossi
PY  - 2019
DA  - 2019/12/23
TI  - Dynamic Structures for Evolving Tactics and Strategies in Team Robotics
JO  - Journal of Robotics, Networking and Artificial Life
SP  - 203
EP  - 208
VL  - 6
IS  - 3
SN  - 2352-6386
UR  - https://doi.org/10.2991/jrnal.k.191203.005
DO  - 10.2991/jrnal.k.191203.005
ID  - Johnson2019
ER  -