
Macro- and Micro-mechanical Properties of the Ovine Aorta: Correlation with Regional Variations in Collagen, Elastin and Glycosaminoglycan Levels
- DOI
- 10.2991/artres.k.191114.003How to use a DOI?
- Keywords
- Aorta; regional variations; micromechanical properties; biochemical properties; thoracic; abdominal
- Abstract
Aortic diseases are a significant cardiovascular health problem and occur in different ways across the vascular tree. Investigation of the mechanical properties of the aorta is important for better understanding of aortic diseases. In this study, the biomechanical and biochemical properties of the ovine aorta have been comprehensively mapped across different regions from the ascending to the abdominal aorta. We have determined the mechanical properties at the macro- (via tensile testing) and at the micro-scale (via oscillatory nanoindentation). Uniaxial tensile testing was conducted on circumferential strips for the ascending, upper thoracic region and upper abdominal region to determine physiological elastic modulus, tangent modulus at 0.5 strain, and the maximum elastic modulus. Nanoindentation was conducted on the medial layer (tissue cross-section) and intimal and adventitial face (longitudinal orientation) to determine the shear storage (G′) and shear loss modulus (G″). All of the measured mechanical properties increased with distance from the heart. For example, G′ increased by 237.1% and 275.3% for the intimal face and adventitial face, respectively. In parallel, collagen, glycosaminoglycans (GAG) and elastin levels were also measured across the entire length of the ovine aorta. The mechanical properties correlated with increasing collagen, and decreasing GAG and elastin. Collagen increased by 147.2% whereas GAG (−120.3%) and elastin decreased (−78.2%). These findings have relevance for developing mechanistic insight into aortic aneurysms and dissections.
- Copyright
- © 2019 Association for Research into Arterial Structure and Physiology. Publishing services by Atlantis Press International B.V.
- Open Access
- This is an open access article distributed under the CC BY-NC 4.0 license (http://creativecommons.org/licenses/by-nc/4.0/).
1. INTRODUCTION
Aortic diseases such as aortic aneurysms and dissections are a significant cardiovascular health problem. In the most recent statistical update from the American Heart Association, it is reported that aortic aneurysms were the primary cause for approximately 10,000 deaths and a contributing cause in more than 16,000 deaths in the United States [1]. Rupture abdominal aortic aneurysm is a leading cause of death in men over 65 years old [2], a problem exacerbated with the ageing population. It is for this reason that there is substantial interest in the biomechanical behaviour of the aorta [3–5]. Biomechanical studies can aid risk evaluation of aortic pathologies and ultimately aid surgical planning and clinical care [4,6].
Aortic diseases manifest in different ways across the vascular tree, for example, with Type A dissection being caused by a tear in the ascending aorta and Type B dissection occuring in the thoracic aorta. The abdominal aorta is more prone to aneurysm development than the thoracic aorta and it has been reported that around 75% of abdominal aortic aneurysms (AAAs) occur in the infrarenal region [7]. Given this clinical relevance, a number of studies have previously studied differences in composition and mechanical properties in different regions of the aorta. Early studies have demonstrated that elastin and collagen content varies along the length of the aorta. Amongst the pioneering work conducted by McDonald et al. [8] on the aorta, they were the first to show that in the canine aorta, the elastin:collagen ratio was significantly higher in the ascending aorta as compared with the lower abdominal aorta. A similar trend was reported by Grant [9] who examined aortas from a number of different species. These trends also complement another early study that demonstrated that the rates of collagen and elastin synthesis, in tissue isolated from neonatal porcine aorta, differ as a function of distance from the heart [10].
In terms of biomechanical variation across the aorta, the biaxial biomechanical behaviour of the porcine aorta has recently been quantified in three regions: ascending, descending and abdominal. In that work, Peña et al. [5], found that the aorta was stiffer in the ascending region than the distal region. In the murine aorta, the longitudinal stretch ratio, which is a parameter that describes the ratio of the aorta length during loading and zero-stress, has been found to increase linearly from the ascending aorta to the distal abdominal aorta [11].
By combining biomechanical and biochemical or microstructural evaluation of the same tissue, several studies have attempted to correlate the variation in mechanical properties with the composition in different regions of the aorta. Haskett et al. [12] combined biaxial testing with microstructural imaging via small angle light scattering in the human aorta and found a progressive reduction in compliance from the proximal to the distal aorta, with the difference being more pronounced with age. Overall, they reported statistically significant regional differences both in terms of its microstructure and biomechanical response. Sokolis et al. [13] used tensile testing and histological quantification of collagen and elastin to examine regional variations in the porcine aorta. They found that there were good correlations between the elastic modulus and either elastin or collagen across the different regions [13].
There is still a gap in the literature in terms of micromechanical behaviour across different regions of the aorta. Although the alterations in the macroscopic biomechanical behaviour correlate well with regional microstructural changes as shown in previous studies [12,13], to the best of our knowledge, no previous study has combined micromechanical properties of aortic tissue with regional differences in biochemical composition. Further, while most previous work considers regional variation of elastin and collagen, glycosaminoglycan (GAG) distribution across the aorta has not previously been measured. The important role of GAGs has been presented in the literature in arterial stiffening [15], as well as in thoracic aortic aneurysms and dissections [16].
In this study, we map the mechanical properties across the entire length of the ovine aorta at the macro- and micro-scale. Our micromechanical data collected with oscillatory nanoindentation are compared with conventional uniaxial tensile testing data. The mechanical property data are compared with collagen, elastin and GAG levels measured across the different regions.
2. MATERIALS AND METHODS
2.1. Ovine Tissue Preparation
Six fresh ovine aortas (Ovis aries, 6–8 months, males) were obtained from a local butcher on the day of slaughter and immediately transferred to the laboratory for testing. Three of the aortas were used for nanoindentation testing and three for uniaxial tensile testing. Any excess connective tissue and adipose tissue was removed from the aortic surface.
For uniaxial testing, the aorta was collected from the following three regions: the ascending, upper thoracic aorta and upper abdominal regions. Three circumferential strips were prepared per region which had a width of 4 mm and were cut using a double-bladed tool. In total, there were 27 aortic strips. Each strip had a testing length of 12 mm after clamping. All aortic specimens were snap frozen for storage at a temperature of −80°C and thawed at room temperature prior to testing.
For nanoindentation, testing was conducted in three orientations: longitudinal (adventitial and intimal face) and circumferential (central media layer). For the longitudinal orientation, the entire aorta was split into nine sections, separated by 2 cm in length from the aortic root to the celiac artery region. Each of these sections was used to create three 5 mm circular biopsy punches (three biopsies per section, a total of 81 biopsies). For the circumferential orientation, the aorta was subdivided into three main parts: the ascending aorta, upper thoracic aorta and upper abdominal aorta, matching the uniaxial testing. Three samples were tested at the central medial layer for each location. Figure 1 summarises the tissue preparation and testing method that was conducted for nanoindentation and tensile testing (Section 2.2).
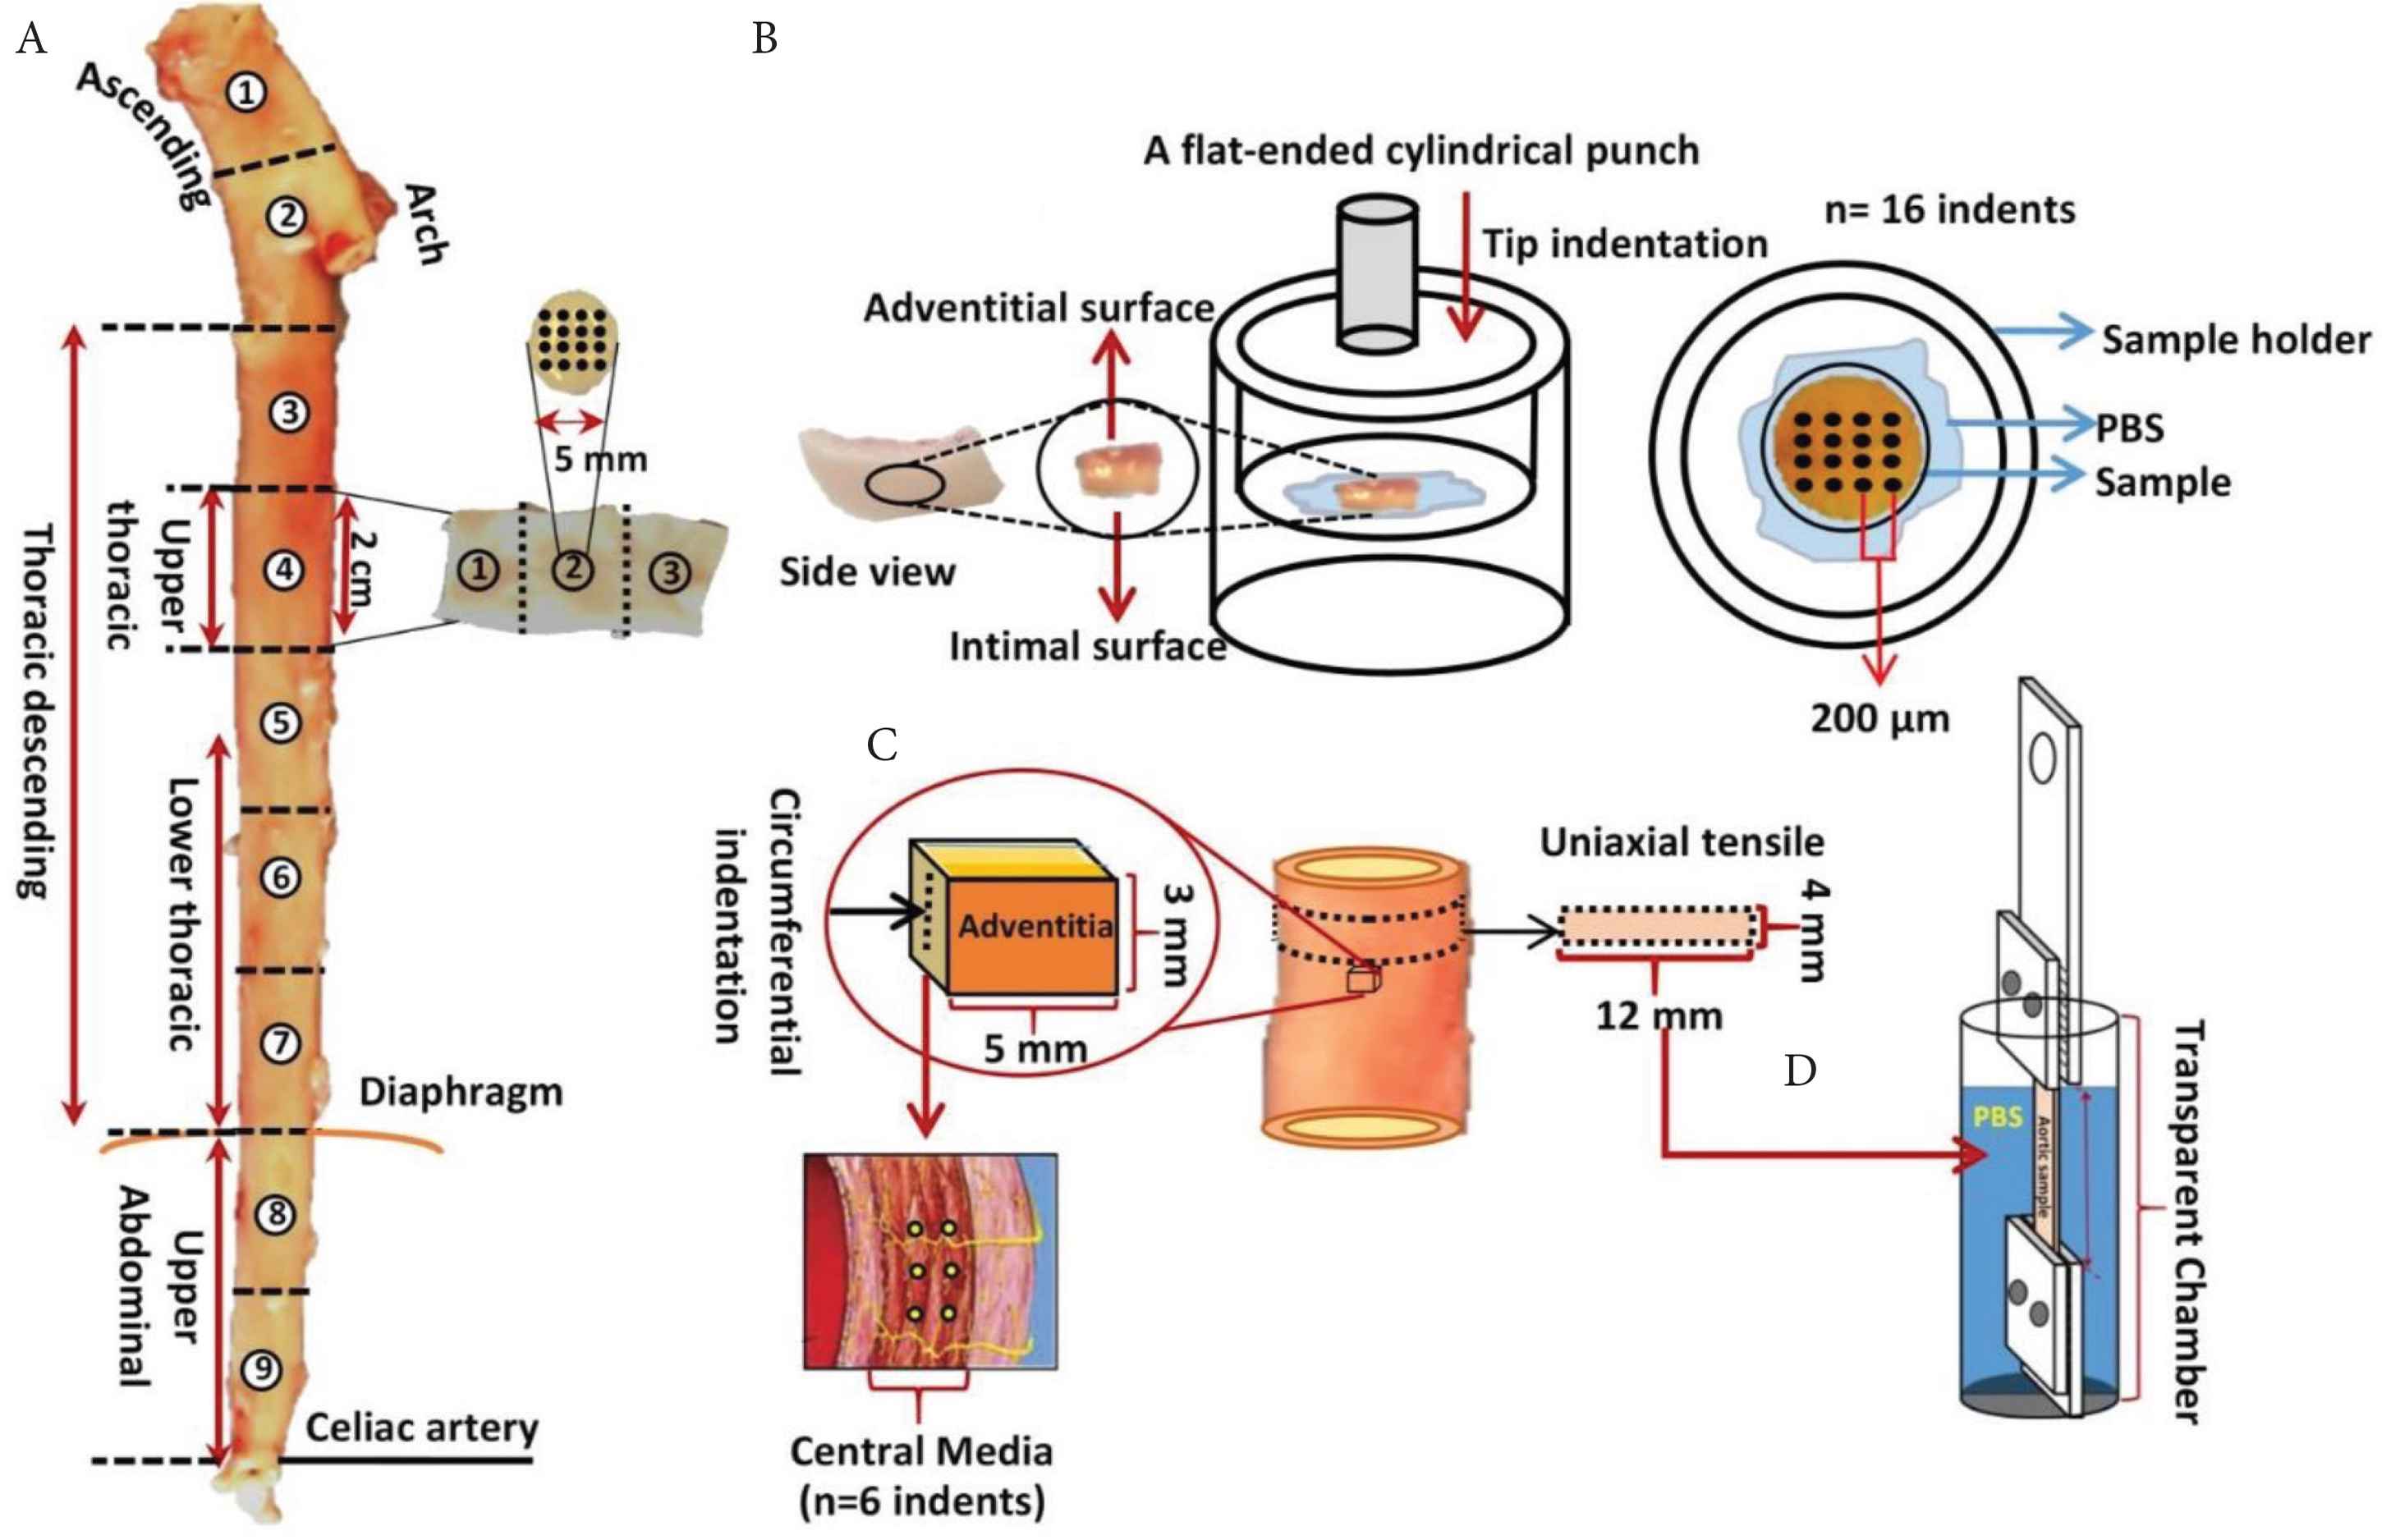
Schematic representation of the experimental approach: (A) The aortic locations where tissue was taken from for nanoindentation testing. Samples were extracted from aortic root through to the celiac artery. (B) Schematic representation of side view of aortic biopsy specimen with adventitial and intimal faces marked. The specimen holder and the orientation of the flat-ended cylindrical punch is also shown. (C) Schematic representation of circumferential indentation of aortic sections. (D) Schematic diagram of the tensile set up with the mechanical clamps and sample for testing hydrated with PBS in the liquid cell.
2.2. Biomechanical Testing
2.2.1. Uniaxial tensile testing
Uniaxial tensile testing was performed on an Instron 3366 series instrument (Instron, Norwood, MA, USA). The machine was set up using a 10 N load cell with a specified accuracy of 0.025 N. The thickness of the extracted specimens was measured using a digital Vernier calliper with 10 μm accuracy and average values were obtained from five measurements along the length of each strip. The strip was held between two mechanical clamps with a notched surface (Figure S1A). To prevent slippage, sand paper was used between the specimen and clamps. Following this, the clamped aortic strip was immersed in a phosphate buffered saline (PBS) bath to maintain hydration of the tissue during testing (Figure S1B). Ten cycles were used to obtain repeatable behaviour from the tissue at a rate of 10 mm/min. The rate was selected based on a previous study [17]. Subsequently, the aortic strip was loaded until failure at the same rate of 10 mm/min.
Applied force and elongation were recorded for each test. The true stress and strain was determined using the approach presented in the literature, with the assumption that the tissue is incompressible [17,18]. The following parameters were derived from the data: physiological elastic modulus (PE), tangent modulus (TM) at 0.5 strain, the maximum elastic (ME) modulus and failure stress. To calculate the PE, we have assumed that the aortic pressure range in sheep is 60–90 kPa, based on literature [19,20]. Laplace’s law was used to compute circumferential stress based on this pressure range. The PE was defined as the slope of the stress–strain curve within this pressure range. The TM at 0.5 strain was obtained from the gradient of the stress–strain curve at this strain value. ME was obtained from each true stress–strain curve as the maximum slope before pre-failure stress (Figure 2).
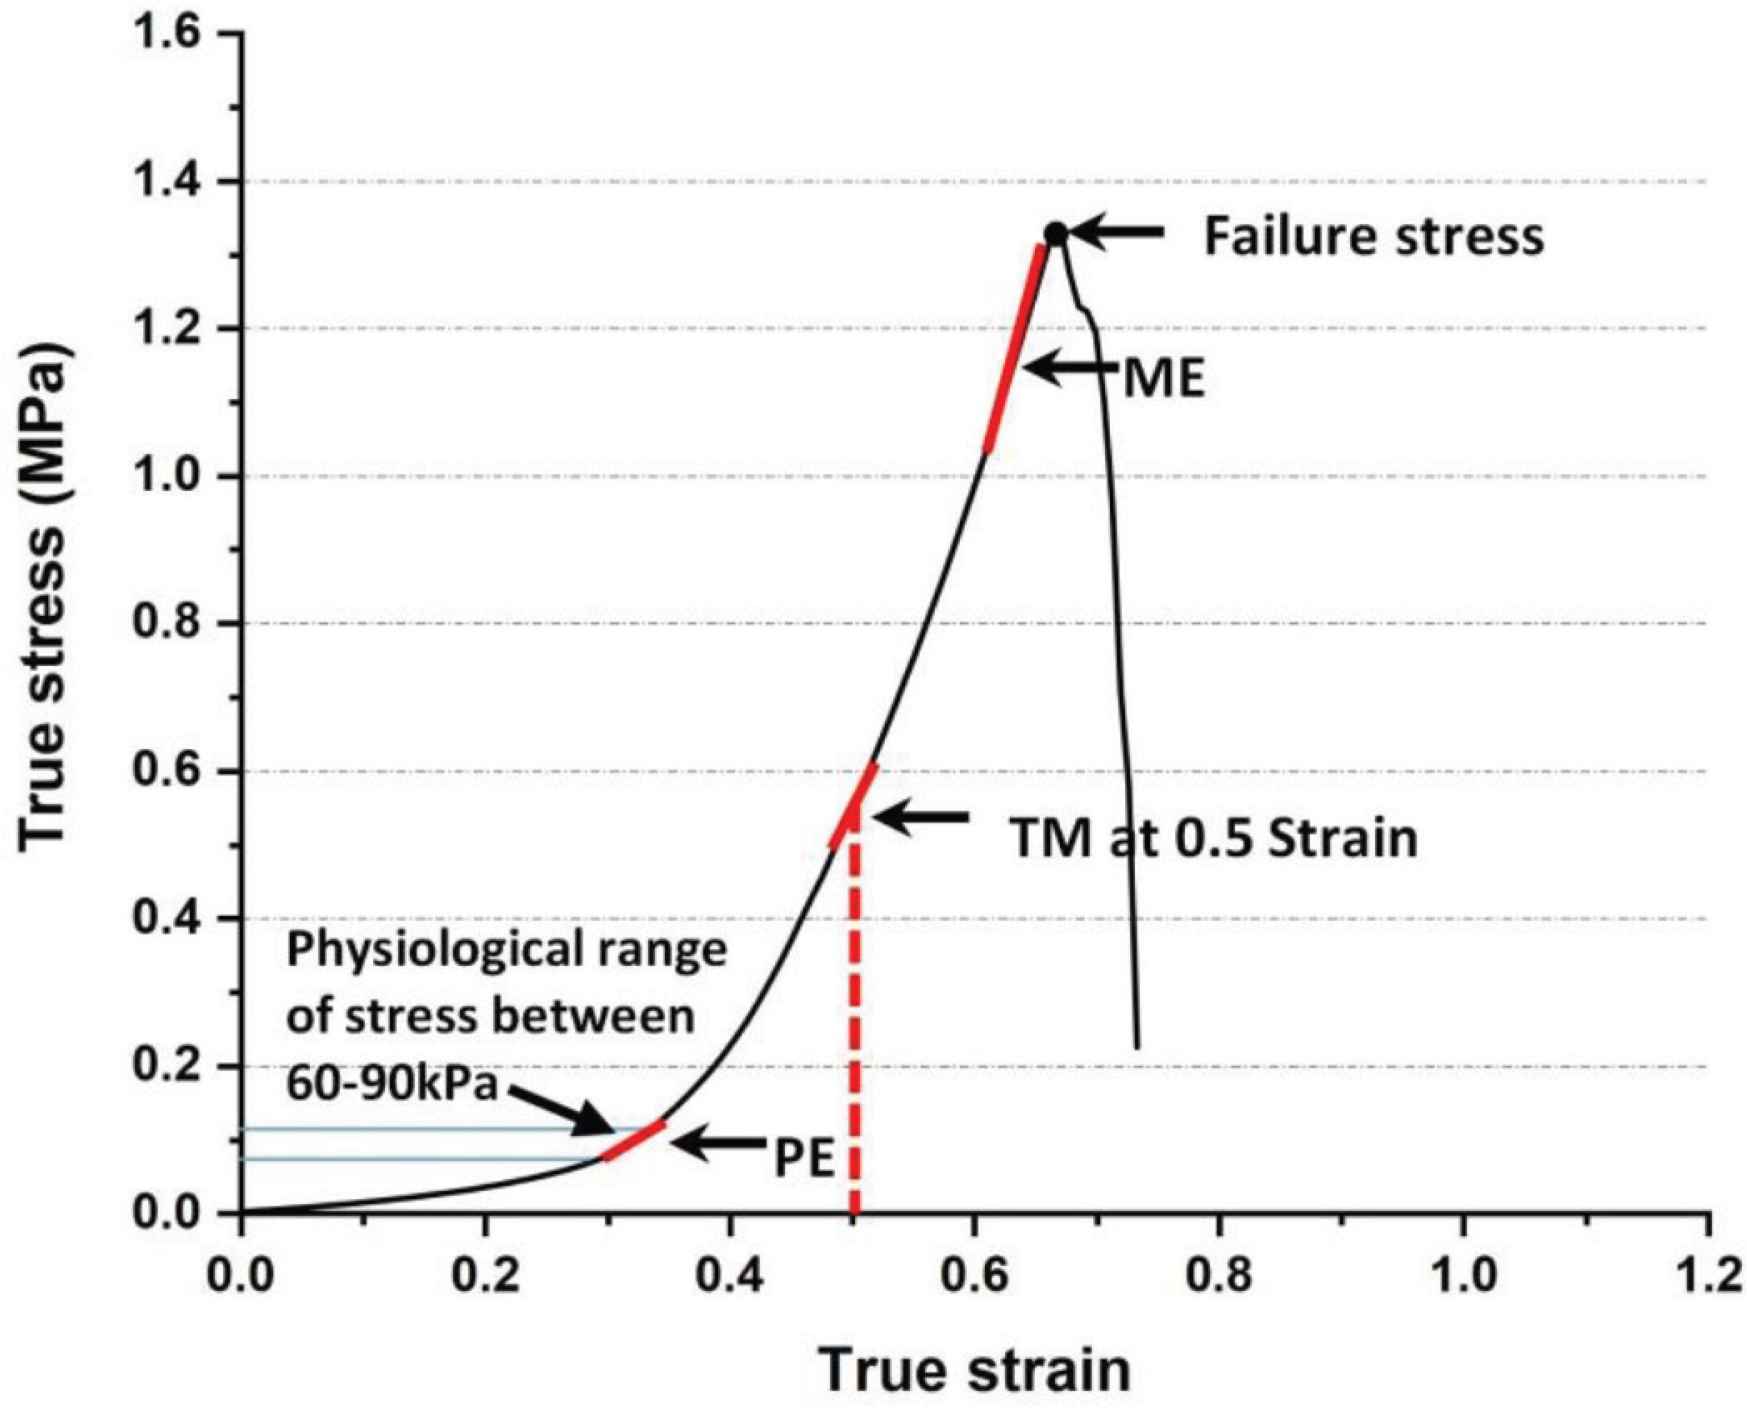
Typical stress–strain relationship showing the points on the curve which were used to calculate physiological elastic modulus (PE), tangent modulus (TM) at 0.5 strain, the maximum elastic modulus (ME) and failure stress.
2.2.2. Nanoindentation
Oscillatory nanoindentation was performed with a KLA-Tencor Nanoindenter G200 system equipped with a DCM-II head (CA, USA) to characterise the micromechanical properties of ovine aortic tissues. The nanoindentation system and methodology used in our experiment was similar to that presented in detail previously [21]. In summary, a 100 μm diameter flat-ended cylindrical punch (Synton-MDP Ltd., Nidau, Switzerland) was mounted on the DCM II head [21]. The samples were kept hydrated in a liquid cell with PBS. For the longitudinal orientation, 16 oscillatory indentations were applied to the surface of both sides for the same sample: the inner (intima layer) and outer side of the tissue (adventitial layer). For the first biological replicate, the intimal face was tested first followed by the adventitial face. For the second replicate, the adventitial face was tested first followed by the intimal face. Finally, for the third biological replicate, the intimal face was tested first followed by the adventitial face (Figure 1B). For the circumferential direction six indents were made at the central media. A pre-test compression of 8 μm was used with all tests conducted at the resonant frequency of the indenter (110 Hz) and with a 500 nm amplitude vibration. Following each indentation, the tip was cleaned by driving it into double-sided Scotch tape (3M, MN, USA) to avoid any contamination on the subsequent indent location. The tape was mounted on an adjacent sample puck.
To obtain the shear storage (G′) and shear loss modulus (G″) as well as the loss factor
The shear loss modulus (G″) depends on contact damping (Cw) and can be given by:
2.3. Biochemical Analysis
Wet tissues weighing 7.5 mg were used to determine elastin levels and the remaining tissue was weighed, finely chopped and digested with papain (P4762: Sigma-Aldrich, Dorset, UK) to quantify the collagen and GAG levels. Collagen, elastin, and GAG level were expressed as micrograms per milligrams of wet aortic tissue weight.
Collagen content of the tissue was determined by measuring hydroxyproline concentration in the tissue using 1,3-dimethylbutylamine dye [24,25]. GAG content was measured using dimethyl methylene blue assay [26]. Elastin was measured using Fastin™ Elastin Kit (Biocolor, County Antrim, United Kingdom). Samples were analysed in triplicate for collagen and GAG content, and in duplicate for elastin content according to manufacturer’s instructions. In total, there were 81 samples from the three ovine aorta.
2.4. Statistical Analysis
Statistical analysis was performed using OriginPro version 9 (OriginLab, Northampton, MA, USA). All data are presented as mean values ± standard deviation (SD). One-way ANOVA with post-hoc Bonferroni was used to analyse the statistical variation between the ascending region, upper thoracic region, and upper abdominal region (uniaxial testing). Following this, One-way ANOVA with post-hoc Bonferroni was also performed to examine intra-group variablity both for biomechanical properties (G′, G″ and tan δ) and biochemical properties (collagen, GAG and elastin) and inter-group variation (for the distance from heart), as presented in the Supplementary Material (Tables S1–S6). Bivariate correlation with Pearson product-moment correlation coefficients were calculated with simple linear regression analyses. It was performed to define the relationship between biomechanical properties from nanoindentation (G′, G″ and tan δ) and biochemical properties (collagen, GAG and elastin level) with distance from the heart, as well as correlation between biomechanical properties and biochemical properties. A p-value below 0.05 was considered as statistically significant.
3. RESULTS
3.1. Regional Variations in the Uniaxial Behaviour of the Aorta
True stress–strain data for the three regions are shown in Figure 3. The expected non-linear behaviour is clearly visible with increasing strain. There was a clear difference in the curves for each region with the upper abdominal aorta exhibiting the stiffest behaviour at the higher strains.
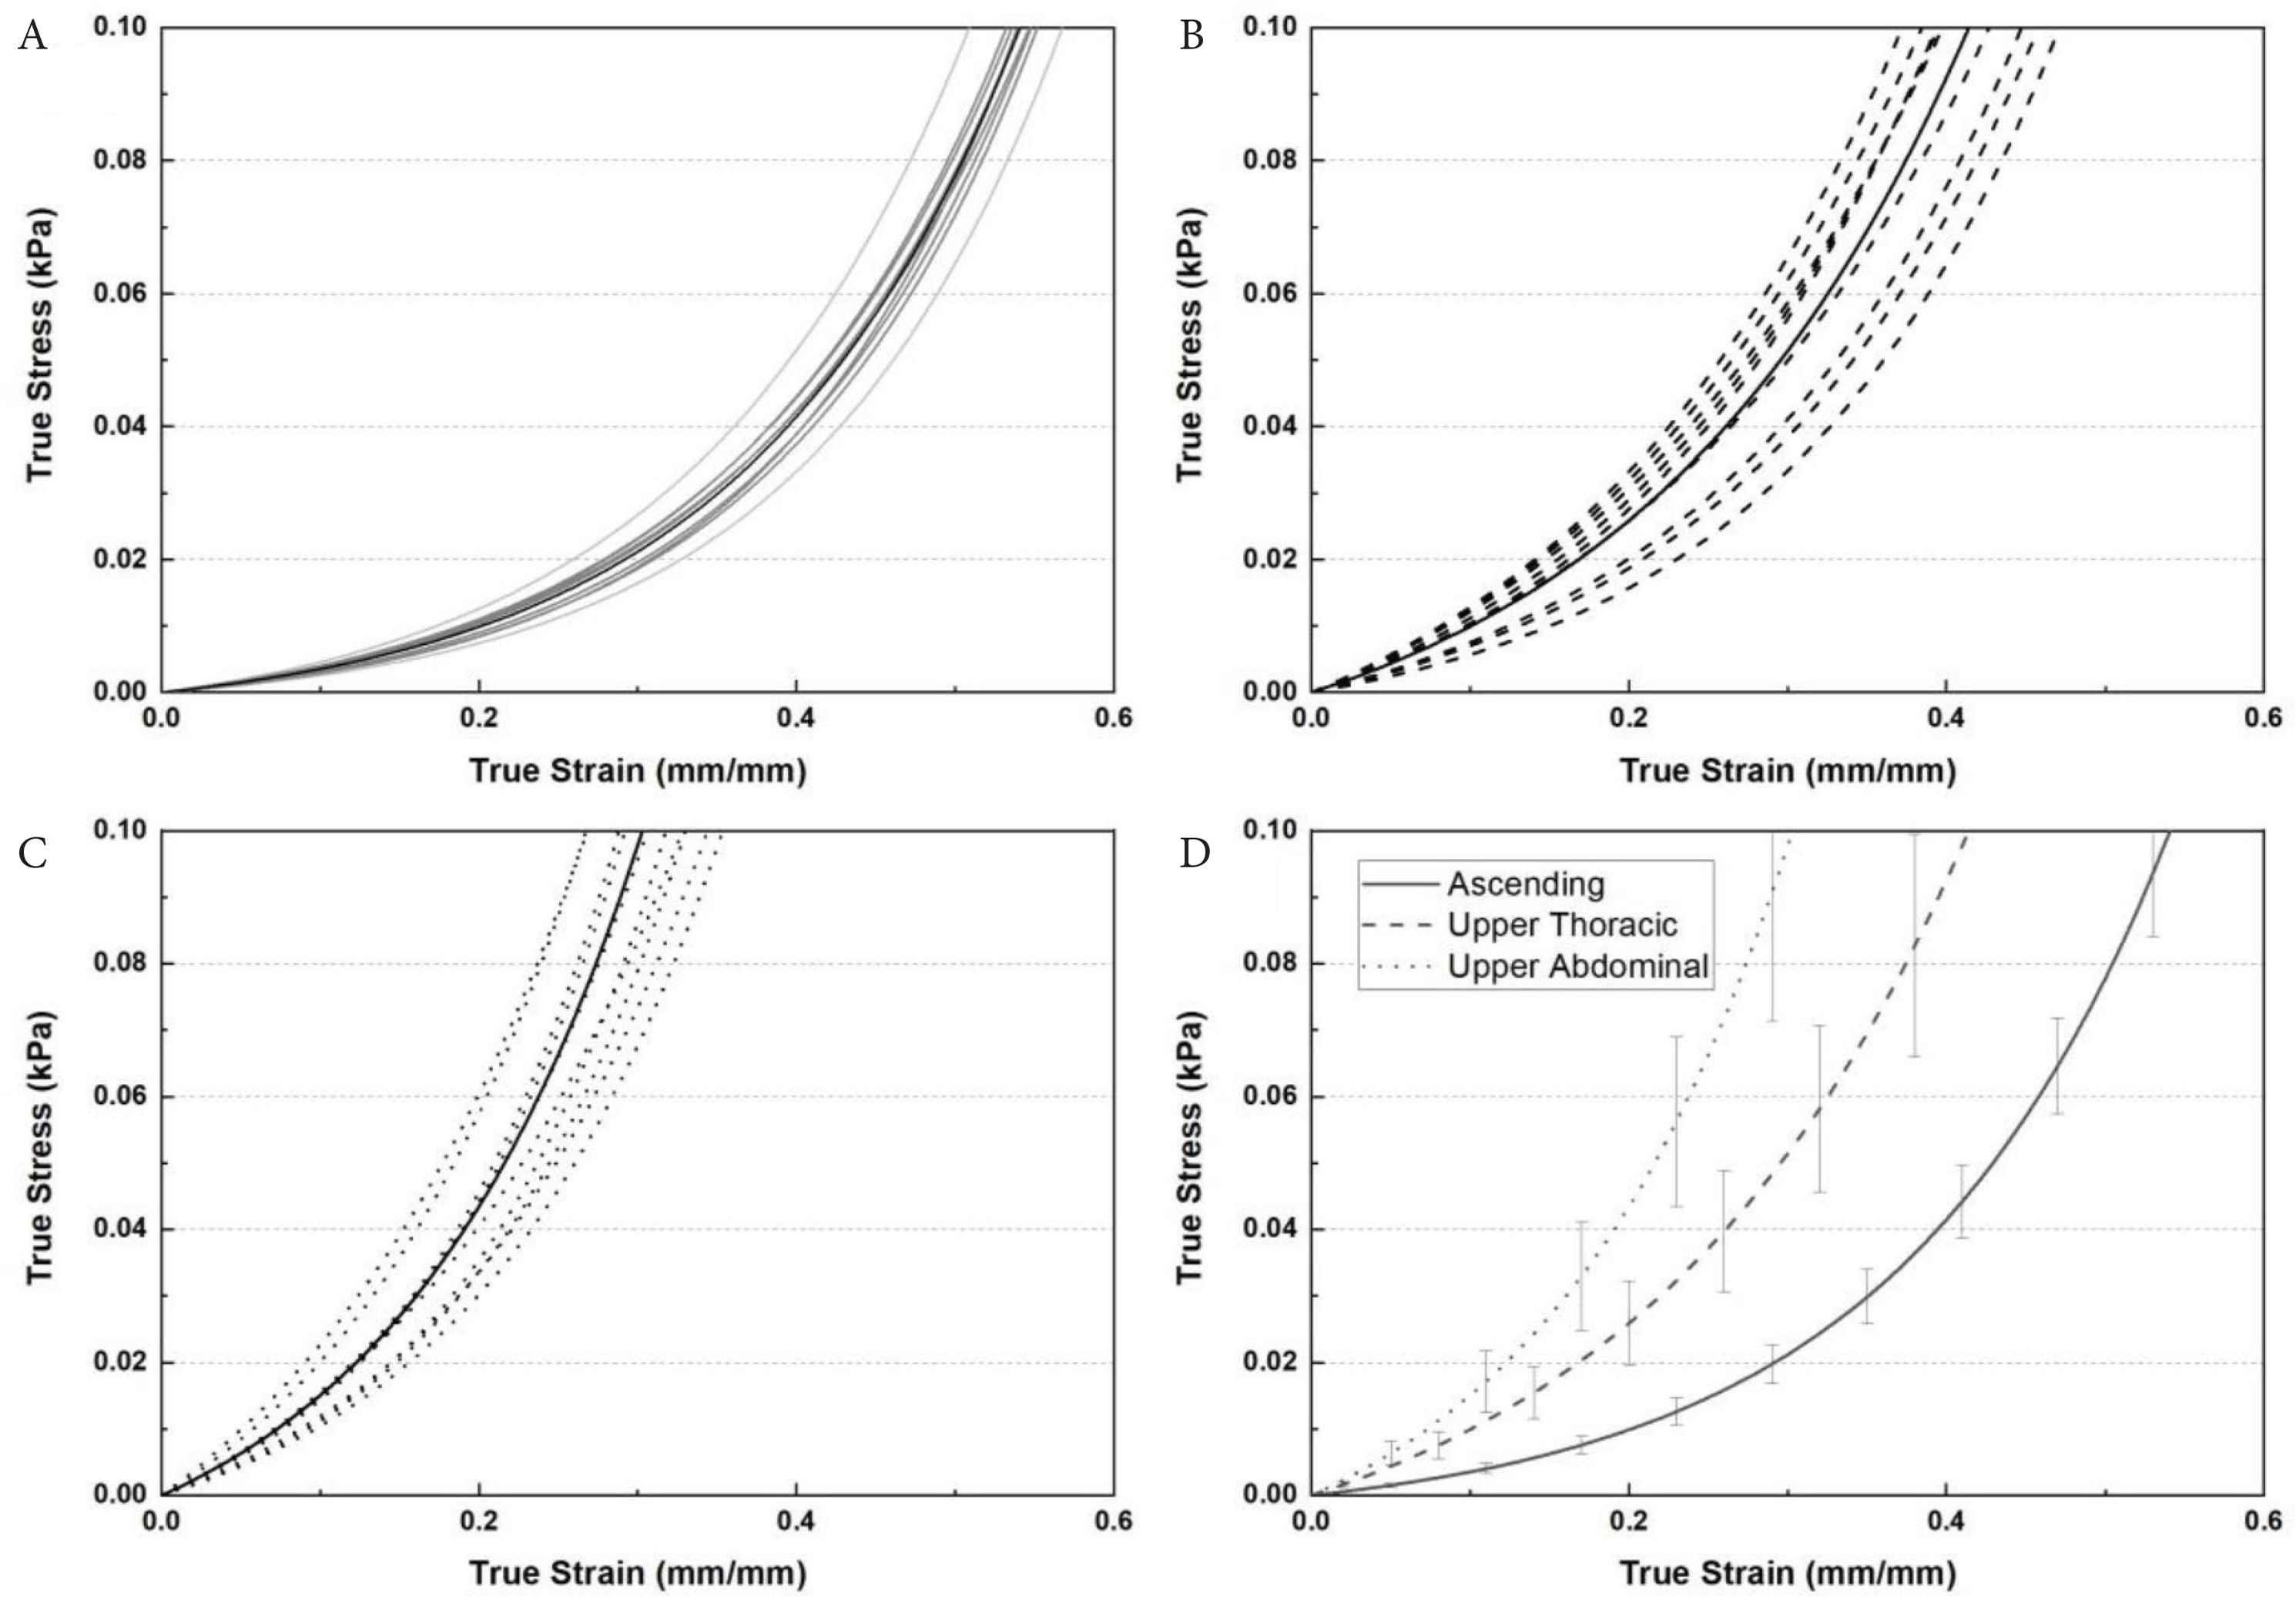
The true stress–strain relationship extracted from: (A) ascending, (B) upper thoracic region, (C) upper abdominal region and (D) comparison of average stress–strain behaviour for the three main regions (n = 9 samples per region).
There were no statistically significant differences in PE when comparing the ascending and upper thoracic regions (p = 0.2); however, significant differences were observed between the ascending and upper abdominal regions (p = 7.6 × 10⁻¹¹) and the upper thoracic and upper abdominal regions (p = 2.7 × 10⁻⁹) (Figure 4A). For the TM at 0.5 strain, there was a significant difference between the ascending and upper thoracic regions (p = 0.04), ascending and upper abdominal (p = 4.5 × 10⁻¹³), as well as upper thoracic and upper abdominal regions (p = 3.0 × 10⁻¹¹) (Figure 4B). The differences in ME were also statistically significant across the regions for ascending and upper thoracic region (p = 1.1 × 10⁻⁵), upper thoracic and upper abdominal regions (p = 0.01) and for ascending and upper abdominal regions (p = 8.2 × 10⁻⁹), (Figure 4C). The failure stress in different regions also showed a significant difference between the ascending, upper thoracic and upper abdominal regions (p < 0.0001) (Figure 4D), with the upper abdominal region exhibiting the highest values.
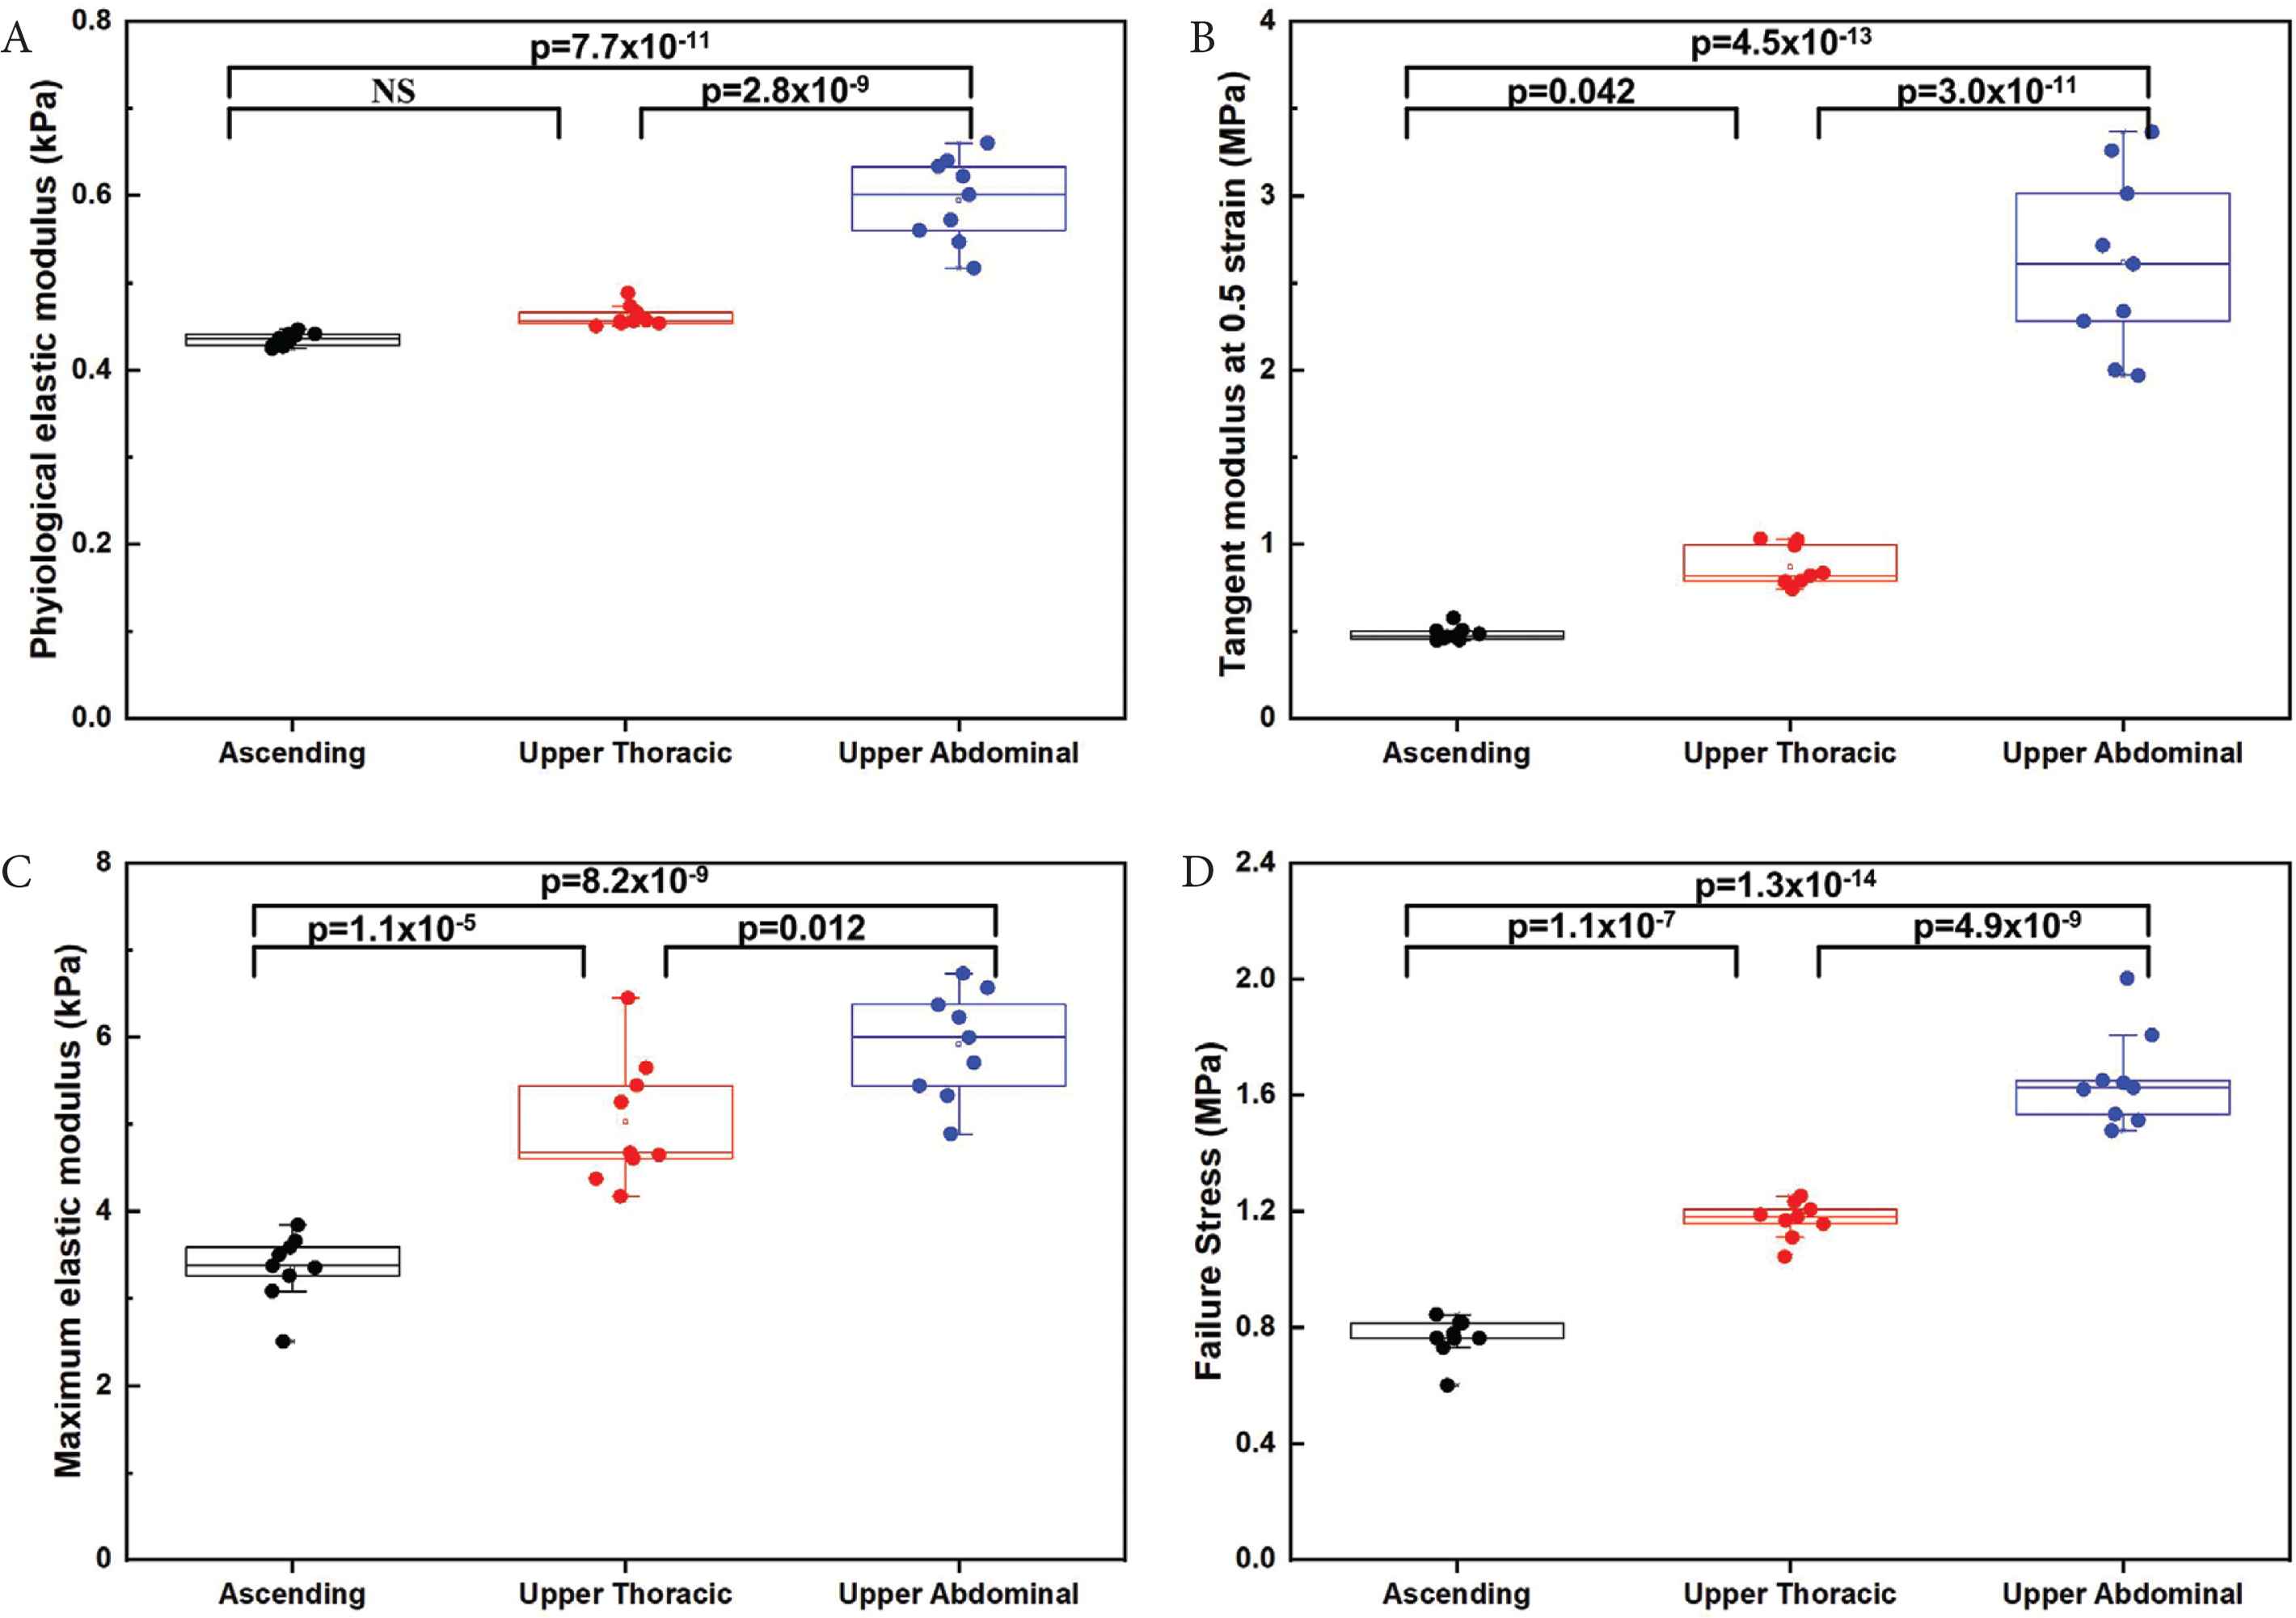
Box-whisker plots presented for the macro-mechanical data for the three aortic regions that were tested (n = 9 samples/region): (A) PE. (B) Tangent modulus at 0.5 strain. (C) ME. (D) Failure stress. All values are shown with boxes representing the 25th and 75th percentiles of data. Whiskers represent the 5th and 95th percentiles of data. NS, Not significant.
3.2. Micromechanical Behaviour of Ovine Aortic Tissue
G′, G″ and tan (δ) were measured using nanoindentation to determine the micromechanical properties, for both the circumferential and longitudinal direction.
3.2.1. Circumferential direction
Six oscillatory indentations were performed on the medial layer in the circumferential direction (the tissue cross-section). In order to compare to the uniaxial data, testing was conducted for samples taken from the same regions as for the uniaxial tests, namely the ascending aorta, upper thoracic aorta and upper abdominal aorta. Overall, the mean values for G′ and G″ (at the medial layer), increased from the ascending to the upper abdominal aorta. G′ and G″ for the upper abdominal aorta were higher than the ascending aorta by 220.8%, and 219.7% respectively. G′ and G″ for the upper abdominal aorta were 148.95% and 167.6% higher than the upper thoracic aorta respectively. As shown in Figure 5, there were statistically significant differences for both G′ and G″ when comparing the ascending, upper thoracic regions and upper abdominal aorta.
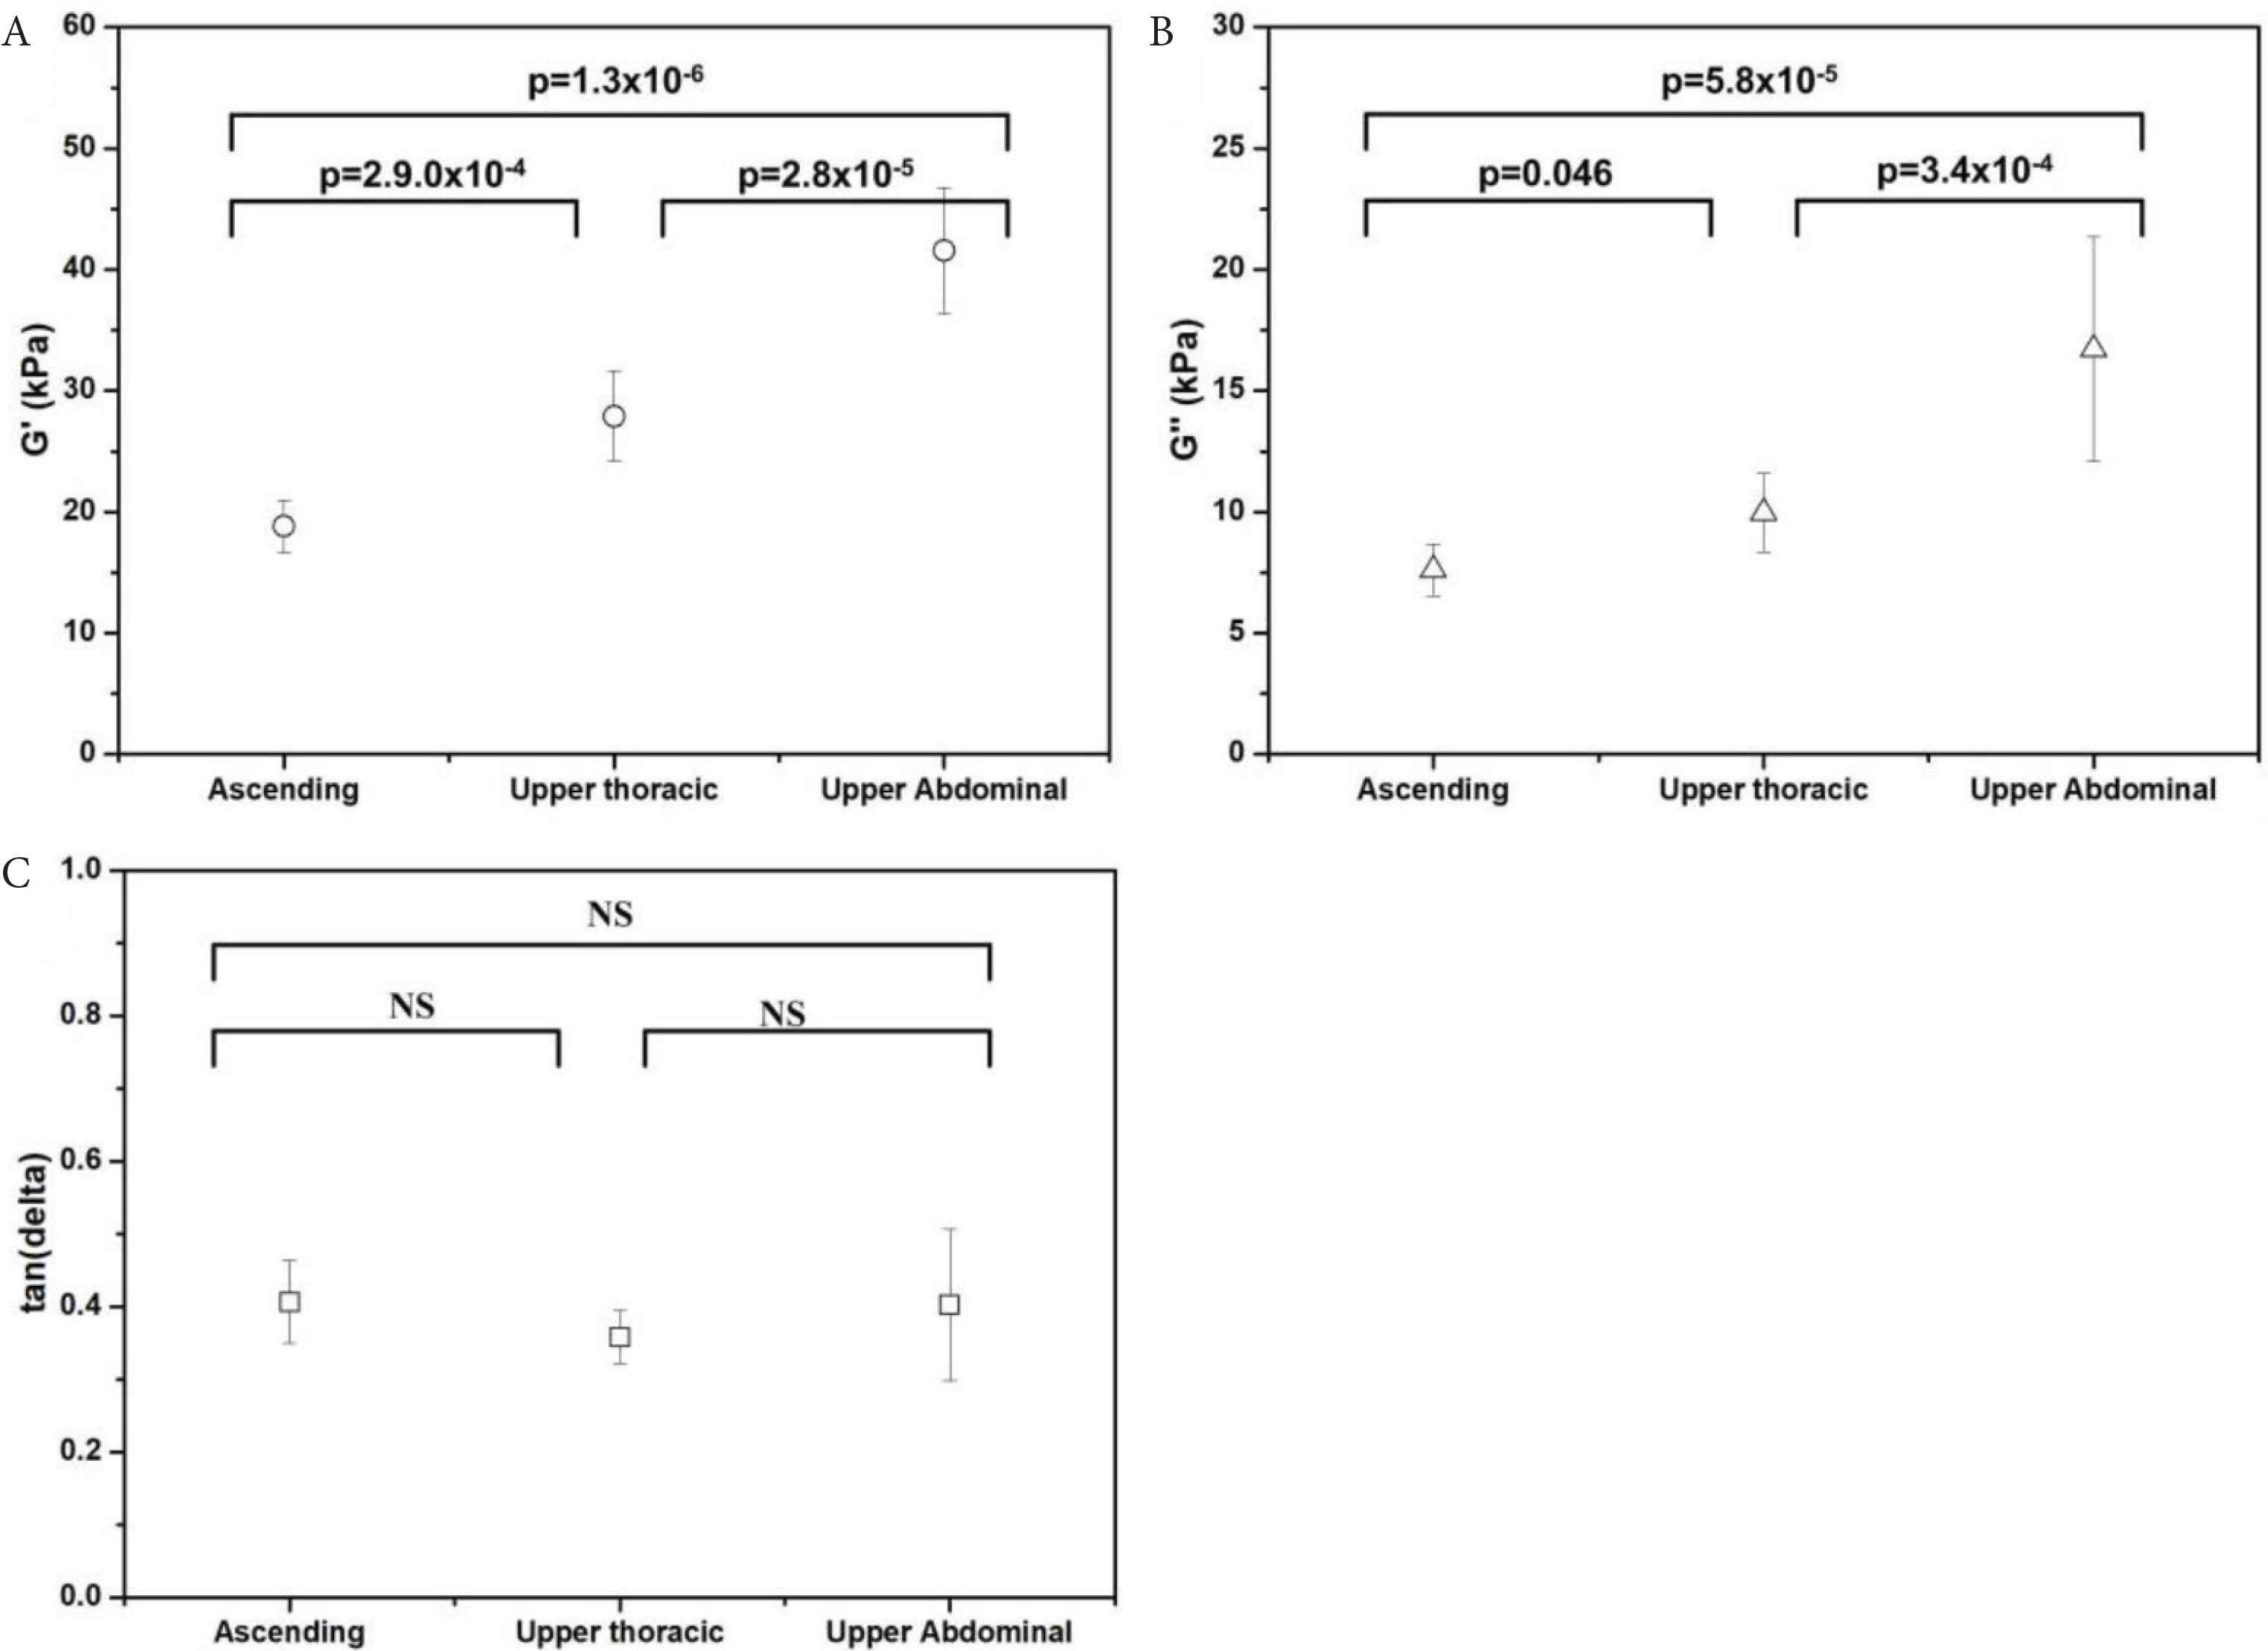
Micromechanical properties of the medial layer (circumferential orientation), shown for the ascending, upper thoracic and upper abdominal aorta: (A) G′. (B) G″, and (C) tan (δ). Symbols represent the mean values and error bars represent the standard deviation. NS, not significant.
3.2.2. Longitudinal orientation
Longitudinal properties were mapped for both the adventitial face and intimal face of the aortic wall. G, and G″ increased with distance from the heart for both the adventitial face and intimal faces (Figure 6A and 6B). For the adventitial face, G′ increased from 14.9 ± 1.4 kPa (2 cm from aortic root) to 30.4 ± 2.5 kPa (14 cm from aortic root). For the intimal face, G′ increased from 21.1 ± 1.6 kPa (2 cm from aortic root) to 36.9 ± 2.4 kPa (14 cm from aortic root). Similar trends were found for G″. For the adventitial face, G″ increased from 5.4 ± 0.5 kPa (2 cm from aortic root) to 10.2 ± 1.3 kPa. For the intimal face, G″ increased from 7.6 ± 1.1 kPa (2 cm from aortic root) to 13.4 ± 2.9 kPa. As shown in Figure 6A and 6B, G′ and G″ were both found to be higher when the intimal face was tested, across all regions.
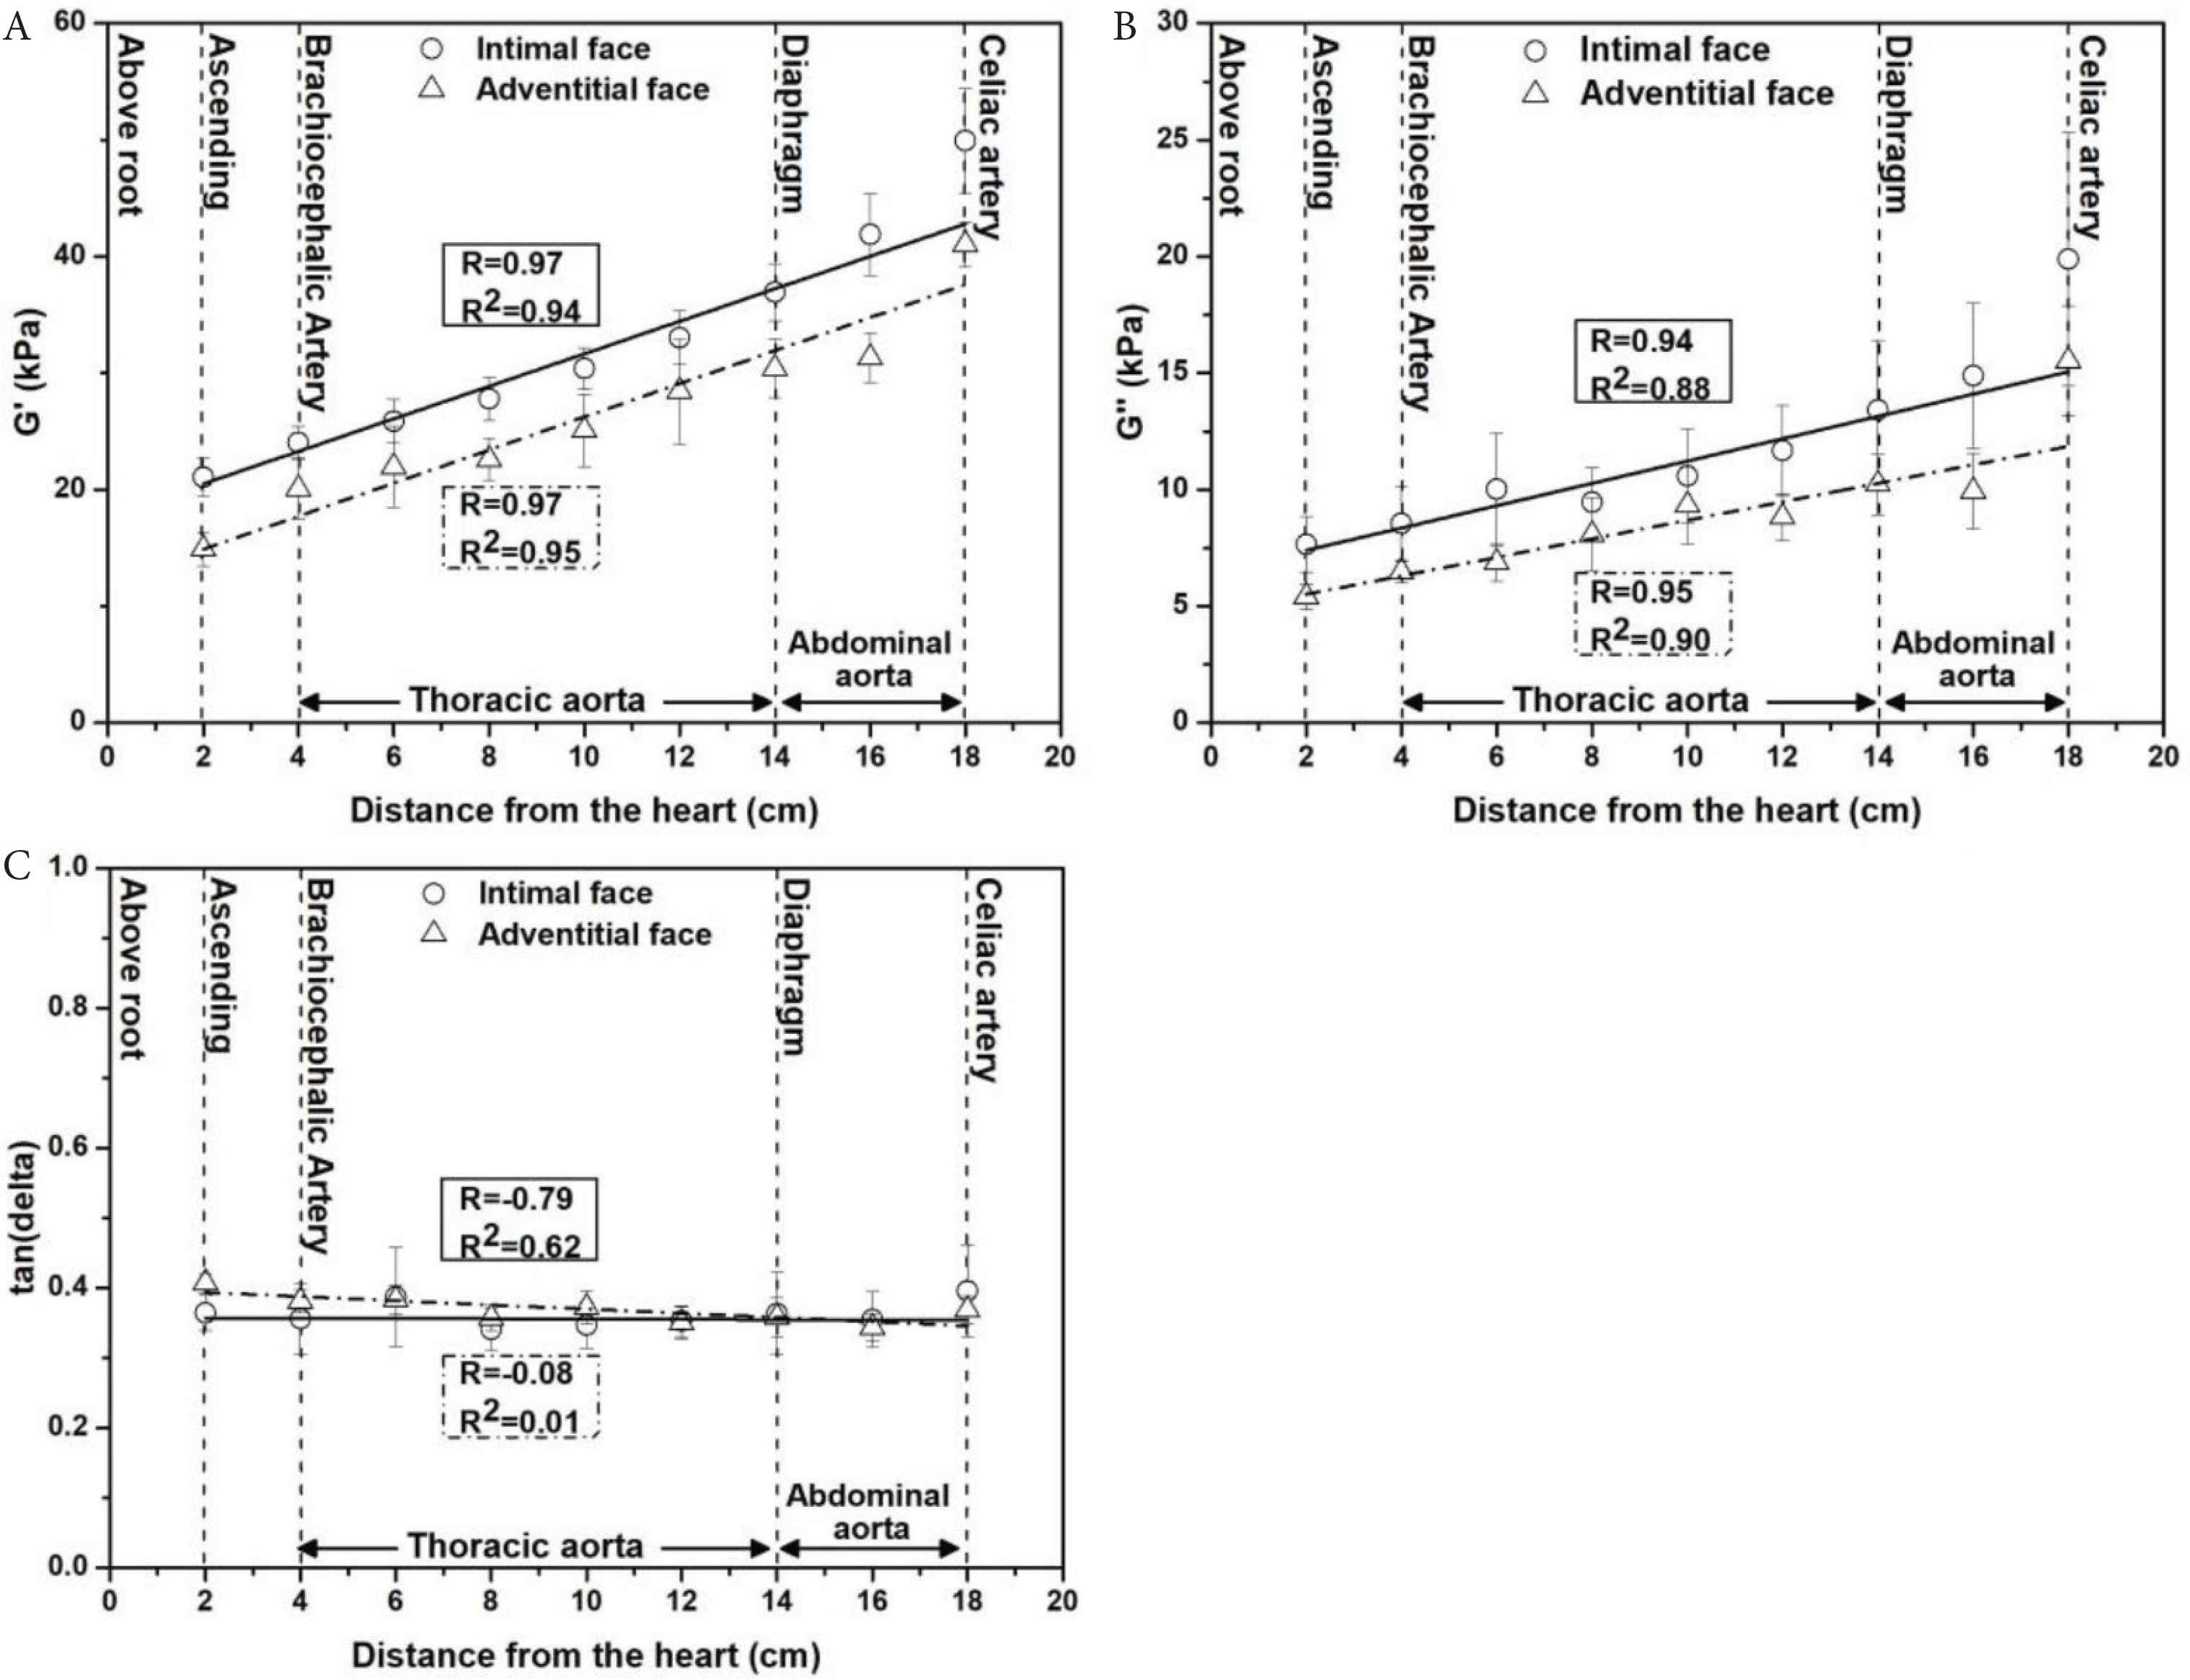
Longitudinal micromechanical properties across the ovine aorta as a function of distance from the aortic root to celiac region (A) G′-distance. (B) G″-distance were found to have a high positive correlation (Pearson correlation coefficient, G′-distance: R = 0.97, p = 0.000028 and R = 0.97, p = 0.000016 for adventitia and intima, respectively. G″-distance: R = 0.95, p = 0.00089 for adventitia and R = 0.94, p = 0.00035 for intima). (C) The relationship between tan (δ) and distance. The data are averaged from 81 samples (n = 9/region with three samples/animal) shown as mean ± SD.
A significant positive correlation was observed with distance from the heart to the celiac artery region for G′ for the adventitial face (R2 = 0.95, R = 0.97, p = 0.000028) and intimal face (R2 = 0.94, R = 0.97, p = 0.000016). Similar, correlations were found for G″; adventitial face (R2 = 0.90, R = 0.95, p = 0.00089) and for the intimal face (R2 = 0.88, R = 0.94, p = 0.00035). Tan (δ) was found to be relatively consistent, typically around 0.35–0.40 for both the adventitial and intimal face (Figure 6C).
G′ and G″ were higher for the circumferential measurements on the medial layer as compared with the longitudinal direction. A more detailed summary is presented in Supplementary Material (Table S7).
3.3. Comparison of Micromechanical and Macromechanical Behaviour
A comparison was made of the mechanical property data obtained via uniaxial tensile testing and oscillatory nanoindentation. The most appropriate comparison was the mean elastic modulus obtained from the circumferential tests (medial layer) via nanoindentation with the PE obtained via tensile testing. Although the testing approach, testing scale and rates differed with the two methods, and as a result the absolute values differed, it was found that the overall trends from the ascending to the upper abdominal aorta were similar (as shown in Figure 7). In terms of the absolute values, with nanoindentation, the elastic modulus was in the range of 0.05–0.12 MPa and from uniaxial tensile testing at PE the range was 0.4–0.6 MPa. Hence, the bulk measurements were five to eight times higher than the micromechanical measurements.
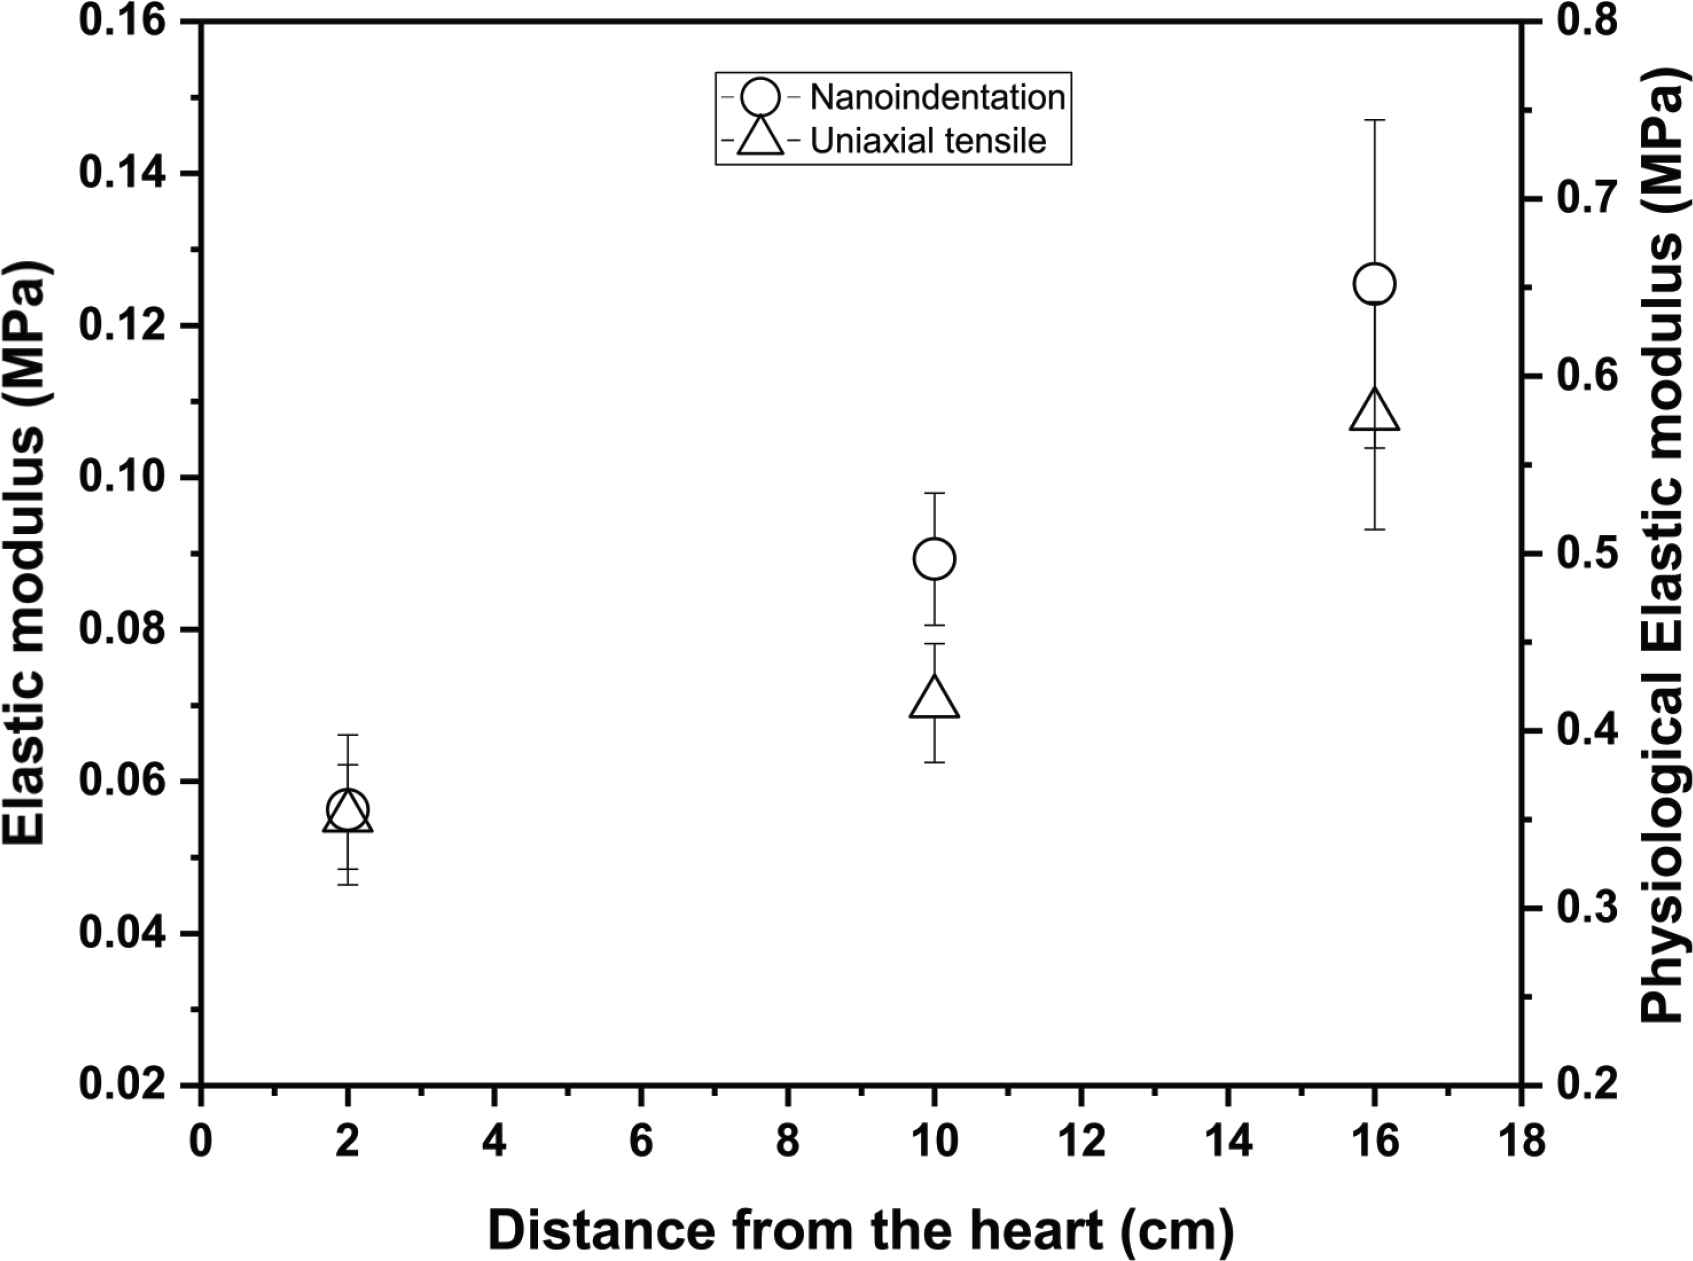
Comparison of trends obtained via circumferential testing of the medial layer using oscillatory nanoindentation (elastic modulus) with PE values obtained via uniaxial tensile testing, for the ascending, upper thoracic and upper abdominal aorta, shown as a function of distance (length) from the heart.
3.4. Biochemical Analysis
Clear trends were visible for all biochemical measurements as the distance from the aortic root increased for each of the extracellular matrix components analysed (collagen, GAG and elastin) (Figure 8). As shown in Figure 8A, the collagen level was lowest at the first point of measurement (closest to the root, 27.3 ± 7.0 μg/mg) and steadily increased with distance to the celiac artery, reaching a maximum of approximately 40.1 ± 8.8 μg/mg. In contrast, GAG (4.2 ± 0.9 μg/mg) and elastin (102.5 ± 24.5 μg/mg) decreased along the length of the aorta approximately to 3.5 ± 0.4 and 80.2 ± 11.0 μg/mg for GAG and elastin, respectively (Figure 8B and 8C). Pearson’s correlation and R2-values demonstrated a strong positive correlation between collagen level and distance from aortic root (R = 0.88 and R2 = 0.78). In contrast, there was a strong negative relationship between GAG (R = −0.84 and R2 = 0.74) and elastin levels (R = −0.89 and R2 = 0.80) with distance from the aortic root. The mean values of collagen, GAG and elastin levels for the three ovine aortas are presented in the supplementary information (Table S2).
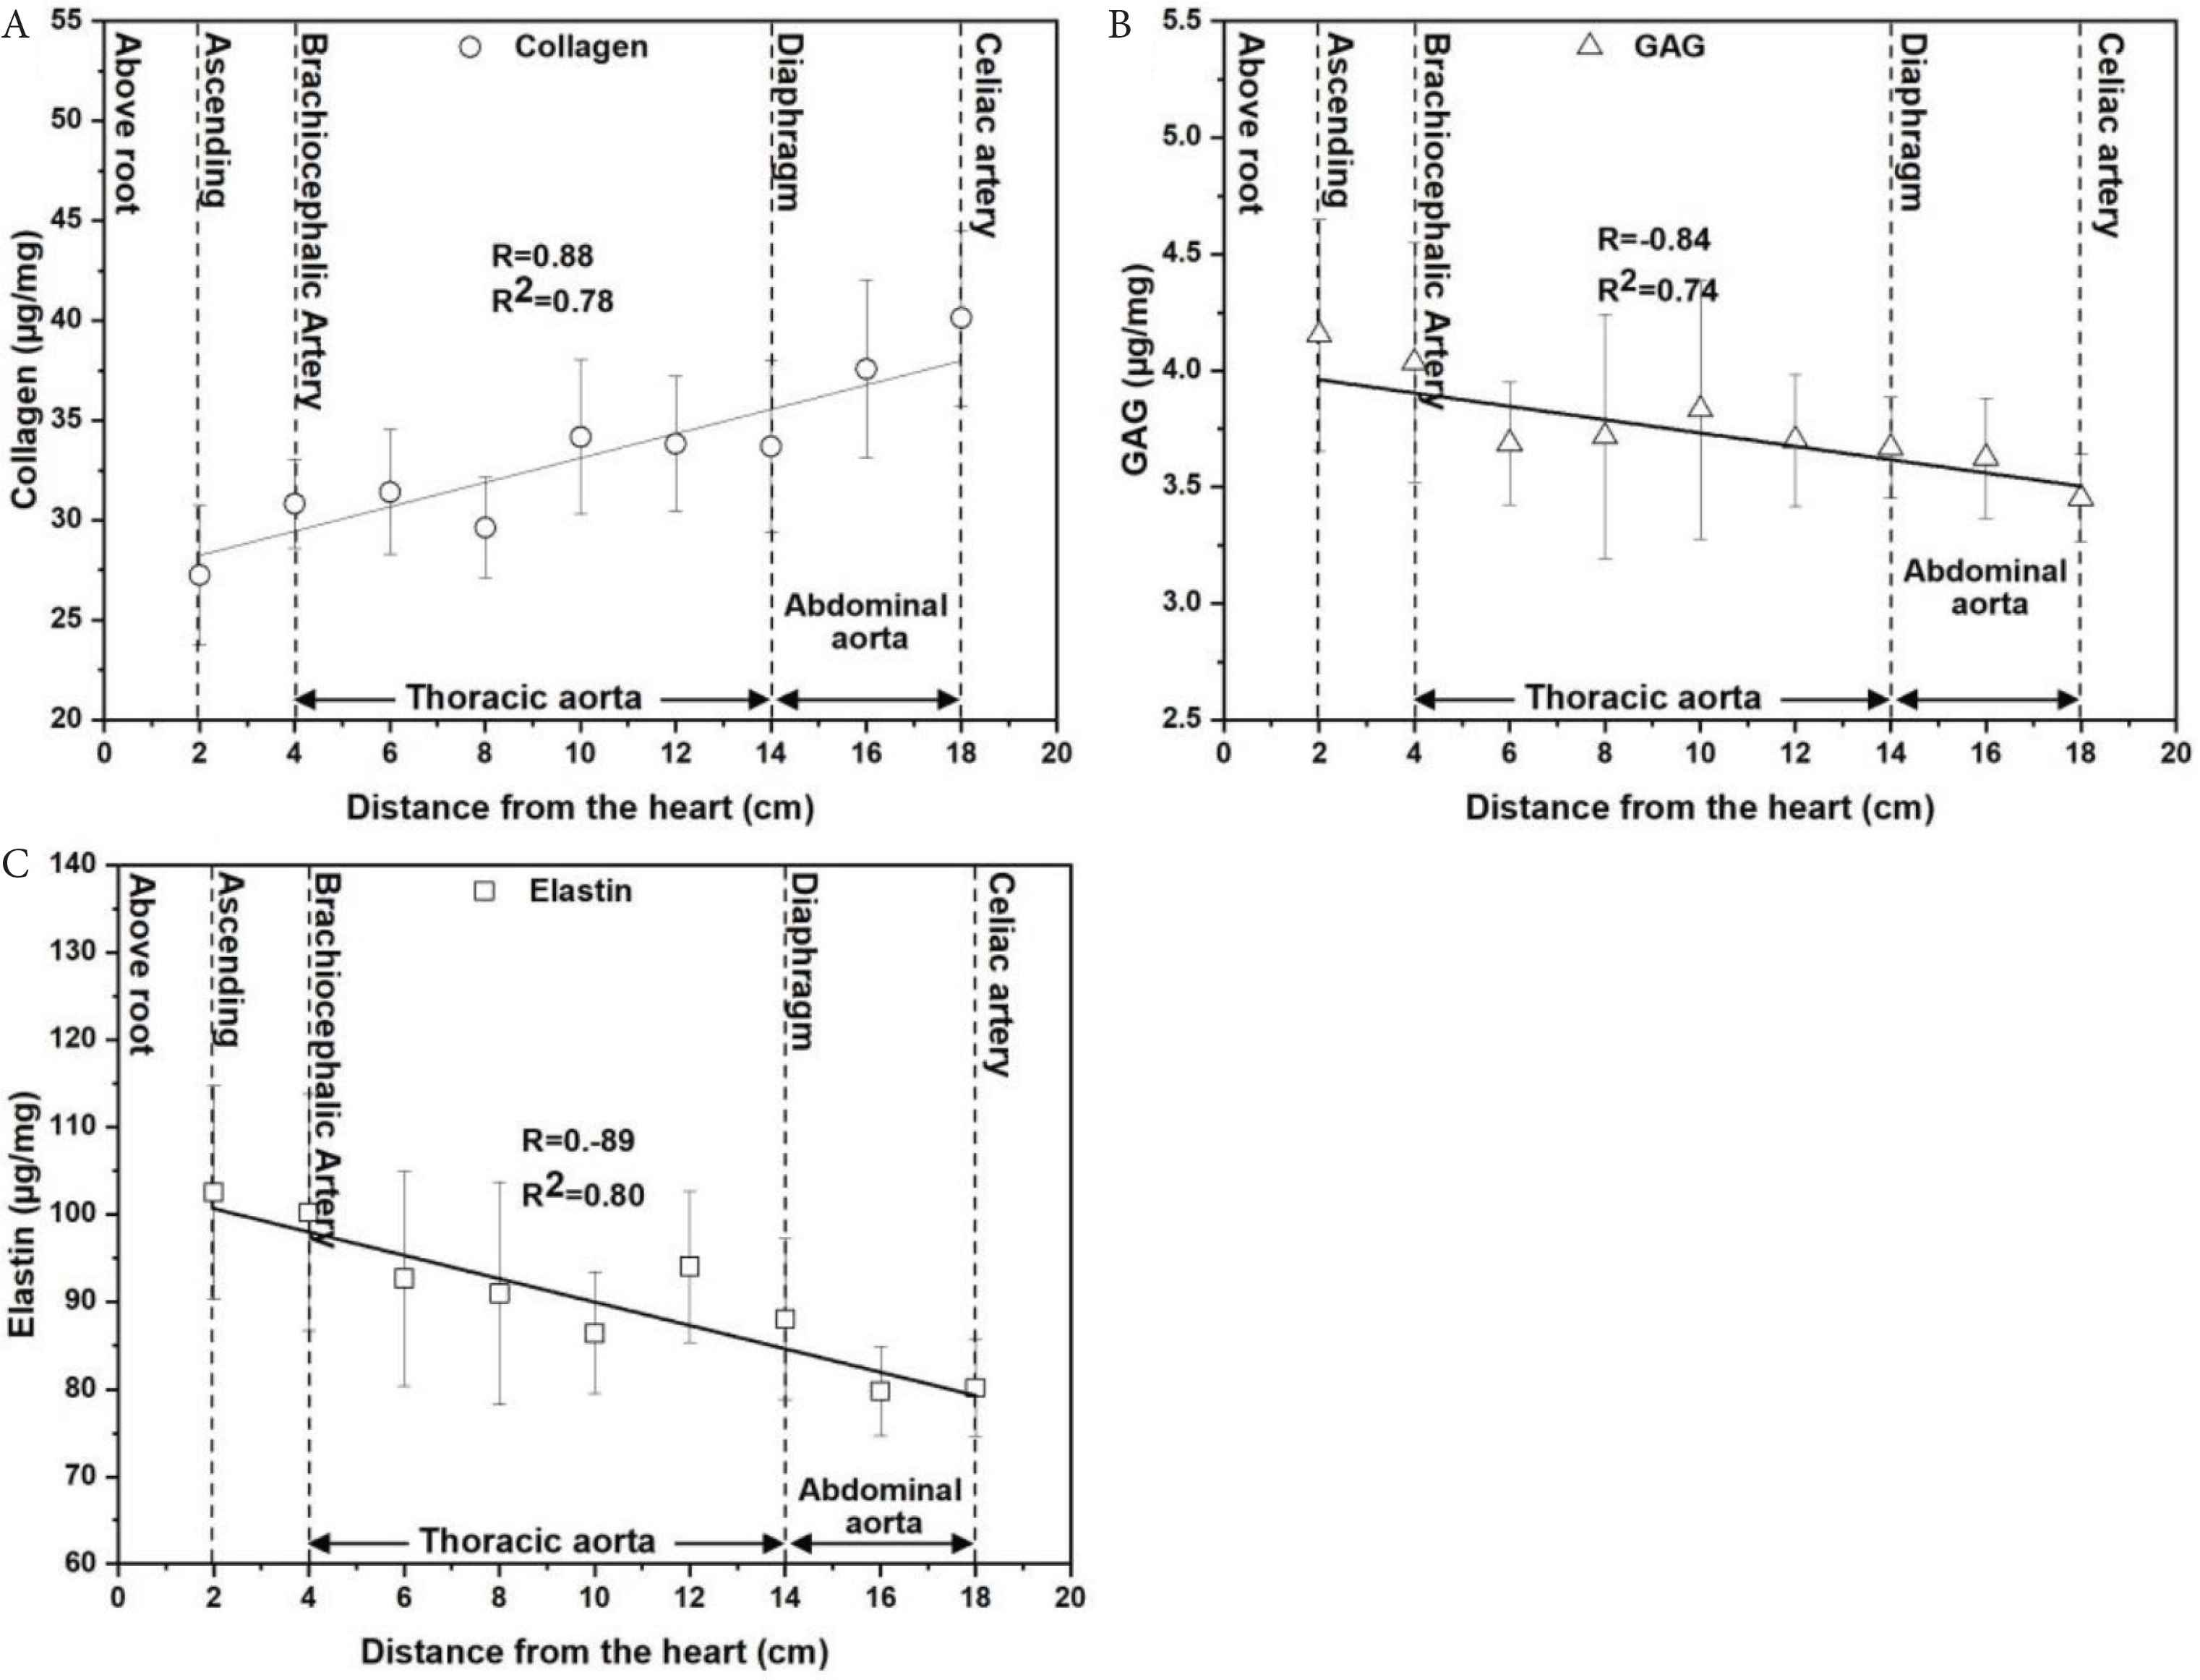
Biochemical properties across the ovine aorta as a function of distance from the aortic root. (A) Collagen levels were found to be positively correlated with distance (Pearson correlation coefficient, R = 0.88, p = 0.00187). (B) GAG levels and (C) elastin levels showed a negative relationship with distance (Pearson correlation coefficient, GAG level-distance: R = −0.84, p = 0.0043 and elastin level-distance: R = −0.89, p = 0.001). All biochemical data are expressed as micrograms per milligrams of wet tissue weight from 81 samples (n = 9/region with three samples/animal) shown as mean ± SD.
The biochemical properties (collagen, GAG and elastin levels) were found to relate to E as determined via nanoindentation in the longitudinal orientation (Figure 9). We found a positive correlation between collagen and E (collagen-E: R = 0.91, R2 = 0.83 and p = 0.0006) whereas for GAG (GAG-E: R = −0.89, R2 = 0.79 and p = 0.00126) and elastin (elastin-E: R = −0.80 R2 = 0.65 and p = 0.0097) there was a negative correlation.
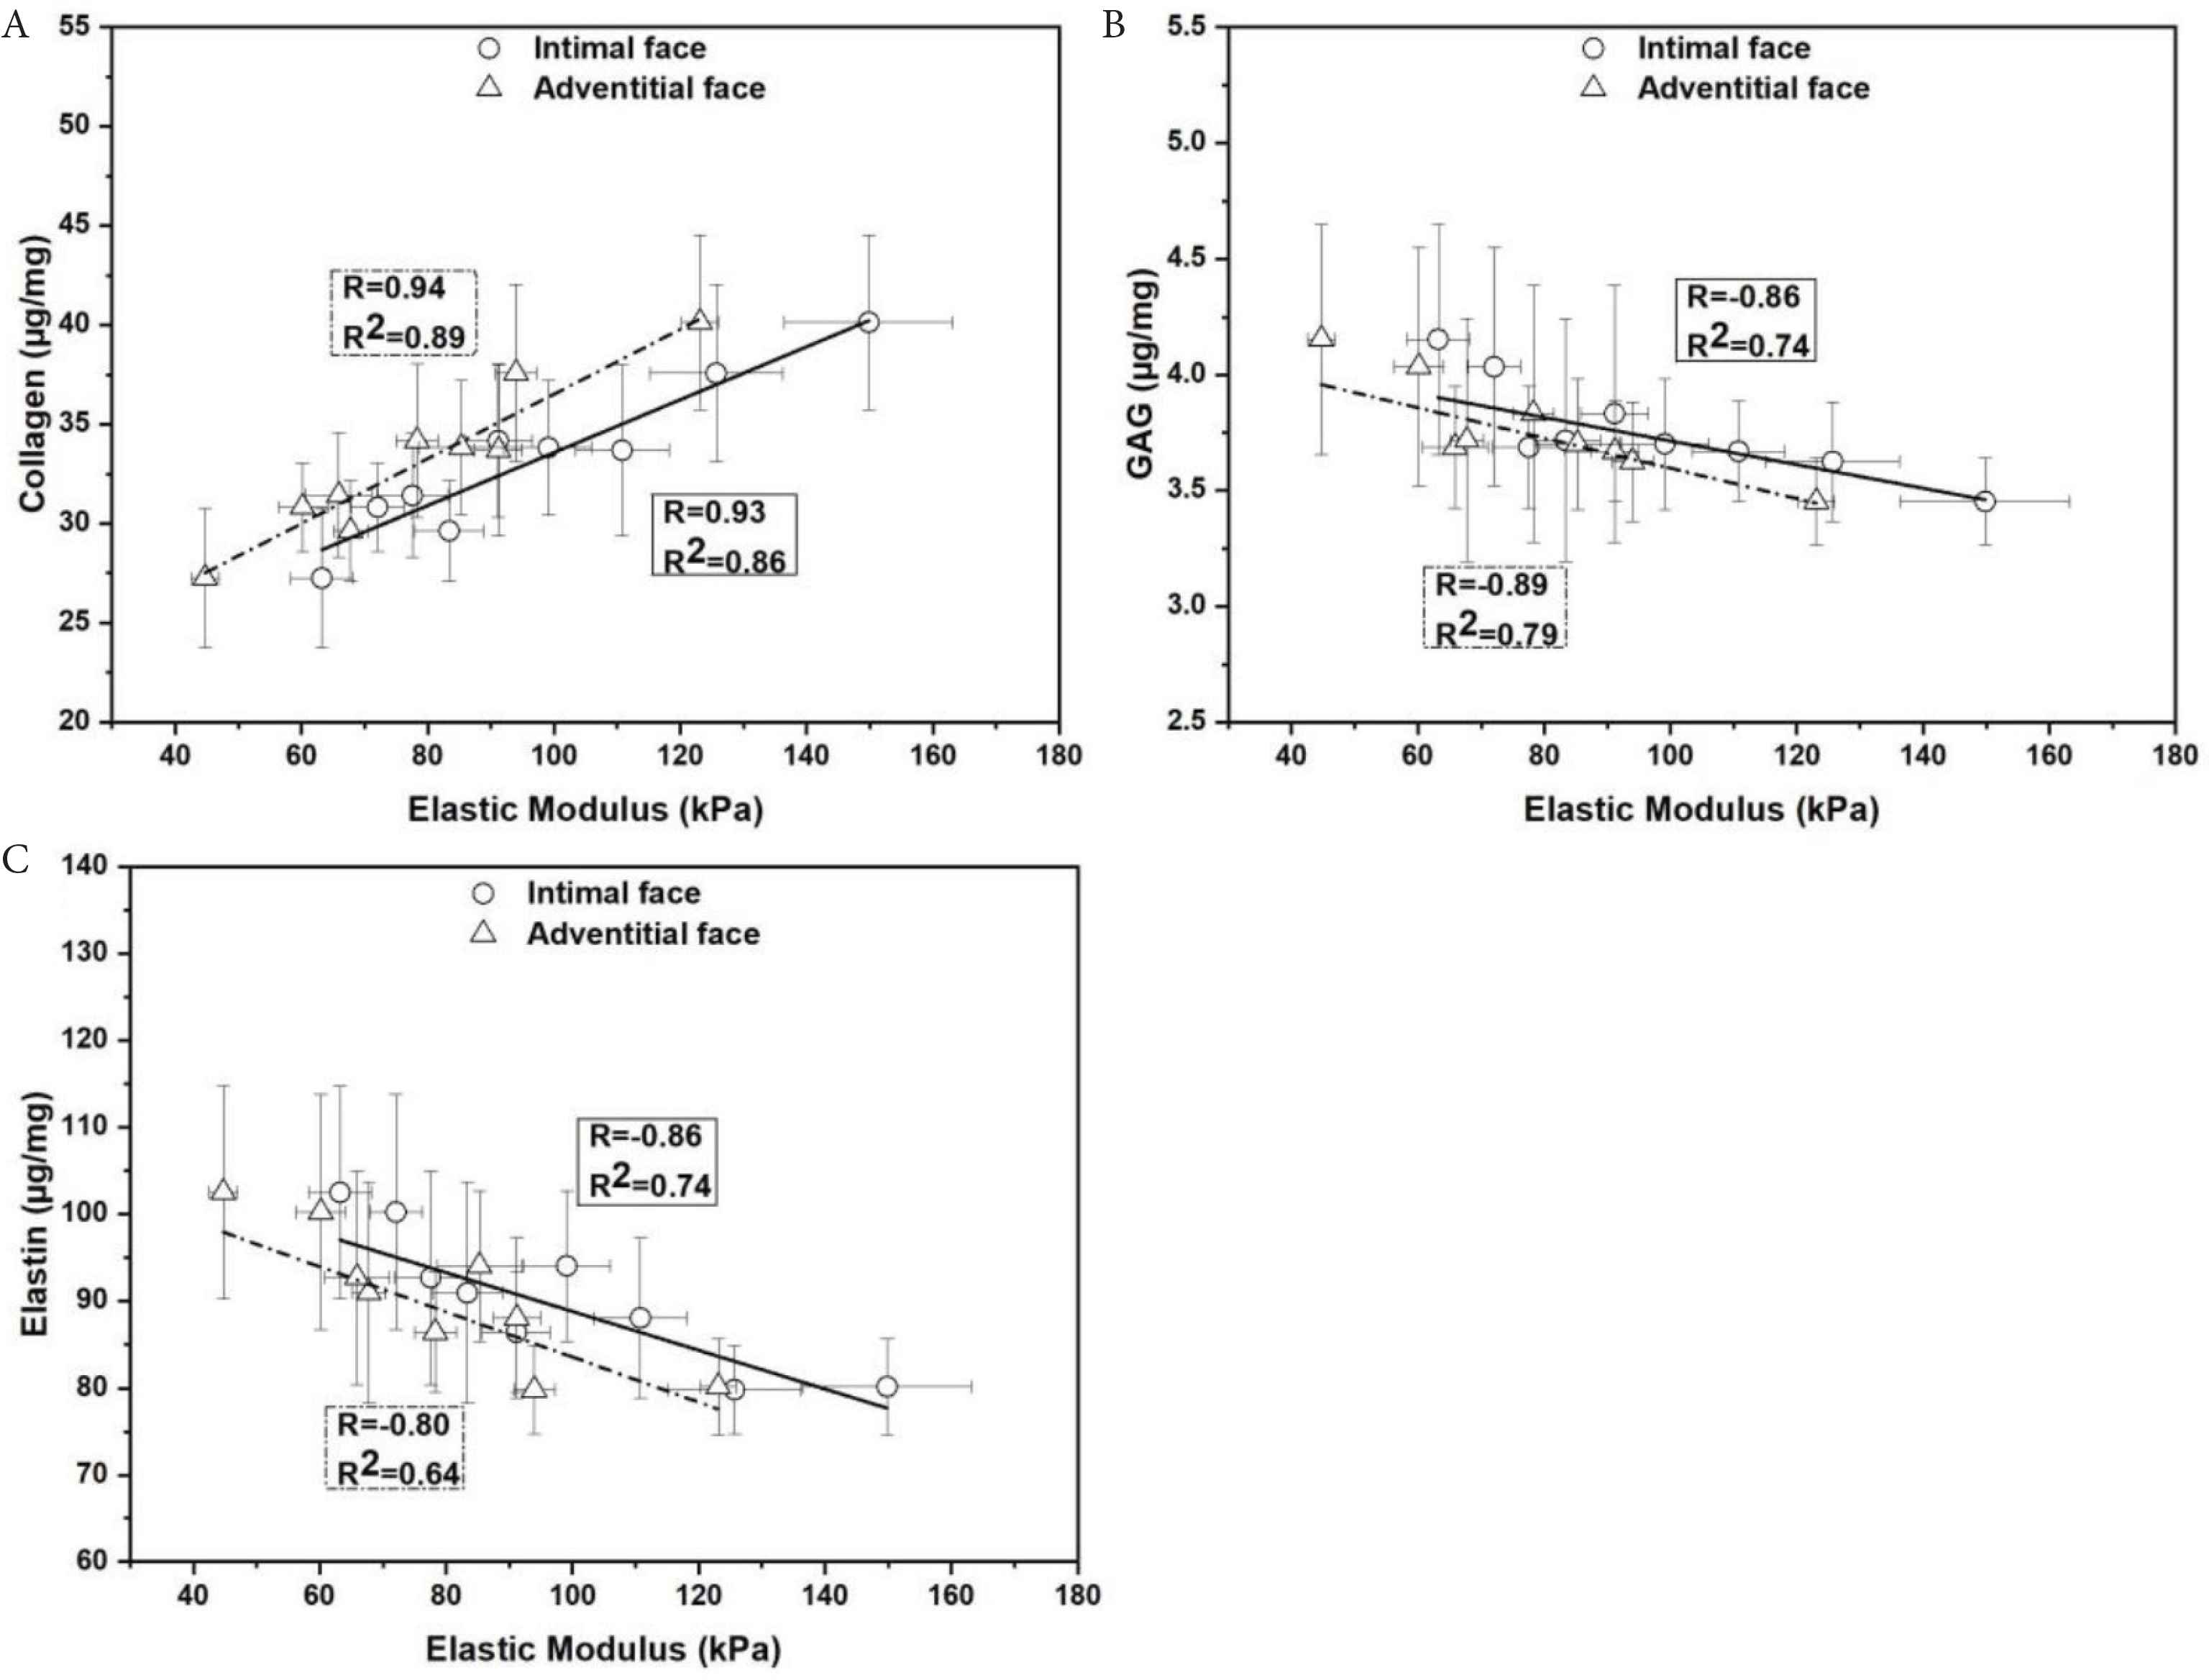
Comparison between biochemical properties (collagen, GAG and elastin levels) and elastic modulus determined with nanoindentation in the longitudinal orientation. (A) Collagen. (B) GAG and (C) elastin. Data are shown as mean ± SD.
4. DISCUSSION
Aortic diseases such as aneurysms and dissections are location dependent [27]. For example, 60% of thoracic aortic aneurysms occur in the ascending aorta [27]. Hence, it is important to understand the mechanical and biochemical properties of the aorta across different regions. This is not only important for understanding aortopathies and surgical planning but also for designing stent grafts [17]. In this study, we have addressed the gap in the literature by comprehensively mapping the macro, micro-mechanical and biochemical properties of the ovine aorta.
In the seminal work by Harkness et al. [8], the variation of collagen and elastin was comprehensively mapped across the wall of the canine aorta. In their work, they showed that elastin constitutes 50–60% dry weight of the proximal aorta with the proportion of elastin rapidly decreasing to around 25–30% at the distal region. As stated by Hickson et al. [28], this change in properties across the aorta can be linked to the mechanical behaviour of the aorta with the aortic bifurcation region being stiffer than the aortic root, as determined by pulse wave velocity.
Our work presents for the first time, biomechanical (macro- and micro-), and biochemical assessment of the variation across the entire aorta. The main novelty of our work is, through the application of oscillatory nanoindentation, the determination of regional variation of properties, which are directly related to the biochemical variation in collagen, elastin and GAG levels. We present orientation-dependent nanoindentation properties along with macroscopic uniaxial testing to present a comprehensive picture of the variation of properties across the aorta. In addition, the application of oscillatory nanoindentation allowed the mechanical properties to be determined with a much higher spatial resolution than is possible with uniaxial testing. By presenting both uniaxial and nanoindentation data we are able to compare our data with other studies and also correlate our novel nanoindentation method with more conventional, established mechanical testing methods. We believe that these data will serve as a useful reference given the increase in use of indentation-based techniques for aortic biomechanical analysis [29–32].
The advantages of nanoindentation over uniaxial tensile testing are that the technique is non-destructive, requires small samples and the spatial resolution is in line with the microstructural organisation of the fibres. Our nanoindentation data provided the viscoelastic behaviour for the longitudinal orientation (both intimal and adventitial face) and circumferential measurements on the media. These were correlated with the biochemical composition, across the different regions. As the technique is non-destructive, we were able to conduct biochemical testing on the same samples.
Our nanoindentation data follow the trends reported by Kermani et al. [30] who examined the mechanical properties of porcine aorta with a custom-made nanoindentation test setup. They reported that the distal regions of the aorta were stiffer than the proximal regions. The trends are also in agreement with another nanoindentation study on the porcine aorta which showed that the elastic modulus is higher at the inferior artery as compared to the subclavian artery [22]. Whilst the absolute values differ when comparing our nanoindentation data with the uniaxial testing data, the trends are similar as shown in Figure 7.
Sokolis et al. [13] have previously examined regional differences in the porcine aorta by determining the mechanical properties under uniaxial tension along with elastin and collagen content as measured by histological analysis. They split the aortas into nine segments in one study [13] and seven segments in a later study [14]. The overall trends in the biomechanical properties that we report match those of Sokolis et al. The novelty in our work is the determination of collagen, elastin and GAG levels for the same samples that were used for mechanical testing. Unlike previous work, we have not had to rely on semi-quantitative assessment of collagen and elastin content from histology images. Furthermore, we are not aware of any other studies that have reported GAG variations across the aorta.
The matrix fibres (collagen and elastin), and GAGs together govern the mechanical behaviour of the aorta. Alteration in these components within the aortic wall can lead to detrimental changes in the biomechanical properties and function of the aorta [33]. A better understanding of the distribution of collagen, elastin and GAGs in relation to aortic biomechanics may help better elucidate the physiopathology of aortic disease in specific locations. One key finding in our study is that there is a significant correlation with an increase in G′ and collagen with distance from the aortic root whilst elastin and GAG levels significantly decreased. The negative relationship between GAG content and distance from aortic root to celiac artery region is of particular interest. We found that GAG content decreased by 83.1% from the ascending region to the abdominal aortic region, accompanied by 220.8% increase in the circumferential elastic modulus. GAG pooling has been implicated in the development of thoracic aortic aneurysm and dissection [34,35] and our data suggest that given the differences in extracellular matrix (ECM) content in the ascending vs. abdominal aorta, different degradation pathways may be implicated in aneurysm formation in different regions. GAGs play a significant role in maintaining the structure of the aortic wall, supporting mechanosensing functions and influencing collagen fibrillogenesis and are altered with aortic pathogenesis [36–38]. The role of GAGs in the proximal aorta require further analysis especially given the increased prevalence of type A dissection at the proximal aorta as compared to type B dissection at the distal aorta. Hence, our data has potential to support mechanistic insight into aortic aneurysms and dissection development in different regions of the aorta.
5. LIMITATIONS
The macroscopic mechanical property measurements were conducted in uniaxial test conditions. In order to fully capture the anisotropic properties of the aortic wall, biaxial testing should also be considered. Secondly, the biochemical methods used for investigation of collagen, GAG and elastin level do not discriminate across the layers. Layer-specific biochemical measurements would be useful for further correlation with nanoindentation. Finally, GAG work could be followed up by quantifying the presence of specific proteoglycans in the tissue.
6. CONCLUSION
Our study demonstrates how collagen, elastin and GAG levels relate to the biomechanical properties of different regions of the aorta. We found a significant increasing trend of stiffness both at the macroscopic and at the micromechanical scale from the ascending aorta to the abdominal aorta. These changes in the mechanical properties were correlated with increased collagen, decreased elastin and GAGs as the distance from the heart increases. The findings of this study could be reproduced in human tissue with and without aortopathy to shed light on the mechanisms of aneurysm and dissection development in different regions of the aorta.
CONFLICTS OF INTEREST
The authors declare they have no conflicts of interest.
AUTHOR CONTRIBUTIONS
RA, MLF and JM had a role in study conceptualization and writing (review and editing) the manuscript, PP, BG, YHC and HAD were involved in data curation, formal analysis and writing (original draft), RA, MLF and JM were involved in funding acquisition and project administration, RA and JM supervised the project.
ACKNOWLEDGMENTS
PP is funded by a PhD scholarship awarded by the
SUPPLEMENTARY MATERIALS
Supplementary data related to this article can be found at
Footnotes
REFERENCES
Cite this article
TY  - JOUR
AU  - Phakakorn Panpho
AU  - Brendan Geraghty
AU  - Ya Hua Chim
AU  - Hannah A. Davies
AU  - Mark L. Field
AU  - Jillian Madine
AU  - Riaz Akhtar
PY  - 2019
DA  - 2019/11/26
TI  - Macro- and Micro-mechanical Properties of the Ovine Aorta: Correlation with Regional Variations in Collagen, Elastin and Glycosaminoglycan Levels
JO  - Artery Research
SP  - 27
EP  - 36
VL  - 25
IS  - 1-2
SN  - 1876-4401
UR  - https://doi.org/10.2991/artres.k.191114.003
DO  - 10.2991/artres.k.191114.003
ID  - Panpho2019
ER  -