
Interaction of the blood components and plaque in a stenotic coronary artery
- DOI
- 10.1016/j.artres.2018.11.002How to use a DOI?
- Keywords
- Coronary artery; Plaque; Red blood cell; White blood cell; Plasma; Finite element model
- Abstract
Background: So far, in the stress calculation of the plaques, the blood has been simulated as a single component, and the role of the mechanical interaction between the red blood cells (RBCs), white blood cells (WBCs), and plasma with that of the plaque has been neglected. This study was aimed at proposing an interactive method based on smoothed particle hydrodynamics (SPH), a fully mesh-free particle approach, to simulate the blood as a fluid with free surfaces, including the RBC, WBC, and plasma, to determine the vulnerable plaque on a basis of the induced stresses.
Materials and methods: A three-dimensional (3D) finite element (FE) model of the atherosclerotic coronary artery was established according to the CT/MRI data of a patient. SPH method was employed toward our blood particles simulation by deriving the force density fields directly from the Navier-Stokes equation and incorporated into the FE equations. The stress in the plaque, necrotic core (NC), and arterial layers were then calculated and compared.
Results: The results revealed the highest stress in the adventitia layer while the lowest one was observed in the media. Regarding the blood components, the plasma experienced the highest stress in the downstream while the RBCs and WBCs in the location where in the direct contact with the plaque tissue.
Conclusions: The results have implications for understanding the roles of RBCs, WBCs, and plasma in inducing the stresses and deformations in the plaques and arterial layers to provide plaque vulnerability prediction information for the medical and biomechanical experts.
- Copyright
- © 2018 Association for Research into Arterial Structure and Physiology. Published by Elsevier B.V. All rights reserved.
- Open Access
- This is an open access article distributed under the CC BY-NC license.
Introduction
Rupture of an atherosclerotic plaque releases thrombogenic materials into the blood circulation, which triggers the narrowing or even blocking of the blood pathway inside an artery.1,2 Although it has been assumed that high structural stresses, i.e., the shear and von Mises stress, at critical sites may contribute to plaque disruption,3 the mechanisms responsible for the sudden conversion of a rupture-prone plaque to a life-threatening atherothrombotic lesion are not yet fully understood.4 The non-Newtonian rheology of the blood, the intricate mechanical properties of the arterial layers, the pulsatile inlet flow, the geometry of the stenosis, and the transition to turbulent flow are the most important difficulties in making a realistic experimental investigation of the plaque vulnerability.
As vulnerable atherosclerotic plaques have been determined to have large lipid cores and thin fibrous caps,1 it is possible to consider plaque morphology and biomechanical properties of the plaque as the essential parameters in their vulnerability.5 Plaques histologically categorized as the calcified, cellular, and hypocellular, which have been indicated to have significantly different mechanical properties under the radial compressive loading,6 whereas non-significant differences under the tensile loading.7 Henceforth, it is expected to observe dissimilar mechanical responses from different plaques under the same stenting procedure.8 Since imaging techniques make it possible to distinguish the plaque types during the surgery,9,10 it is worth to calculate the injury/stress within different plaques and arterial layers during the blood flow to be able to define an injury assessment criteria for the plaques, and eventually preventing the possible thromboembolization. Plaque formation affects the local hemodynamic factors of the blood flow by the contribution of shear stress. Valencia et al.,11 found severe stenosis turbulent flow patterns and high shear stress at the post-stenotic area of large arteries for upstream Reynolds numbers over 500. The pulsatile turbulent flow pattern in stenotic arteries were investigated using the Reynolds-averaged Navier–Stokes approach.12 Steady flow simulations in a realistic human right coronary artery (RCA) under three different inlet velocity profiles showed a notable sensitivity to the local morphology of the RCA.13 That is, low and oscillating shear stresses have been associated with atherosclerotic lesions within the coronary arteries.14,15 Mechanical studies have shown that stress is an important indicator for plaque vulnerability, and plaque rupture occurs when the stresses exceed the yield stress of the plaques.16,17 Karimi et al.,18 conducted a 3D computational fluid–structure interaction (FSI) analysis to evaluate the vulnerability of three plaques, i.e., the calcified, cellular, and hypocellular. That data indicated that the risk of plaque rupture caused by the blood flow is lower in the cellular and hypocellular plaques and higher in the calcified one. They also established a three-layer arterial wall structure, including the intima, media, and adventitia, to quantify the stresses and strains in the plaque wall through the FE19,20 and FSI21 analyses. Karimi et al.,22,23 also conducted a FE study on the vulnerability of plaque tissues under a normal blood pressure to determine the critical stresses and strains of plaque rupture. Studies on coronary arteries are normally focused on structural aspects, neglecting the interaction between blood flow and arterial walls, evaluating the shear stress at the rigid walls and connecting it with atheromatous pathologies.24 The interaction between the luminal flow field and the arterial wall mechanics is crucial to understand the role of flow-induced mechanisms that may lead to plaque rapture. Nonlinear 3D models with FSI based on in vitro experiments have introduced to perform flow and stress/strain analysis for stenotic arteries with lipid cores.25 Coupled FSI analysis of the human RCA has been carried out to investigate the effects of wall compliance on coronary hemodynamics.26 However, in these models, the artery was considered as an ideal cylinder and the plaque was made of a single component; in addition, the important role of the necrotic core (NC) was neglected.
In addition to considering the interaction of the blood and plaque for the plaque vulnerability assessment, it should be noted that the blood by itself is consisted of the red blood cells (RBCs) and white blood cells (WBCs), suspended in plasma, which constitutes ∼55% of total blood volume.27 RBCs have the ability to undergo large deformations when subjected to external stresses, which allows them to pass through capillaries.28 Whereas, WBCs are part of our immune system, performing various organism defense functions,29 and mechanically are not as deformable as the RBCs.30 So far, there is no numerical modeling in regard of the interaction of the RBCs, WBCs, and plasma with that of the plaque in an atherosclerotic coronary artery. Therefore, there is a paucity of knowledge on how these blood components affect rupture of different plaques, i.e., calcified, cellular, and hypocellular, during their interaction with the plaque. This is why, there is a need to provide new rupture risk criteria on a basis of the RBCs, WBCs, and plasma roles to improve our understanding of plaque vulnerability assessment. Simulation of blood flow in a stenosed artery using Smoothed Particle Hydrodynamics (SPH), which is a particle-based fully Lagrangian mesh-free method, is new in the field and different from the traditional continuum modelling technique, such as Computational Fluid Dynamics (CFD). In SPH, a set of particles, representing fluid elements, interact with each other based on Navier–Stokes equations using an interpolation function. The SPH particles are free to move through the domain in a Lagrangian frame of reference.31 Although so far several studies have been carried out using SPH method in stenosed artery,32–34 no study has ever been considered the important roles of the RBCs, WBCs, and plasma in shear and von Mises stresses inducing in the plaque, especially NC, as well as the arterial layers, including the intima, media, and adventitia. With these considerations in mind, this study was aimed at determining the vulnerable amount of the stresses and deformations in the plaque as well as the arterial layers due to the interaction of the RBCs, WBCs, and plasma with that of the rupture-prone plaque inside a realistic human atherosclerotic coronary artery.
Materials and methods
Artery model, geometry, mesh, and boundary
A 3D numerical simulation of blood components-plaque-artery interaction was developed to anticipate the stress contours within the plaques and arterial tissue layers during the blood flow under the Reynolds number of 2000 at peak systole.35,36 The model was established on a basis of the computed tomography (CT)/magnetic resonance imaging (MRI) data of an atherosclerosis patient (the ethical consent was signed by the patient and approved by Basir Health Center, the experimental study was also based on the 2008 Declaration of Helsinki) using Mimics (Materialise NV, Leuven, Belgium). The model of all arteries around the heart was obtained as presented in Fig. 1. The highlighted section of the coronary artery was, then, chosen to be simulated as depicted in Fig. 1 as well.
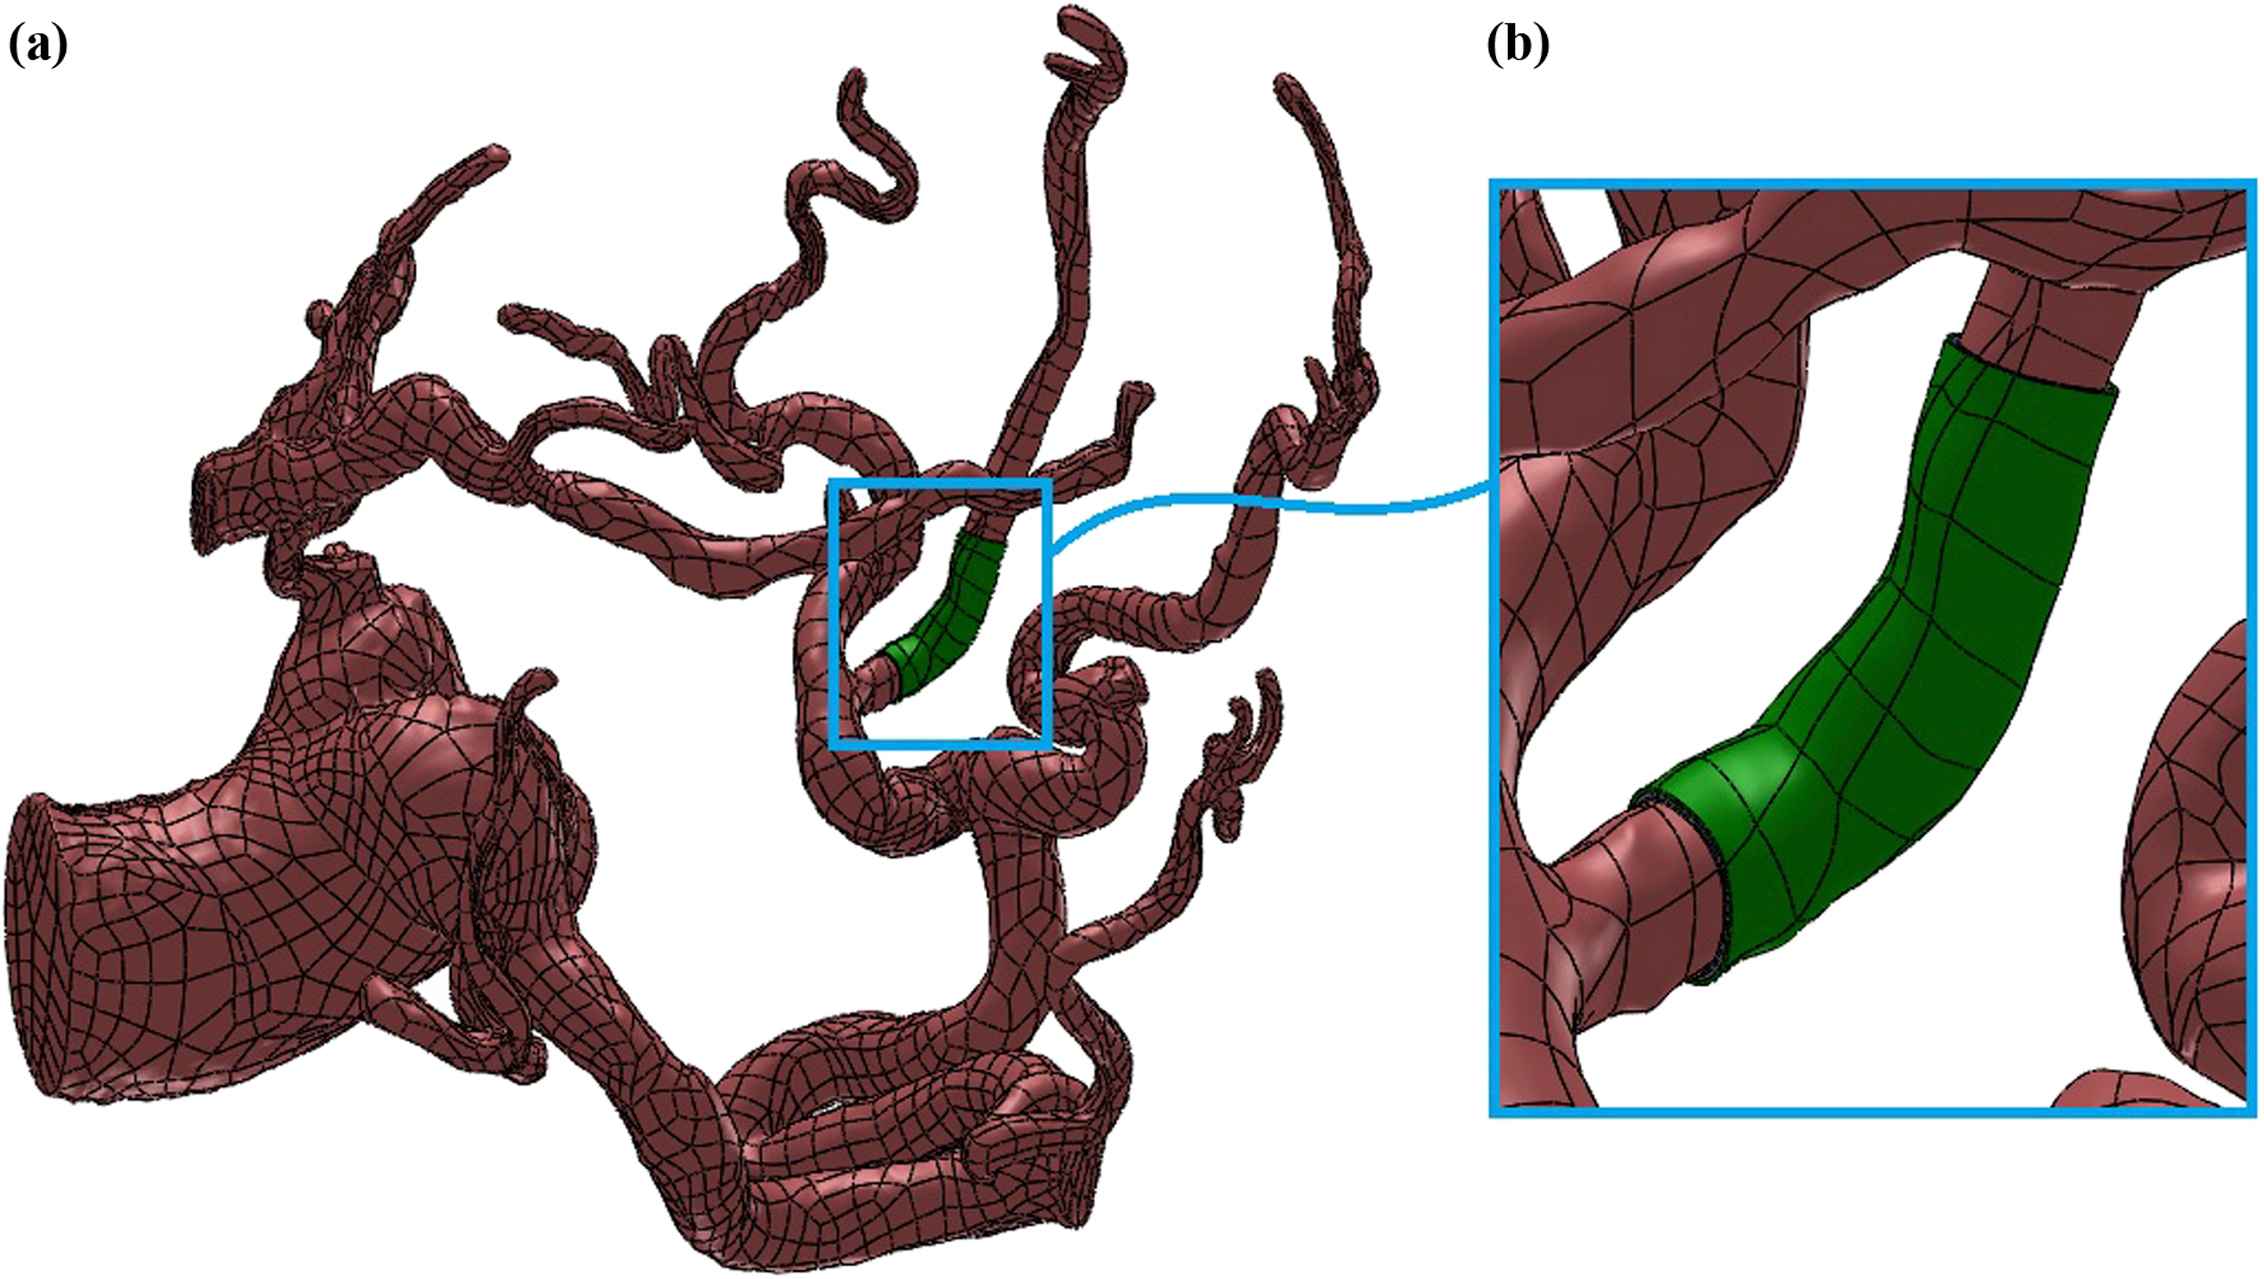
The model of (a) the arteries around the heart. (b) The highlighted section of the arterial wall was selected to be simulated.
The stenosis was ∼30%, which was calculated as following:
Thereafter, the model was input to Solidworks (Dassault Systèmes, Vélizy-Villacoublay, France) for refining to make it possible to have a structured symmetry mesh in the components of the model. The meshing was fulfilled in Femap (Siemens PLM Software, Plano, Texas, United States). The model was, then, input to Abaqus (Dassault Systèmes, Vélizy-Villacoublay, France) for assembly and mesh density analyses (data not reported here). To reach to a suitable mesh density there was several back and forth analyses in both the Femap and Abaqus software. Lastly, the suitably assembled, meshed model was input to the explicit dynamics FE code LS-DYNA 970 (LSTC, Livermore, CA, United States). The final FE model of the arterial layers, plaque, NC, RBCs, WBCs, and plasma are illustrated in Fig. 2.
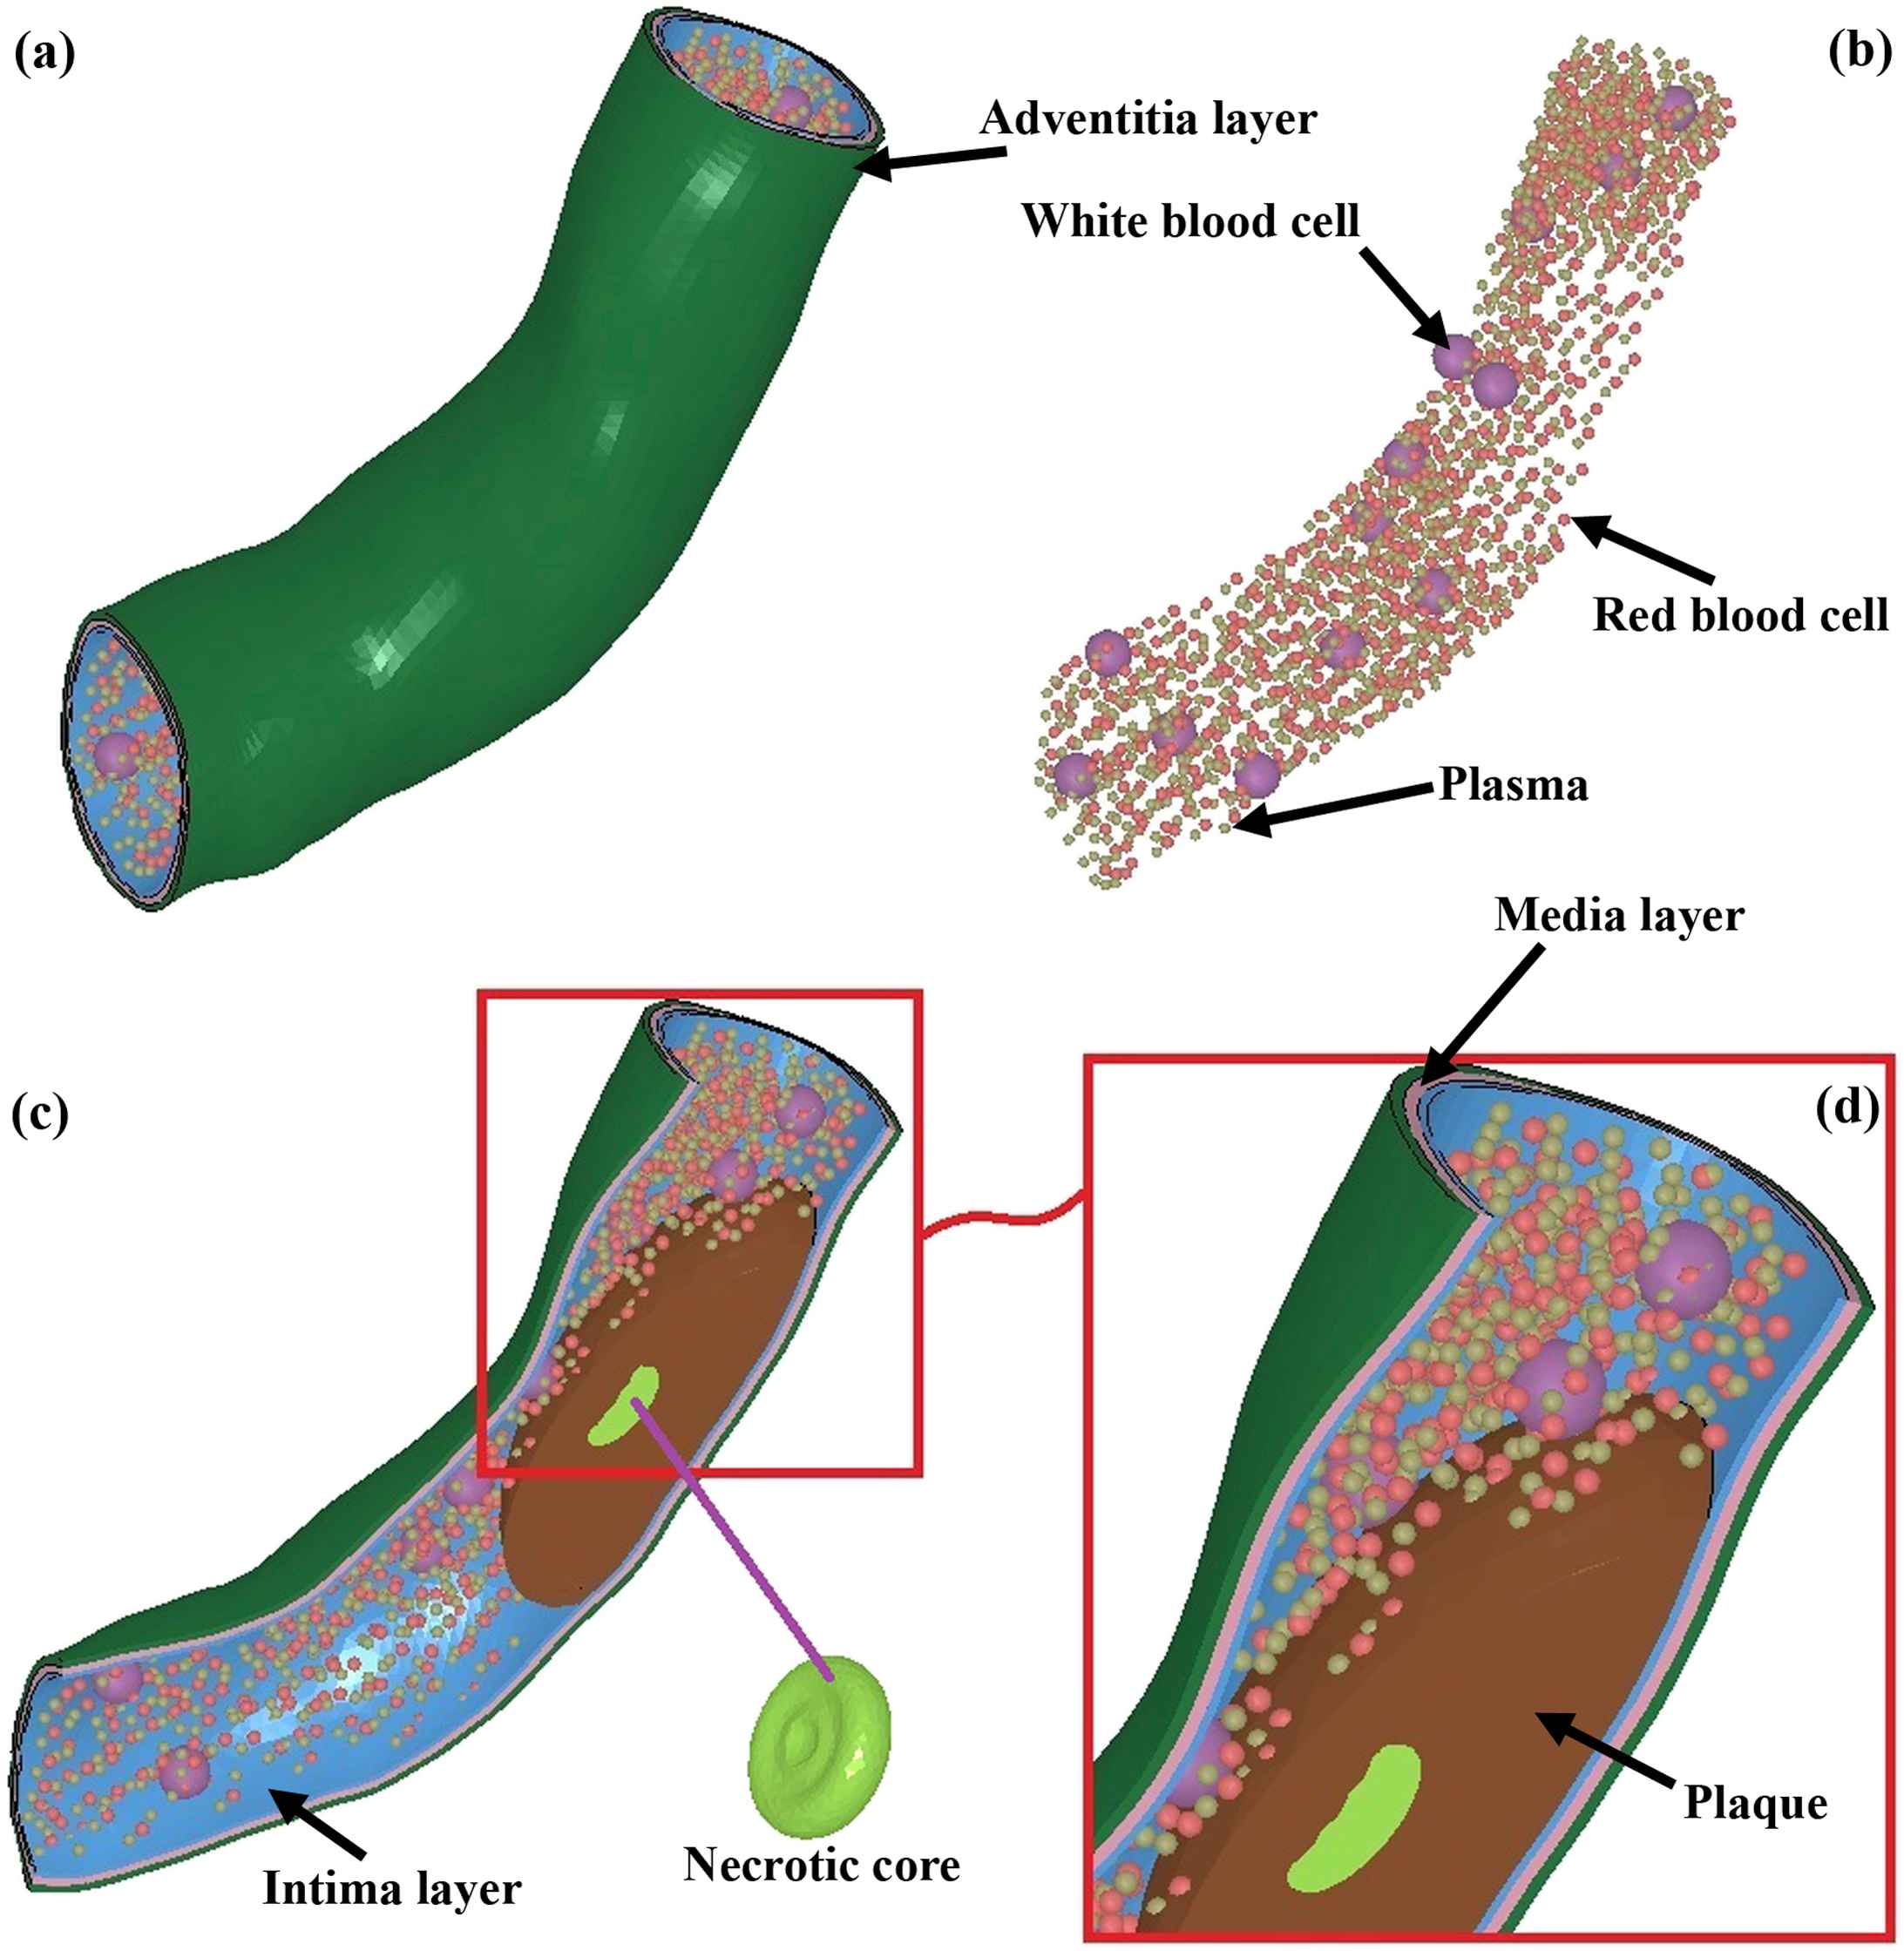
(a) The model of the coronary artery, including the intima, media, and adventitia, in addition to the plaque, NC, RBCs, WBCs, and plasma. (b) To have a better understanding of the blood components, the RBCs, WBCs, and plasma in detail are provided. The size of the particles were all the same, however, to have a clear difference among the components, the WBCs show at a larger size. (c) The detail of the model, including the shape of the NC. (d) The shape of RBCs, WBCs, and plasma components in addition to the plaque from a closer view.
The plaque and artery dimensions were obtained from the previous studies.22,37 Briefly, the interfaces between different artery layers were assumed to be coherent, and treated as perfectly bonded, which was also the case for the interface between the artery wall and the stenotic plaque. In addition, an *CONTACT_ERODING_SURFACE_TO_SURFACE algorithm approach was employed to deal with the nonlinear contact problem between the modeling component surfaces, i.e., plaque/NC and plaque/intima. The formulated numerical problem was highly non-linear, arising from material non-linearities in the constitutive behavior of the arterial layers as well as the kinematic non-linearity in both the large deformation and the progressive blood-plaque-artery contact. The artery on the outer side of the plaque was considered to consist of three tissue layers, including the intima, media and adventitia, with a thickness of 0.10 mm, 0.15 mm and 0.15 mm, respectively.
To minimize the dynamic effects, a few analyses with different values of system-damping coefficient were carried out. It was found that the system-damping coefficient of 10 produces satisfactory results. To reduce the computational time, the kinetic energy was checked throughout the entire analysis to ensure that it was negligible compared to the internal energy as recommended by the developers of LS-DYNA. The level of hourglass energy in the analysis was also measured to ensure that it was within acceptable limits; defined by the developers of LS-DYNA as less than 10% of the internal energy of the process.37 It was also assumed that the blood flow-induced deformations in the arterial wall layers were compatible with the plaque, and NC, that is, there was no regional gap opening or overlap throughout the blow flow process.
Throughout the blood flow, the boundary conditions and loads were updated to reflect the continuously changing blood-plaque-artery interaction. Initial testing of the simulation was performed with small load increments to check the behavior of the model deformation.
Smoothed-particle hydrodynamics (SPH)
A set of particles, as RBCs, WBCs, and plasma were employed to represent continuum fluid domain. The blood in our simulation consisted of 1836 components to represent the RBCs (826–45%), WBCs (13–0.7%), and plasma (997–54.30%). These numbers of components were chosen according to the amount of blood that exists in a 1.50 mm long coronary artery in reality. Each group of particles has its own physical properties, which is smoothed out over the particle-neighboring domain defined by an interpolating kernel function, W. It is numerically interpreted as following:31,38
The physical differential equations can be discretized, using SPH formulations, in different forms.38,40 In this study, the following formulations were adopted to model Navier–Stokes equations:
In SPH methodology, the pressure is related to the density by a quasi–incompressible equation of state. In this work the following equation of state is employed:40
Shear stress accumulation on particles
The uniform distribution of SPH particles in the domain (particles simulating incompressible fluids keep nearly their inter-distance constant) allows the simulation of blood as a continuum domain, with suspending components as RBCs, WBCs, and plasma. Meanwhile, the Lagrangian nature of the SPH gives direct access to the time history of the fluid elements of the blood (SPH particles) moving in the domain. Since in this study the blood is considered a homogeneous single-phase fluid, as is common in macroscale simulation of cardiovascular flows, the properties such as shear stress on blood components need to be approximated by evaluating the same properties at the fluid elements. By this approach, one does not have to employ the complex particulate flow approach and stochastic models.42,43 In addition, there is no need to adopt virtual particle integration method44 to overcome disadvantages inherent to particle injection and tracking techniques.
Material properties
The arterial tissue layers45,46 and three plaques, i.e., the calcified, cellular, and hypocellular22 were defined by a five-parameter Mooney-Rivlin isotropic hyperelastic constitutive equation. This model can adequately describe the non-linear stress–strain relationship of the elastic arterial tissue.22,45,47 An isotropic material has the same mechanical response regardless of loading direction. For an isotropic hyperelastic material the strain energy density function W is a scalar function of the right Cauchy-Green deformation tensor, C.48 The scalar function is composed of either the principal invariants or the principal stretches of the deformation, both of which are derived from the right Cauchy-Green deformation tensor.49–54 Under the assumption that artery and plaque are nearly incompressible and isotropic materials,55–58 the Mooney-Rivlin59,60 model was employed to address the mechanical properties of the arterial layers as well as the plaque components is as following:
The arterial layers as well as the plaque components were assumed to be incompressible which cause the third deviatory strain invariant amount equals to 1 (Ī3 = 1).63
The material coefficients of arterial layers, plaque tissue, RBC, WBC, and plasma are summarized in Table 1.
| Artery model (Mooney-Rivlin) | C10 (MPa) | C01 | C20 | C11 | C02 |
| Intima | −0.80462 | 0.91017 | −4.3602 | 8.9856 | −3.2629 |
| Media | −42.979 | 44.229 | −39.617 | −135.670 | 255.52 |
| Adventitia | −121.1 | 126.08 | 1113.9 | −2895.1 | 1964.3 |
| Necrotic core | 0.165 | 0.016 | 0 | 0.955 | 0 |
| Calcified plaque | −0.495 | 0.506 | 3.637 | 1.193 | 4.737 |
| Cellular plaque | −0.802 | 0.831 | 0 | 1.157 | 0 |
| Hypocellular plaque | 0.165 | 0.016 | 0 | 0.955 | 0 |
| Blood model (SPH) | Volume in the blood (%) | ρ (kg/m3) | Shear modulus (Pa) | Failure stress (Pa) | Failure strain (%) |
| Red blood cell | 45 | 1106 | 9 | 12 | 75 |
| While blood cell | 0.7 | 1080 | 2.5 | 18.90 | 75 |
| Plasma | 54.30 | 1000 | 20 | 0.003 | 28 |
Results
The blood flow can gradually affects the plaque in terms of the stresses and deformations, and eventually causes plaque rupture. That is, the stress as a result of the blood flow inside an artery will subject the plaque and artery to high stresses that can injure the tissue, potentially leading to further smooth muscle cell proliferation, and neointimal hyperplasia. The objective of this study was to investigate the influence of blood components in the injury occurs in the plaque and NC as well as the arterial layers within a realistic model of a stenosed artery.
The contours of the von Mises stress in the arterial layers for three types of plaques, including the calcified, cellular, and hypocellular were calculated and presented in Fig. 3. The stresses in the intima layer of the coronary artery were found to be 97, 48.65, and 196.10 kPa in the presence of the calcified, cellular, and hypocellular plaque tissues, respectively. The results in the intima, therefore, showed the highest amount of stress in the shoulder of the hypocellular plaque in the intima layer while the lowest one was observed at the same location for the cellular plaque. The stresses in the media layer were observed to be 32.18, 26.15, and 67.62 kPa for the calcified, cellular, and hypocellular plaque tissues, respectively. The stresses in the adventitia, which is the outset layer of the artery were 89.74, 75.79, 195.80 kPa for the calcified, cellular, and hypocellular plaque tissues, respectively. The von Mises stresses in the arterial layers well imply the mechanical strength of the adventitia layer compared to the other two layers following by the intima and media layers of the coronary artery.
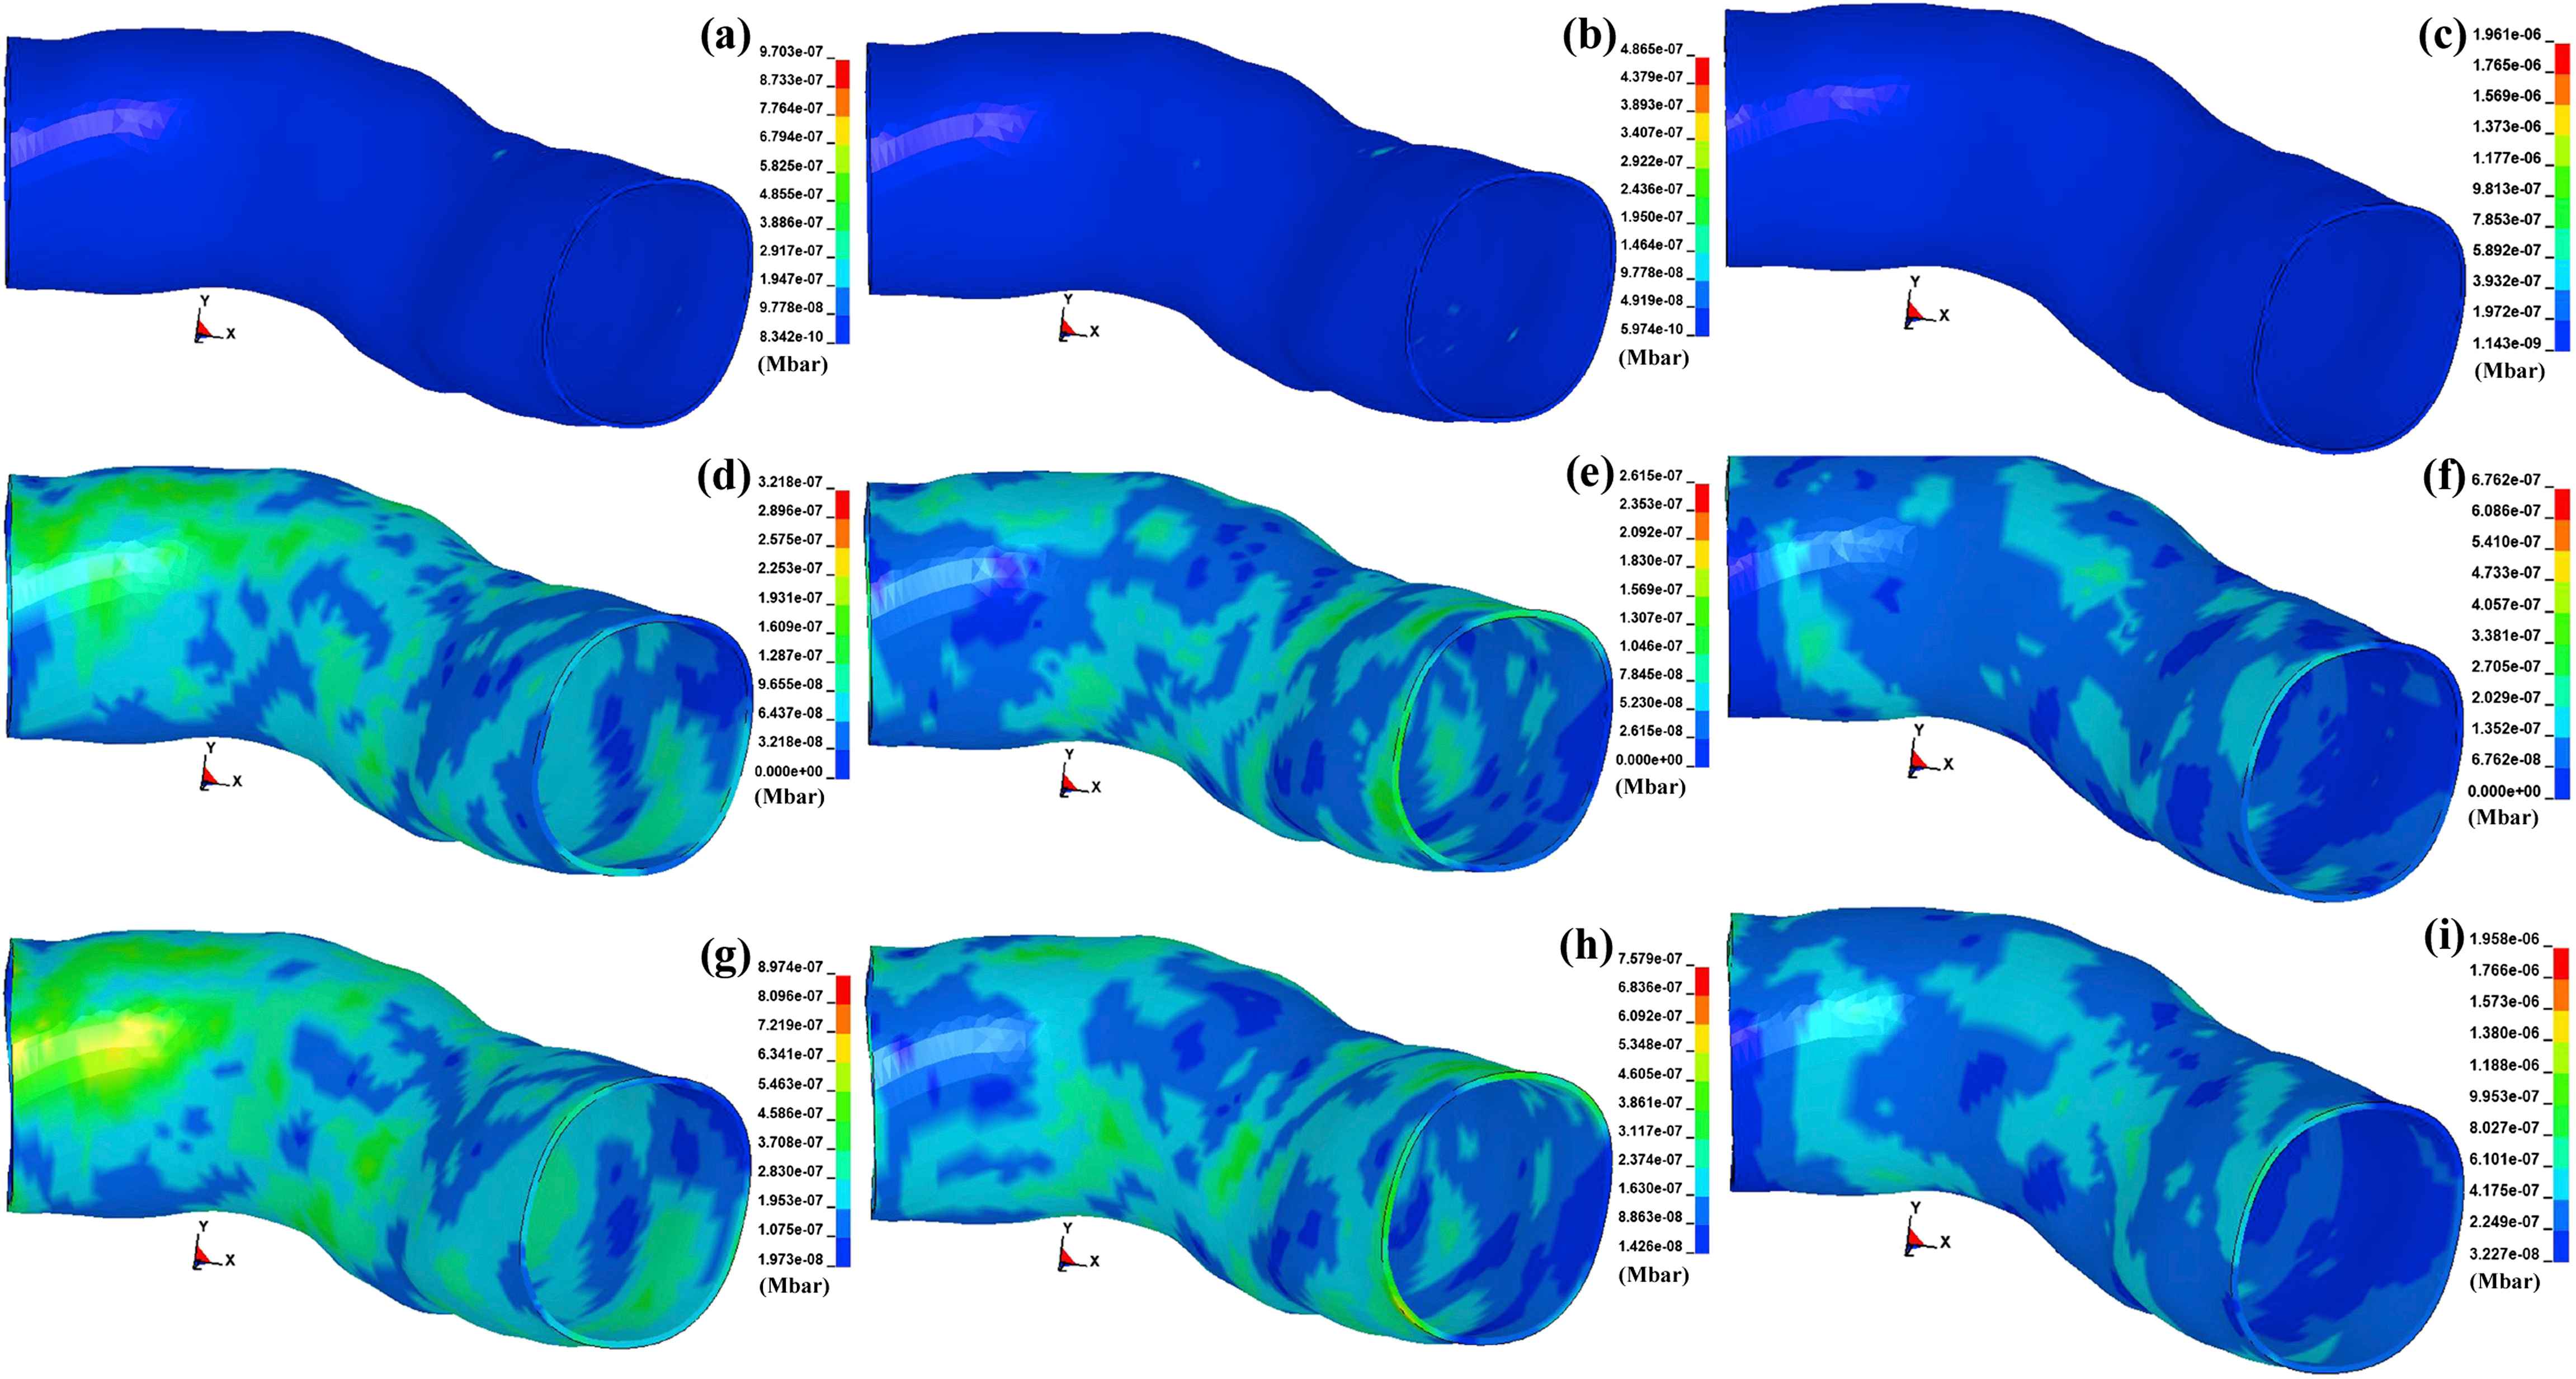
The von Mises stress contours in the arterial layers. The stress in the intima for the (a) calcified, (b) cellular, and (c) hypocellular plaques. Similarly, the stress in the media for the (d) calcified, (e) cellular, and (f) hypocellular plaques. Eventually, the stress in the adventitia for the (g) calcified, (h) cellular, and (i) hypocellular plaques.
The contours of the maximum shear stress in the arterial layers for three types of plaques, including the calcified, cellular, and hypocellular were calculated and displayed in Fig. 4. The stresses in the intima layer of the coronary artery were found to be 52.86, 25.69, and 105.40 kPa for the calcified, cellular, and hypocellular plaque tissues, respectively. The stresses in the media layer were observed to be 18.10, 14.90, and 38.13 kPa for the calcified, cellular, and hypocellular plaque tissues, respectively. The stresses in the adventitia, which is the outset layer of the artery were 51.02, 43.76, 105.60 kPa for the calcified, cellular, and hypocellular plaque tissues, respectively. The maximum shear stresses in the arterial layers well imply the mechanical strength of the adventitia layer compared to the other two layers following by the intima and media layers of the coronary artery.
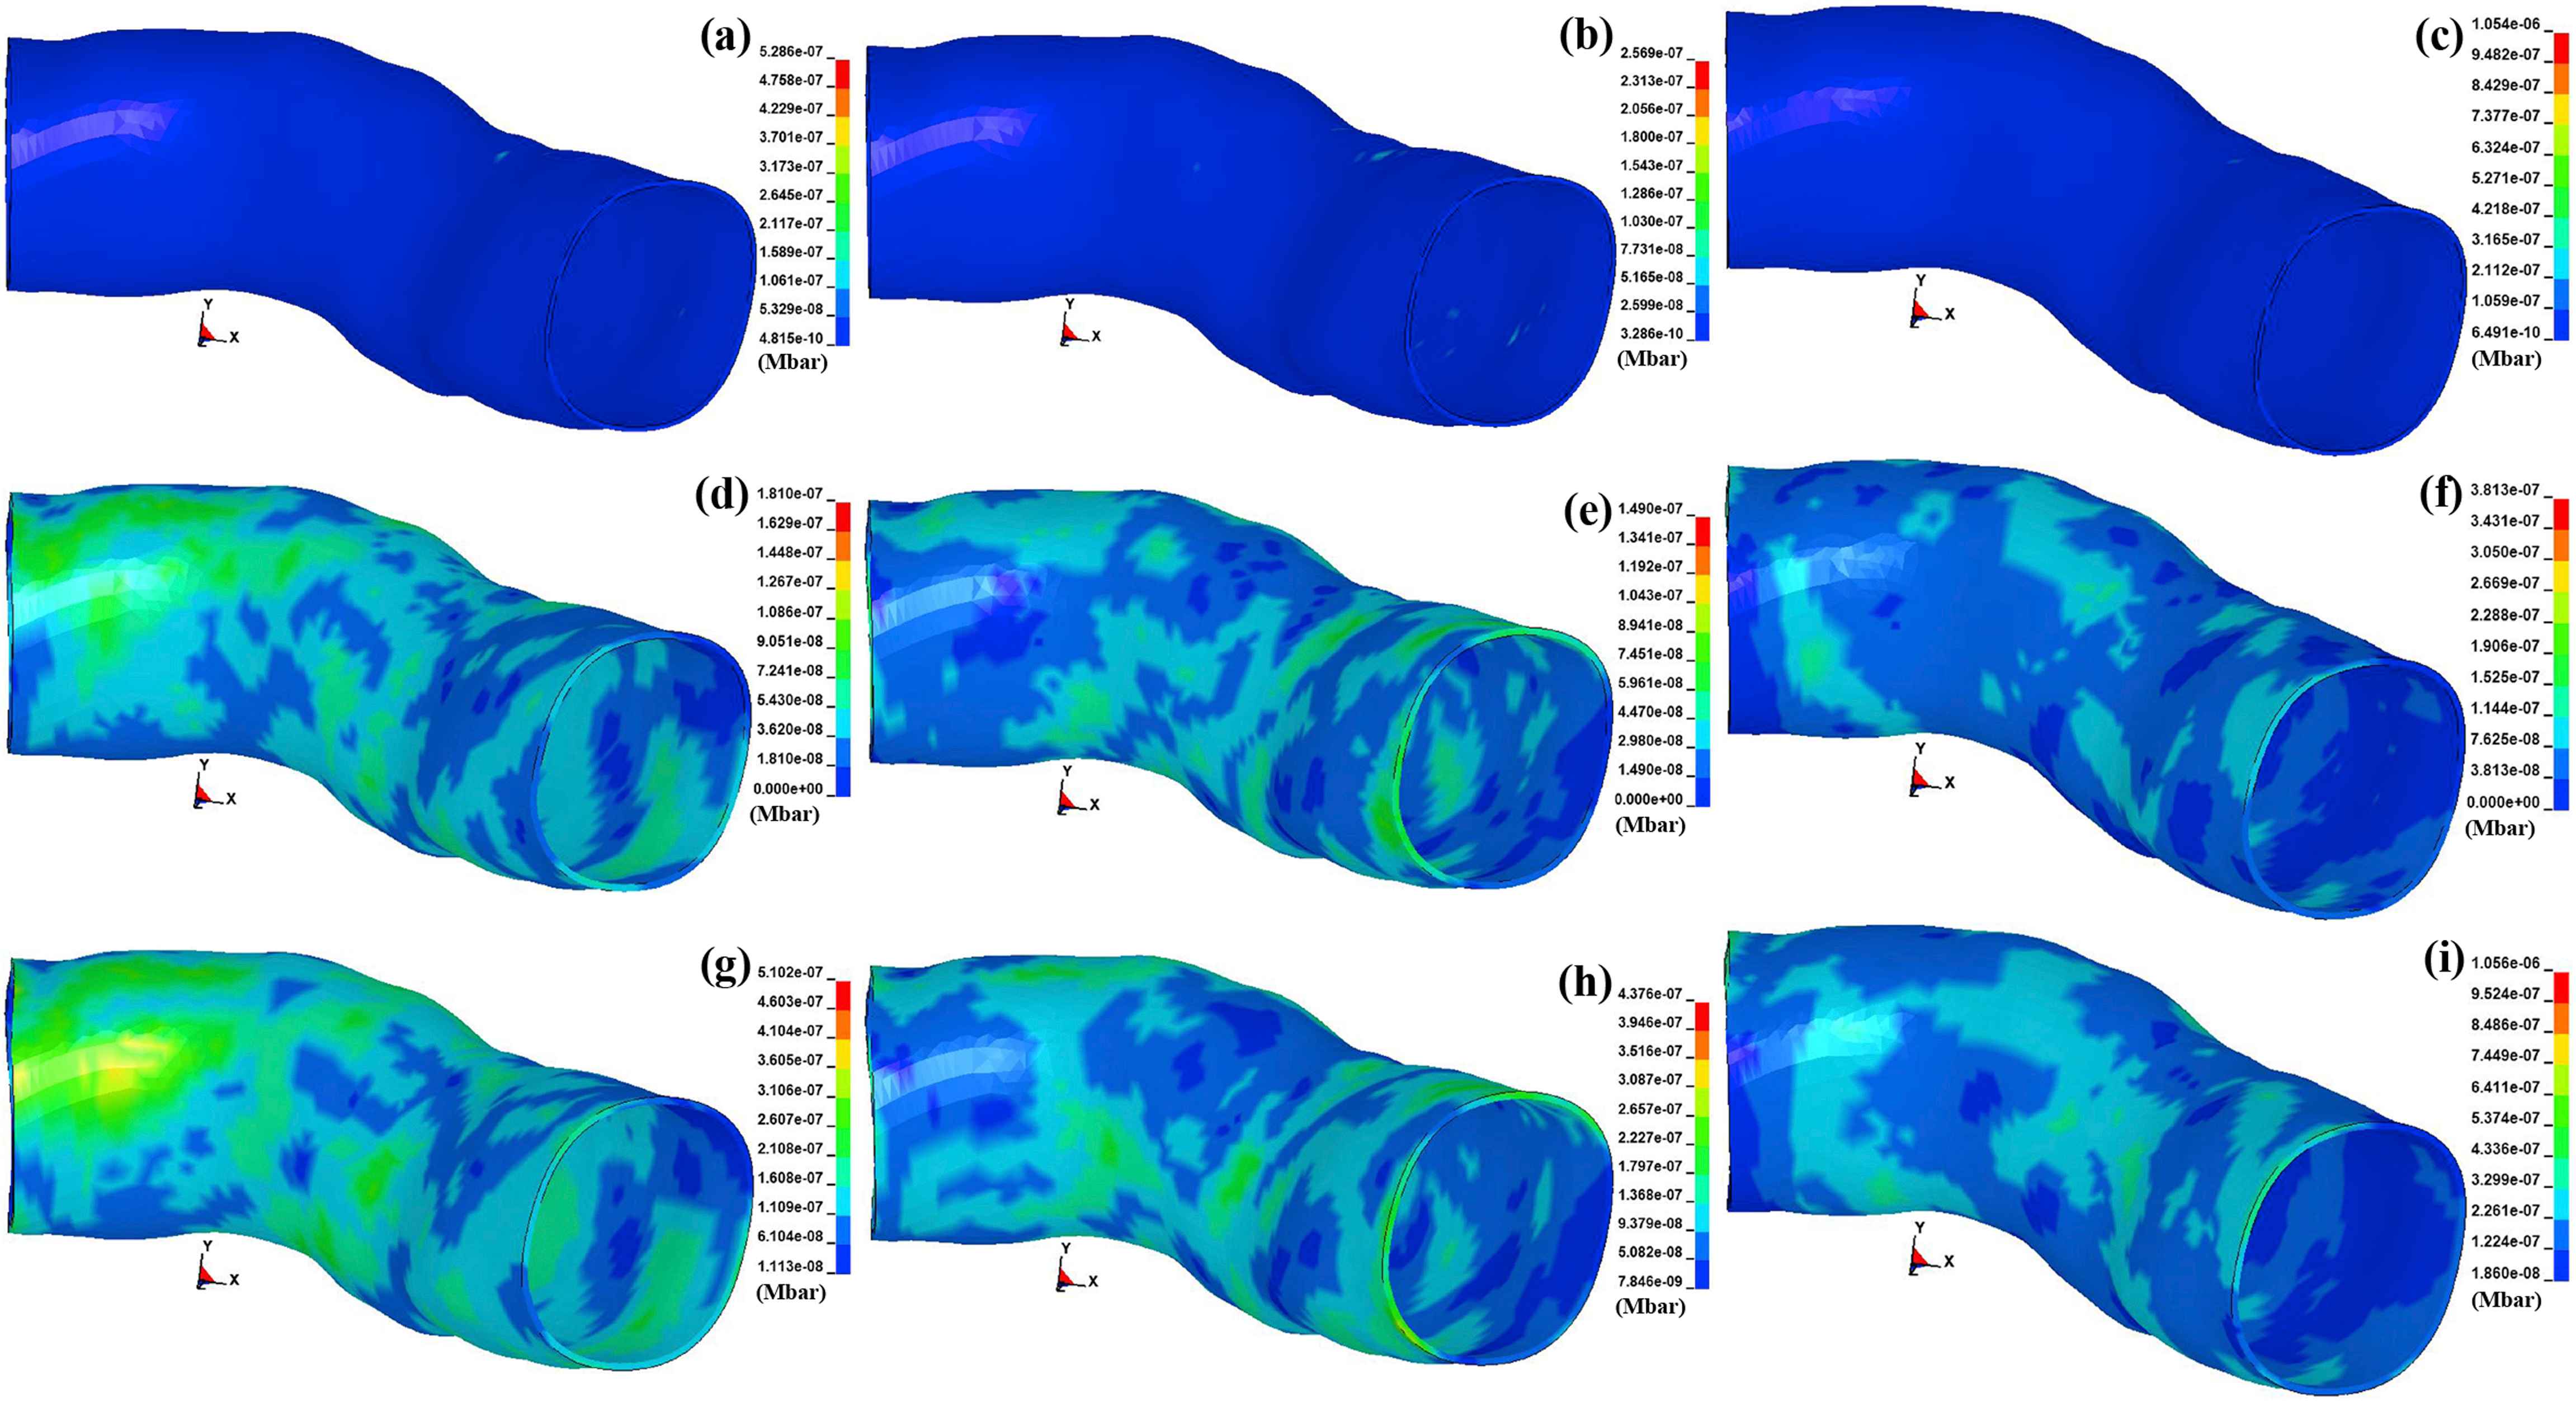
The maximum shear stress contours in the arterial layers. The stress in the intima for the (a) calcified, (b) cellular, and (c) hypocellular plaques. Similarly, the stress in the media for the (d) calcified, (e) cellular, and (f) hypocellular plaques. Eventually, the stress in the adventitia for the (g) calcified, (h) cellular, and (i) hypocellular plaques.
The contours of the von Mises and maximum shear stresses in the plaque tissues, i.e., the calcified, cellular, and hypocellular were computed and indicated in Fig. 5. The amount of the von Mises stresses were found to be 18.11, 8.90, and 21.09 kPa for the calcified, cellular, and hypocellular plaque tissues, respectively. The maximum shear stresses were 10.30, 4.61, and 11.81 kPa for the calcified, cellular, and hypocellular plaque tissues, respectively. Regardless of the stress types, the results revealed the highest stress in the hypocellular plaque while the lowest one was observed in the cellular one following by the calcified plaque. It implies the vulnerability of the calcified and cellular plaques to rupture compared to the hypocellular one.
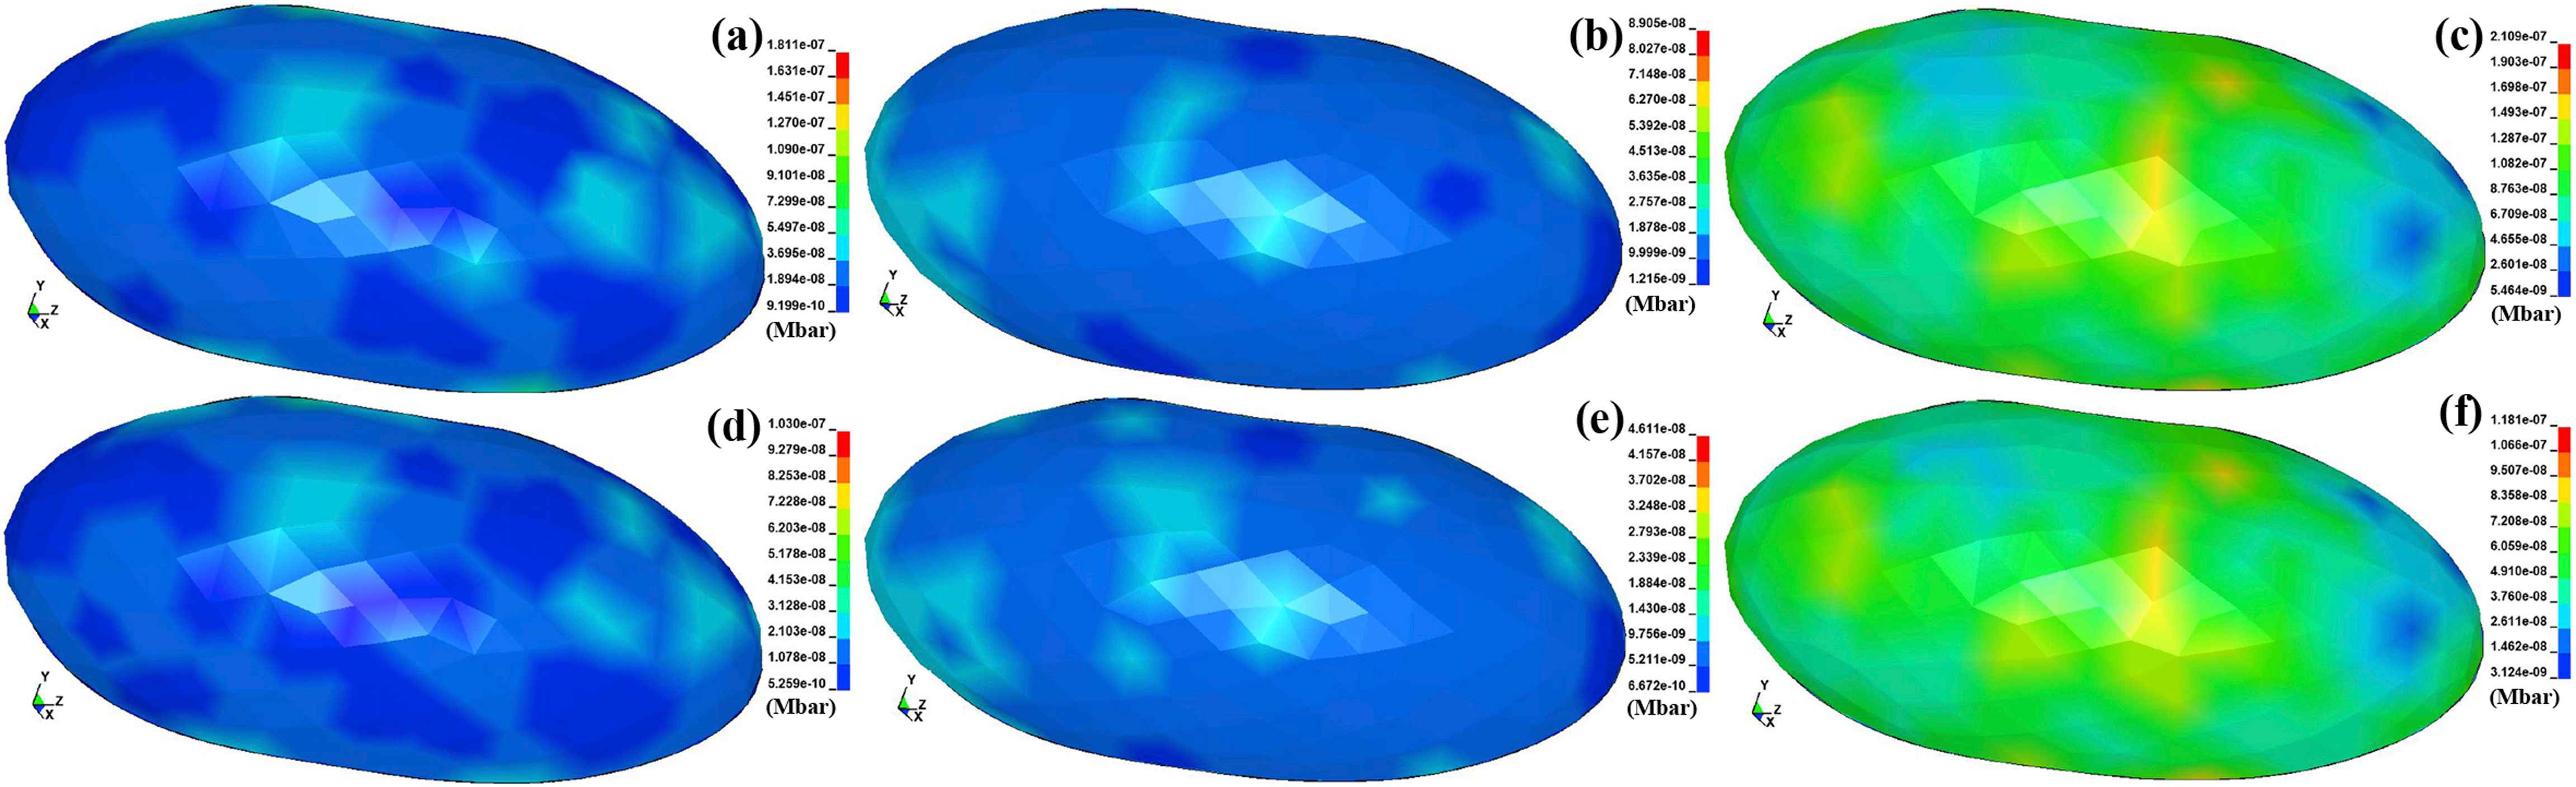
The von Mises stress contours in the (a) calcified, (b) cellular, and (c) hypocellular plaques. The maximum shear stress contours in the (d) calcified, (e) cellular, and (f) hypocellular plaques.
The contours of the von Mises and maximum shear stresses in the NC in the presence of the calcified, cellular, and hypocellular are depicted in Fig. 6. The amount of the von Mises stresses were found to be 0.12, 0.11, and 0.12 kPa for the calcified, cellular, and hypocellular plaque tissues, respectively. The maximum shear stresses were 0.06, 0.06, and 0.06 kPa for the calcified, cellular, and hypocellular plaque tissues, respectively. Regardless of the stress types, the results revealed the type of the plaque has no effect on the amount of the stresses, which occur in the NC during the blood flow inside an atherosclerotic artery.

The von Mises stress contours in the NC for the (a) calcified, (b) cellular, and (c) hypocellular plaques. The maximum shear stress contours in the NC for the (d) calcified, (e) cellular, and (f) hypocellular plaques.
The contours of the von Mises stress in the blood components, such as the plasma, RBC, and WBC in the presence of the calcified, cellular, and hypocellular are illustrated in Fig. 7. The amount of the stresses in the plasma particles were 3.01e-6, 3e-6, and 3.02 e-6 kPa for the calcified, cellular, and hypocellular plaque tissues, respectively. The stress in the RBCs were 6.84e-3, 6.06e-3, and 6.87e-3 kPa for the calcified, cellular, and hypocellular plaque tissues, respectively. Eventually, the stress in the WBCs were 1.29e-4, 1.27e-4, and 1.03e-4 kPa for the calcified, cellular, and hypocellular plaque tissues, respectively.

The von Mises stress contours in the blood components. The stress in the plasma particles for the (a) calcified, (b) cellular, and (c) hypocellular plaques. Similarly, the stress in the RBCs for the (d) calcified, (e) cellular, and (f) hypocellular plaques. Eventually, the stress in the WBCs for the (g) calcified, (h) cellular, and (i) hypocellular plaques.
The resultant displacement in the arterial layers versus the simulation time in the presence of the calcified, cellular, and hypocellular plaque tissues were calculated and exhibited in Fig. 8. The results regardless of the arterial layers revealed the highest deformation in the shoulder of the hypocellular plaque following by the calcified and cellular ones. The deformations of 0.0095, 0.0085, and 0.0075 mm were observed in the intima, media, and adventitia, respectively, in the presence of the hypocellular plaque. While the deformation of 0.0045, 0.004, and 0.0035 mm were observed in the intima, media, and adventitia, respectively, in the presence of the cellular plaque.
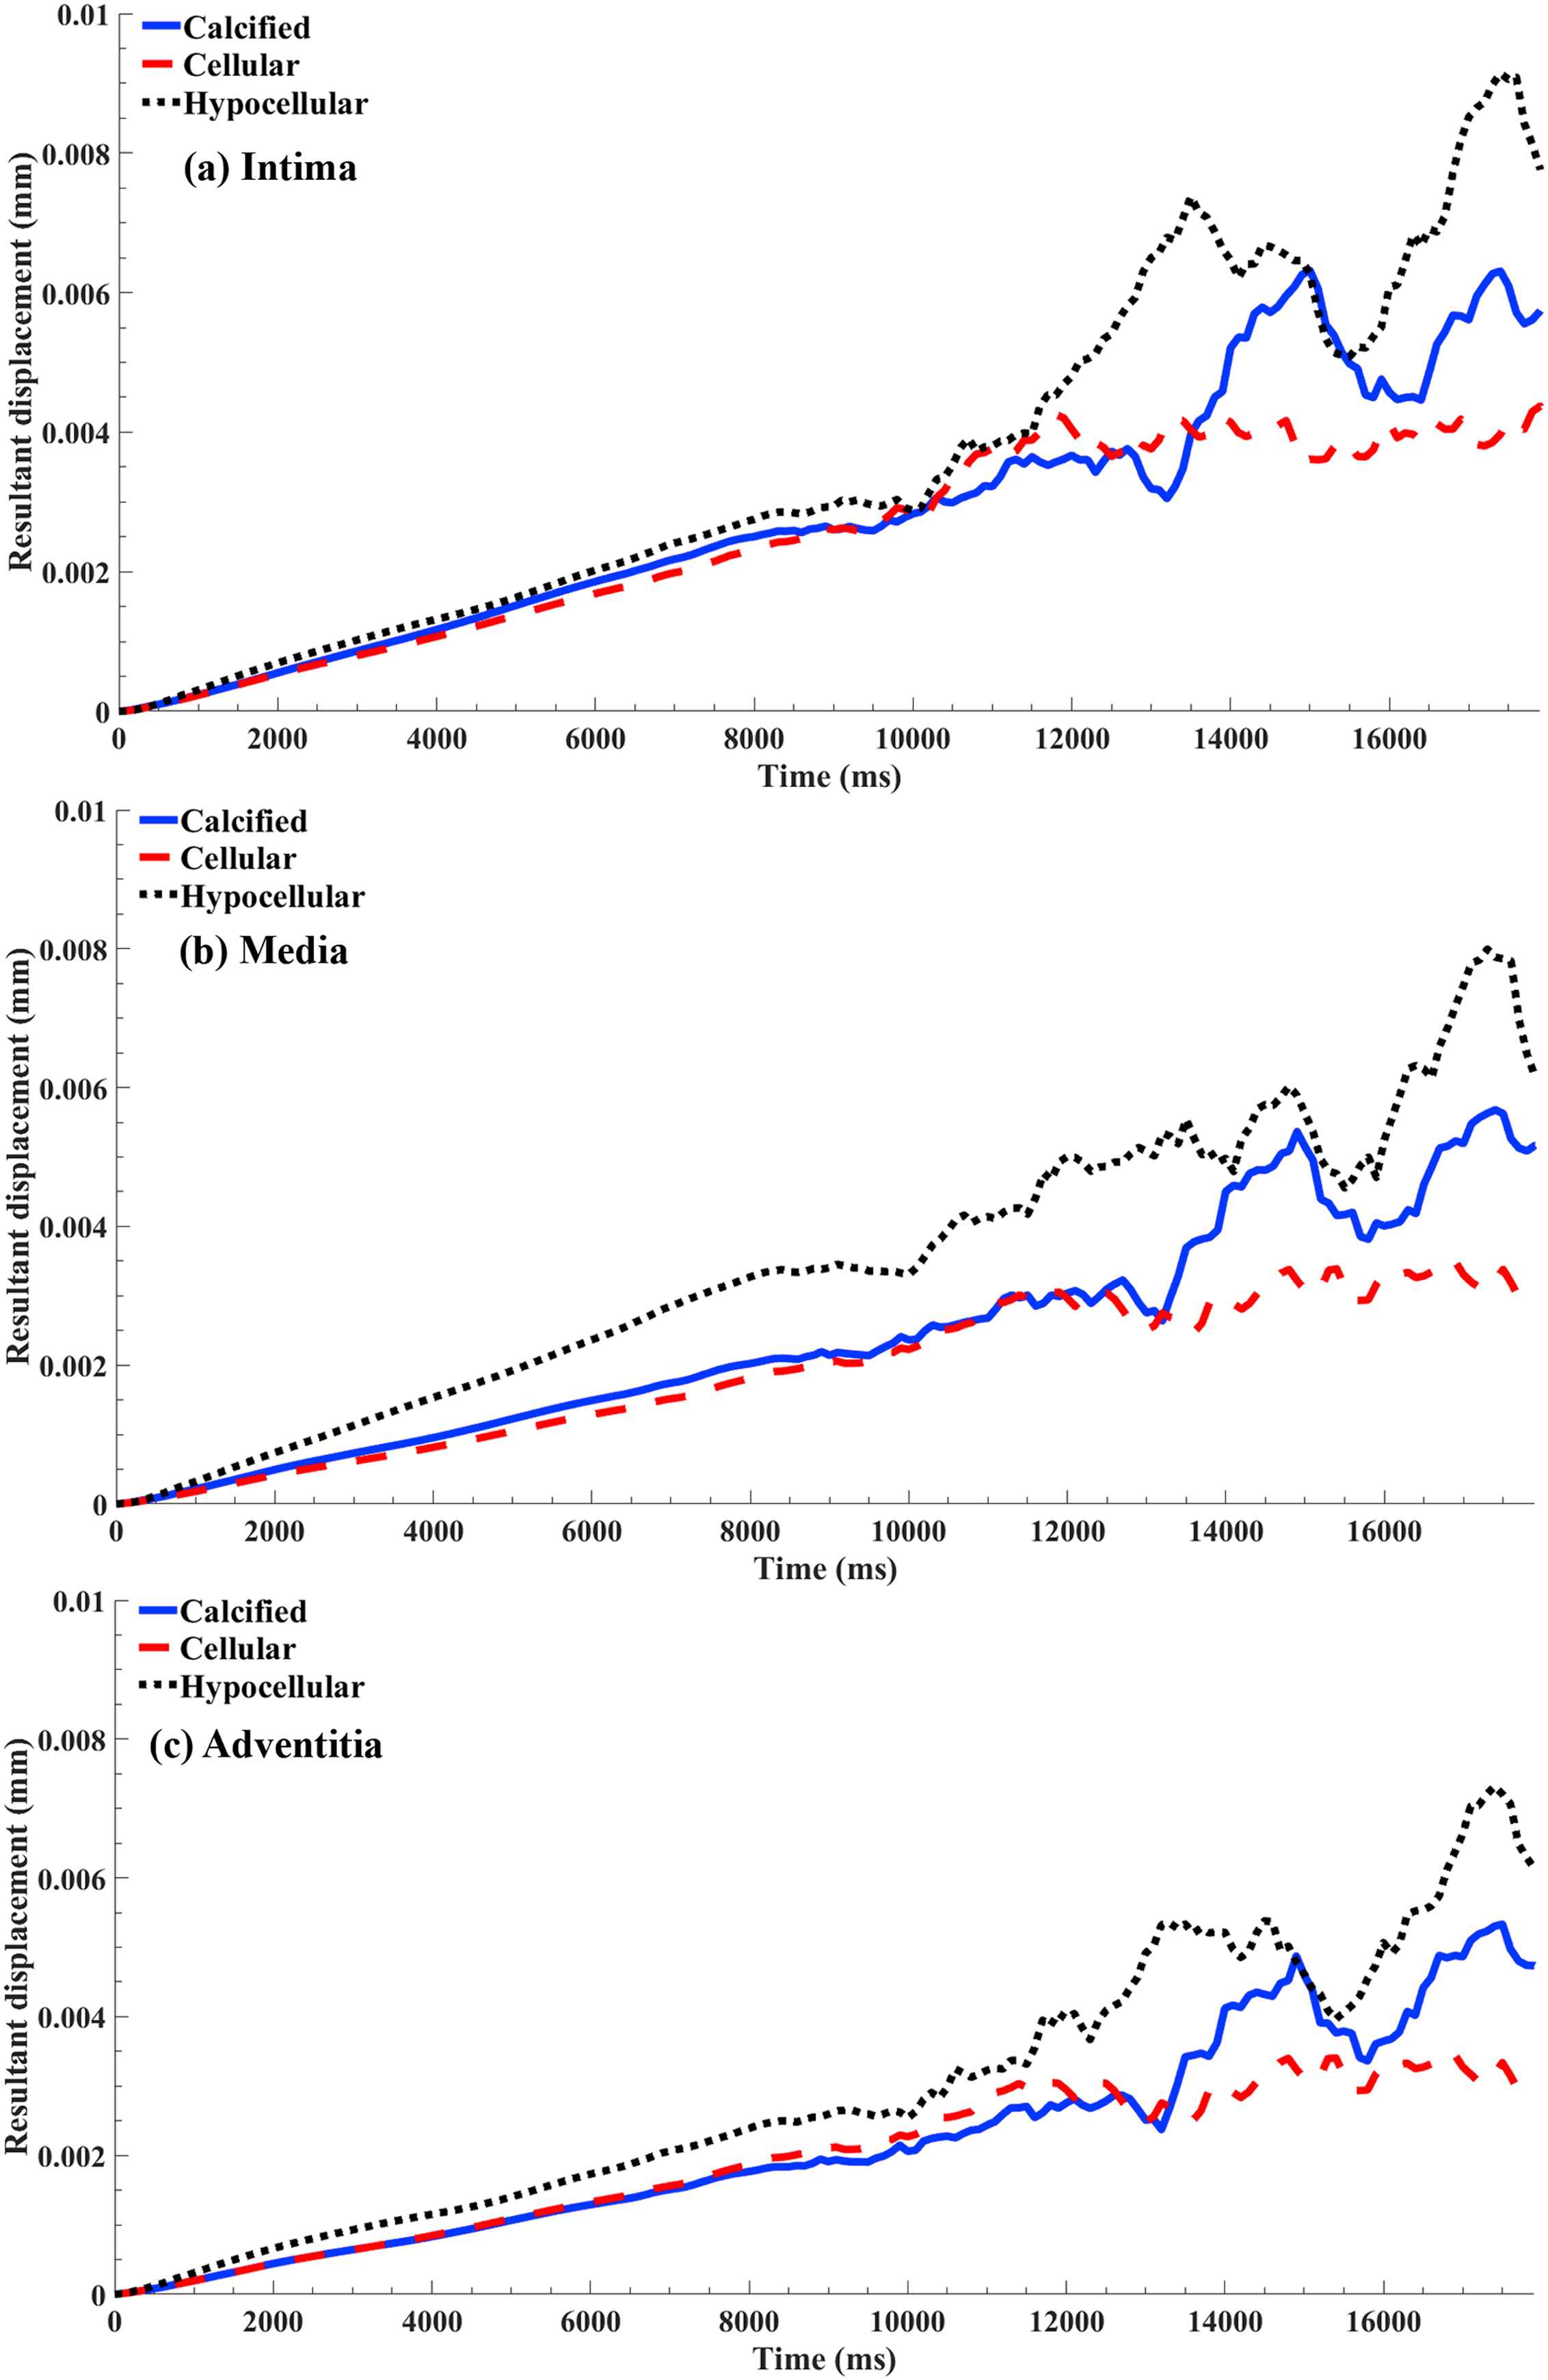
The resultant displacement versus the simulation time for the nodes in the arterial layers attached to the plaque shoulder. The results plot for the calcified, cellular, and hypocellular plaques in the (a) intima, (b) media, and (c) adventitia layers.
Discussions
The stress of the plaque wall if exceeds its mechanical strength can cause plaque rupture.64 Rupture of an atherosclerotic plaque associated with partial or complete thrombotic vessel occlusion is fundamental to the development of ischemic coronary syndromes.4 Thromboembolism is a predictable consequence of plaque rupture, which itself represents structural failure of a components of the diseased vessel. It is, therefore, possible that the biomechanical properties of atheromatous lesions significantly influence the probability of rupture. Recognizing which features contribute to this increased vulnerability may improve risk stratification and allow aggressive interventions to be targeted to plaques at particularly high risk of rupture.
Stress analysis in the arterial layers showed a low stress within the media and intima layers while a high stress within the adventitia layer. The results also showed that the effect of varying the plaque types on the von Mises stress of arterial layers was notable for them (Fig. 3). The highest stress locations in the arterial layers where the plaques are in full contact with the arterial layer. Moreover, regardless of plaque types, the computed stresses in the media and adventitia layers were shown to be within or much less than that of experimental ultimate strength of these layers and, as a result, these tissues would tolerate the imposed stress.18–21
Wall shear stresses were maximal immediately proximal to the area of maximal stenosis and minimal distally above the area of recirculating blood distal to the stenosis (Fig. 5). The findings of this study revealed the stresses in the range of 14.90–105.60 kPa, which is in agreement with the previous study, which reported the range of 13.70–143.20 kPa under the lower maximal systolic blood pressure of 140 mmHg.65 In addition, they showed that the upstream and downstream shoulder regions experienced the highest stresses,66 which were closely in the same range as reported in the concurrent study. From fracture mechanics, it is known that the sequence of catastrophic rupture events initiate from defects in materials subjected to a state of tension or shear stresses and not from compression.67 This is why here we both used the von Mises and shear stresses, which are better suited for rupture analyses since this scale allows depiction of both compressive and tensile forces. Since stress levels are linearly related to blood pressure, hypertension which is a risk marker for cardiovascular events,68 causes increased levels of mechanical stress that could have a direct effect on plaque rupture. Mechanical stimuli in the form of cyclic stretch have also been linked to modulations of gene-expression and cellular function of smooth muscle cells and endothelial cells.69 Shear stresses have been linked to plaque progression.70 Recent results also suggest a direct link between shear stress and the risk of fibrous cap rupture.71 However, shear stress levels may influence biological pathways causing build-up of destabilizing components like macrophages and metalloproteinase-9,72 which may affect plaque vulnerability.73
Histological data suggest that plaques at high risk of rupturing and causing subsequent ischemia are characterized by large NC with thin overlying fibrous cap, together with an abundance of inflammatory cells.74 The highest stress in the plaque was also seen to be located in the shoulder of the hypocellular plaque, while the lowest ones were observed in the calcified and cellular plaques which imply the vulnerability of these plaques to rupture (Figs. 5 and 6) which is in good agreement with the previous data.7,75 This issue is also in agreement with our previous studies, which showed the vulnerability of the calcified plaque to rupture compared to the hypocellular one.18–21 It is well established among clinical and biomechanical researchers that a plaque is most vulnerable in areas of stress concentration and that the initial crack initiates at the location of maximum stresses.76,77 The consistency in finding the peak stresses in the shoulder regions of the plaque seems to support the notion that plaque rupture may be associated with foci of high plaque stress. The appearance of the stresses at these locations could be explained by the configuration of the various plaque components in relation to each other.78 An alternative explanation is that the three groups of plaques have a differential inflammatory load that might alter the structural integrity of both the periluminal cap region as well as the media, but the effects of which remain subcellular and not discernible by conventional MR imaging. Support for the latter explanation comes from data that suggest that asymptomatic and symptomatic plaques have differing amounts of inflammation.79,80 The stress in the NC was found to have the same value regardless of the plaque type in its around which implies that during the blood flow the NC does not affect by the plaque (Fig. 6).
Regarding the components of the blood, i.e., plasma, RBCs, and WBCs, which are the main reason of stress inducing in the plaque tissue and arterial layers, the results revealed a higher von Mises stress for the downstream components of the plasma regardless of the plaque type (Fig. 7a). That is, the plasma particles experienced a higher stresses when they passed the stenosed area of the artery. When it comes to the RBCs and WBCs, the results showed the highest stress in the area, which the particles are in direct contact with the plaque regardless of the type of the plaque (Fig. 7b and c). This implies that the RBCs and WBCs may damage when they interact with the plaque during their normal circulation.
The results in regard of the deformation in the arterial layers where the plaques are in direct contact with them were also interpreted. The results showed a higher deformation for the intima layer whereas a lower deformation for the adventitia, which is quite understandable due to their anatomical location in the artery (Fig. 6). The highest deformation among the arterial layers were observed during the presence of the hypocellular plaque while the lowest deformation was seen in the presence of the cellular one. The fluctuations in the curves after the simulation time of 10000 μs related to the damping coefficient applied by the system to control the homogeneity of the arterial layers during the systole pressure.
Although the present study investigated the vulnerability within arterial and plaque tissues using nonlinear FE analysis, there are some simplifications that should be improved in future studies. In the present model, the nonlinear nature of arterial plaques was accounted by the application of the Mooney-Rivlin hyperelastic constitutive model. All tissues, including artery and plaque were assumed to be incompressible, isotropic, and homogenous. However, atherosclerotic plaques have been shown to be heterogeneous,81 viscoelastic,8 or perhaps visco-hyperelastic.82 Accessing atherosclerotic type-specific differences in the structure and mechanical properties of different tissue components in plaques will be an important development for future FE models of blood–artery interactions. In addition, the application of the SPH elements made us to use particles at the same dimensions, which might impose an error to our simulation. Despite these simplifications, the present model demonstrates the importance of the plaque type in terms of the potential injury to a stenosed artery, injury that may have significant implications for balloon angioplasty, and stenting.
Conclusions
In this study, the application of SPH, a fully Lagrangian meshfree method, was extended to simulate blood flow in a stenosed artery. Therefore, the plasma, RBC, and WBC particles were flew in the atherosclerotic artery using the SPH elements and the resulted stresses and deformations in the arterial layers, i.e., the intima, media, and adventitia, and plaque tissues, including the calcified, cellular, and hypocellular, in addition to the NC were calculated and compared. The results revealed the highest stresses in the adventitia layer in the presence of the hypocellular plaque. In addition, the plasma experienced the highest stress in the downstream of the blood flow while the RBCs and WBCs showed the highest stresses in the area where in the direct interaction with the plaque tissue.
Conflicts of interest
None declared.
Funding
This research received no specific grant from any funding agency in the public, commercial, or not-for-profit sectors.
References
Cite this article
TY  - JOUR
AU  - Alireza Karimi
AU  - Reza Razaghi
PY  - 2018
DA  - 2018/11/19
TI  - Interaction of the blood components and plaque in a stenotic coronary artery
JO  - Artery Research
SP  - 47
EP  - 61
VL  - 24
IS  - C
SN  - 1876-4401
UR  - https://doi.org/10.1016/j.artres.2018.11.002
DO  - 10.1016/j.artres.2018.11.002
ID  - Karimi2018
ER  -