
Effects of dynamic range variations on the Doppler flow velocities of common carotid arteries
Present address: Mawlai Kyntonmassar, Block B, Shillong 793008, Meghalaya, India.
- DOI
- 10.1016/j.artres.2018.02.001How to use a DOI?
- Keywords
- Common carotid artery; Dynamic ranges; End diastolic velocity; Peak systolic velocity; Ultrasound
- Abstract
Introduction: Doppler ultrasound is the commonest diagnostic tool used to evaluate the internal, external and common carotid arteries (CCA). Peak systolic velocity (PSV) is the best Doppler parameter for quantifying carotid artery degree of stenosis.
Materials and methods: Normal Doppler waveforms of 24 CCA from 12 healthy individuals of age 22–28 years were analysed in the department of radiology, NEIGRIHMS, Shillong. PSV, EDV and RI at 9 MHz transducer frequencies and variable DR of 35,45,55,65,75 &85 Decibels (dB) were compared.
Statistical analysis: One-Way repeated measures ANOVA; parameters expressed as Mean ± SEM. p value significant at <0.05.
Aim: To study the effect of variable dynamic ranges (DR) on the PSV, end diastolic velocity (EDV) and resistive index (RI) of CCA.
Results: For PSV of the right CCA at 9 MHz, there was significant differences on variable DR as determined by One-Way repeated measures ANOVA [F (5, 55) = 5.54, p < 0.05]. There was however no significant differences in the PSV of the left CCA; EDV and RI at variable dynamic ranges in both the right and left CCA. Summarised mean value for all PSV of both sides shows significant difference between variable dynamic ranges as determined by One-Way repeated measures ANOVA [F (5, 115) = 2.85, p < 0.05] and Post-hoc analysis revealed that there was a significant difference only between 35 dB to 55 dB and 85 dB.
Conclusion: Variable DR while improving sonographic contrast result in significant variation of PSV in the CCA particularly on the right CCA.
- Copyright
- © 2018 Association for Research into Arterial Structure and Physiology. Published by Elsevier B.V. All rights reserved.
- Open Access
- This is an open access article distributed under the CC BY-NC license.
Introduction
Ultrasound equipment calculates the velocity of blood flow according to the Doppler equation ΔF=(FR-FT) = 2.FT.V.Cos Ө/c where ΔF- is the Doppler frequency shift, FR – the frequency of sound reflected from the moving target, FT-the frequency of sound emitted from the transducer, V- velocity of the target towards the transducer, C- velocity of sound in the medium, Ө – angle between the axis of flow and the incident ultrasound beam.1 Therefore Doppler frequency shift is directly proportional to the velocity of target assuming that the transmitted sound and speed of sound in tissues is constant.
In medical ultrasound imaging, dynamic range (DR) is defined as the difference between the maximum and minimum values of the displayed signal to display and it is one of the most essential parameters that determine its image quality,2 DR is expressed in decibels (dB), higher the dynamic range means more shades of grey and lower dynamic range means more contrast to the images.
On the other hand increase in peak systolic velocity (PSV) and end diastolic velocity (EDV) above a certain level can predict degree of stenosis in the internal carotid artery with high percentage of sensitivity and specificity on colour duplex ultrasound.3
While variation of dynamic ranges (DR) can be used for enhancing resolution of sonographic images, exact velocity readings in a disease carotid artery is important for predicting the degree of stenosis. The effect of DR variation on the Doppler parameters in carotid arteries has not been explored till date. We therefore analyzed the PSV, EDV and resistive index (RI) of the normal common carotid arteries (CCA) to find out if they vary with variable DR.
AIM: to study the variations of PSV, EDV and RI in the normal CCA with variations in DR expressed in DB.
Materials and methods
A series of 24 consecutive bilateral normal common carotid arteries having normal arterial Doppler waveforms from 12 cases were analysed in the department of Radiology and Imaging, North Eastern Indira Gandhi Regional Institute of Health and Medical Sciences, Shillong, Meghalaya, India. Informed consent was obtained from all subjects, according to the World Medical Association Declaration of Helsinki, revised in 2000, Edinburgh. Doppler were acquired using Xario 200 Toshiba Diagnostic ultrasound, Japan Made, 7–11 MHz linear transducer in supine position with extended neck. A longitudinal view of the common carotid artery was acquired over which Doppler evaluation of the middle third of common carotid artery were set with the sample volume in the centre of the vessel. The angle of insonation was kept at a constant 60° and the gate was kept at 1.5 mm for all patients. Using linear transducer and frequency setting of 9 MHz, Doppler tracings were acquired at variable DR of 35, 45, 55, 65, 75, 85 dB respectively. Subsequently keeping the DR at 55 dB additional frequencies of 7 MHz and 11 MHz were also acquired. PSV, EDV and RI were calculated using autotracing on the acquired Doppler waveforms (Fig. 1A–H).
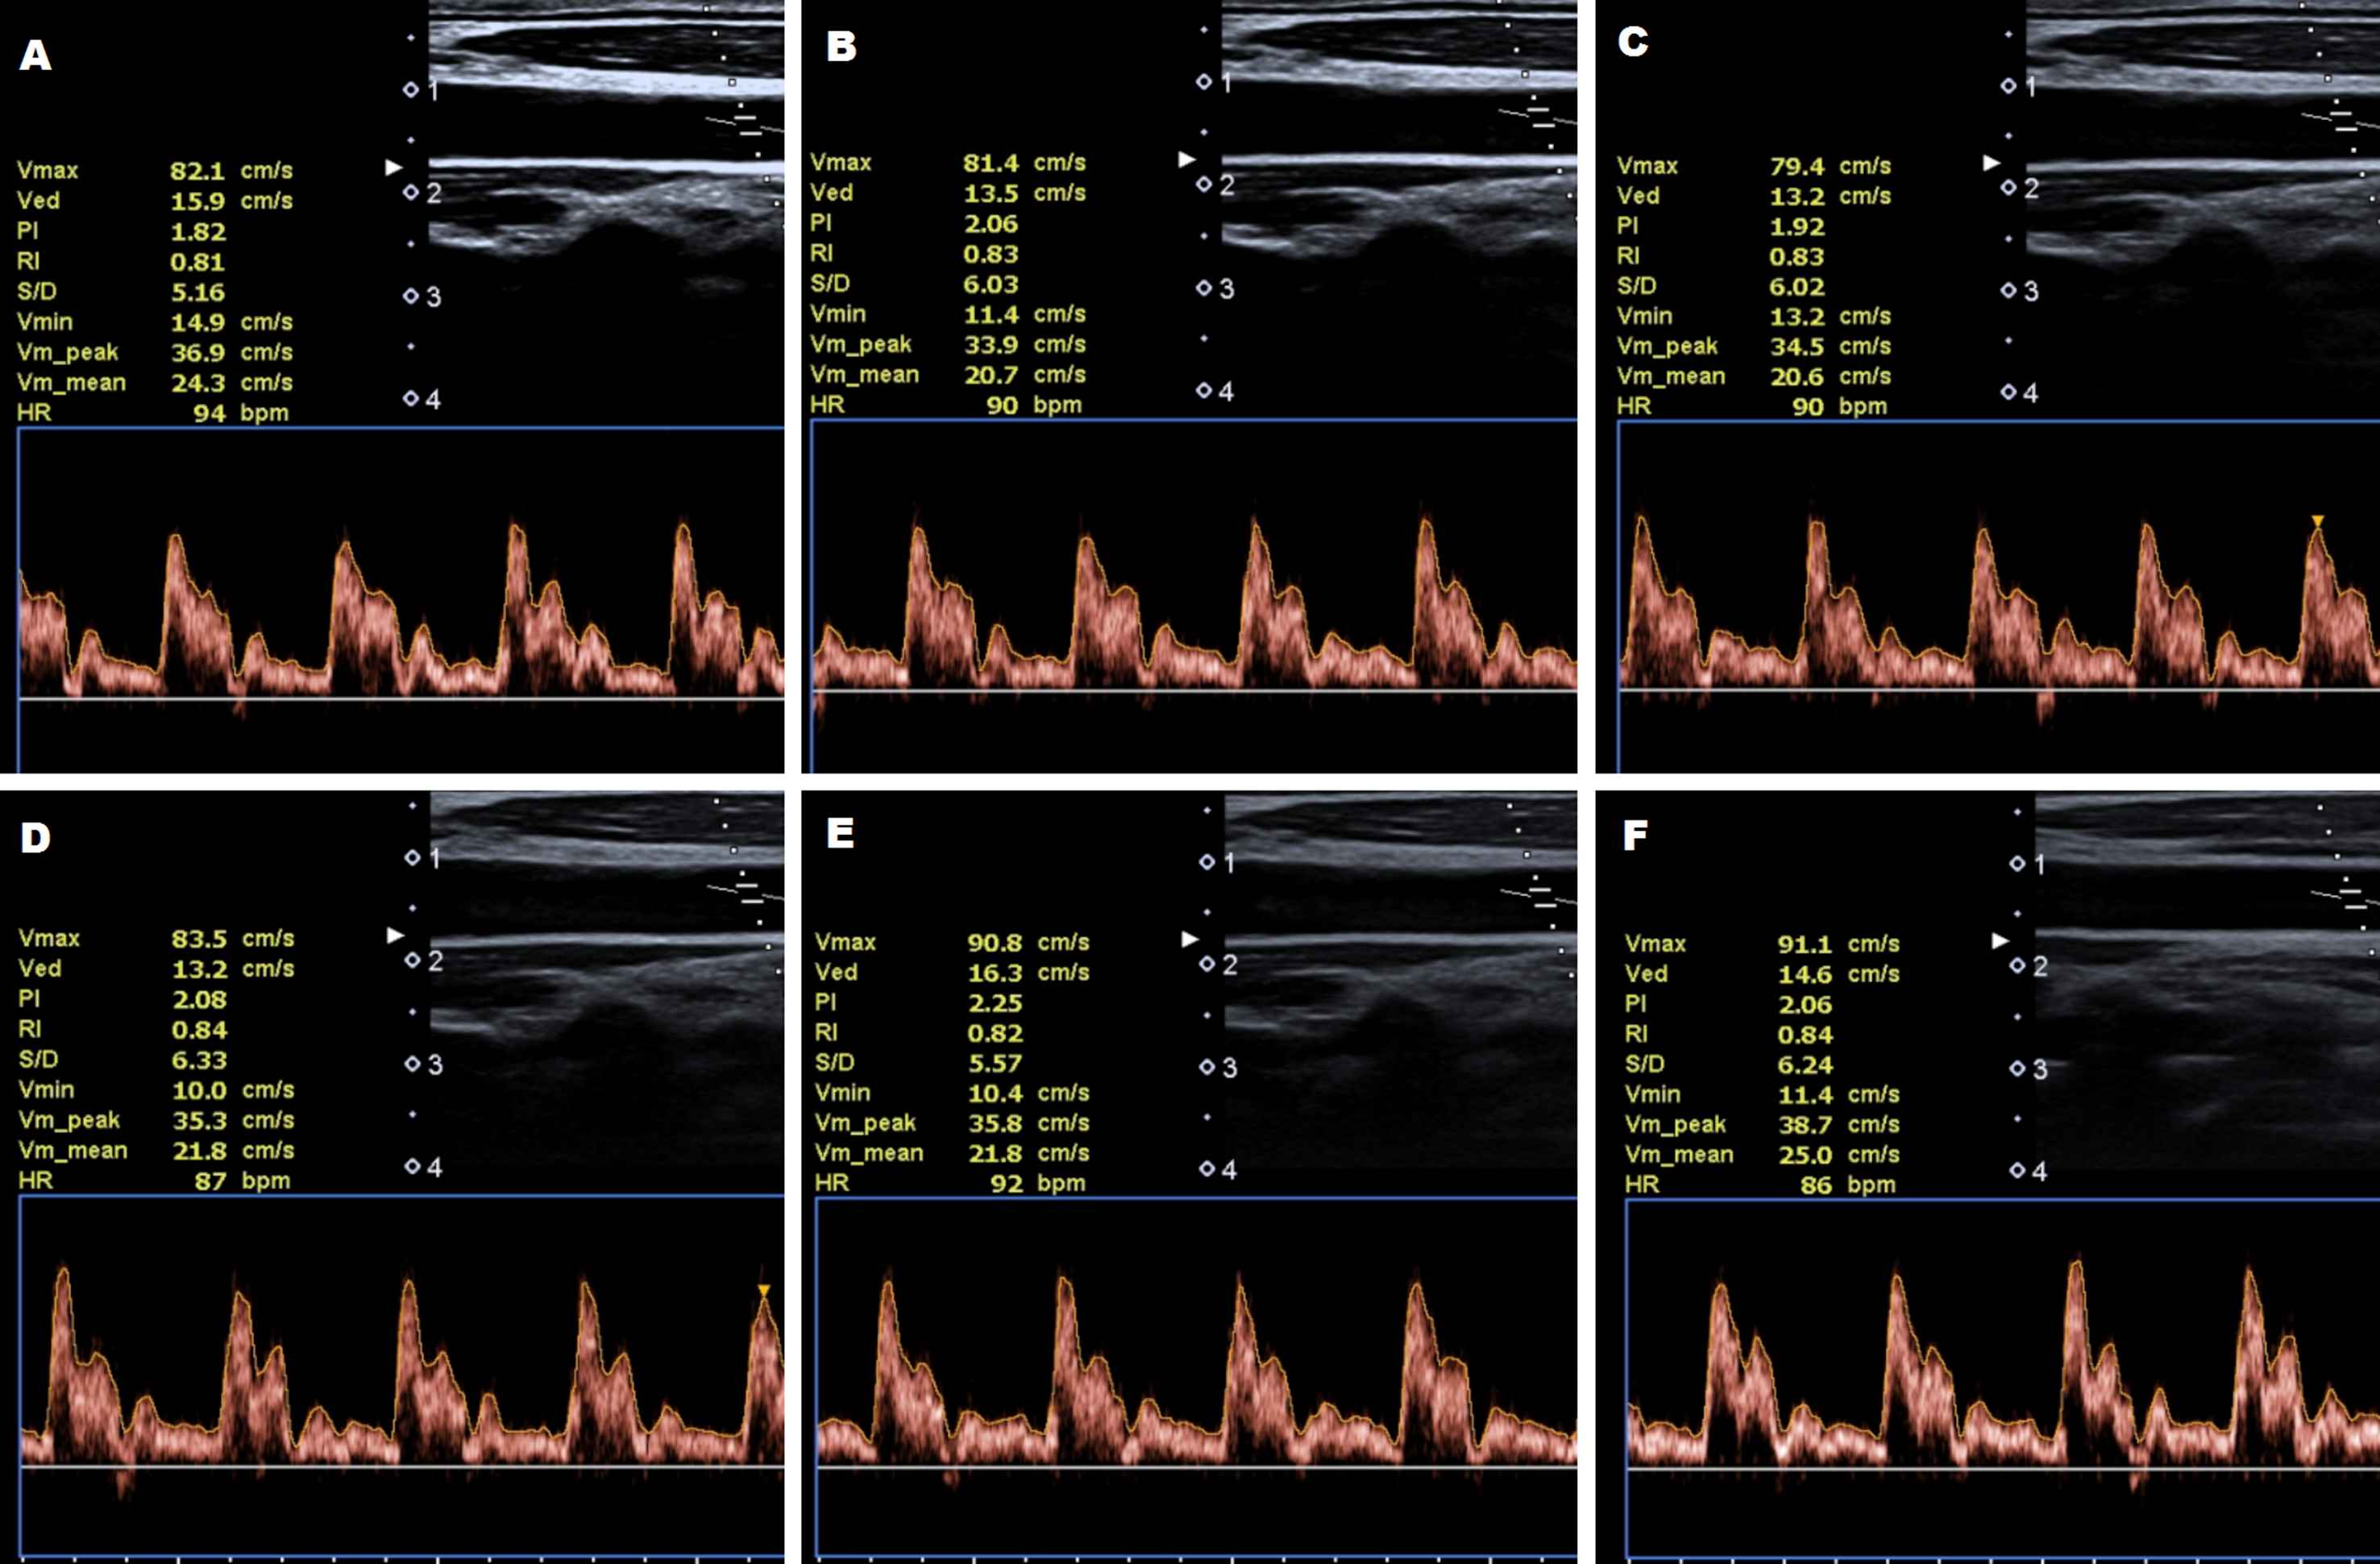
Ultrasound of common carotid arteries showing Doppler waveforms with autotracing at 9 MHz transducer frequency and variable dynamic ranges. A. 35 dB. B. 45 dB. C. 55 dB. D. 65 dB. E. 75 dB. F. 85 dB.
Statistical analysis
One-Way repeated measures ANOVA were evaluated to analyse the results followed by Tukey’s Post-hoc multiple comparisons for PSV, EDV and RI between the variable DR and also between the different frequencies. Subsequently, a paired Student’s t–test determined whether the data differed between male and female. All parametric results are expressed as Mean ± SEM. A p value of less than 0.05 was considered significant for all parameters.
Results
A series of normal Doppler waveforms of 24 carotid arteries from 12 individuals (6 males and 6 females) were analyzed. Age ranges from 22 to 28 years (mean age 25.75 years). Highest PSV recorded in the CCA in our series is 113.3 cm/sec.
Table 1 and Figs. 2–4, summarizes the mean values with standard error mean (SEM) for PSV, EDV and RI at 9 MHz transducer frequency and on variable DR (35, 45, 55, 65, 75 and 85 dB). On comparing between the sides (combine male and female), mean PSV in the right side was higher than the left (p < 0.05, Fig. 2), whereas, the mean EDV was higher in the left compared to the right at variable DR and mean RI was higher in the right compared to the left. For PSV of the right CCA at 9 MHz, results reveals that there was significant differences at different DR as determined by One-Way repeated measures ANOVA [F (5, 55) = 5.54, p < 0.05]. From the results, Post-hoc analysis shows that there was a significant difference between 35 dB to the other DR except with 45 dB (with 55, 65 and 75 dB at p < 0.05 and with 85 dB at p < 0.001) and 45 dB only to 85 dB at p < 0.001. However, there is no significant difference in the PSV of the left CCA; EDV and RI of both right and left CCA on variable dynamic ranges [PSV left (p = 0.515); EDV right (p = 0.401); EDV left (p = 0.672); RI right (p = 0.993) and RI left (p = 0.995) respectively].
| 9 MHz | PSV | PSV | EDV | EDV | RI | RI | PSV | EDV | RI |
|---|---|---|---|---|---|---|---|---|---|
| Right | Left | Right | Left | Right | Left | ||||
| 35dB | 90.858 ± 3.34a* | 80.883 ± 2.98 | 20.8 ± 1.364 | 21.717 ± 1.053 | 0.763 ± 0.015 | 0.73 ± 0.013 | 85.871 ± 2.423a* | 21.258 ± 0.848 | 0.746 ± 0.011 |
| 45dB | 87.075 ± 3.1a,b | 78.625 ± 3.114 | 20.625 ± 1.329 | 21.417 ± 1.706 | 0.763 ± 0.015 | 0.727 ± 0.02 | 82.85 ± 2.322a,b | 21.021 ± 1.061 | 0.747 ± 0.013 |
| 55dB | 84.892 ± 3.618b*,c | 78.033 ± 3.208 | 19.842 ± 1.443 | 20.892 ± 1.381 | 0.763 ± 0.016 | 0.729 ± 0.018 | 81.463 ± 2.47b* | 20.367 ± 0.483 | 0.746 ± 0.012 |
| 65dB | 84.55 ± 3.224b*,c | 80.167 ± 2.733 | 19.858 ± 1.627 | 20.775 ± 1.242 | 0.762 ± 0.021 | 0.738 ± 0.015 | 82.358 ± 2.117a,b | 20.317 ± 1.005 | 0.75 ± 0.013 |
| 75dB | 84.208 ± 2.641b*,c | 80.875 ± 3.077 | 19.9 ± 1.407 | 21.75 ± 1.313 | 0.76 ± 0.018 | 0.728 ± 0.017 | 82.542 ± 2.013a,b | 20.825 ± 0.961 | 0.744 ± 0.013 |
| 85dB | 81.408 ± 2.949c*** | 80.767 ± 2.479 | 19.408 ± 1.472 | 21.025 ± 0.98 | 0.758 ± 0.019 | 0.736 ± 0.015 | 81.088 ± 1.885b* | 20.217 ± 0.881 | 0.747 ± 0.012 |
The mean values in the same column with different superscripts are significantly different while means with the same superscripts indicate non-significant changes;
(‘*’ significant at p < 0.05; ‘***’ significant at p < 0.001).
PSV: peak systolic velocity in centimeter/sec; EDV: end diastolic velocity in centimeter/sec; RI: resistive index.
Blood flow velocities (Mean ± SEM) of the common carotid artery at 9 MHz transducer frequency and variable dynamic ranges in decibels (dB).
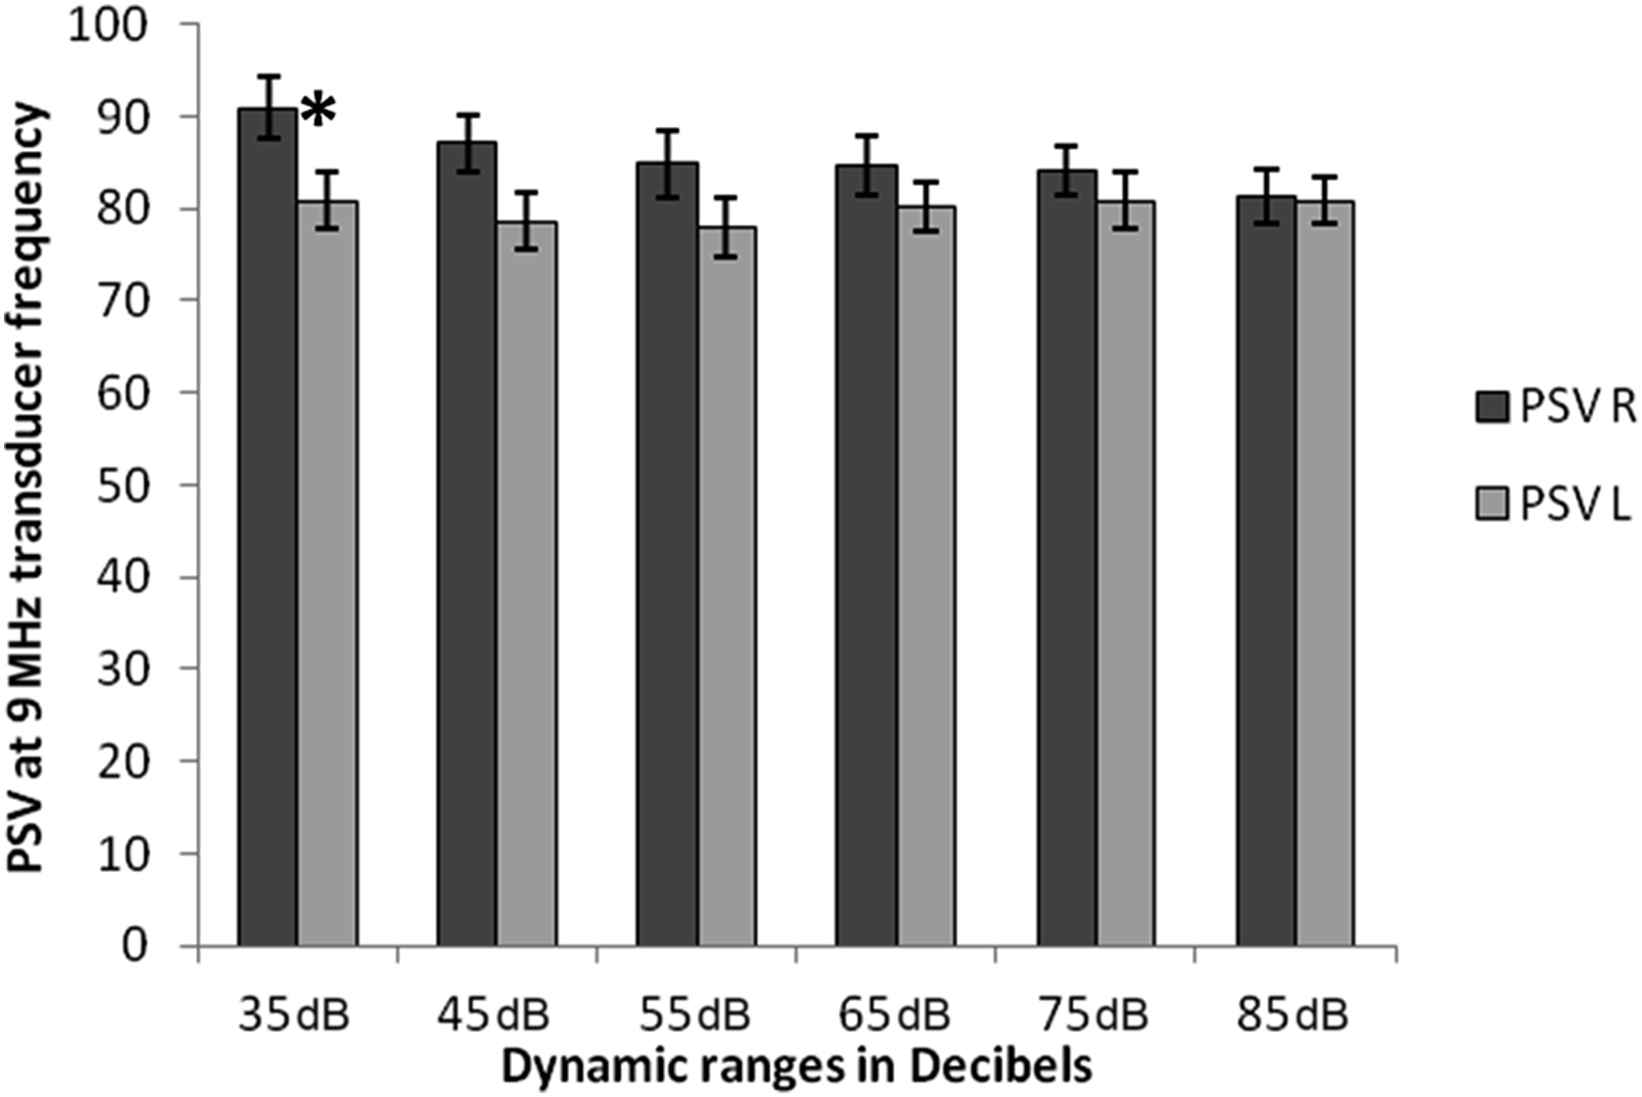
Showing the changes in peak systolic velocity (PSV) of the right (R) and Left (L) common carotid arteries at 9 MHz transducer frequency and with variable dynamic ranges in decibels. (Mean ± SEM). ‘*’ indicate differences between mean values of right and left side of the carotid artery at p < 0.05.
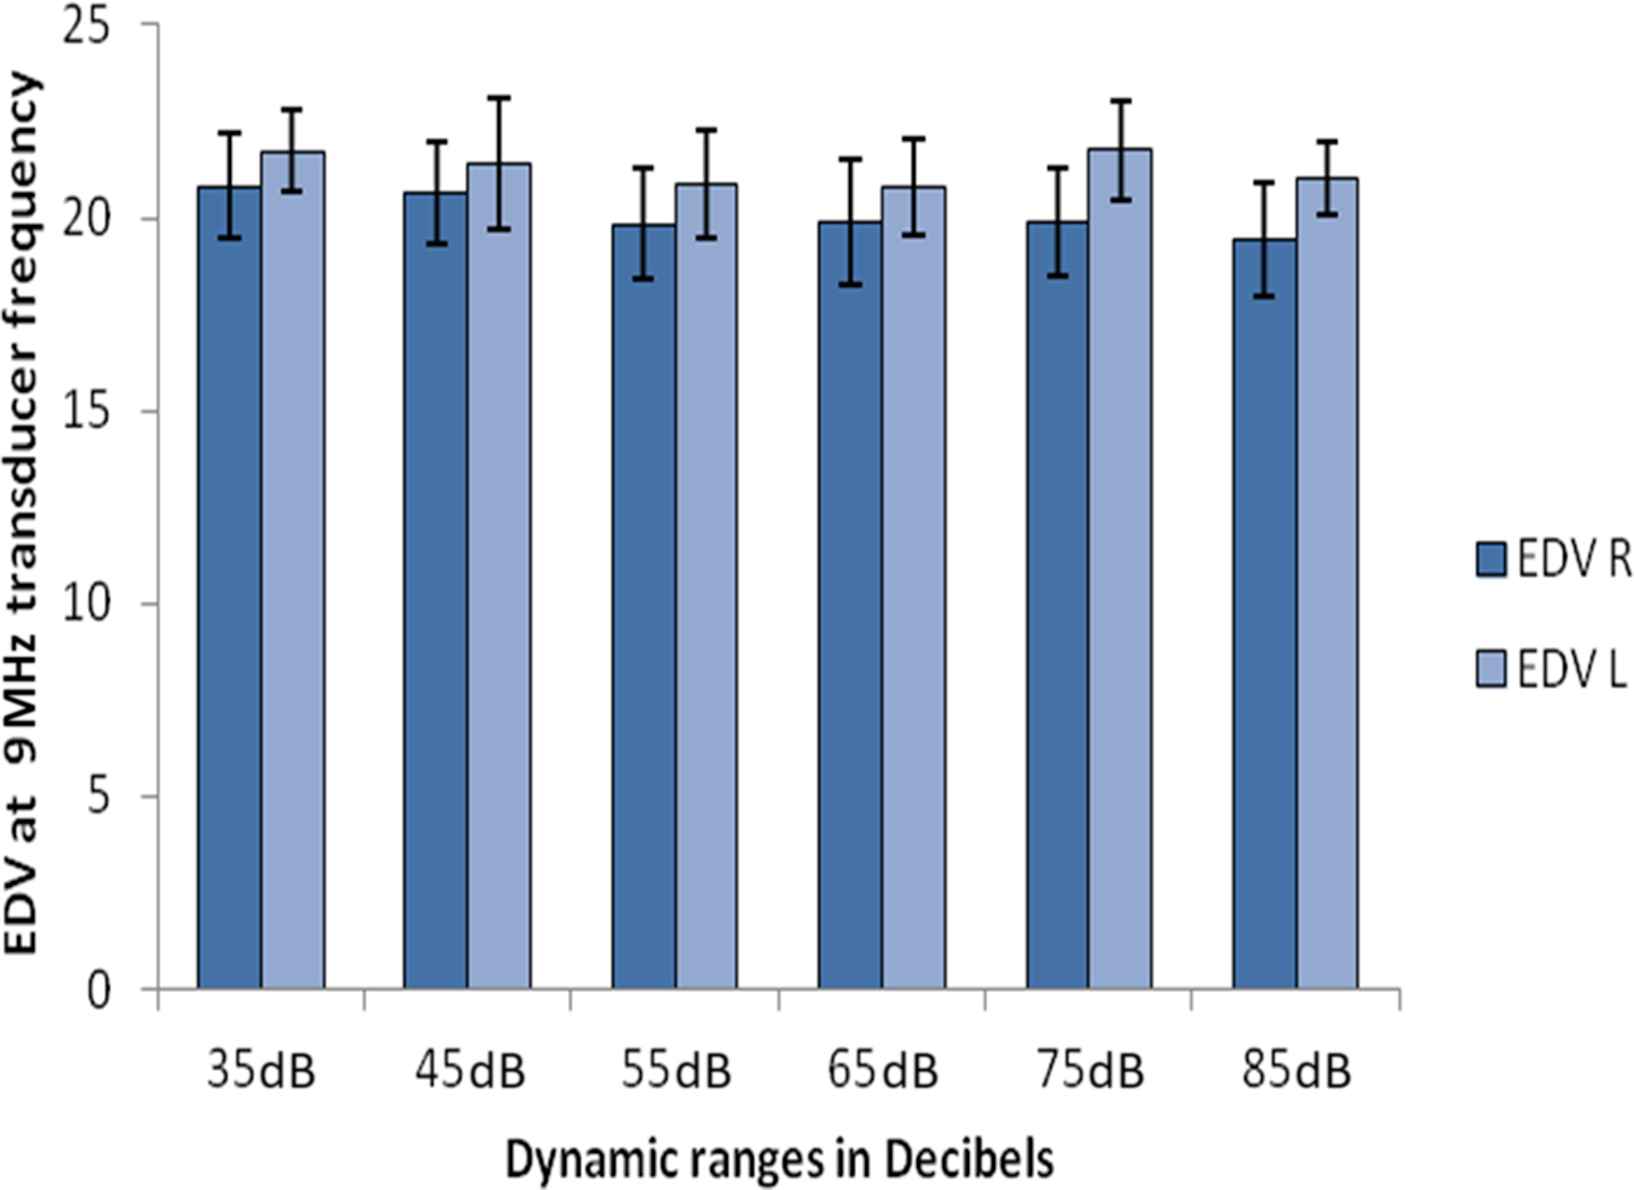
Showing the changes in End-diastolic velocity (ESV) of the right (R) and Left (L) common carotid arteries at 9 MHz transducer frequency and with variable dynamic ranges in decibels.
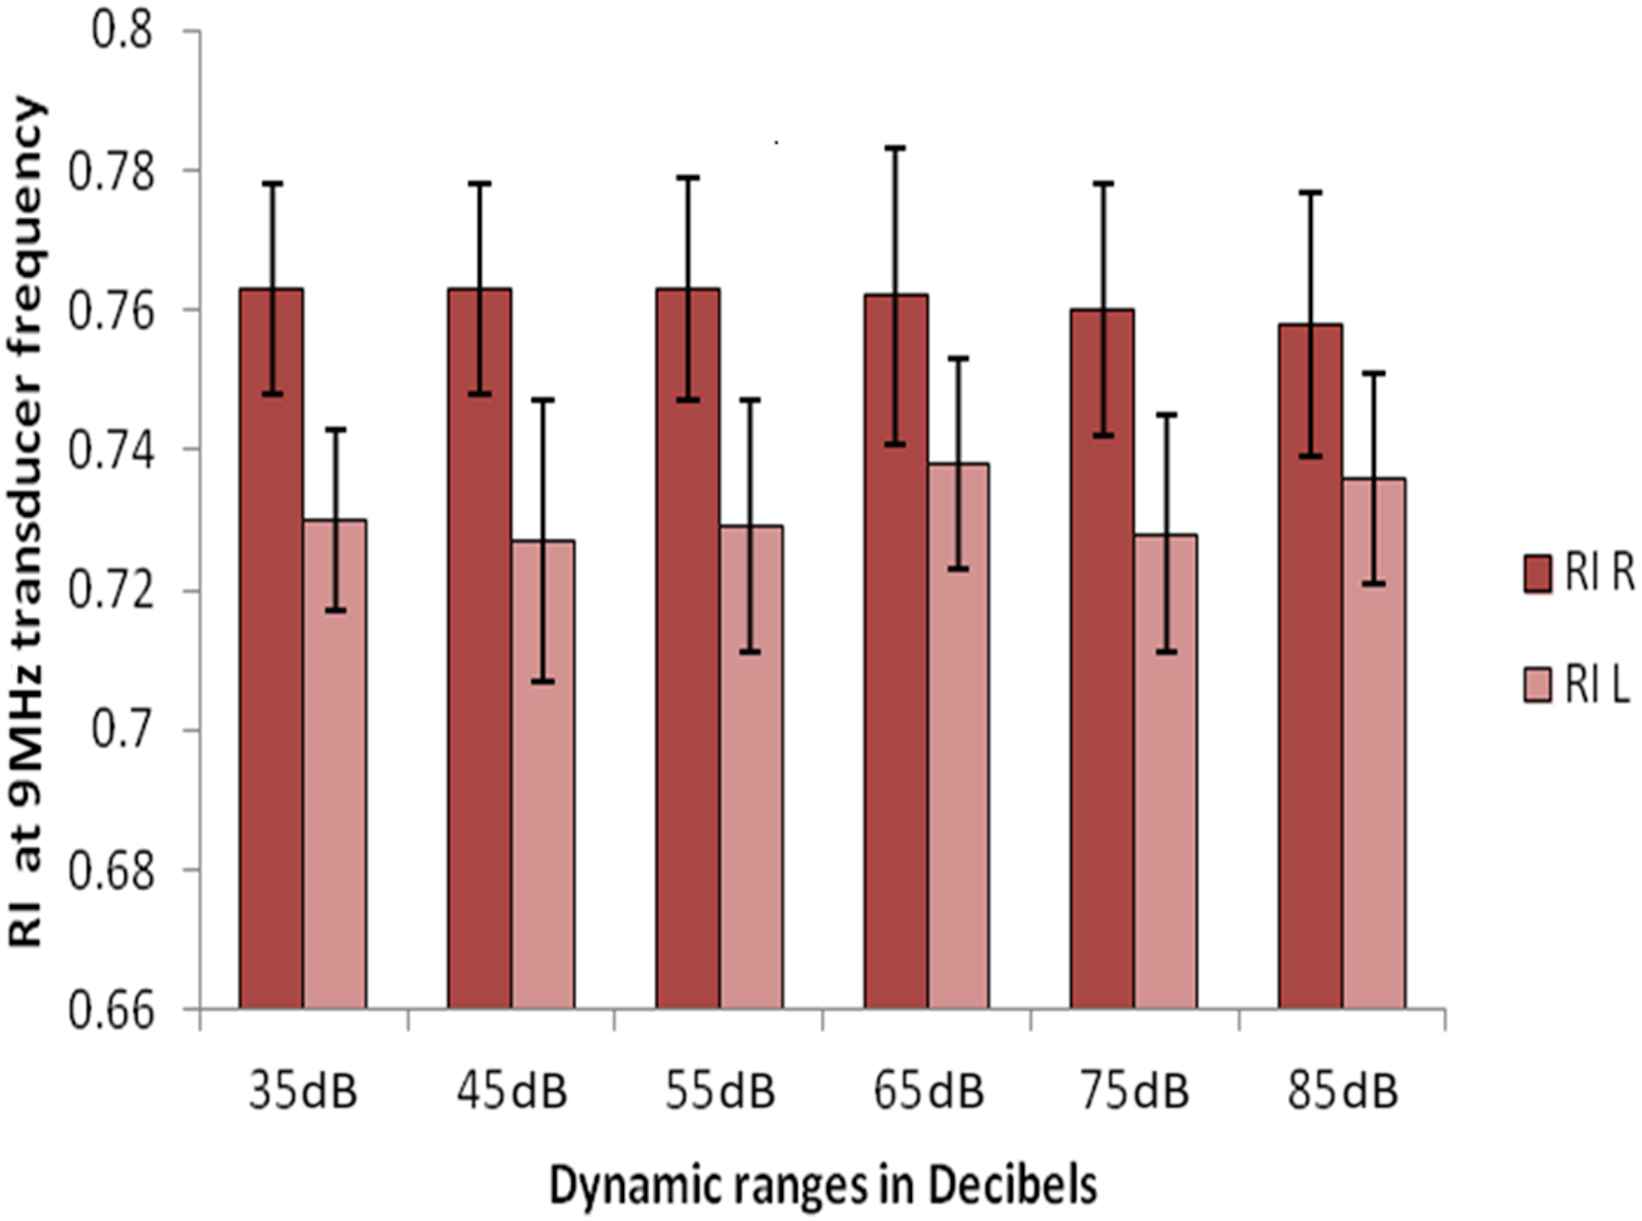
Showing the changes in Resistive Index (RI) of the right (R) and Left (L) common carotid arteries at 9 MHz transducer frequency and with variable dynamic ranges in decibels.
A two tailed Student’s t-test reveals that there is significant difference between the right and the left CCA for PSV at 35 dB (p = 0.037), there is however no significant difference of PSV between right and left CCA at other DR. In the right and left CCA there was no significant difference for EDV and RI on variable DR.
A two tailed Student’s t-test was also used to see the difference of the effect of different DR between male and female at p < 0.05. A significant difference was observed at 35 dB (p = 0.035), 45 dB (p = 0.043) and 55 dB (p = 0.039) between males and females PSV only of the right CCA. However, no significant difference was detected for PSV of left CCA, EDV and RI for variable DR for both right and left CCA between males and females.
The summarized mean values for all PSV, EDV and RI (both right and left) at 9 MHz transducer frequency was shown in Table 1. Graphical representation for the velocities shown in Fig. 5. PSV shows significant difference between variable dynamic ranges as determined by One-Way repeated measures ANOVA [F (5, 115) = 2.85, p < 0.05] and Post-hoc analysis revealed that there was a significant difference only between 35 dB to 55 dB and 85 dB. No significant difference was found for EDV (combine) and RI (combine), ANOVA [F (5, 115) = 1.36, p = 0.242] and ANOVA [F (5, 115) = 0.256, p = 0.936] respectively.
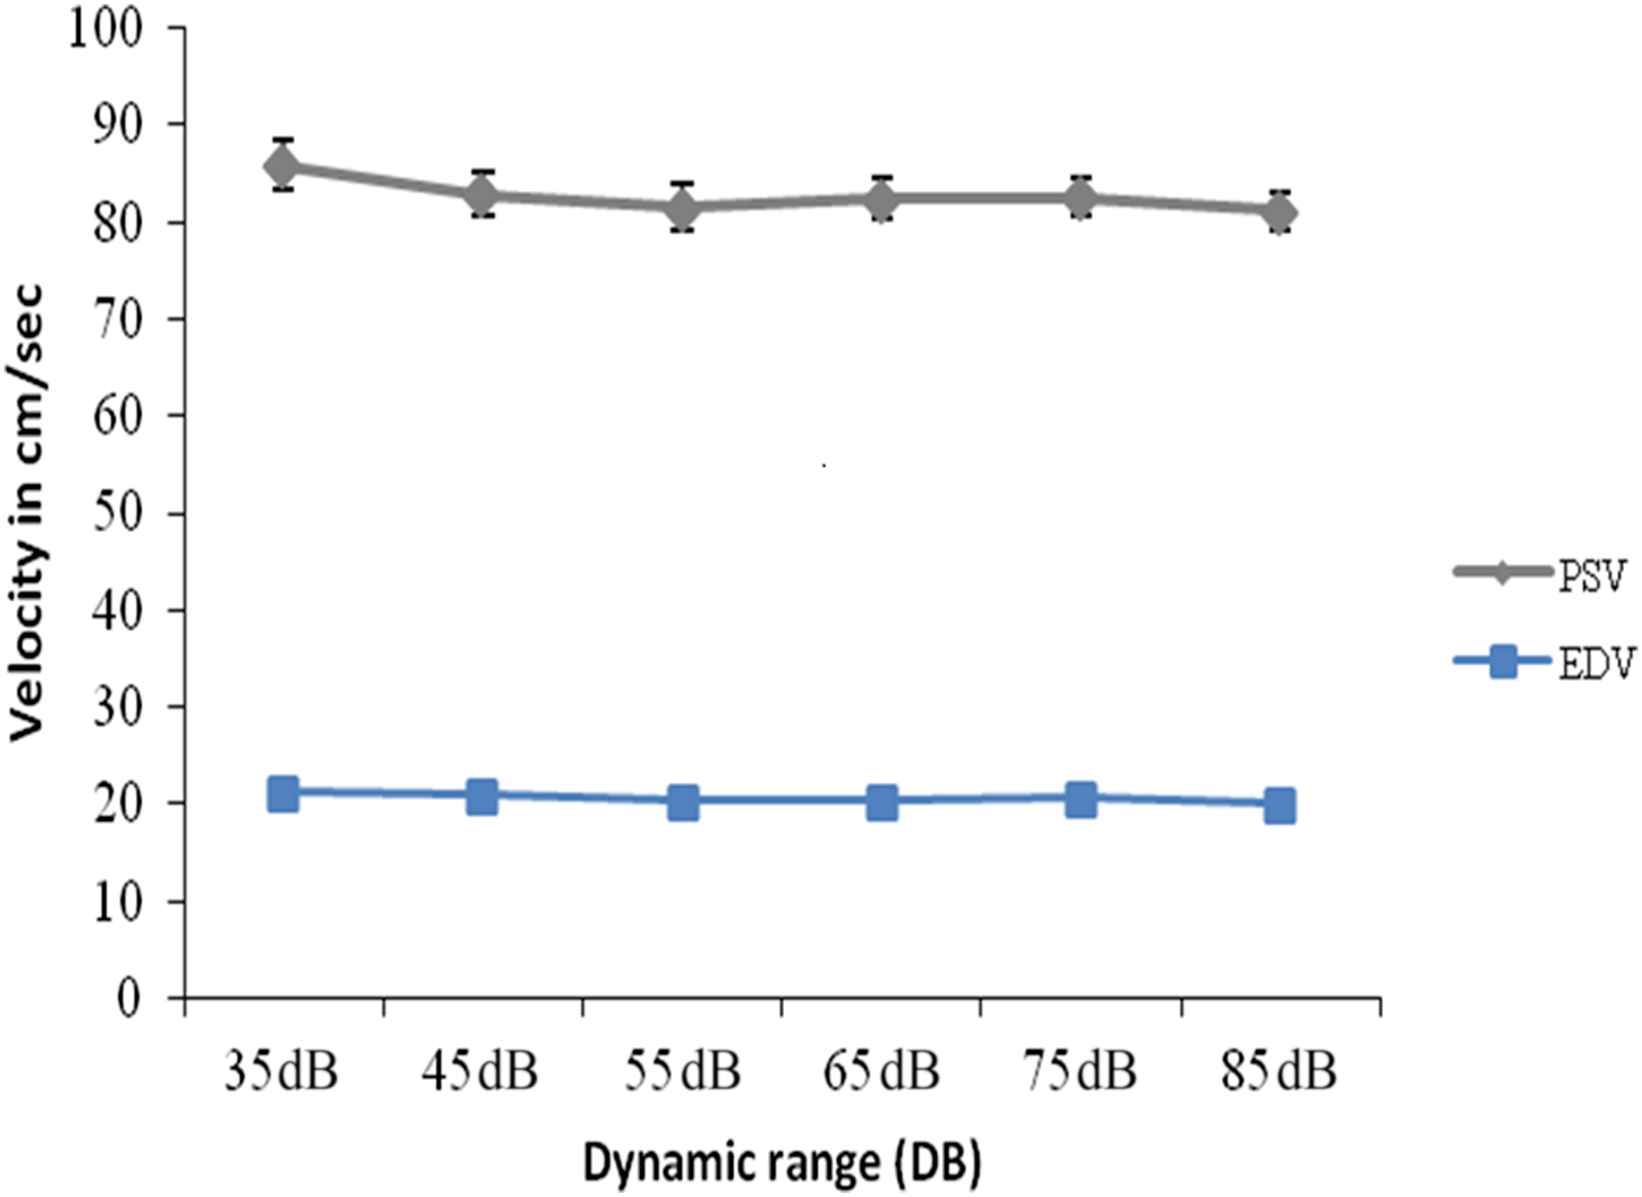
Peak systolic velocity in cm/sec (PSV), End-diastolic velocity in cm/sec (EDV) at 9 MHz and variable dynamic ranges in decibels (dB) of the Common carotid arteries (combine right & left). (Mean ± SEM).
Table 2 shows the PSV, EDV, RI of both sides at 55 dB of dynamic range and on variable transducer frequencies (7, 9 and 11 MHz), the velocities are graphically represented in Fig. 6. There is no significant differences on varying the frequencies as determined by One-Way repeated measures ANOVA (p < 0.05) [PSV right (p = 0.226); PSV left (p = 0.161); EDV right (p = 0.646); EDV left (p = 0.087); RI right (p = 0.851) and RI left (p = 0.49) respectively]; though the mean PSV is higher at 9 MHz compare to 7 and 11 MHz (Fig. 6).
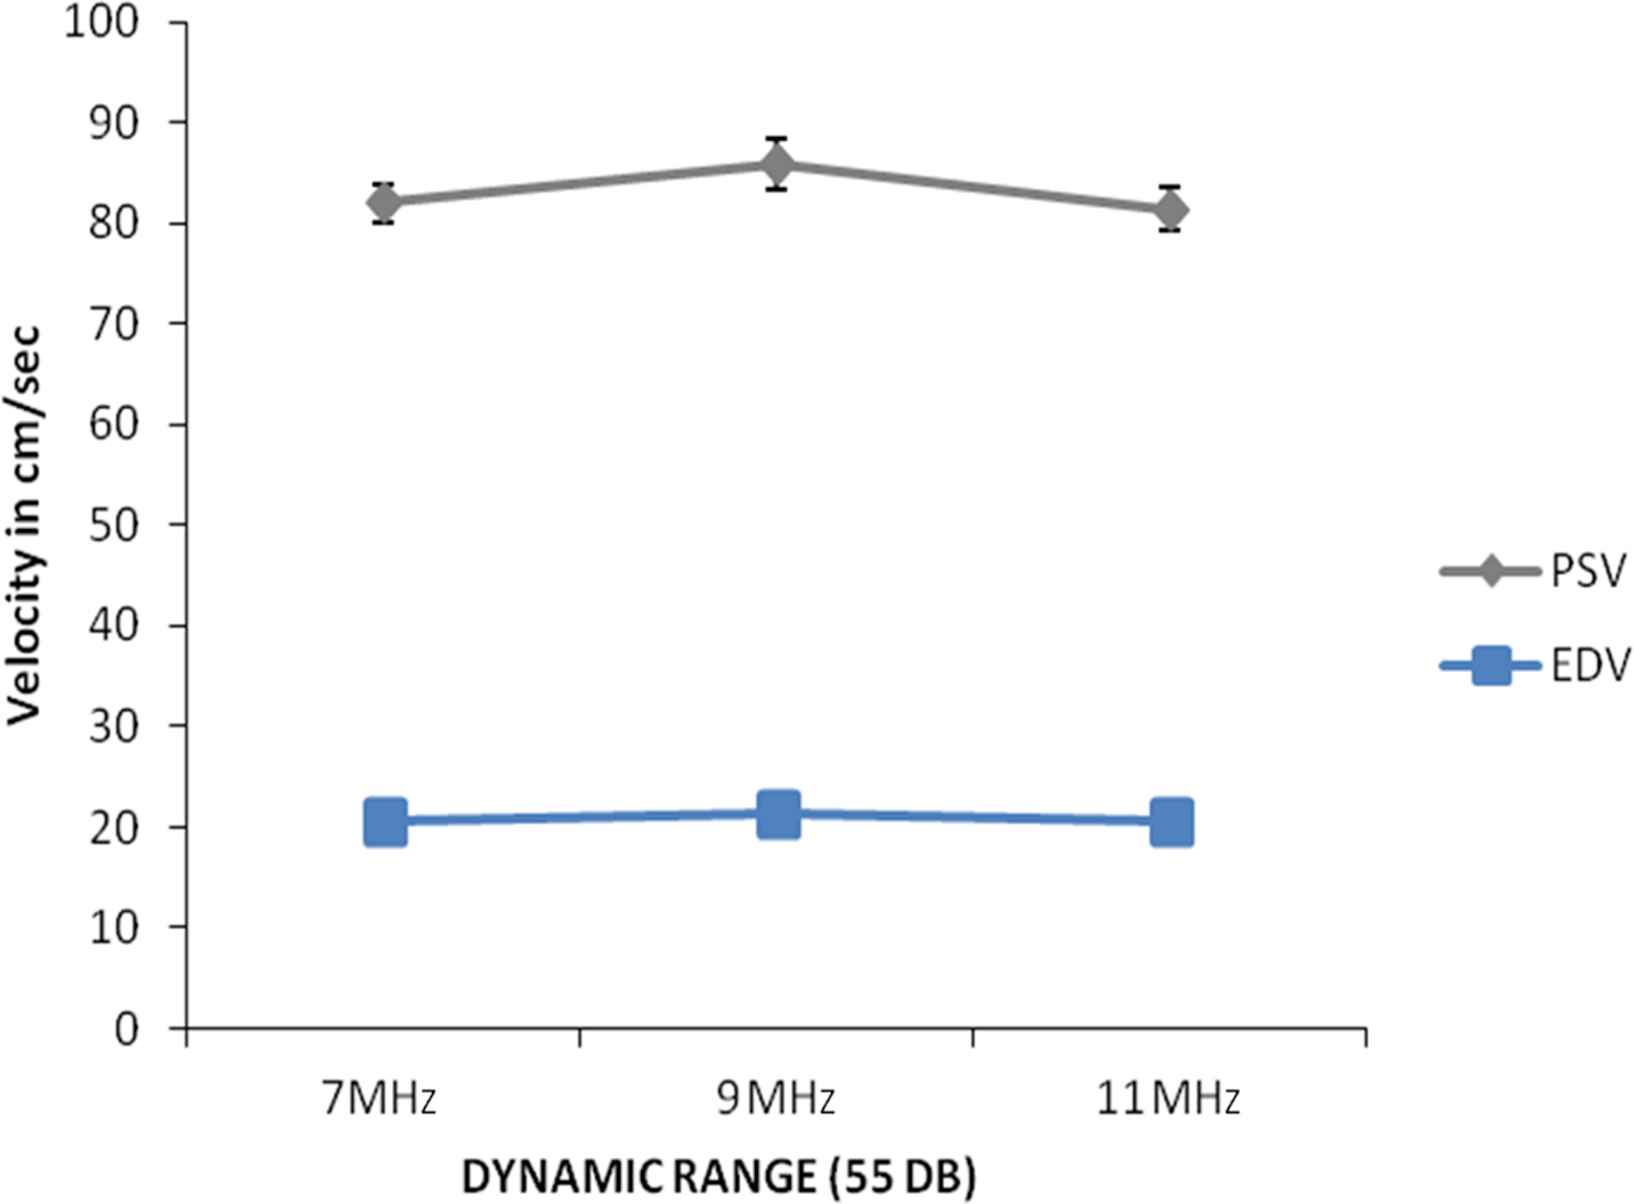
Showing Peak systolic velocity in cm/sec (PSV), End-diastolic velocity in cm/sec (EDV) of the common carotid arteries (combine right and left) at dynamic range of 55 dB and on variation of transducer frequencies (7, 9 and 11 MHz). (Mean ± SEM).
| 55dB | PSV | PSV | EDV | EDV | RI | RI | PSV | EDV | RI |
|---|---|---|---|---|---|---|---|---|---|
| Right | Left | Right | Left | Right | Left | ||||
| 7 MHz | 82.358 ± 2.666 | 81.692 ± 2.875 | 18.858 ± 1.306 | 22.342 ± 1.441 | 0.768 ± 0.015 | 0.722 ± 0.019 | 82.025 ± 1.919 | 20.6 ± 1.018 | 0.745 ± 0.013 |
| 9 MHz | 84.892 ± 3.618 | 78.033 ± 3.208 | 19.842 ± 1.443 | 20.892 ± 1.381 | 0.763 ± 0.016 | 0.722 ± 0.018 | 85.871 ± 2.423 | 21.258 ± 0.848 | 0.746 ± 0.011 |
| 11 MHz | 80.133 ± 2.681 | 82.625 ± 3.357 | 18.925 ± 1.252 | 22.15 ± 1.223 | 0.763 ± 0.013 | 0.728 ± 0.016 | 81.379 ± 2.117 | 20.538 ± 0.919 | 0.746 ± 0.011 |
PSV: peak systolic velocity in centimeter/sec; EDV: end diastolic velocity in centimeter/sec; RI: resistive index.
Blood flow velocities (Mean ± SEM) of the common carotid artery at dynamic range of 55 dB and variable transducer frequency i.e. 7, 9 & 11 Mega Hertz (MHz).
A two tailed Student’s t-test was used to see the difference of both sides at 55 dB of DR and on variable transducer frequencies (7, 9 and 11 MHz) between male and female at p < 0.05. A significant difference was observed at 7 MHz (p = 0.039) between males and females PSV only of the right CCA. However, no significant difference was detected for PSV of left CCA, EDV and RI for variable DR for both right and left CCA between males and females.
Discussion
Our observation shows significant variations in PSV on variation of DR i.e at 9 MHz transducer frequency with variable DR (35, 45, 55, 65, 75 and 85 dB). The significance is more on the right side. There is no significant variations of PSV at 55 dB of DR and on variable transducer frequencies (7, 9 and 11 MHz).
Wu CC and Torng JK, found significant variations between the two sides with significant higher velocities in left common carotid arteries of 9 clinically healthy individuals.4 Our observation on 12 normal common carotids is different by showing higher mean PSV and RI in the right CCA compare to the left and higher EDV in the left compared to the right.
Another study by Albayrak et al. on flow velocity and volume of the extracranial Internal Carotid and Vertebral Arteries in healthy adults by Doppler sonography found out that in the age group of 20–39 years, the blood flow volumes (ml/min) expressed as Mean ± SD in men is 264 ± 37 and 260 ± 43 in right internal carotid artery and left internal carotid artery respectively and in women is 266 ± 43 and 247 ± 33 in right internal carotid artery and left internal carotid artery respectively.5 They have therefore noted higher volume in the right ICA. In our observation we found significant higher PSV in the right compare to the left in comparable age groups.
Recordings of PSV and EDV from the CCA and ICA and calculation of indices is recommended for carotid ultrasounds6 and the PSV of the ICA is the best single index both for quantifying the percentage stenosis and for detecting a 70% or greater stenosis of the internal carotid arteries.7
Prevalence of carotid artery stenosis increases with age8 and increase in peak systolic velocity (PSV) and end diastolic velocity (EDV) above a certain level can predict degree of stenosis with high percentage of sensitivity and specificity on colour duplex ultrasound In the internal carotid artery, the threshold of peak systolic velocity >130 cm/s is associated with sensitivity of 98% and specificity of 88% in the identification of angiographic stenosis of >50%. And for the angiographic stenosis of >70%, a peak systolic velocity >200 cm/s has a sensitivity of 90% and a specificity of 94%.3
It is also known that PSV, EDV and carotid index (peak internal carotid artery/common carotid artery velocity) correlate with residual lumen in significant stenosis of carotid arteries with high sensitivity and specificity.9
In a study on Carotid and Vertebral Artery blood flow in left- and right handed healthy subjects measured with MR velocity mapping, it was found that flow rates in the right common carotid artery (RCCA) is 473 ml/min and left common carotid artery (LCCA) is 447 ml/min in right handed persons and 484 ml/min (in RCCA) and 481 ml/min (in LCCA) in left handed individuals. All right-handed subjects however had higher flow rates in the left internal carotid artery than in the right, and all left-handed subjects had higher flow rates in the right internal carotid artery (p = 0.007).10
In our study all cases were right handed individuals, this along with possible varying flow dynamics in CCA according to side and ICA according to right or left handedness could have accentuated the variations in PSV with varying DR in the CCA more so on the right side. Further study in left handed individuals is advocated from this study to see the effect of varying DR on PSV in left handed individuals.
PSV estimation using spectral modules and vector Doppler has shown that in fully insonated flow with parabolic velocity distribution the PSV corresponds to the Doppler frequency at the half power point on the slope of the Doppler power spectrum.11
PSV being the most important Doppler parameter for predicting degree of stenosis in a diseased carotid artery, accurate PSV recordings is therefore important for patient management and treatment. The effects of variations of dynamic range on the PSV of the CCA is evident from this study particularly the right CCA. Further study on a larger scale is advocated by the authors to further collaborate these findings.
Conclusion
Our observation has shown that at lower dynamic range in decibels there is signficant increase in the peak systolic velocity reading on doppler. Therefore reducing the dynamic range while optimizing sonographic images by increasing contrast may on the other hand affect the peak systolic velocity reading in the carotid arteries which is an important Doppler parameter in the prediction of degree of stenosis in a carotid artery.
Conflict of interest
The authors declare that they have no conflict of interest.
Financial assistance
Nil.
References
Cite this article
TY  - JOUR
AU  - Donboklang Lynser
AU  - Chhunthang Daniala
AU  - Aman Yusuf Khan
AU  - Evarisalin Marbaniang
AU  - Ibamelaker Thangkhiew
PY  - 2018
DA  - 2018/03/20
TI  - Effects of dynamic range variations on the Doppler flow velocities of common carotid arteries
JO  - Artery Research
SP  - 18
EP  - 23
VL  - 22
IS  - C
SN  - 1876-4401
UR  - https://doi.org/10.1016/j.artres.2018.02.001
DO  - 10.1016/j.artres.2018.02.001
ID  - Lynser2018
ER  -