
Numerical modeling of a prototype cardiac assist device by implementing fluid-structure interaction
- DOI
- 10.1016/j.artres.2018.01.002How to use a DOI?
- Keywords
- Heart failure; Cardiac assist device; Fluid–structure interaction analysis; Von Mises stress
- Abstract
The purpose of this study is to simulate the blood flow in a 2D axisymmetric model for the aorta assisted with a type of cardiac assist device in which the balloon part is surrounding the ascending aorta and can pump the blood flow by its inflation/deflation. The blood flow and von Mises stress in the assisted aorta are investigated by fluid–structure interaction analysis (FSI). Taking into consideration three materials and seven thicknesses for the balloon in one layered and three-layered aorta models, the influences of each of these states on the mentioned parameters have been studied. The numerical simulation demonstrates that by using this cardiac assist device, the maximum blood flow velocity increases up to 92% at the time of maximum pressure on the balloon and this configuration augments the maximum von Mises stress. The magnitude of the maximum von Mises stress and the maximum blood velocity reduce by thickening the balloon from 0.8 mm to 2 mm up to 8.9% and 9.95%, respectively. The maximum pressure at the outlet of the aorta increases from 9.77 kPa to 10.4 kPa at the time of applying maximum pressure on the balloon. With the one-layered aorta model, the maximum von Mises stress occurs at the innermost layer of the aorta’s wall on each line across the wall and the balloon. Using the three-layered aorta model, the location of the maximum stress is shifted to the juncture of intima and media layers.
- Copyright
- © 2018 Association for Research into Arterial Structure and Physiology. Published by Elsevier B.V. All rights reserved.
- Open Access
- This is an open access article distributed under the CC BY-NC license.
Introduction
According to the American Heart Association, the pervasiveness of heart failure cases increases by 46% from 2012 to 2017.1 Heart failure (HF) is the state in which the heart is unable to pump a sufficient amount of blood during its systole. Heart valve diseases, high blood pressure and coronary artery diseases are among several causes which may lead to HF. There are several options to treat HF: implementation of angiotensin-converting-enzyme inhibiters (ACEIs), β-blockers, coronary revascularization, implantable strategies.2 Mechanical heart assist devices also play an important role in treating patients suffering from HF. Therefore, assist devices are designed to support the blood pumping process. They may help myocardial remodeling and increase the patients’ life and the chance of survival.3 Counterpulsation-based devices have been proven to be beneficial. Because they increase coronary artery perfusion and decrease the patient’s ventricular workload. They are known as devices which can improve overall cardiac function.4 These devices are in “On” mode when the heart is resting and vice versa. Intra-aortic balloon pumps (IABPs) and ventricular assist devices (VADs) are among cardiac devices to treat the patients in short-term and long-term use, respectively.5 One of the most important concerns in using VADs is their blood contacting structure and thromboembolism is the common complication concerning the usage of them.6 IABPs are the most widely used devices in this category but they are limited as stated to the short-term use. Furthermore, IABPs are contact with blood and require the patient to be hospitalized during the usage of the device.7,8 Several novel counterpulsation-based devices have been proposed recently (C-Pulse1, Symphony2). C-Pulse improves the heart operation by a cuff which is implanted around the aorta and increases the blood flow from the heart. Abraham et al. implanted C-Pulse in 20 study patients.9 They proved that the use of this device is safe and feasible. Davies et al.10 compared an IABP and C-pulse effects on coronary blood flow. They showed that C-Pulse with its extra-aortic balloon and non-blood contacting composition increased the coronary blood flow more efficiently than the IABP. The Symphony device increases systemic blood flow through a vascular graft. The most significant feature of this device is that its implantation doesn’t require thoracotomy or sternotomy approaches.
Numerical simulations are crucial in designing these devices to prognosticate their effects on the blood flow and the cardiovascular system. In order to study the arterial blood flow, fluid–structure interaction (FSI) simulations have been proven to be useful. By implementing FSI, wall deformations are taken into account in the studies.11 Reymond et al. compared blood flow circulation with rigid wall model and FSI and presented notable differences in the results.12 Crosseto et al.13 made a 3D simulation of the arterial blood flow and a CFD one with rigid walls. They concluded that there is an overestimation in wall shear stress magnitudes using rigid walls assumptions. The topics studied with FSI, range from FSI analysis in the aortic valve to aortic aneurysm,14 aortic dissection, intraluminal thrombus15 and analysis of the aortic blood flow due to implantation of heart assist devices. Khanafer et al.16 utilized a fully coupled FSI analysis to calculate von Mises stress in the aorta’s wall, the streamlines and the blood flow pressure contours to provide a mechanical understanding of how and where dissections may develop in the three-layered model of the aorta. They showed that peak wall stress and maximum von Mises stress magnitudes are the highest in the aorta’s media layer. Bazilevs et al.17 have conducted a research on interaction analysis of thoracic aortic blood flow due to implantation of the Jarvik 2000 left ventricular assist device.
Wall stress is an important parameter in studying the cardiovascular system.18,19 Beller et al. investigated the influence of aortic root displacement and pressure on the aortic wall stress.20 In many studies, the aortic wall was assumed to be one layer in order to simplify the problem. But the aorta’s real material consists of three layers: intima, media, and adventitia. Using this assumption, Gao et al. conducted a stress distribution experiment in a three-layered aortic arch model with interaction between pulsatile flow and the wall of the blood vessel.21 Since the stress is a tensor with nine components, von Mises stress is calculated in many studies. Using von Mises stress, one scalar magnitude is calculated that makes the comparison between stresses possible.
Arbitrary Lagrangian-Eulerian (ALE) formulation is being increasingly applied to FSI problems.22 This method gives us the possibility to control the mesh movement separately from the material movement. Whenever the fluid domain of the problem is subjected to the large deformations, the ALE method is implemented to create a new undistorted mesh. For instance, the ALE has been used by Mohammadi et al. for studying the hemodynamic of the aortic valve to simulate the large valve’s displacement.23 Bavo et al.24 compared the immersed boundary method and the ALE method to simulate a prosthetic aortic valves. They stated that the ALE approach can lead to more accurate results. Urquiza et al.25 used this method to model carotid artery blood flow. Using ALE formulation, domain deformation produced by moving artery wall has taken into account.
The main objective of this study is to investigate the blood flow velocity and von Mises stress in the aorta due to implantation of a novel extra-aortic counterpulsation-based assist device by FSI analysis and the ALE method. Both one-layered and three-layered aorta models are investigated in studying the mentioned parameters.
Methods
Introducing a novel counterpulsation-based device
A novel counterpulsation-based device with an extra-aortic balloon is presented in the literature.26 An inflatable balloon is implanted around the aorta to make pulsatile blood flow as shown in Fig. 1. This non-blood contacting device is designed to work in synchrony with the cardiac cycle. The balloon inflates during ventricular diastole and its inner layer moves toward the aorta and pumps the blood into the circulatory system while the balloon’s outer layer is fixed. The balloon is inflated by an external pump which consequently a fluid is sent between the two layers of it. Evacuating this fluid causes the balloon to deflate. It is worth mentioning that the device in26 is composed of two semi-cylindrical balloons which their ends are completely in contact with each other. This study assumes that this acts as a one-balloon device. So, the study is based on a two-dimensional axisymmetric model.

Front and top views of cardiac assist device.26
Geometry
Three-layered and one-layered sections of the aorta in addition to the 1 mm balloon are modeled using COMSOL Multiphysics version 5.2 as shown in Fig. 2. These models are 2D, axisymmetric and the arterial wall layers are assumed to be linear and isotropic.27,28 This section of the aorta is 10 cm long with a 13 mm radius and taking into consideration the 1 mm wall thickness. Here the thickness of 16.5/67/16.5 percentages is assumed for layers in the three-layered model. The balloon is composed of two layers with a compressive fluid between them. The fixed outer layer is not simulated in the model. The thickness of balloon’s inner layer is a supposed variable from 0.8 mm to 2 mm by 2 mm as the incremental increasing in each in order to study the balloon’s thickness influence on the von Mises stress and the blood flow velocity.
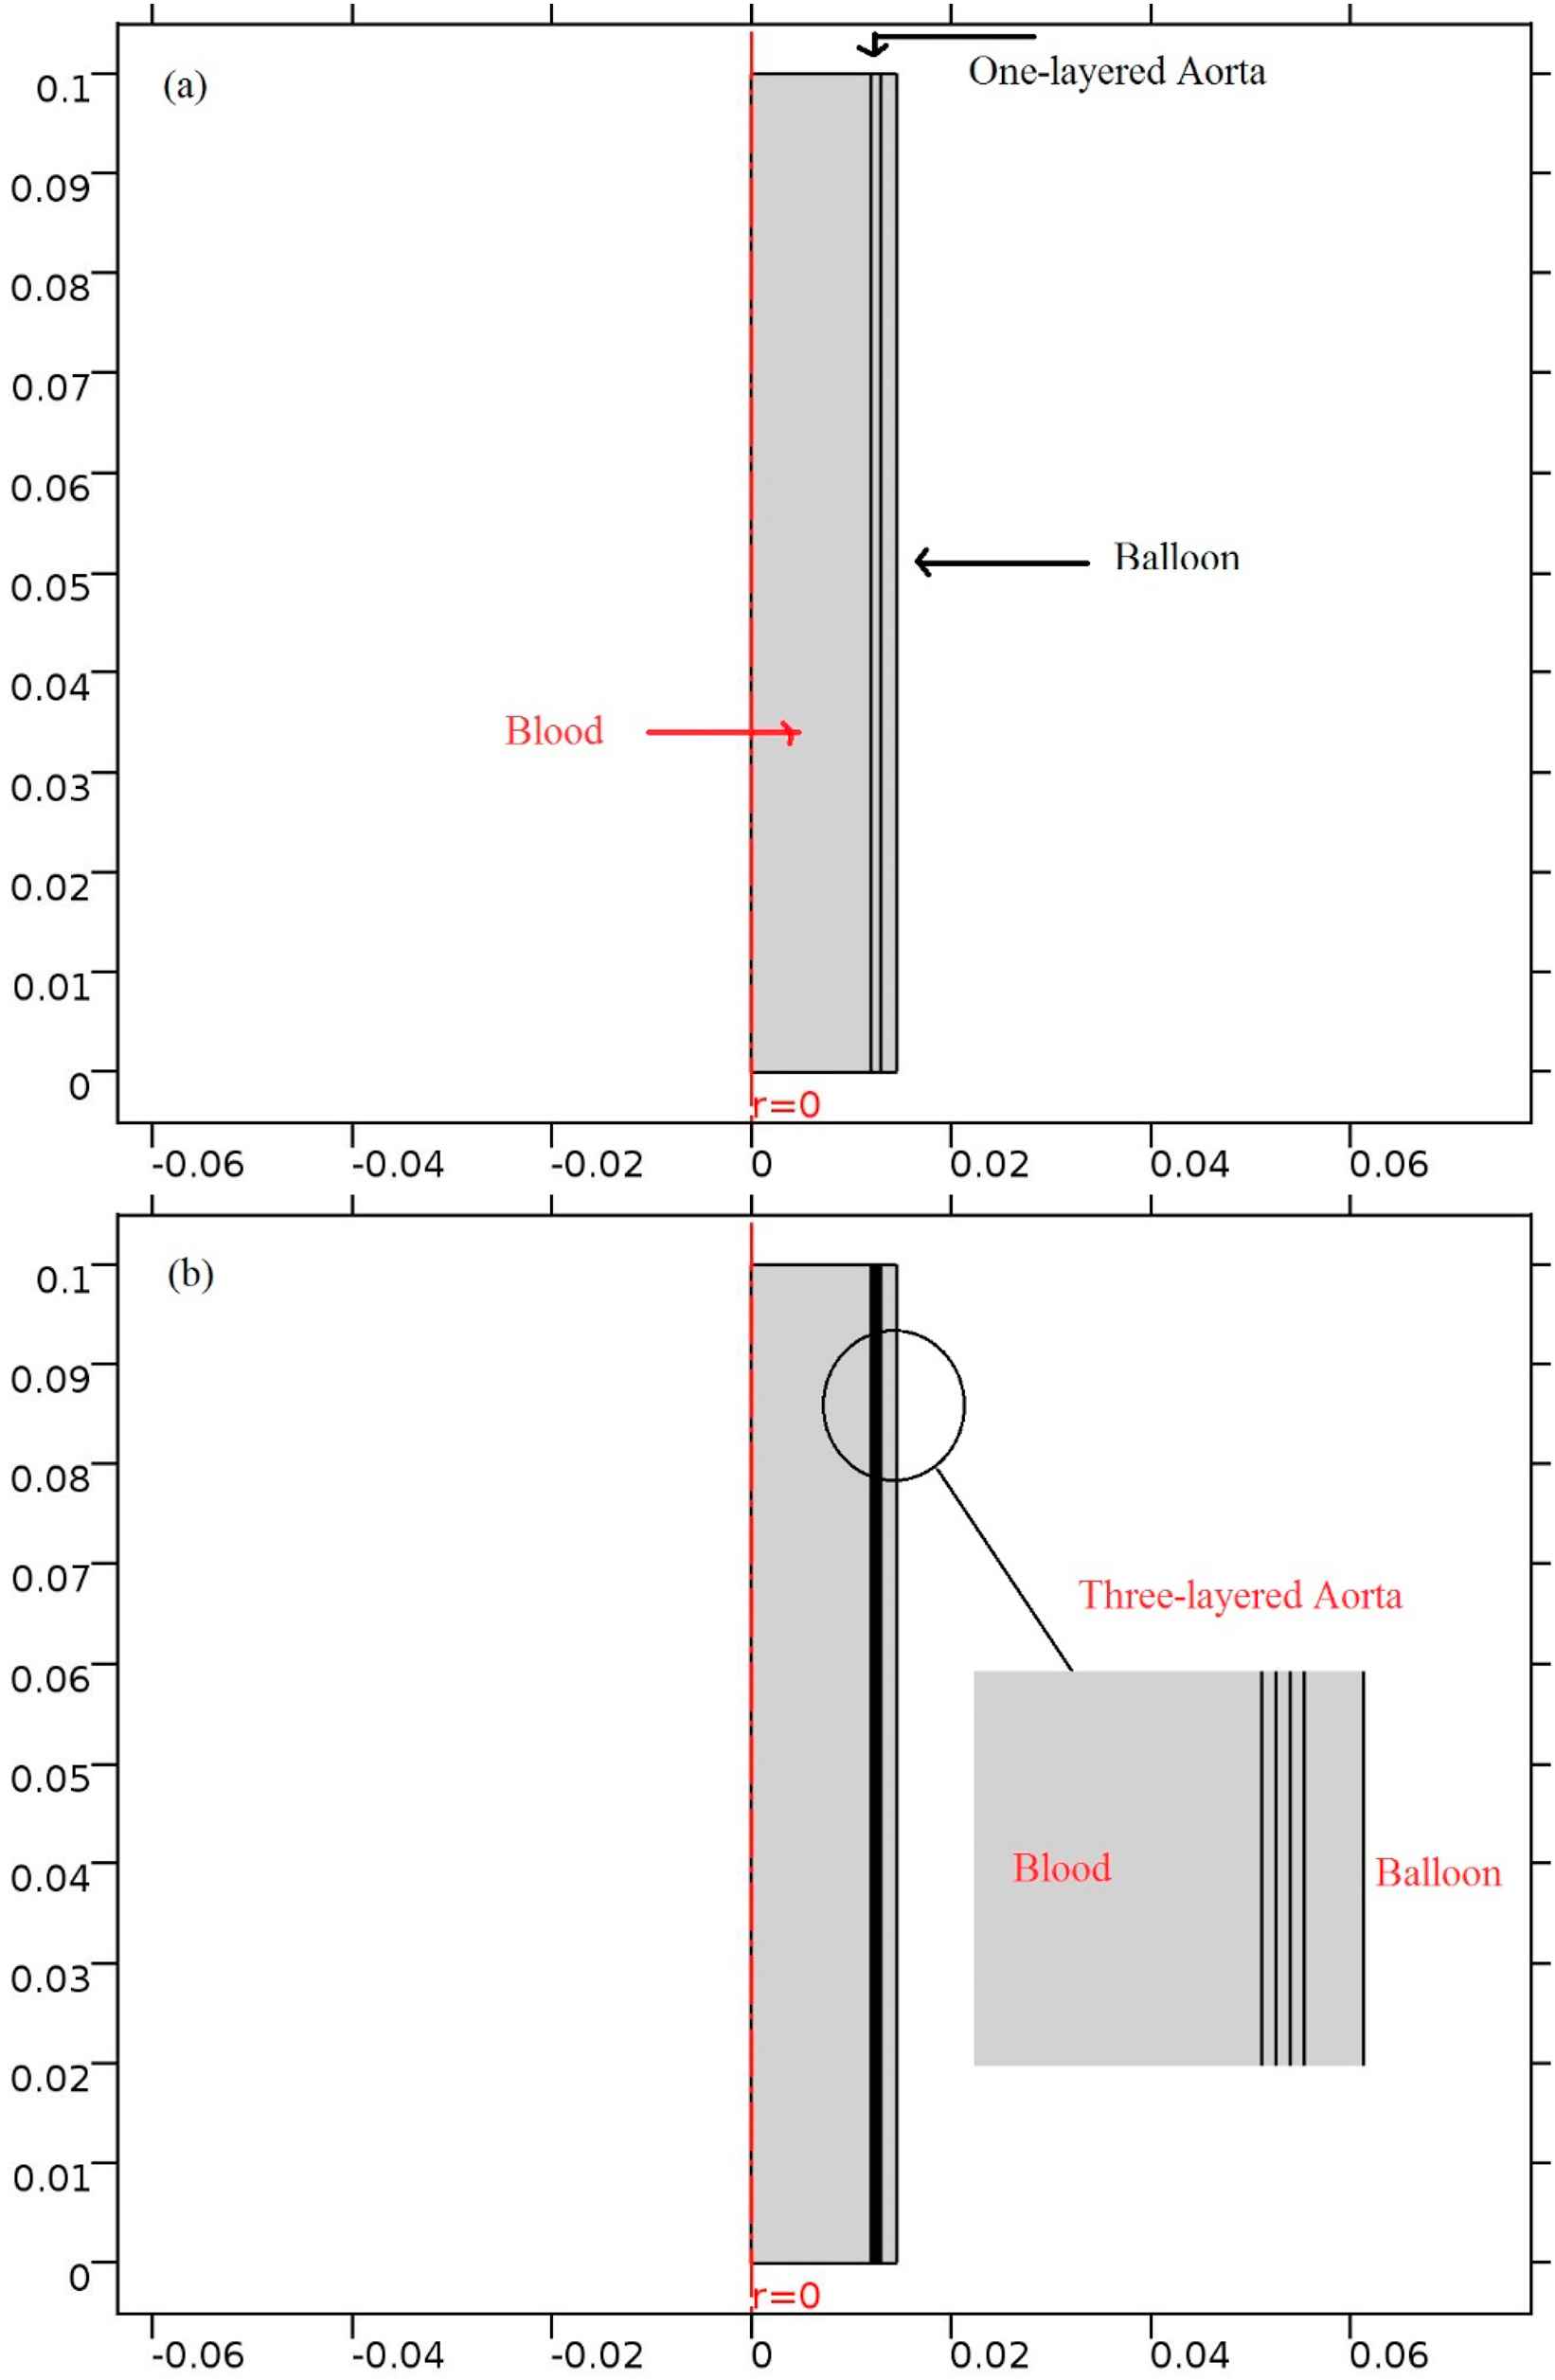
Current models; (a) One-layered (b) three-layered model of the aorta.
Materials
Blood is treated with the Newtonian fluid behavior due to the large diameter of the aorta and incompressible fluid. Blood’s dynamic viscosity is set to 0.0035Pa s. The Poisson’s ratio of the arterial wall is 0.4921 and Young’s Modulus in the one-layered aorta is set to 4 MPa.
There are several studies about the elasticity of different layers of the aorta. Fischer et al. have shown that the elasticity of the media and adventitia are higher than the intima layer.29 Here, Young’s modulus of intima/media/adventitia is set to 3.2, 4.8 and 1,8 MPa, respectively.16
In the default setting the balloon’s thickness is 1 mm in both models. This thickness is then replaced with 0.8 mm, 1.2 mm, 1.4 mm, 1.6 mm, 1.8 mm and 2 mm as previously stated. Three balloon materials are investigated in this study: Polyurethane (2.8 MPa), made of the arterial wall (4 MPa), Silicone rubber (7 MPa).
Meshing
The one-layered model is meshed using 873 elements in three domains and three-layered model with 4135 triangular elements in five domains. Between the layers of the aorta are the tie constraint as well as the aorta and the balloon. All of the elements are triangular and are finer adjacent to the aorta’s wall and the balloon. The maximum mesh size is 0.0067 mm. Figure 3a illustrates the fluid and solid meshes in the one-layered aorta’s model and Fig. 3b shows the meshing of three-layered aorta model. The calculations are performed in two cardiac cycles (0–1.6s) with a 0.001s time step. The results are extracted from the second cardiac cycle from 0.8s to 1.6s to let them reach convergence. In order to investigate mesh independency, the number of elements is increased until the difference in maximum outlet velocity is less than 1%.
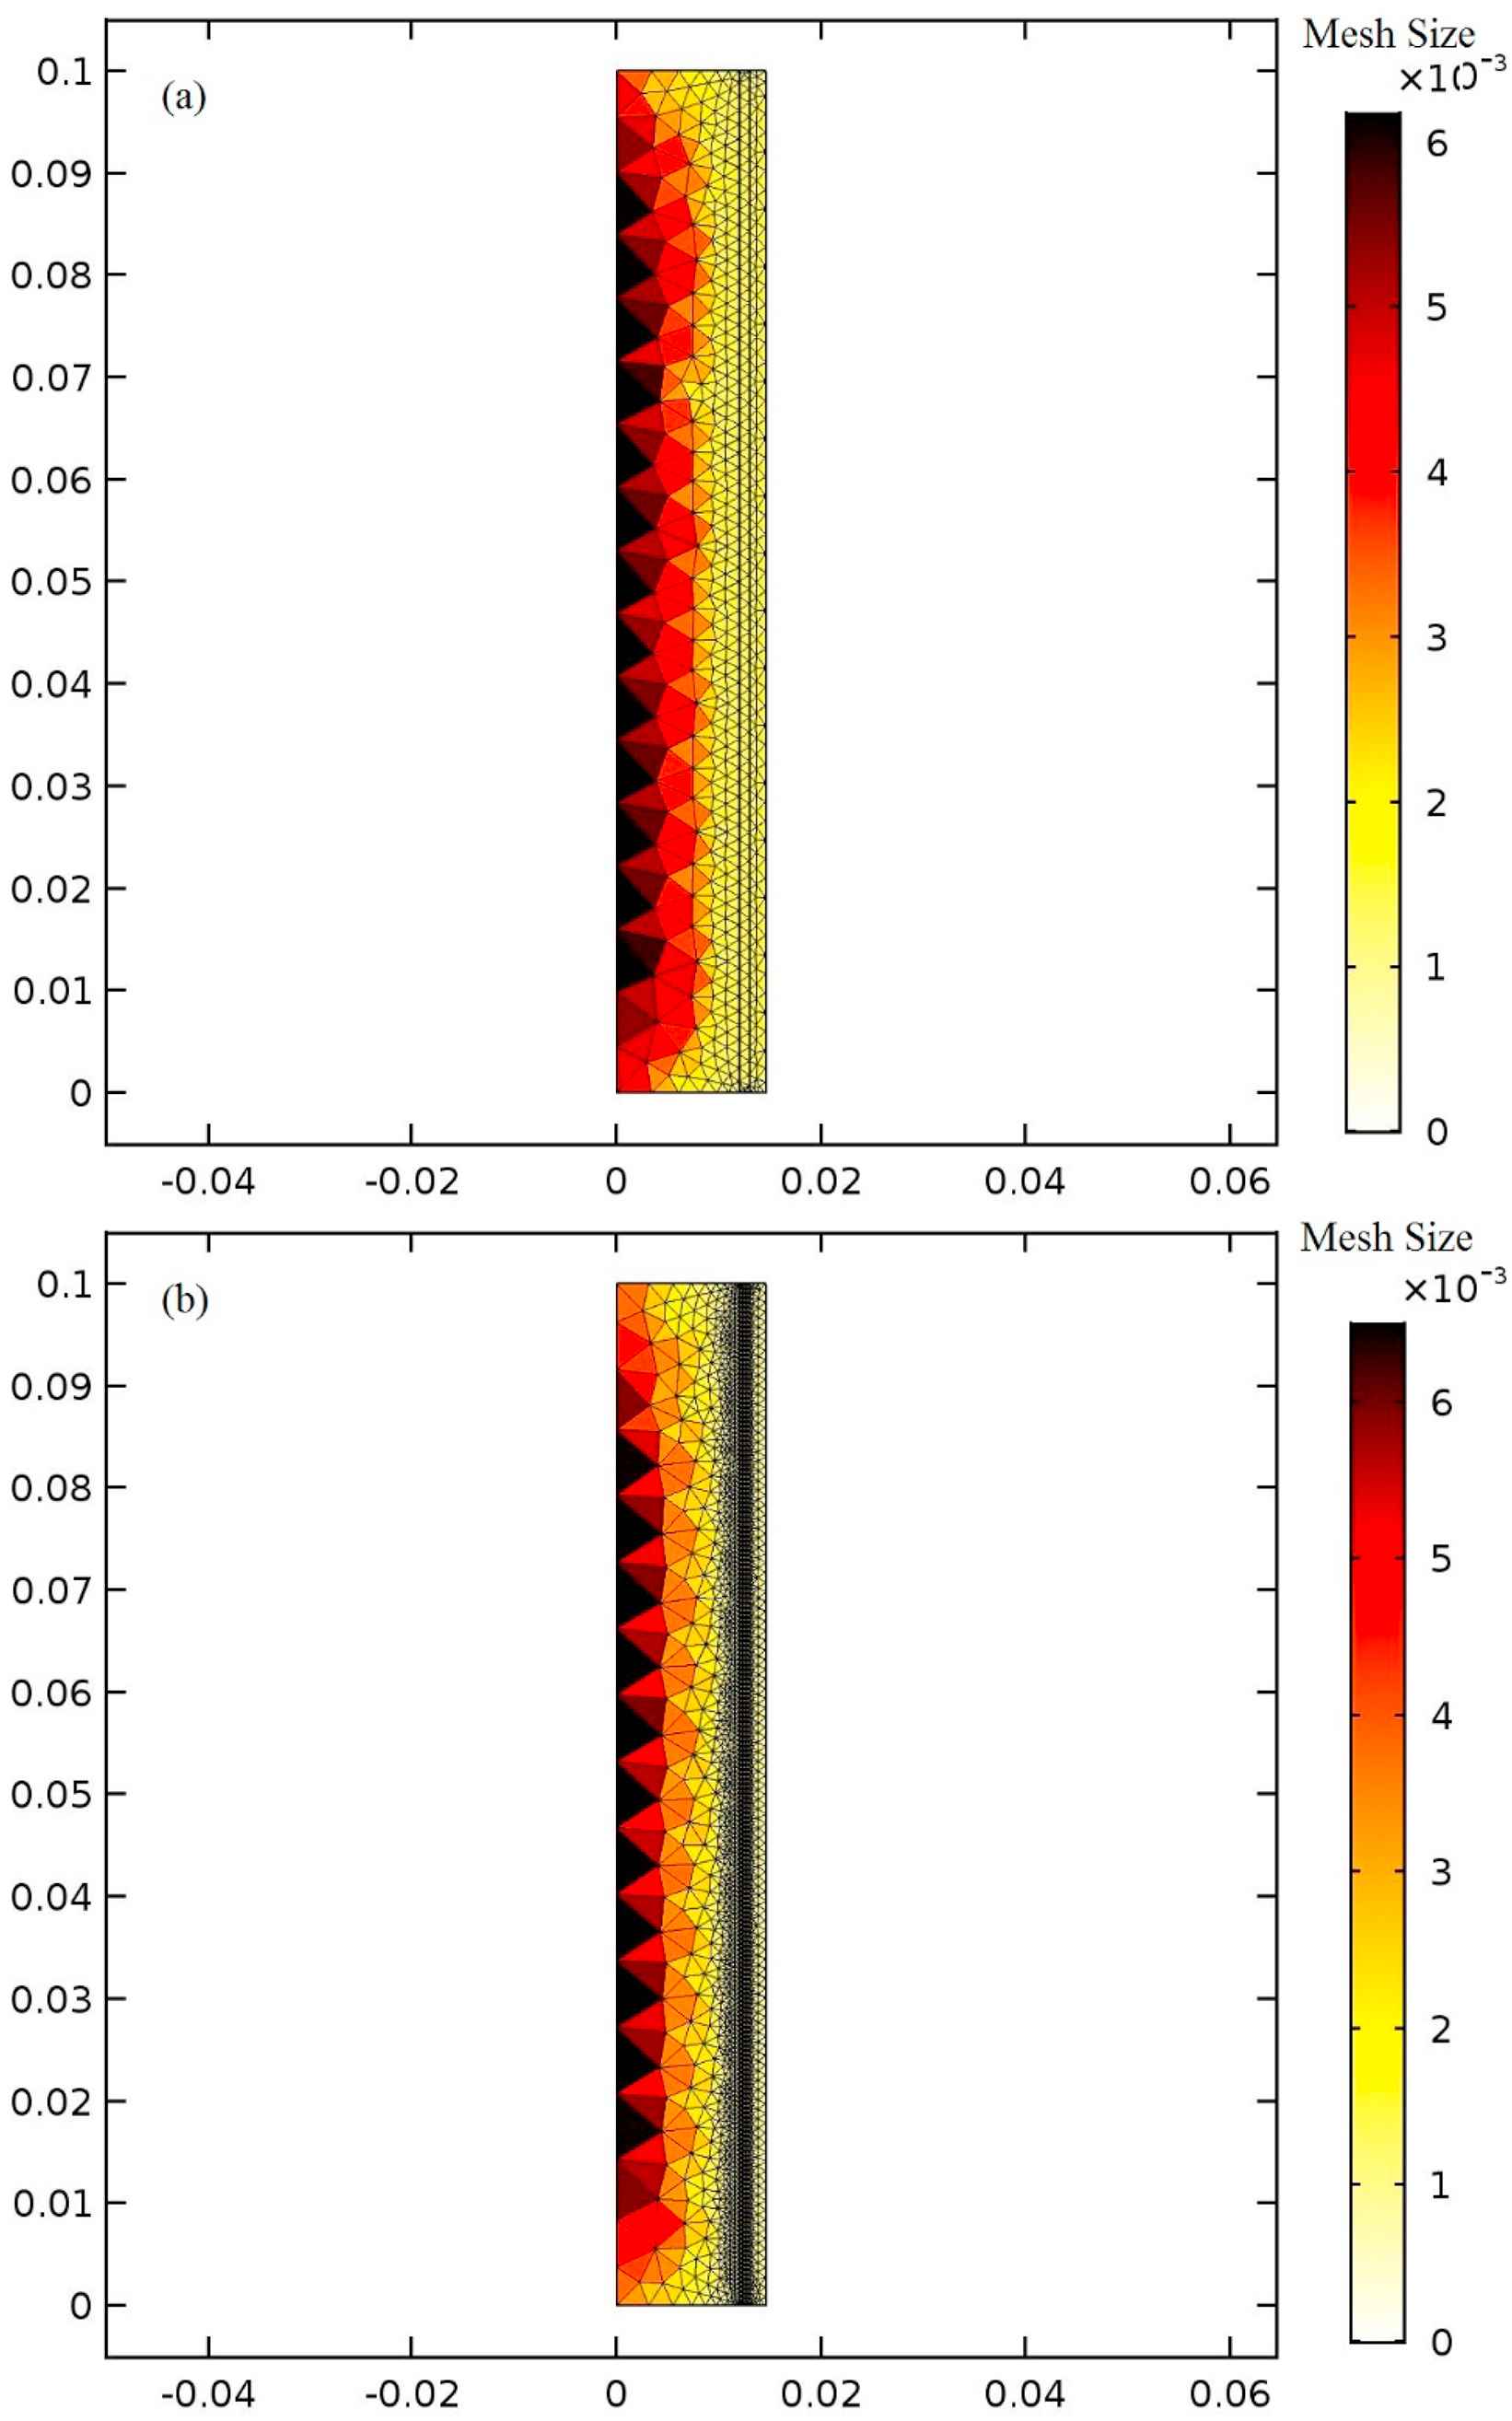
The meshing of the model of the aorta (a) in one-layered with three domains and (b) three-layered with five domains.
Fluid–structure interaction
ALE formulation is used in the FSI. This method combines the advantages of both Lagrangian and Eulerian methodology by defining a new mesh coordinate as a reference. Using this coordinate, a velocity vector is introduced and all of the equations (in mass, momentum and energy) are rewritten with this new velocity.
The governing equations for fluid domain are:
Which leads to:
For the linear elastic material of the aortic wall layer, the equation is:
In this equation, ρ is the solid’s density and F is the body force applied to the solid domain and σ is the Cuachy stress tensor.30,31
Boundary conditions
The aorta’s inlet boundary condition is set to rate of flow (Fig. 4a) for the patient with heart failure which is definitely lower than a healthy one. The outlet boundary condition is pressure versus time (Fig. 4b). Both of these boundary conditions are time-dependent. These data are taken from a man who suffers from heart failure and was hospitalized in Tehran Heart Center (THC). The maximum boundary conditions’ values are less than the healthy subject.32,33 In Fig. 5 the solid–fluid interface boundary and the fixed constraints are shown. Figure 6 represents the pressure versus time which is based on counterpulsation. The pressure reaches its maximum amount during ventricular diastole. This pressure is induced by the fluid between two layers of the balloon.
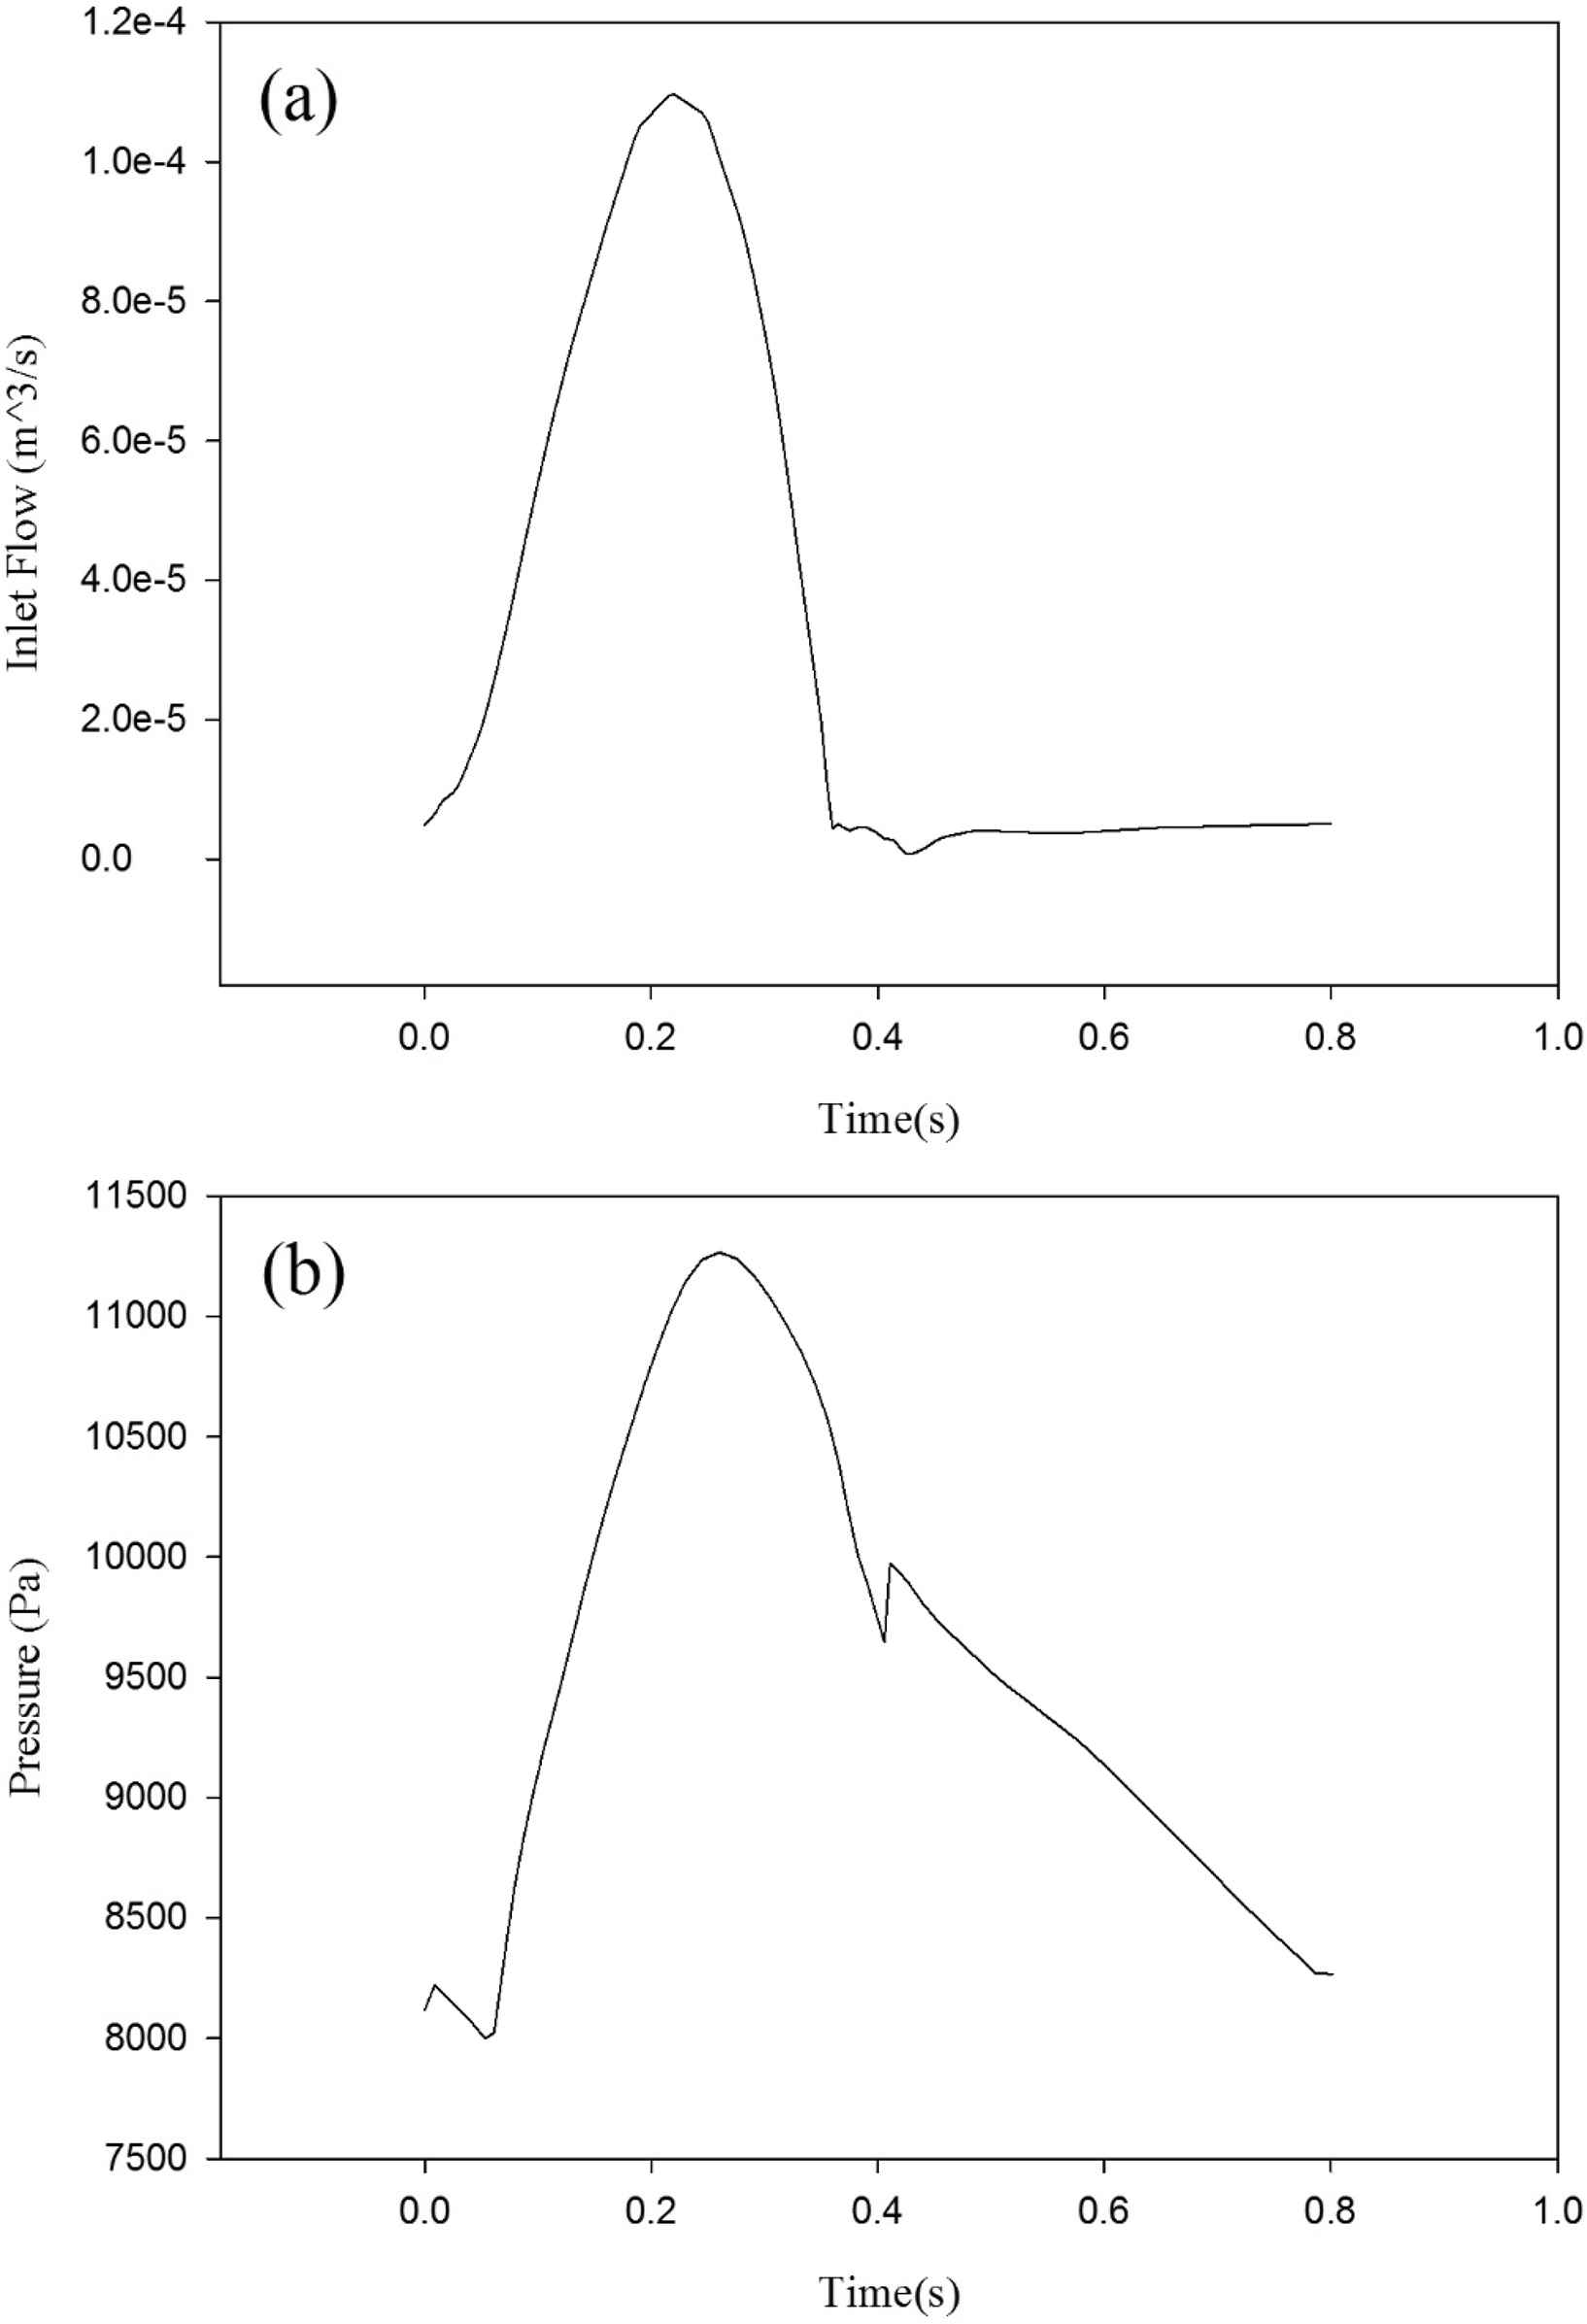
The aorta’s boundary condition (a) Blood flow at the inlet (b) pressure at the outlet.
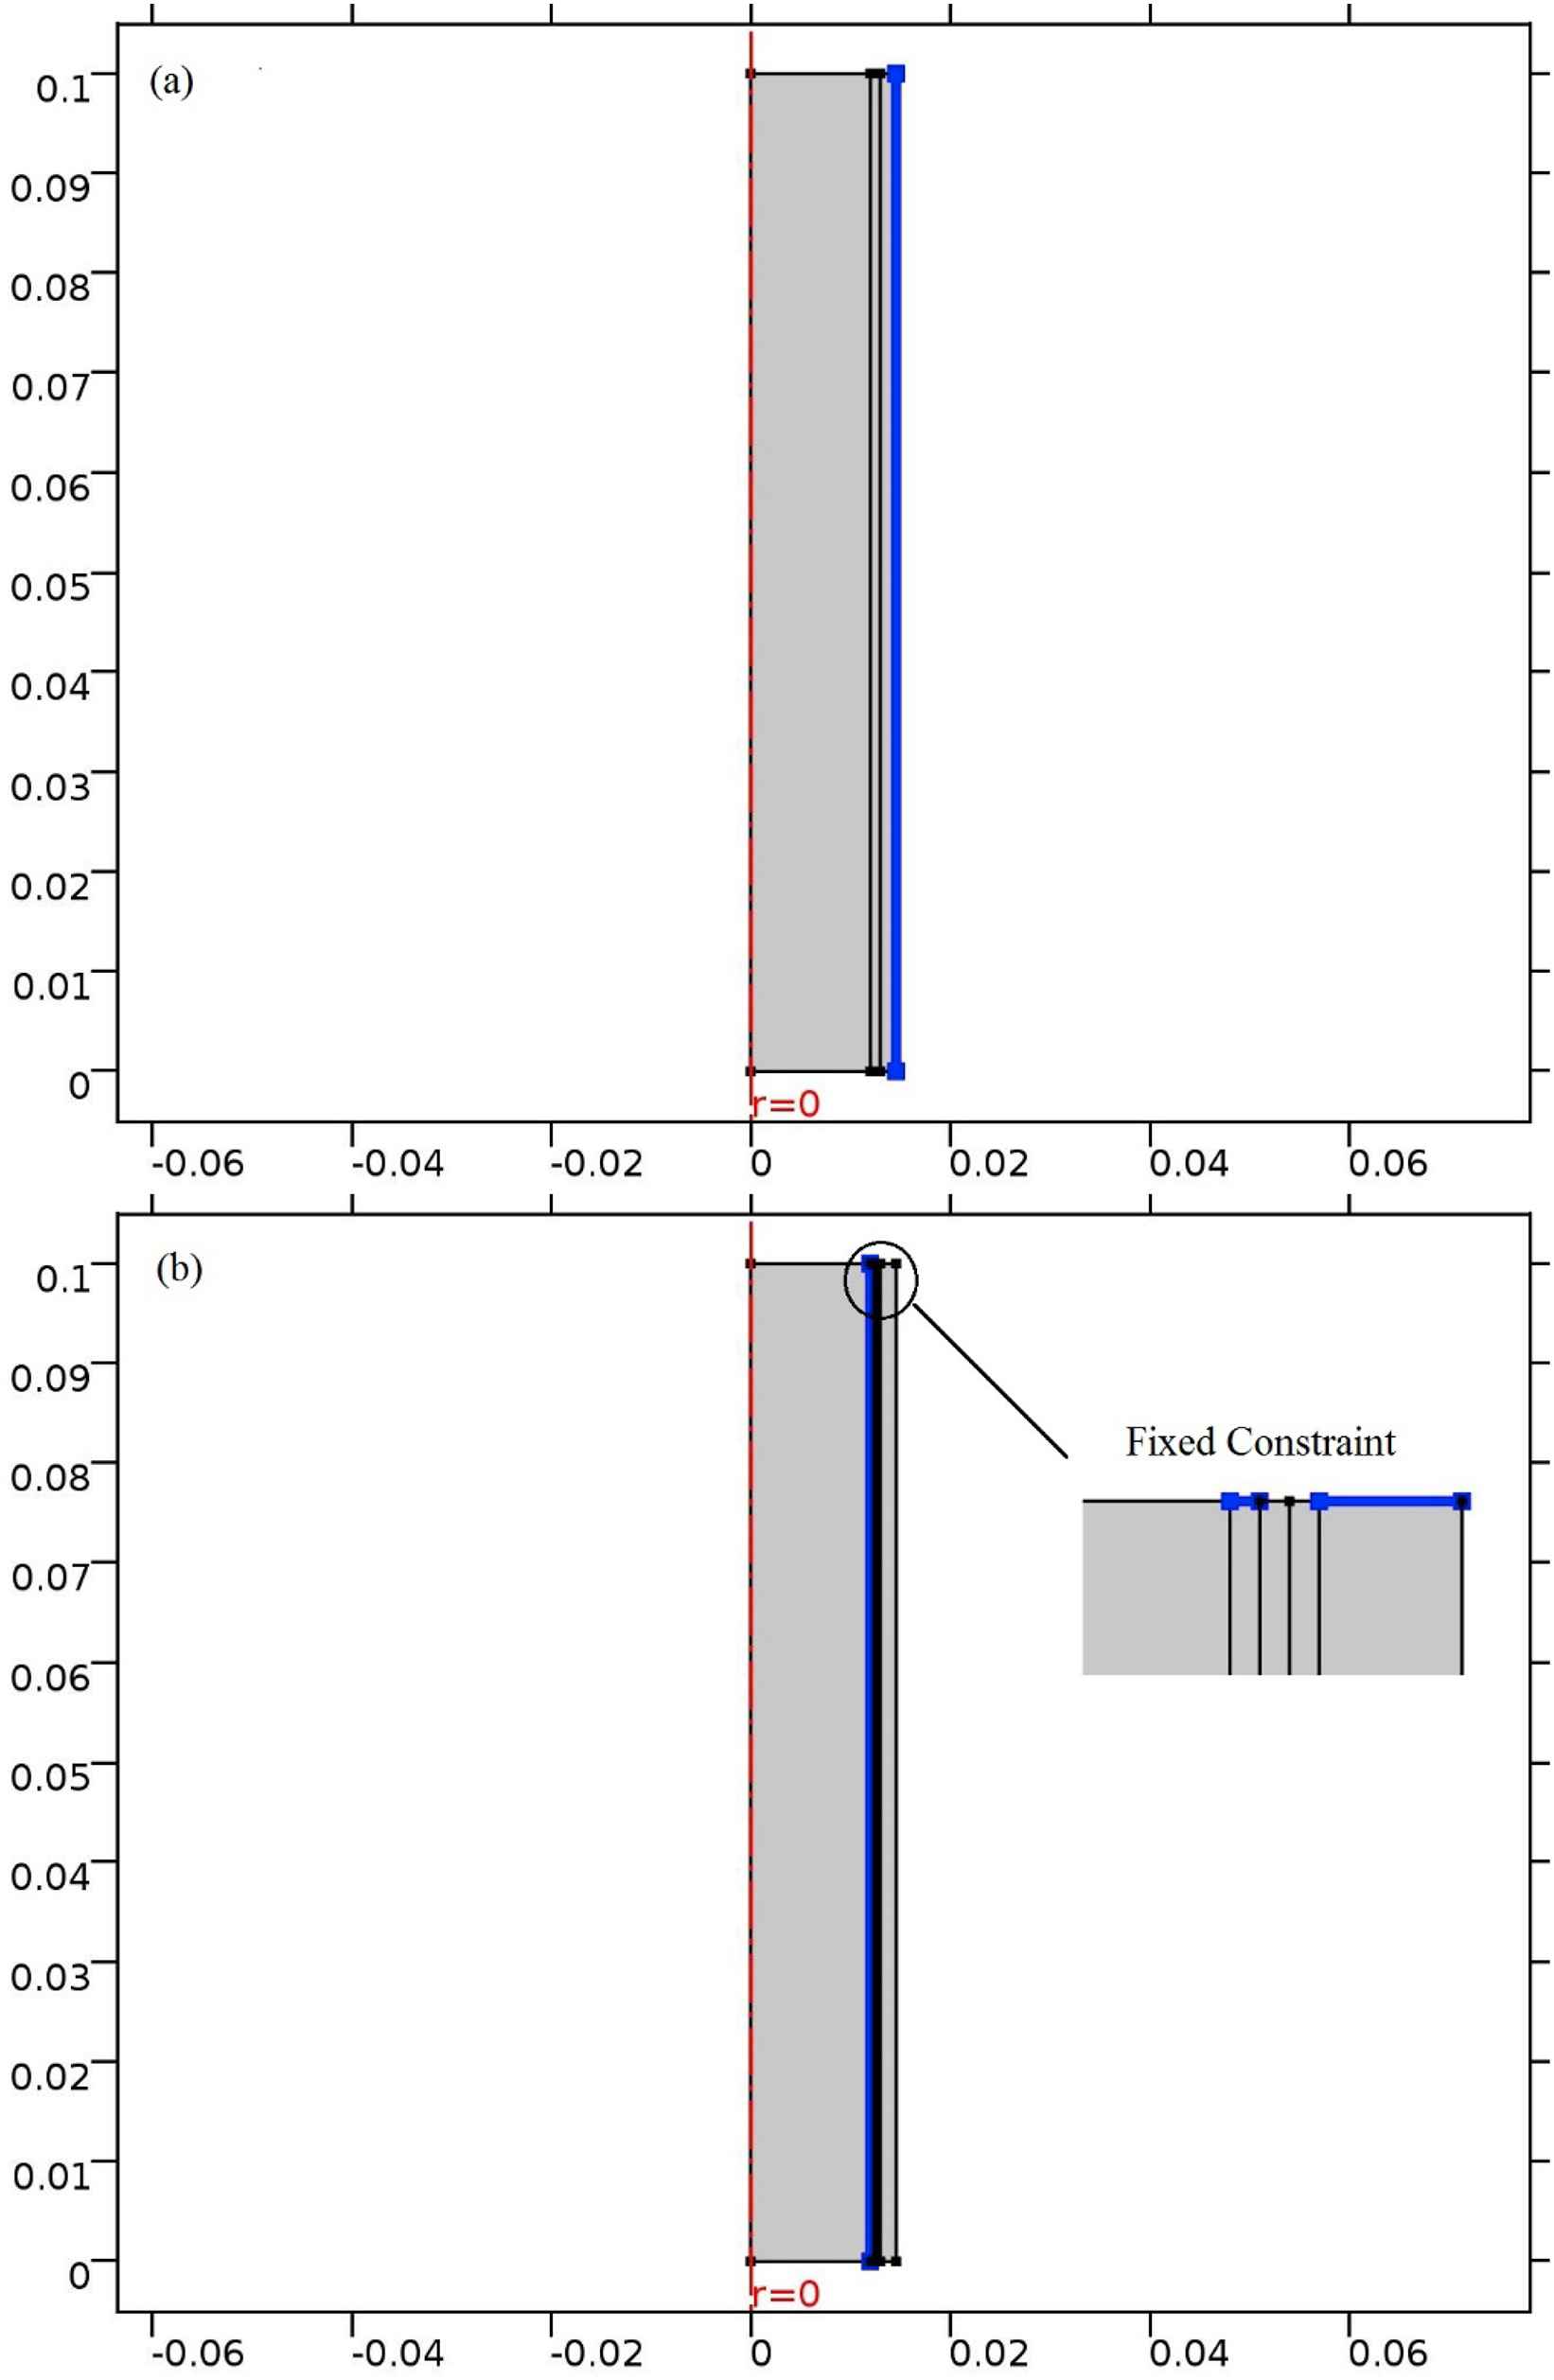
Constraints for (a) One-layered (b) three-layered model of the aorta.
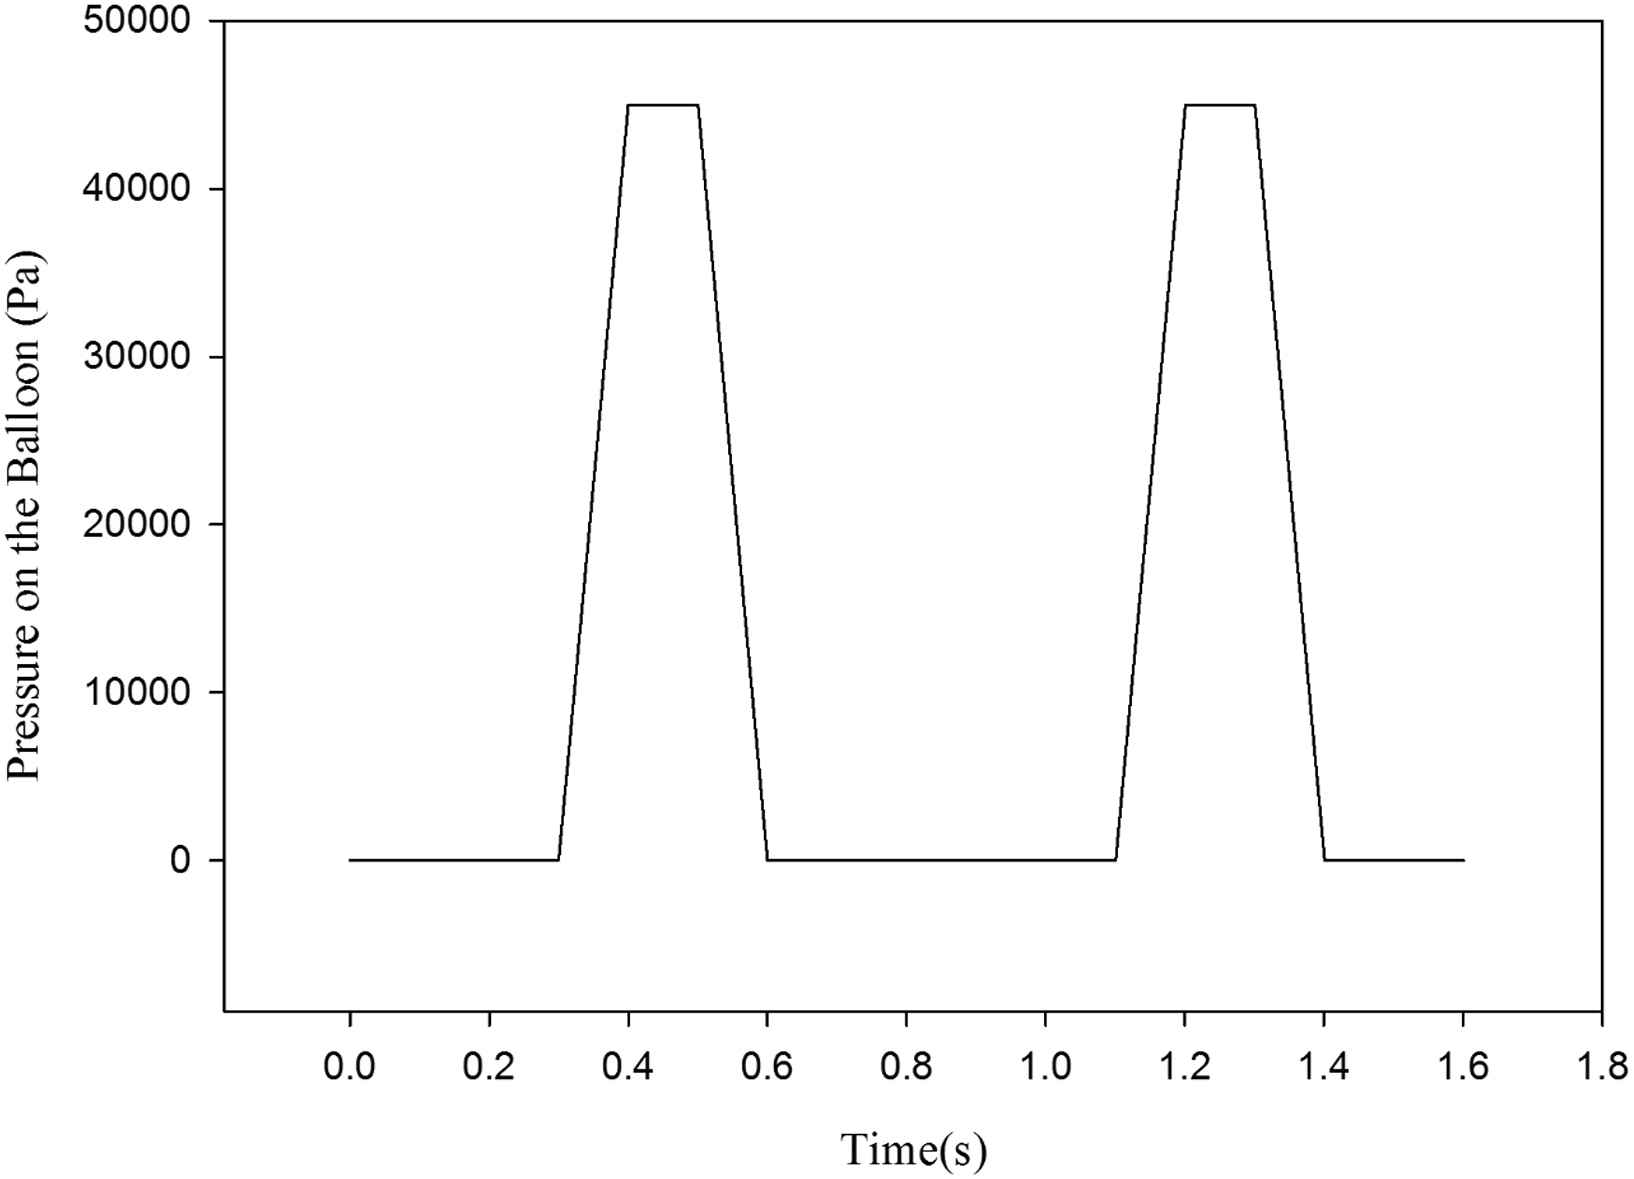
Applied pressure on the balloon within the two complete heart cycles.
Solving steps
In order to investigate the effects of the balloon’s thickness and materials on the von Mises stress and blood flow velocity, the following steps are taken into account:
First, the three-layered aorta with the given flow inlet boundary and pressure outlet boundary is solved and the results are compared with the previous studies in the literature. Then, in order to investigate the assist device influences, the pressure is applied to the balloon and all the parameters are calculated again. These steps are repeated with the one-layered aorta. Each of these steps is solved for seven varying balloon thicknesses and three varying balloon materials.
Model validation
In order to investigate the validity of the model, the inlet flow and outlet pressure have been altered to a healthy heart at its systolic peak. The variation of the von Mises wall stress is calculated across the wall of the three-layered aorta and the results are compared with Khanafer’s study.16 The Khanafer’s model and assumptions are the same with the current study. The results’ comparison is shown in Fig. 7. In this figure, the distribution of von Mises stress across each of the three layers of the aorta is depicted. There are discontinuities in this diagram which is due to mechanical properties differences between the layers. The magnitudes of the von Mises stress are higher in the media layer (from 0.0122 m to 0.0133 m) rather than two other layers of the aortic wall. The high magnitude of the Young’s Modulus of this layer has led to the increase of von Mises stress. The inequality is developed by the deviation of the hypothetical thickness ratio and Young’s modulus of the three layers of the aorta.

The comparison of Khanafer’s study and current study in three-layered model.
Results
Pressure distribution
The influence of using the presented device on the pressure distribution is investigated. The aorta’s pressure distribution is shown in Fig. 8a. The maximum pressure is 9.77 kPa at the aorta’s outlet at 0.4s, the time of applying maximum pressure on the balloon. In case of using the balloon, the pressure distribution is different. The maximum pressure increases by 6.05% to reach the amount of 10.4 kPa at the same time as illustrated in Fig. 8b. By changing the balloon’s materials and thicknesses, pressure distribution changes slightly which is less than 1% change in the maximum pressure.
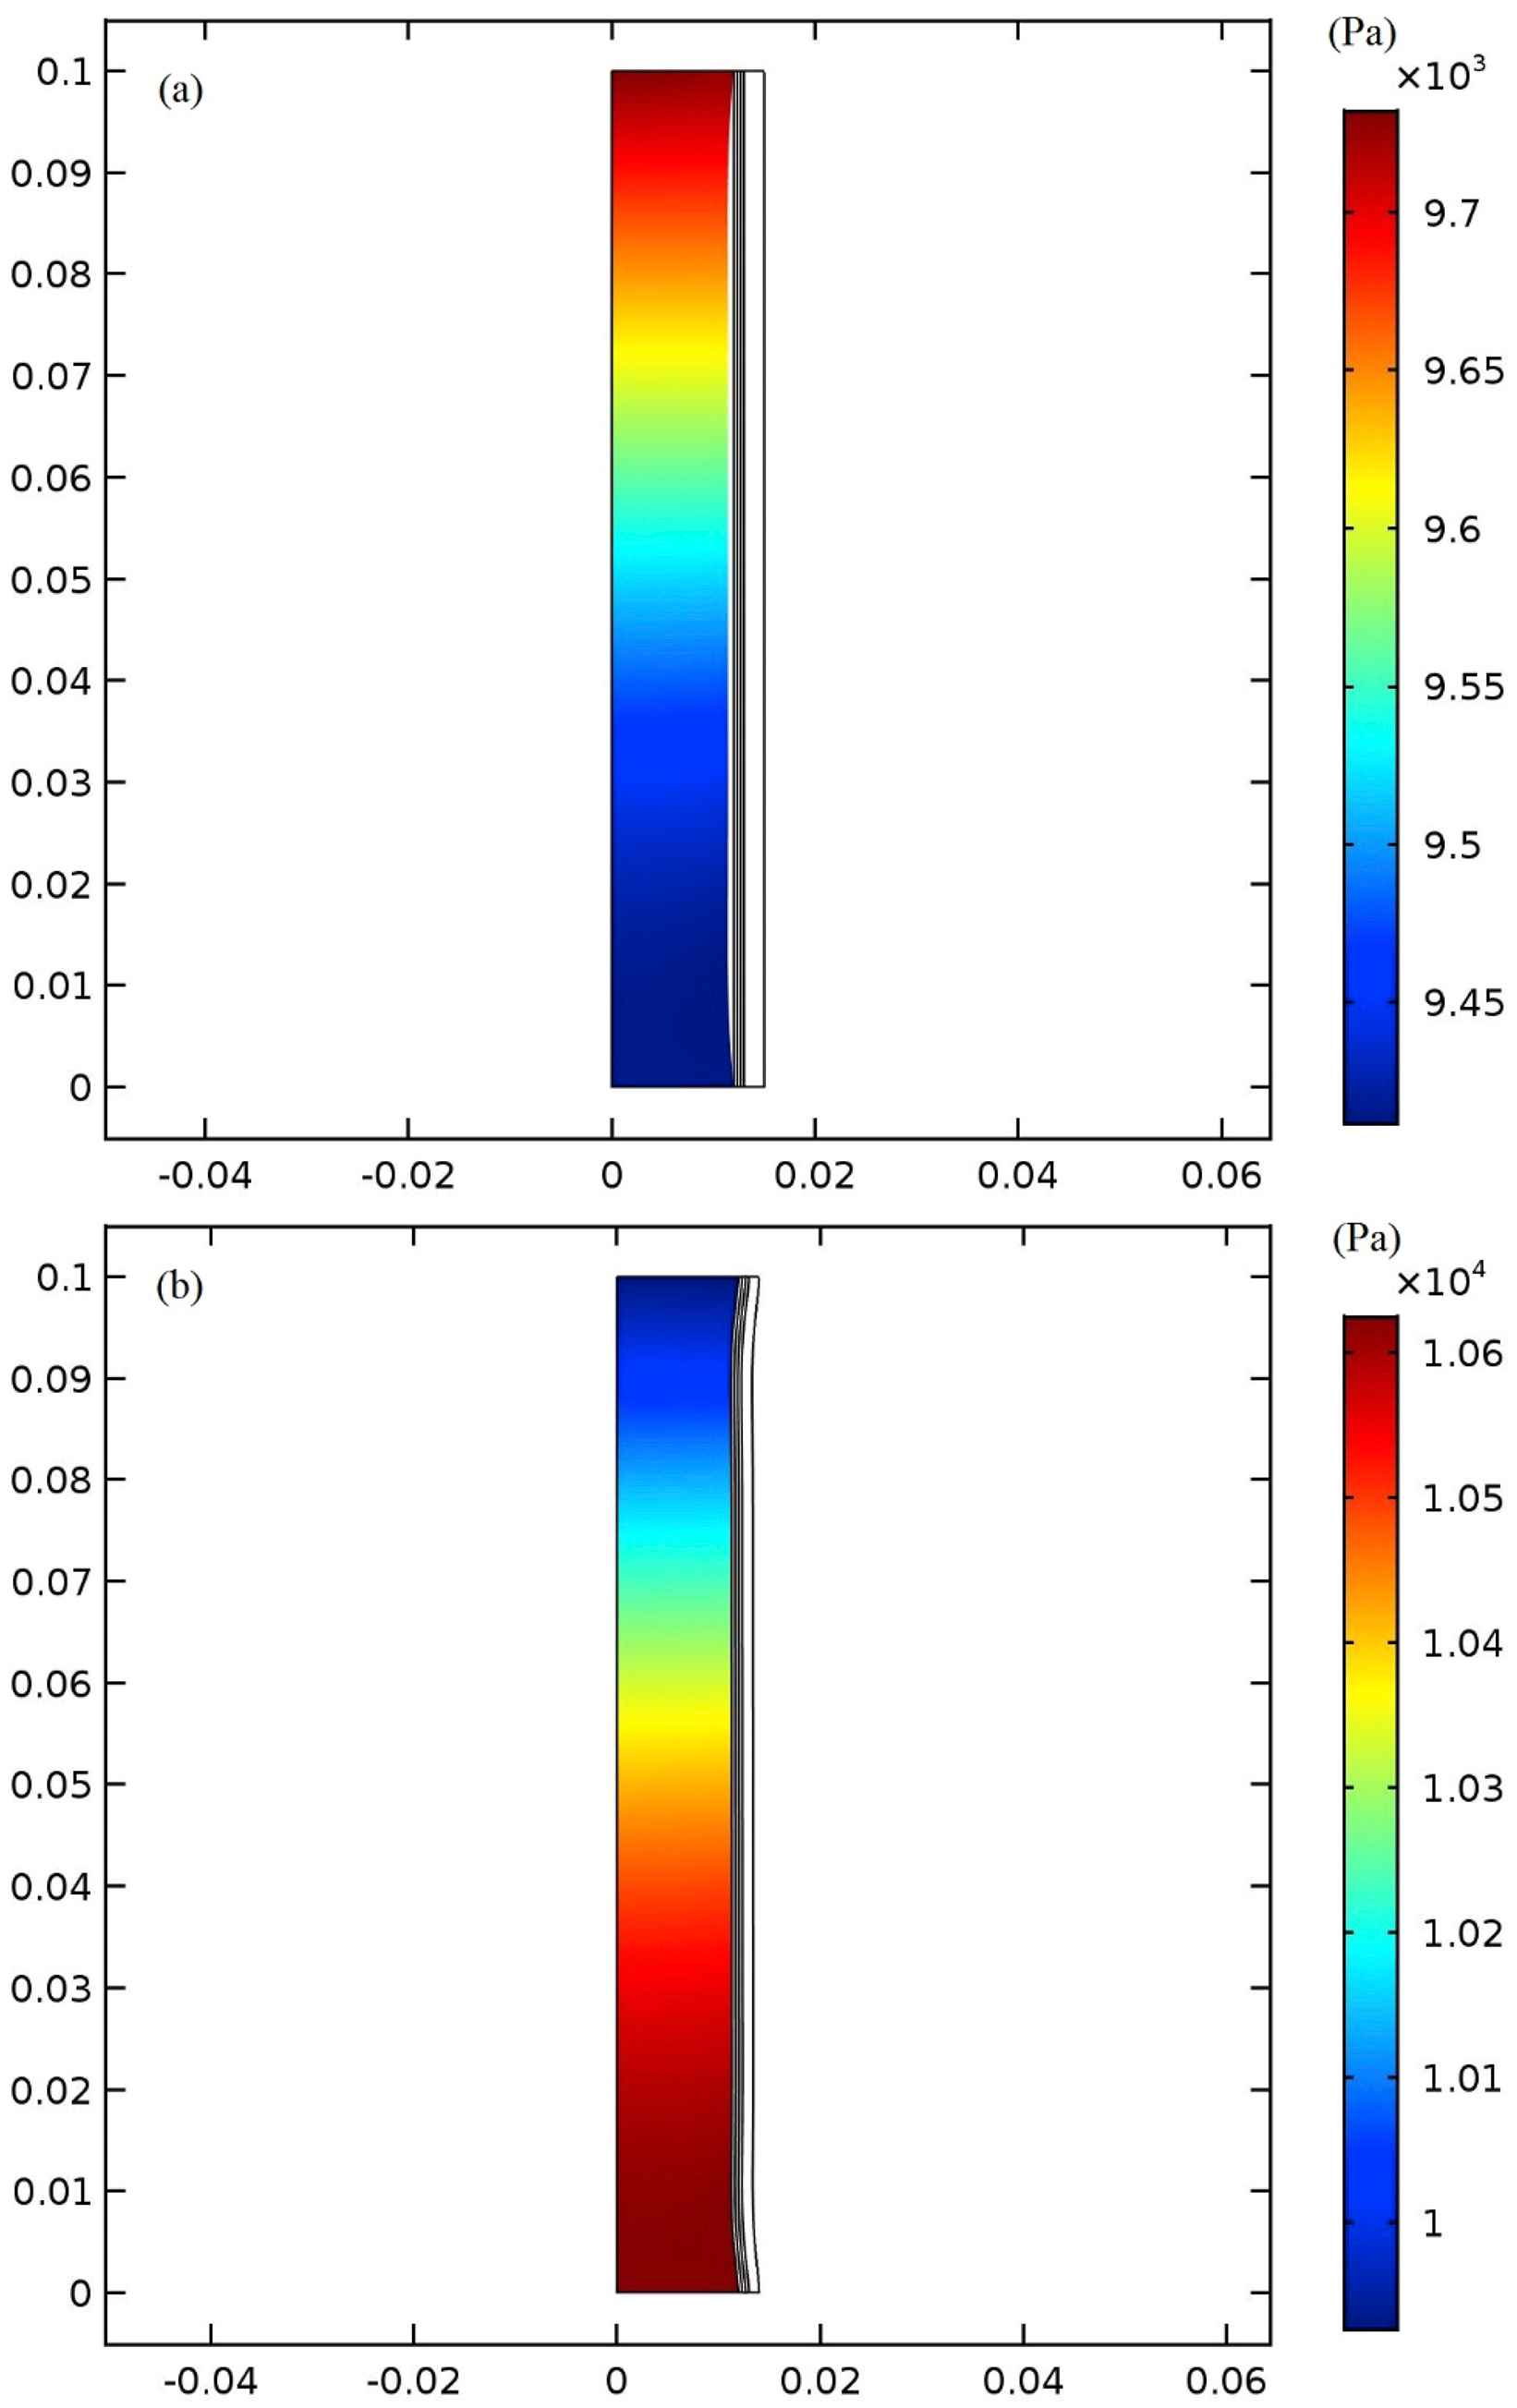
Pressure distribution in the aorta at 0.4s (a) without balloon and (b) with balloon and at the time of maximum pressure on the balloon.
Blood flow velocity and von Mises stress distribution
At the time 0.2s, the maximum blood flow enters the aorta and the highest blood flow velocity occurs at the center of the aorta. At the time 0.3s, the maximum blood flow velocity reduction is 66.66% which is located near the center of the modeled aorta. This decrease in maximum velocity is a direct consequence of HF. In order to help the blood pumping procedure, the device with the extra-aortic balloon is implemented and the maximum pressure is applied to the balloon at 0.4s when the balloon’s inflation is completed. The applied pressure pattern, as shown in Fig. 6, is based on the counterpulsation method. Note that all the data is taken from the second heart cycle to let them reach convergence. The velocity field due to the use of the 1 mm polyurethane balloon, made of the arterial wall, and the silicone rubber balloons at 0.4s in one-layered aorta model are shown in Fig. 9a and b, and c, respectively. The highest increase in the maximum velocity occurs in the polyurethane balloon since this material has the lowest Young’s Modulus among the others and becomes largely deformed when external pressure is applied to it. Two other materials with their higher Young’s modulus increase the velocity but not to the extent of the polyurethane balloon, however, the maximum velocity takes place at the outlet of the aorta in all of them. The use of the 1 mm polyurethane balloon increases the blood velocity by 91.8% in comparison with the blood flow velocity in the patient’s aorta at the same time (0.4s). The 1 mm-made of the arterial wall balloon gives 85.7% increase and 1 mm silicone rubber shows 79.4% increase. In Fig. 9 the variation of the von Mises stresses is also illustrated. Von Mises stress can be used to evaluate the failure of soft tissue. The von Mises stress analysis in soft tissue is based on a pointwise criticality condition, e.g. von Mises maximum stress, in which only local state of deformation is assumed to be critical and the failure criterion is separated from stress analysis.34 The von Mises stress is considered in this study to show the effect of balloon’s inflation and deflation on the aorta’s tissue. The von Mises stress has been used as a prediction tool in many studies related to cardiovascular mechanics.35,36 The maximum von Mises stress is augmented at 0.4s due to the balloon use and occurs at the first and last points of the innermost layer of the aorta’s wall. The polyurethane balloon increases the maximum von Mises stress to 1.44 MPa which is the highest peak von Mises stress in comparison with the other cases. There is a 92% increase in stress of a patient’s aortic wall by using polyurethane. Other two materials give 88.8% (1.03 MPa) and 82.3% (0.65 MPa) increase in the peak stress.
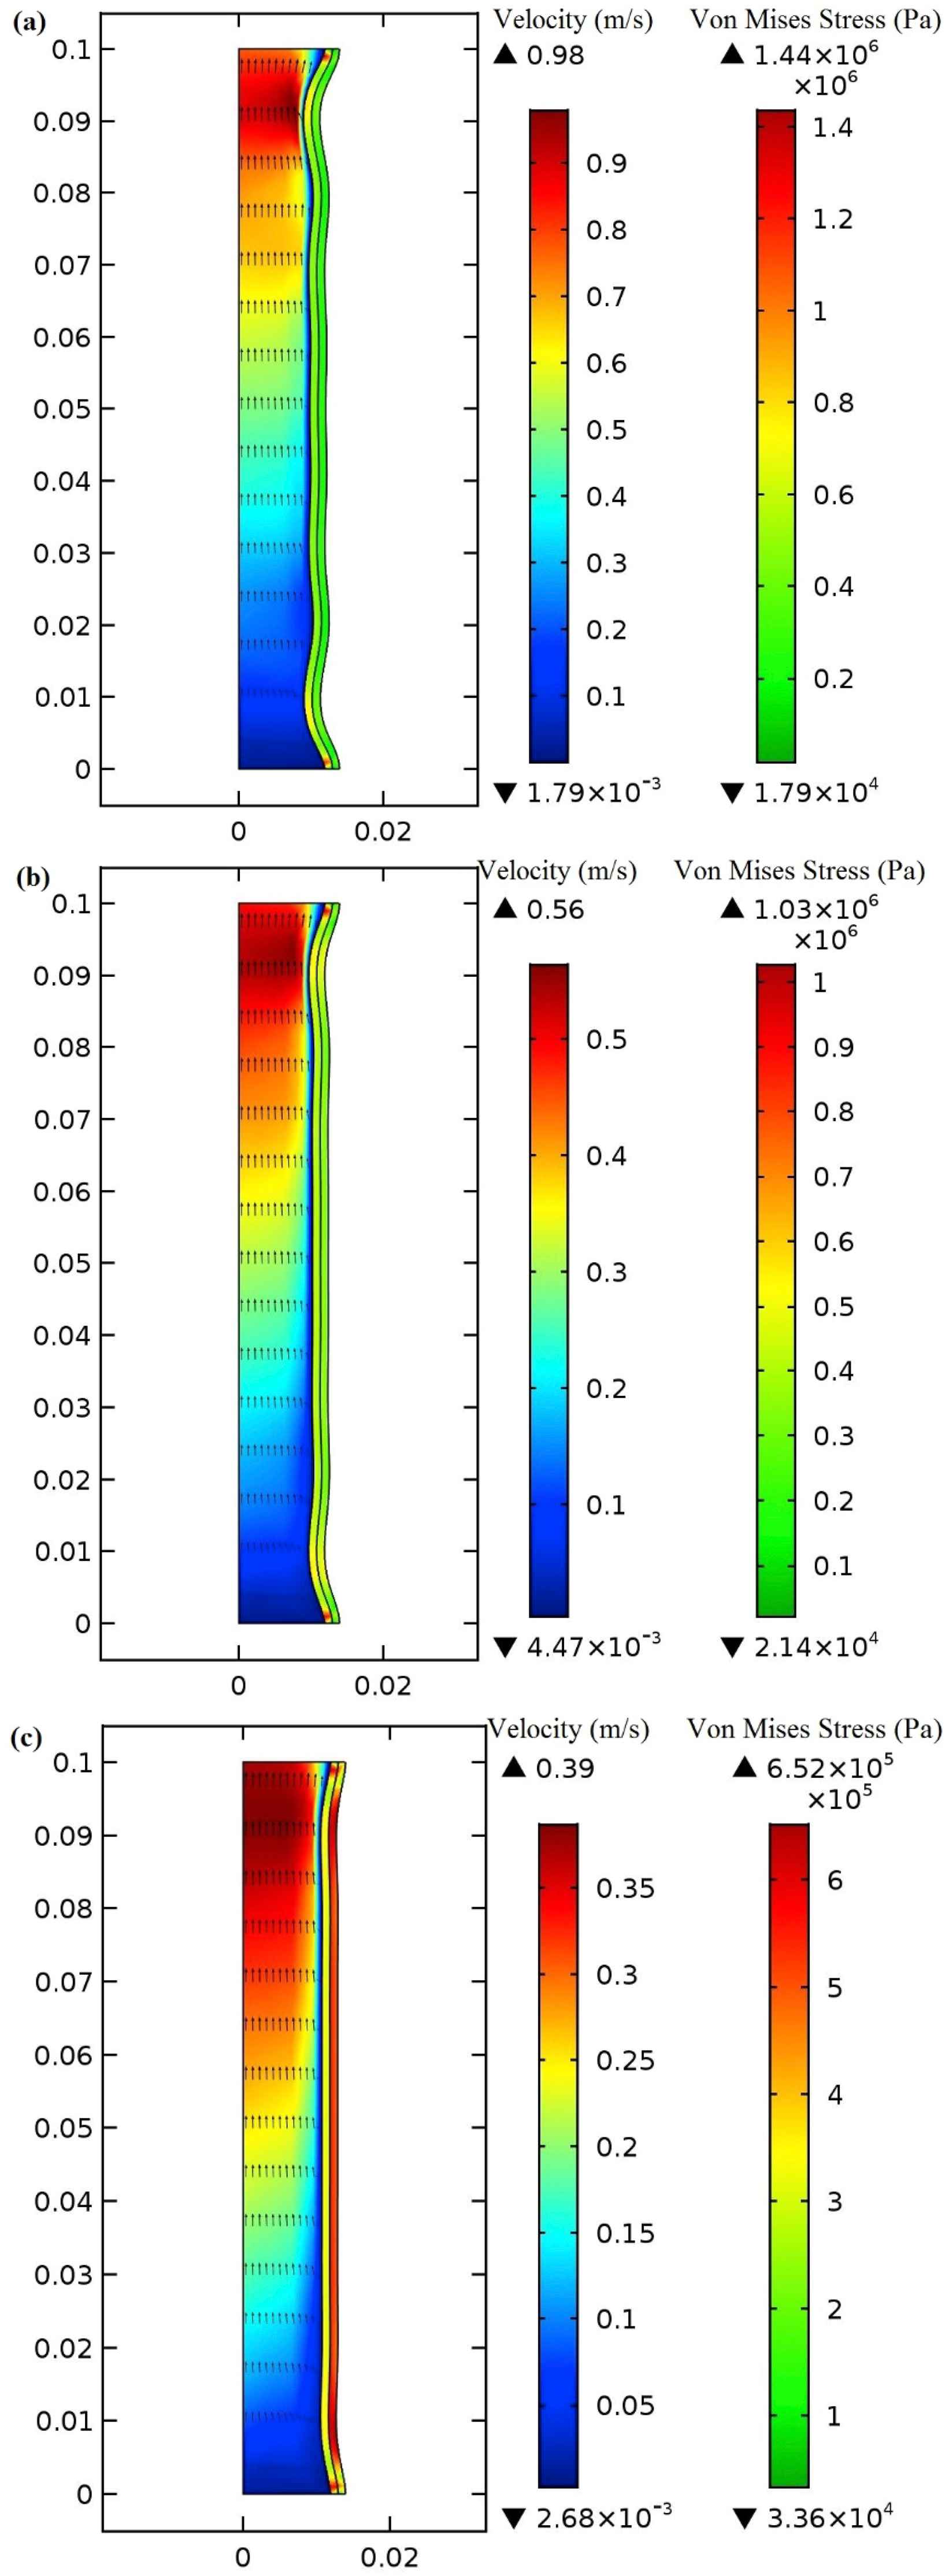
Von Mises stress and velocity distribution in the (a) 1 mm polyurethane balloon (b) 1 mm made of arterial wall (c) 1 mm made of silicone rubber at peak applied pressure (0.4s).
Blood velocity and wall stress are also investigated by using a 2 mm balloon in order to study the influence of the balloon’s thickness on these parameters in three materials. Thicker balloon causes both maximum blood flow velocity and peak von Mises stress to reduce since the balloon changes slightly from its original shape by the applied pressure and acts as a stiffer material. The 2 mm polyurethane balloon increases the maximum von Mises stress by 82.9% (0.675 MPa). Peak von Mises stress increase is 79.1% (0.552 MPa) and 75.4% (0.468 MPa) in the cases in which the balloon is made of the arterial wall and silicone rubber, respectively. Although the maximum von Mises stress is reduced when using the 2 mm balloon in comparison with the 1 mm balloon, the peak velocity also declines which means that is undesirable. Note that there is still an increase of maximum blood flow velocity in comparison with when there is no balloon at 0.4s. There is an increase in blood flow velocity by the amount of 82.1% for the polyurethane balloon, 80.55% for the balloon which is made of the arterial wall, and 68.28% for the silicone rubber. Using the three-layered model, the magnitudes of the von Mises stress in three different balloon materials have been calculated and listed in Table 1. The von Mises stresses are higher in this model compared to the one-layered model due to the changes in mechanical properties of the aorta layers especially the high Young’s modulus of the media layer. The results show that by increasing the balloon’s thickness, the maximum increased blood flow velocity and von Mises stress are decreased. This can be justified by the reason that by thickening of the balloon, the effect of balloon compression on the aorta and blood flow is reduced. In other words, the more thickening of the balloon, we have the fewer effects on the blood flow and wall. Since the pressure applied to the balloon is unchanged, by thickening of the balloon, the majority of this pressure is tolerated by the balloon and energy of this pressure is dissipated through the thickness of the balloon. As a result of this, the effect of this pressure will be reduced on the blood flow and von Mises stress.
| Polyurethane Balloon | Made up of the arterial wall Balloon | Silicone Rubber Balloon | |
|---|---|---|---|
| 1 mm Balloon | 1.77 MPa | 1.16 MPa | 0.753 MPa |
| 2 mm Balloon | 0.825 MPa | 0.786 MPa | 0.694 MPa |
Maximum von Mises stress (MPa) in the three-layered model of the aorta at the time of applying maximum pressure to the balloon (0.4s).
The increase in blood flow velocity calculated in the three-layered aorta is shown in Table 2.
| Polyurethane Balloon | Made up of the arterial wall Balloon | Silicone Rubber Balloon | |
|---|---|---|---|
| 1 mm Balloon | 81% | 77.4% | 70.7% |
| 2 mm Balloon | 70.8% | 65% | 64.8% |
The percentage of increase in the blood flow velocity by using prototype assist at the time of applying maximum pressure to the balloon (0.4s).
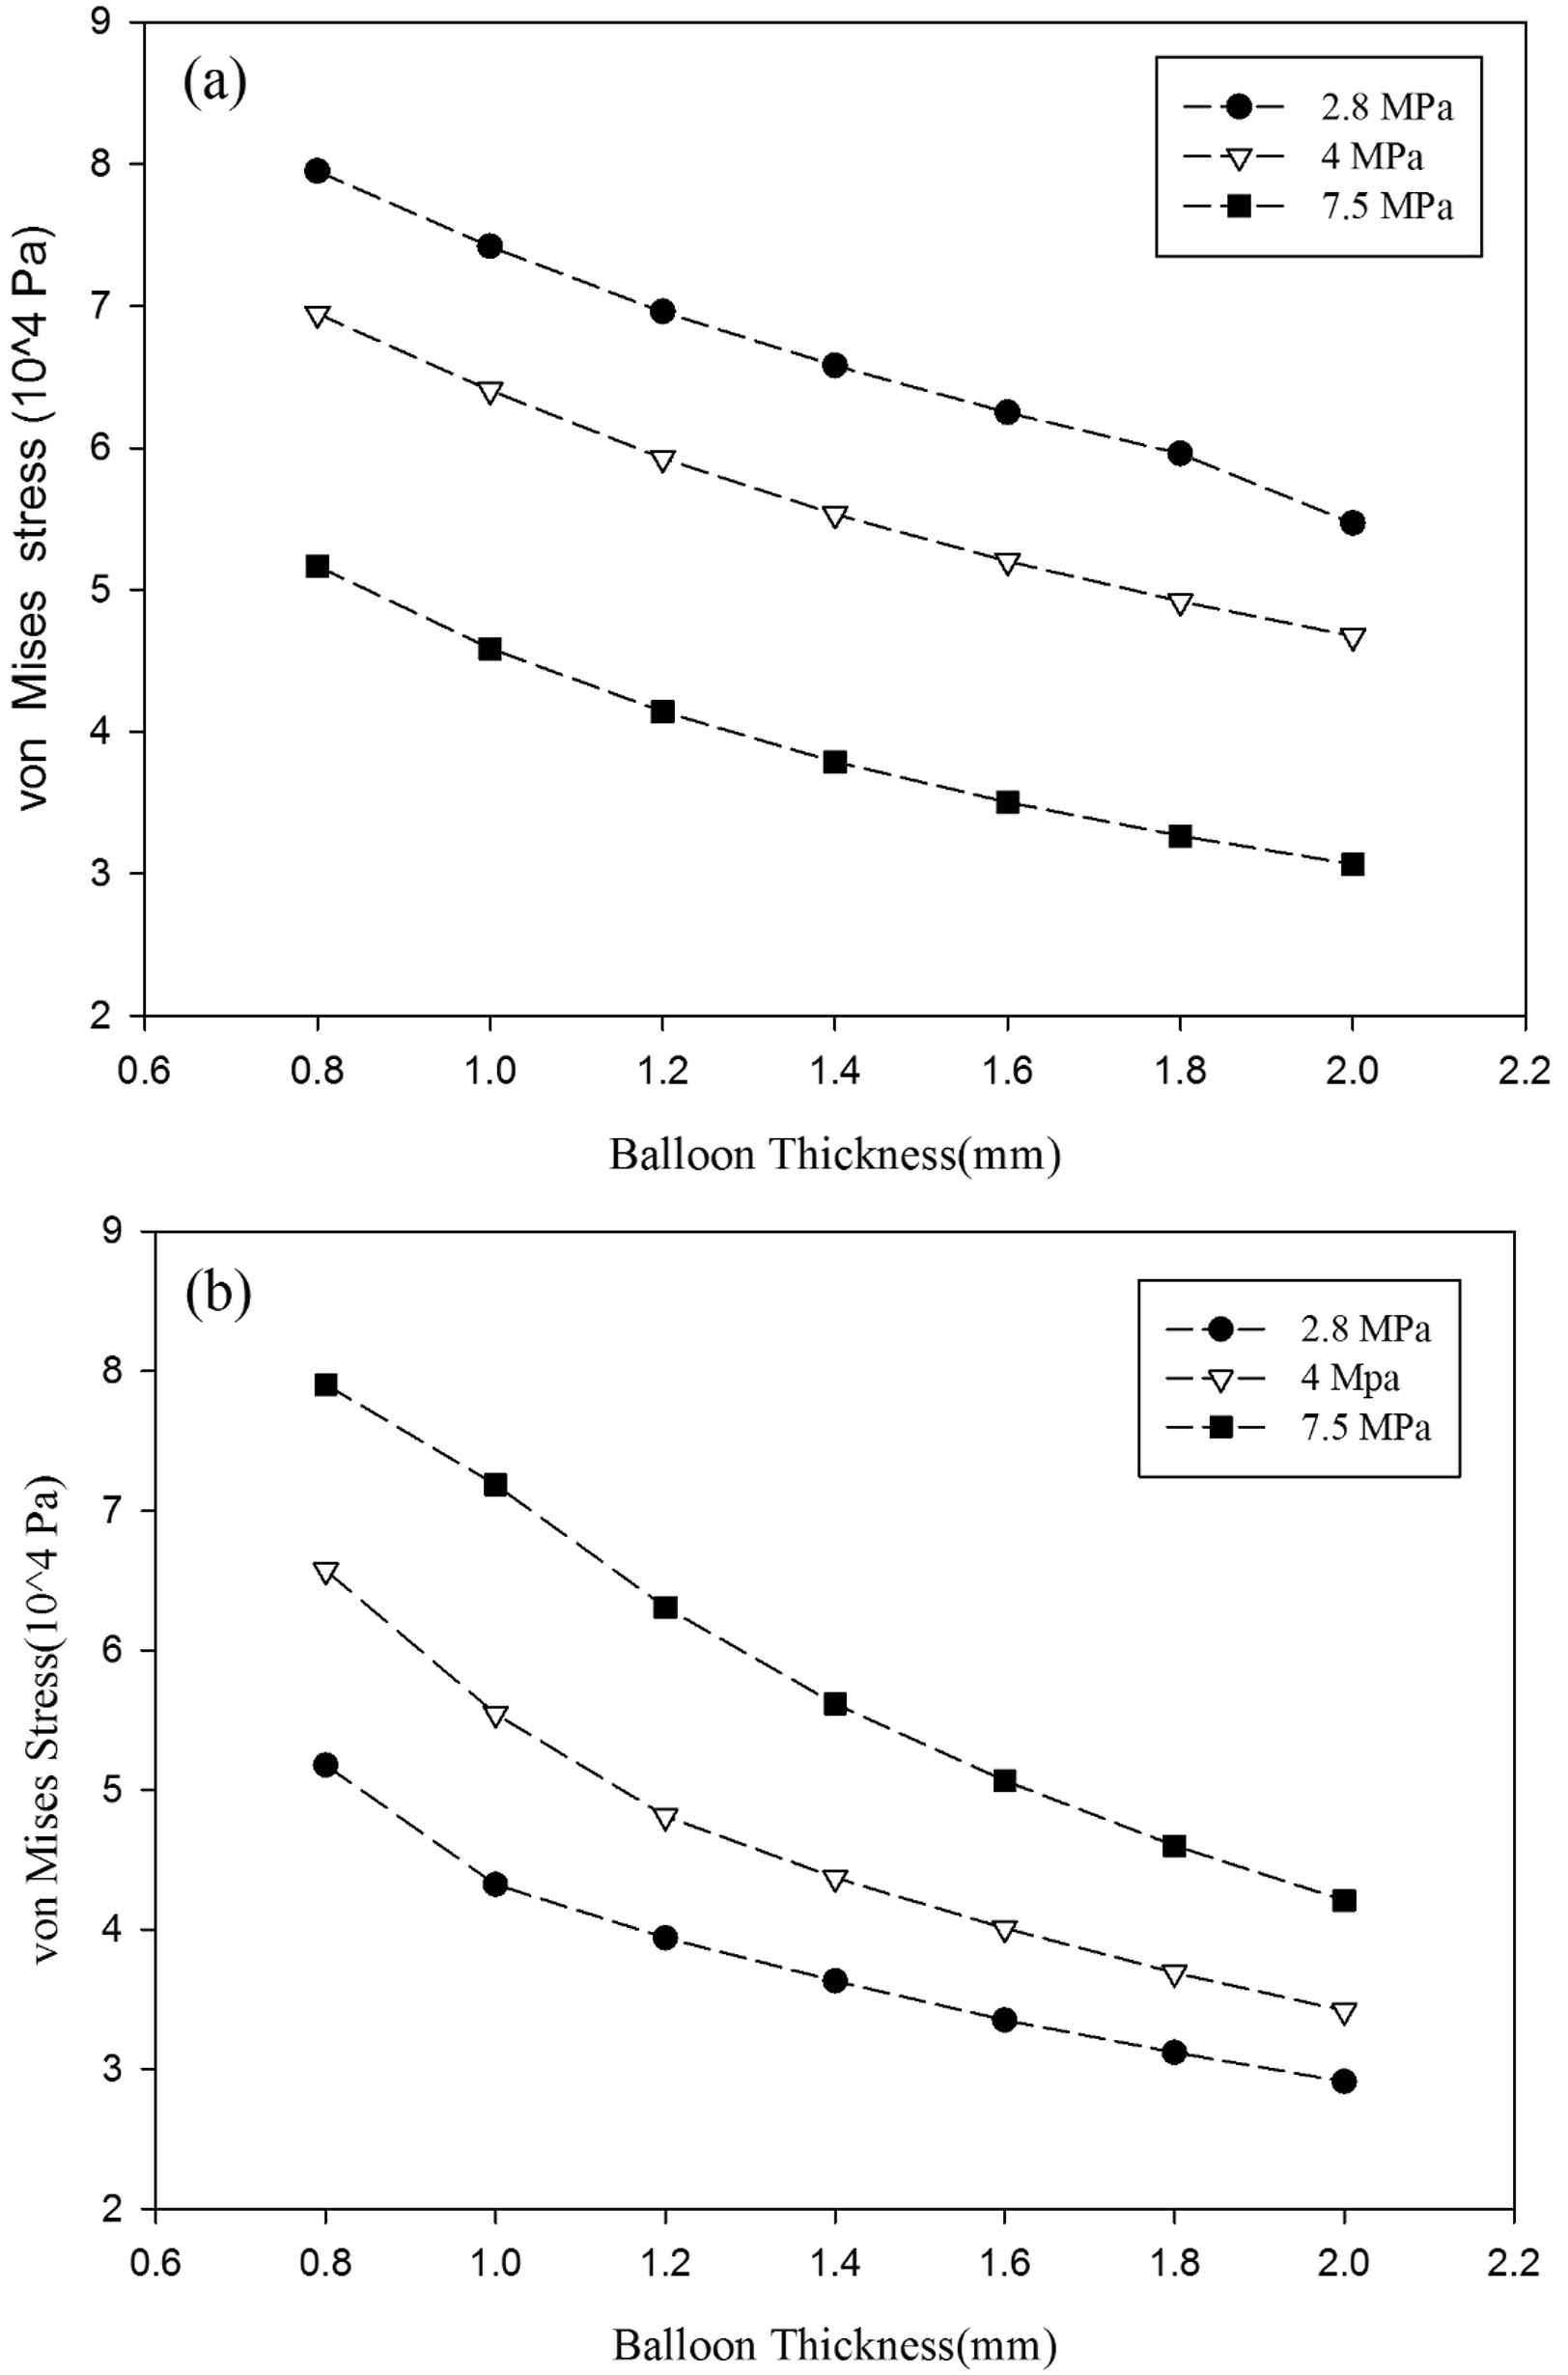
A comparison between the influence of the three balloon materials and two balloon thicknesses on the maximum von Mises stress at the time of maximum applied pressure to the balloons of three-layered and one-layered aorta models is presented in Fig. 10a and b, respectively. The maximum von Mises stress generated in the patient’s aortic wall who suffers from HF is considered as a basis for comparison. The increase of the von Mises stress depends on the mechanical properties of the balloon’s material and the balloon’s thickness. Increasing the both Young’s modulus and balloon’s thickness will reduce the von Mises stress. On the other hand, increasing these two parameters will reduce the magnitude of the blood flow velocity.
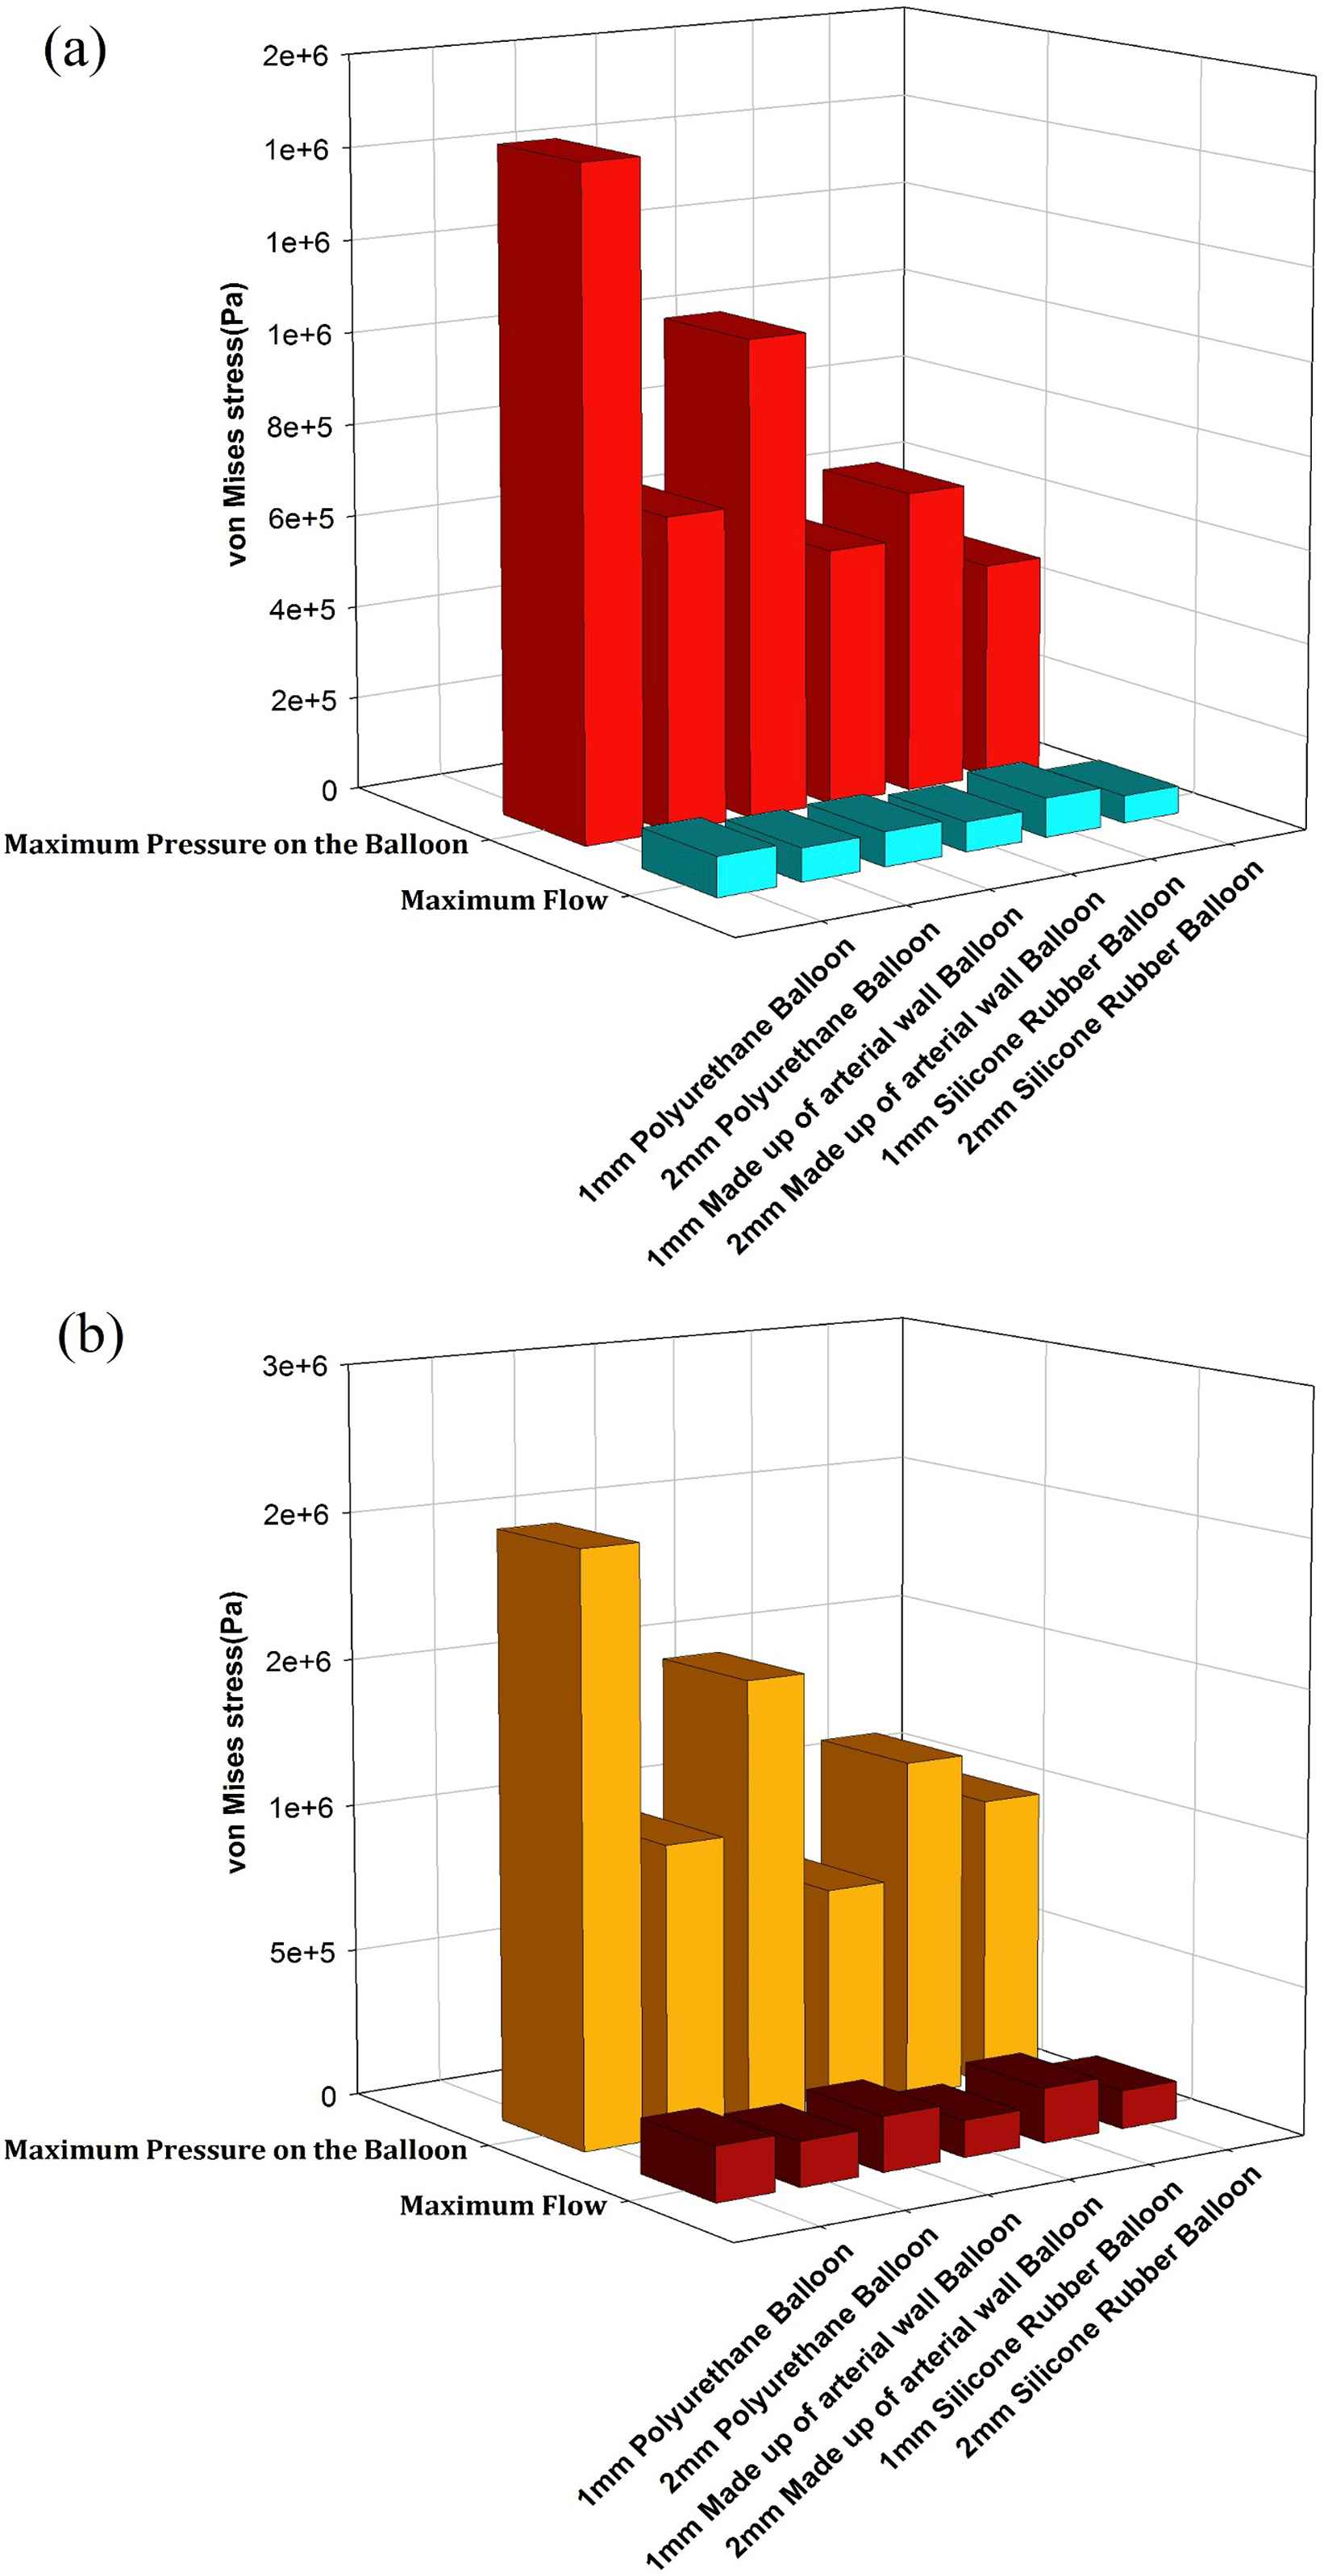
A comparison between the effects of the three balloon materials and two balloon thicknesses on maximum von Mises stress at 0.4s in (a) one-layered (b) and three-layered models.
Von Mises stress variation vs. balloon thickness in three balloon’s materials
Von Mises wall stresses on the two locations of the balloon are compared for three materials at 0.2s which is the time when the maximum blood flow enters the modeled segment of aorta. Figure 11a illustrates von Mises wall stress on the (r, z) = (0.013 mm, 0.05 mm) which is a point on the balloon adjacent to the outer layer of the aorta’s wall. Figure 11b Shows stress on the point (r, z) = (0.0138 mm, 0.05 mm) for the 0.8 mm balloon, (r, z) = (0.014 mm, 0.05 mm) for the 1 mm balloon and so on to (r, z) = (0.015 mm, 0.05 mm) for the 2 mm balloon. It can be observed that the wall stress magnitude reduces as the balloon thickens in all balloon’s materials and both locations. It may happen because of fewer balloon deformities in higher thickness which pull down the pulsatile flow influence and lead to a smaller stress magnitude. According to Fig. 11a, the Polyurethane inner balloon’s wall shear stresses are much higher than that of other materials (made of arterial wall and silicone rubber). The maximum von Mises stress in Fig. 11a is for the 0.8 mm polyurethane balloon with 0.0795 MPa. Nevertheless, in the outer layer according to Fig. 11b, the von Mises stress due to the polyurethane balloon use is the lowest one. The reason for this conflict is explained in the next part which shows von Mises wall stress distribution across the aorta’s wall and the balloon.
Von Mises stress variation on the (a) inner layer and the (b) outer layer of the balloon.
Von Mises wall stress distribution across the aorta’s wall and the balloon in three balloon’s materials
Vasoactive substances released by endothelial cells are highly influenced by wall stresses.37 Also, the morphology and orientation of the endothelial cells are sensitive to the applied shear forces.38 Therefore, it is a matter of great importance to study the aorta’s wall stresses due to the balloon implementation and the blood flow. Fig. 12a shows von Mises stress distribution across one-layered aorta’s wall and the polyurethane balloon with different thicknesses at 0.2s (when the peak flow reaches aorta’s inlet). To study stress distribution, a cutline is assumed from the innermost point of the aorta’s wall to the end point of the balloon at z = 0.05 mm. The highest von Mises wall stress magnitude occurs at the innermost layer of the aorta’s wall. At the other locations, the von Mises stress has the lower magnitude. For instance, the von Mises stress is 90.5 kPa at the innermost location of the aorta with 0.8 mm balloon, and 47.7 kPa on the outermost point of the 0.8 mm balloon. The influence of pulsatile blood flow explains this manifestation. Other hypothesized balloon thicknesses lead to the lower magnitude of von Mises stresses since thicker balloons experience less deformation and will neutralize the influence of the flow by their mechanical properties. There is a discontinuity in the Fig. 12a at the common border of the aorta’s wall and the balloon which is because of Young’s Modulus difference between aorta’s wall (4 MPa) and the polyurethane balloon (2.8 MPa). In Fig. 12b and c, von Mises wall stress distribution for the made of aorta’s wall balloon and the silicone rubber balloon is illustrated, respectively. The discontinuity is only observed in the thinner balloon in Fig. 12c due to the effect of flow on them. In the thicker balloon, the diagrams are uninterrupted as a consequence of the same Young’s Modulus of the two materials. There’s a jump in von Mises stress in Fig. 12c at the aorta and the balloon juncture owing to silicone rubber higher Young’s Modulus (7.5 MPa) than the aorta (4 MPa).
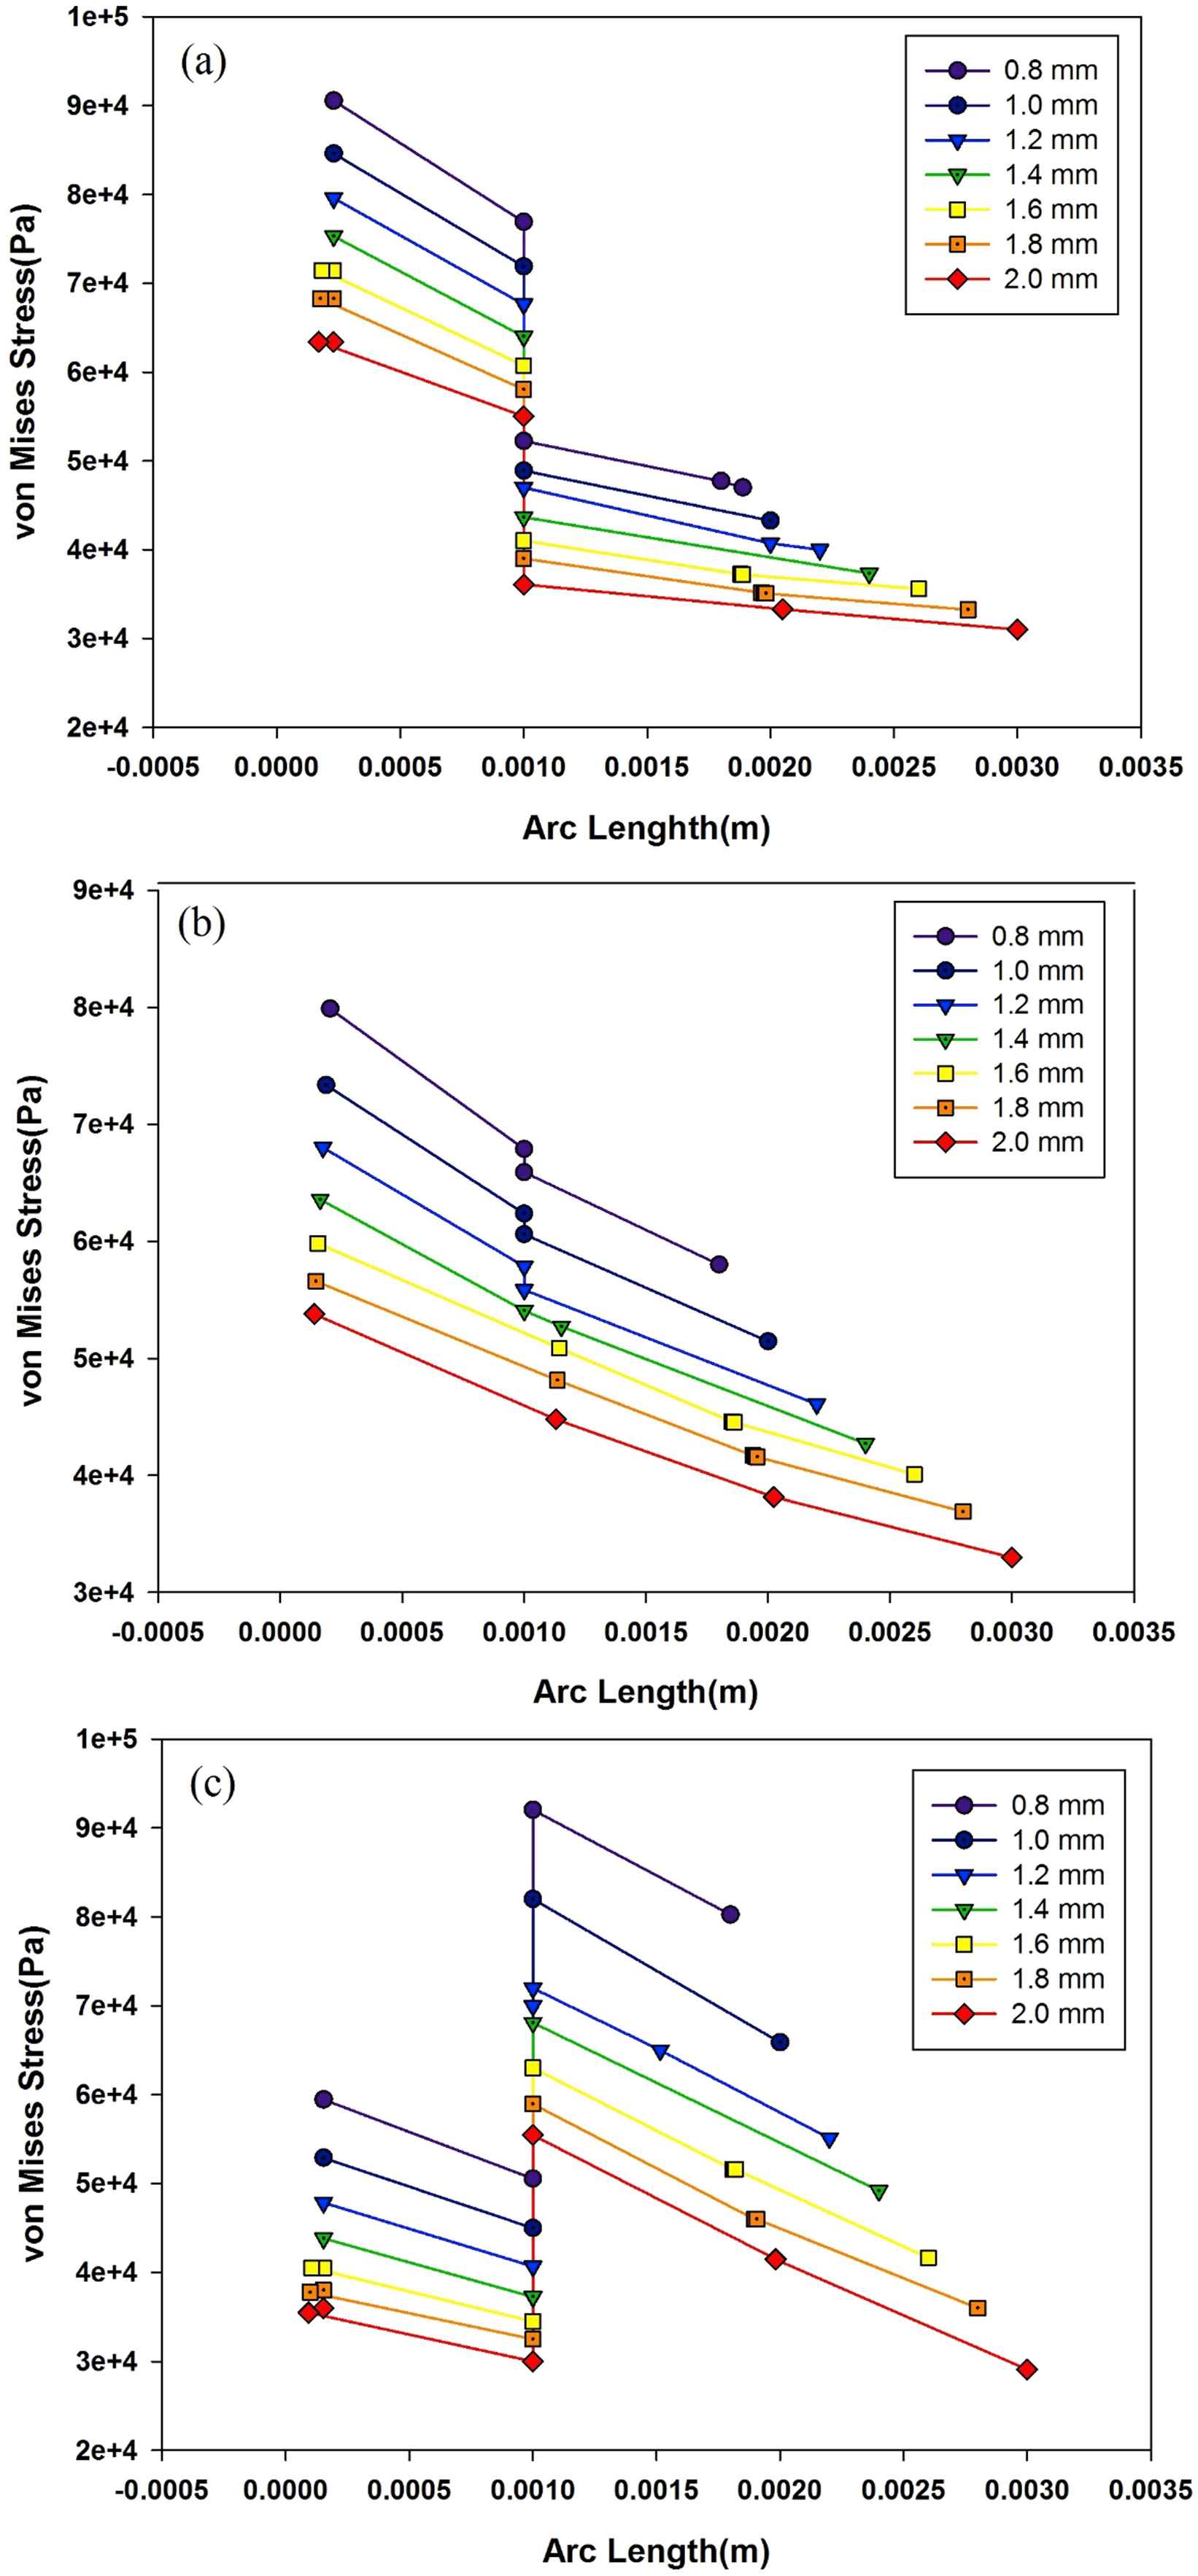
Von Mises stress distribution across (a) one-layered aorta’s wall and the polyurethane balloon (b) made of the arterial wall balloon(c) made of silicone rubber balloon at peak flow in seven thicknesses.
Figure 13 shows the von Mises distribution across aorta’s three-layered model and the polyurethane balloon in different thicknesses. Using three-layered aorta model, there will be three discontinuities in the diagrams. They happen at the juncture of the intima layer and the media layer, the media layer and the adventitia layer and the adventitia layer and the balloon. It has been stated in the literature that non-homogeneous wall properties will lead to such stress variation.21 Between different layers, linear decrease in stress distribution is visible like those observed in one-layered models. There have been studies investigating aorta dissection.17,28 In many of them, dissection is predicted to happen at the interface layer of intima and media layer own to media’s high Young’s Modulus. For the media layer, the incline of linear decrease between layers is steeper than other locations. As it was shown in one-layered models, the 2 mm balloon leads to the lower magnitudes of von Mises stress comparing to other thicknesses. One-layered models predicted the maximum wall shear stresses on the innermost layer of aorta’s wall in each thickness. However, by using three-layered models, the maximum point is shifted to the juncture of intima and media layers. Therefore, in evaluating the exact location of the peak von Mises stress on each line across the aorta’s wall and the balloon using three-layered aorta model is crucial.
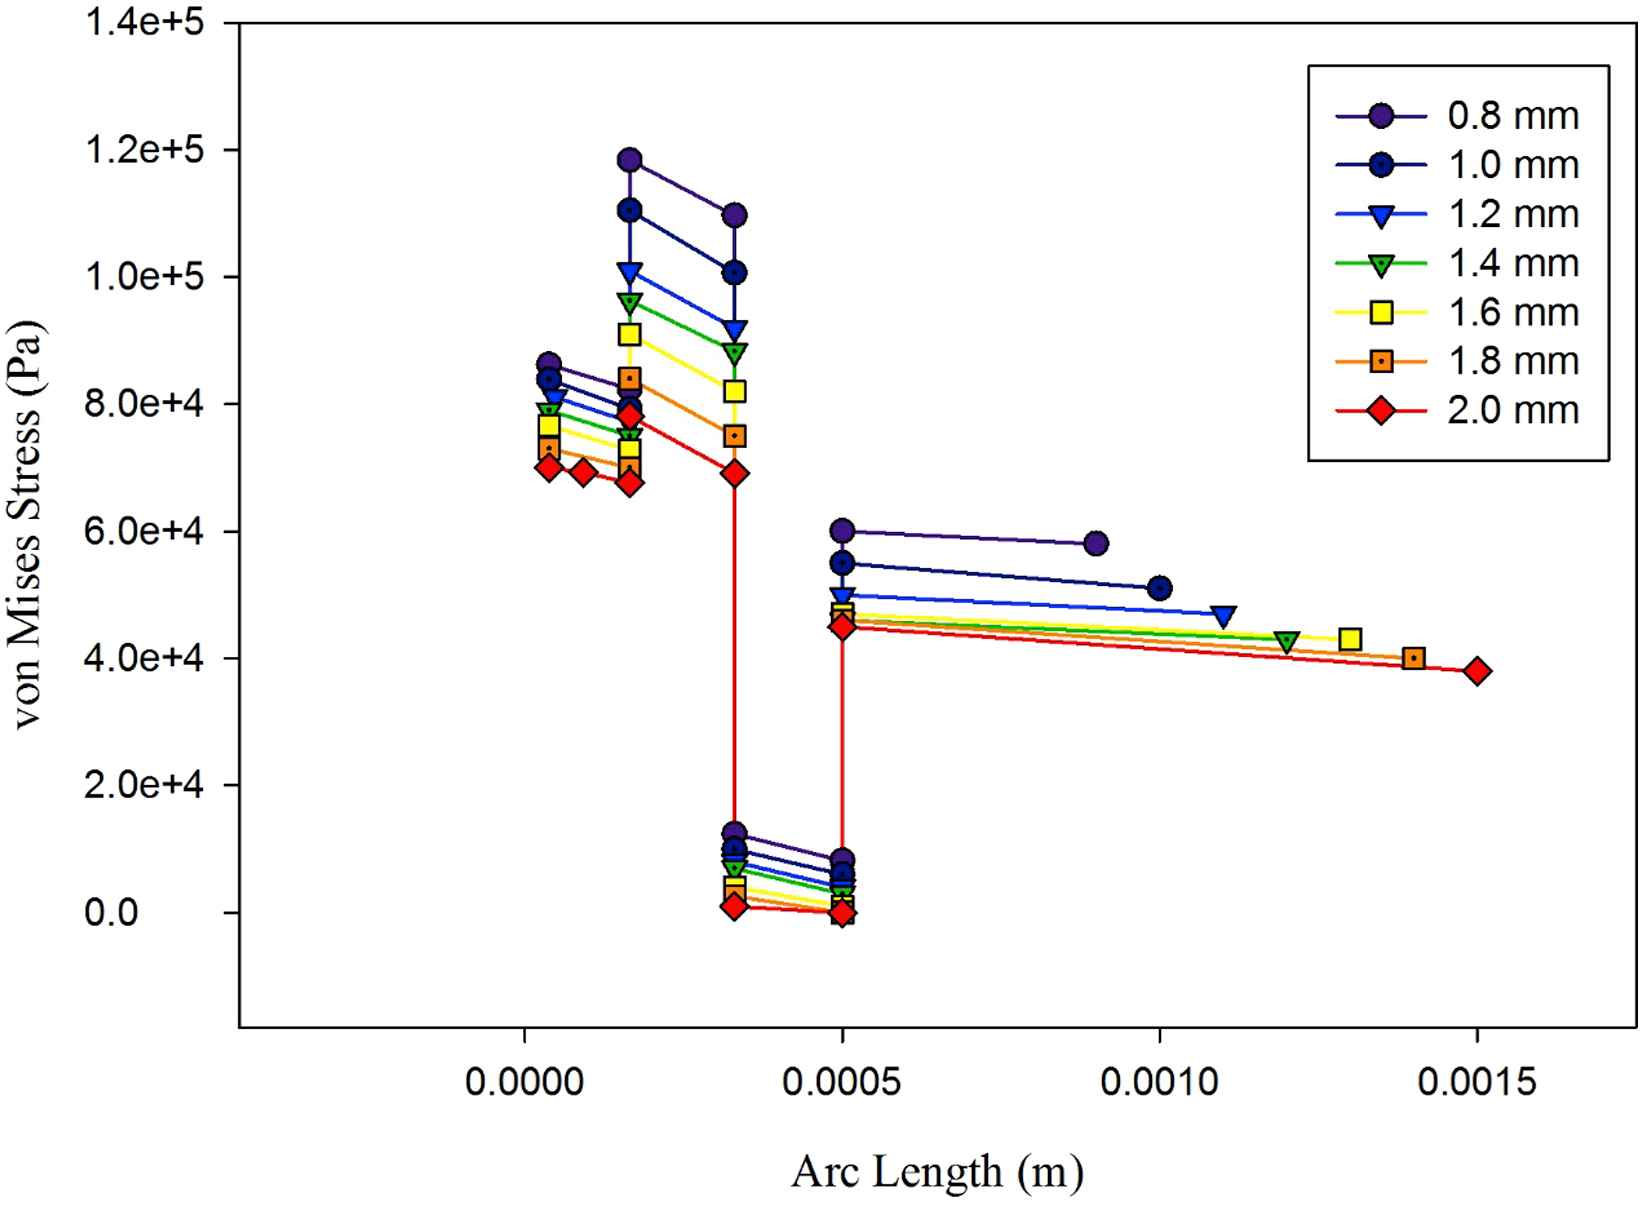
Von Mises distribution across aorta’s three-layered aorta’s wall and the polyurethane balloon in seven thicknesses.
Limitations
It needs to mention as limitations of this study that the model of the conceptualized cardiac assist device is not clinically feasible and viable. The device was considered as a circular device around the descending aorta and the axisymmetry was assumed. It cannot be implanted unless the aorta is cut and sutured. The original concept in the cited reference was based on two semi-circle balloon. However, this study can roughly be an approximation of the performance of this device. The actual model which has been mentioned in the US patent is composed of two semi-cylindrical balloons surrounding the aorta. This study assumed that these two balloons may act as one balloon. Upon this, it has been modeled as a 2D axisymmetric prototype in this study. The authors state that in order to have more accurate results and close to the reality, the device should be modeled three-dimensionally. The descending aorta is not really axisymmetric. However, this study assumed the assumption of axisymmetric.
The entire model of the aorta is wrapped around by the balloon pump from top to bottom of the model. This may cause so-called Saint-Venant effect on both ends resulting in high-stress concentration (which is not realistic) on both ends. The entire simulations should be redone with a sufficiently long model of aorta only partially covered by the pump.
Conclusion
This study was performed to numerically analyze the fluid flow and aortic wall mechanics in the aorta assisted by a conceptualized cardiac assist device by using FSI for device design consideration. A cardiac assist device with an extra-aortic counterpulsation balloon which is surrounding the aorta was conceptually considered. A simple 2D axisymmetric model of the aorta assisted with the conceptualized cardiac assist device was modeled. The influences of two structural models of the aorta (single layer and three layers), three materials (polyurethane, made of the arterial wall, and silicone rubber) and their thickness for the balloon on the flow field and stresses in the assisted aorta were numerically investigated. ALE formulation was used in the FSI during the analysis.
The flow field in the aorta and the stresses in the aortic wall and balloon wall were simulated for various combinations of aorta model with different materials and thickness of the balloon. Using different balloon’s material and thicknesses the escalation in mentioned parameters can be controlled. By using materials with lower Young’s modulus and thinner balloons, the magnitudes of the von Mises stress will reduce. At the same time, the magnitude of the blood flow velocity reduces which is undesirable. Therefore, in designing this cardiac assist device a balance must be made between these two parameters by changing the balloon’s material and its thickness. In studying velocity and stress during this device use, both one-layered and three-layered aorta models have been implemented. There were similarities in the results including the assessment of the maximum von Mises stress location, but the three-layered model evaluated the magnitudes of the stress higher than the one-layer model. The distribution of the von Mises stress is studied at the time of entering the maximum flow to the aorta when using the current device. There are discontinuities in the stress distribution across the aorta’s wall and the balloon due to the change in mechanical properties of different layers of aorta model and the balloon in the three-layered model. When Young’s modulus of the next layer is higher, there will be a jump in the stress distribution and vice versa. With one-layered aorta model, the maximum von Mises stress occurs at the innermost layer of the aorta’s wall on each of the cutlines, but using three-layered aorta model the location of the maximum stress across the aorta wall and the balloon is shifted to the juncture of the intima layer and the media layer.
Funding
This study was supported partially by
Conflict of interest
Shahrokh Rahmani declares that he has no conflict of interest. Mehrnaz Oveysi declares that he has no conflict of interest. Alireza Heidari declares that he has no conflict of interest. Mahdi Navidbakhsh declares that he has no conflict of interest. Mansour Alizadeh declares that he has no conflict of interest.
Ethical approval
This article does not contain any studies with animals or human participants performed by any of the authors.
Appendix A
Supplementary data
Supplementary data related to this article can be found at
References
Cite this article
TY  - JOUR
AU  - Shahrokh Rahmani
AU  - Mehrnaz Oveysi
AU  - Alireza Heidari
AU  - Mahdi Navidbakhsh
AU  - Mansour Alizadeh
PY  - 2018
DA  - 2018/03/20
TI  - Numerical modeling of a prototype cardiac assist device by implementing fluid-structure interaction
JO  - Artery Research
SP  - 24
EP  - 35
VL  - 22
IS  - C
SN  - 1876-4401
UR  - https://doi.org/10.1016/j.artres.2018.01.002
DO  - 10.1016/j.artres.2018.01.002
ID  - Rahmani2018
ER  -