
Stiff vessels approached in a flexible way: Advancing quantification and interpretation of arterial stiffness☆
Review linked to Career Development Lecture at the Artery 17 conference in Pisa, Italy (12–14 October 2017)
- DOI
- 10.1016/j.artres.2017.11.006How to use a DOI?
- Keywords
- Pulse wave velocity; Blood pressure correction; Constitutive modelling
- Abstract
Introduction: Although pulse wave velocity (PWV), a proxy of arterial stiffness, is a strong predictor of cardiovascular complications, it is confounded by blood pressure (BP) and heart rate at the time of examination. Furthermore, establishing whether an artery behaves stiffer or less stiff does not inform a clinician on the cause of the stiffening.
Quantification of arterial stiffness: This paper focuses on BP as a confounder of PWV. We developed a method to patient-specifically determine the dependence of PWV on BP — on average 1 m/s per 10 mmHg diastolic BP — and used it to disentangle BP-dependent and -independent stiffening in hypertension and cancer patients. We furthermore showed that the so-called cardio-ankle vascular index (CAVI) — a measure deemed BP-independent — shows a residual BP-dependence that is readily correctable using a modified equation (CAVI0). Both developed methods are directly applicable to clinical measurements in individual patients.
Interpretation of arterial stiffness: We developed a computer modelling procedure to disentangle contributions of the individual wall components — collagen, elastin, and smooth muscle — to arterial stiffening as observed in patients. Our model-based approach shows that with ageing, the biomechanical phenotype shifts from elastin-dominated to collagen-dominated load bearing.
Model-based assessment of arterial wall mechanics provides a promising tool to further improve interpretation of arterial stiffness measurements in patients. Further development of such methodology applied to various mouse models may improve the understanding and interpretation of arterial stiffening in ageing and disease.
- Copyright
- © 2017 Association for Research into Arterial Structure and Physiology. Published by Elsevier B.V. All rights reserved.
- Open Access
- This is an open access article distributed under the CC BY-NC license.
Introduction
With each heartbeat, the heart ejects its stroke volume into the large arteries. If these are compliant, they store this temporary excess blood volume and its associated energy during systole, and release it during diastole. However, if the arteries are stiff — e.g., because a person has diabetes or is very old — this storage function is lost,1 which implies that more work is required from the heart to maintain its output.
Clinically, arterial stiffness is most often quantified by measuring pulse wave velocity (PWV): the velocity with which the pulse wave that is generated by the heart, propagates along the large arteries.2 If these arteries are compliant PWV is low (4–6 m/s), but if they are stiffened PWV will be increased (8–12 m/s).
Two types of PWV measurement can be distinguished: transit time PWV and local PWV.3 Transit time PWV (Fig. 1A) is obtained by measuring blood pressure at two different sites: proximally, typically at the carotid artery, and distally, typically at the femoral artery. One can then quantify the time difference of wave arrival at these sites. Dividing the distance between the sitesd by this time difference yields an estimate of regional PWV. Local PWV (Fig. 1B) is mostly obtained by measuring arterial pressure as well as diameter at the same site, which are then converted into PWV using the Bramwell–Hill equation (Fig. 1, legend).8
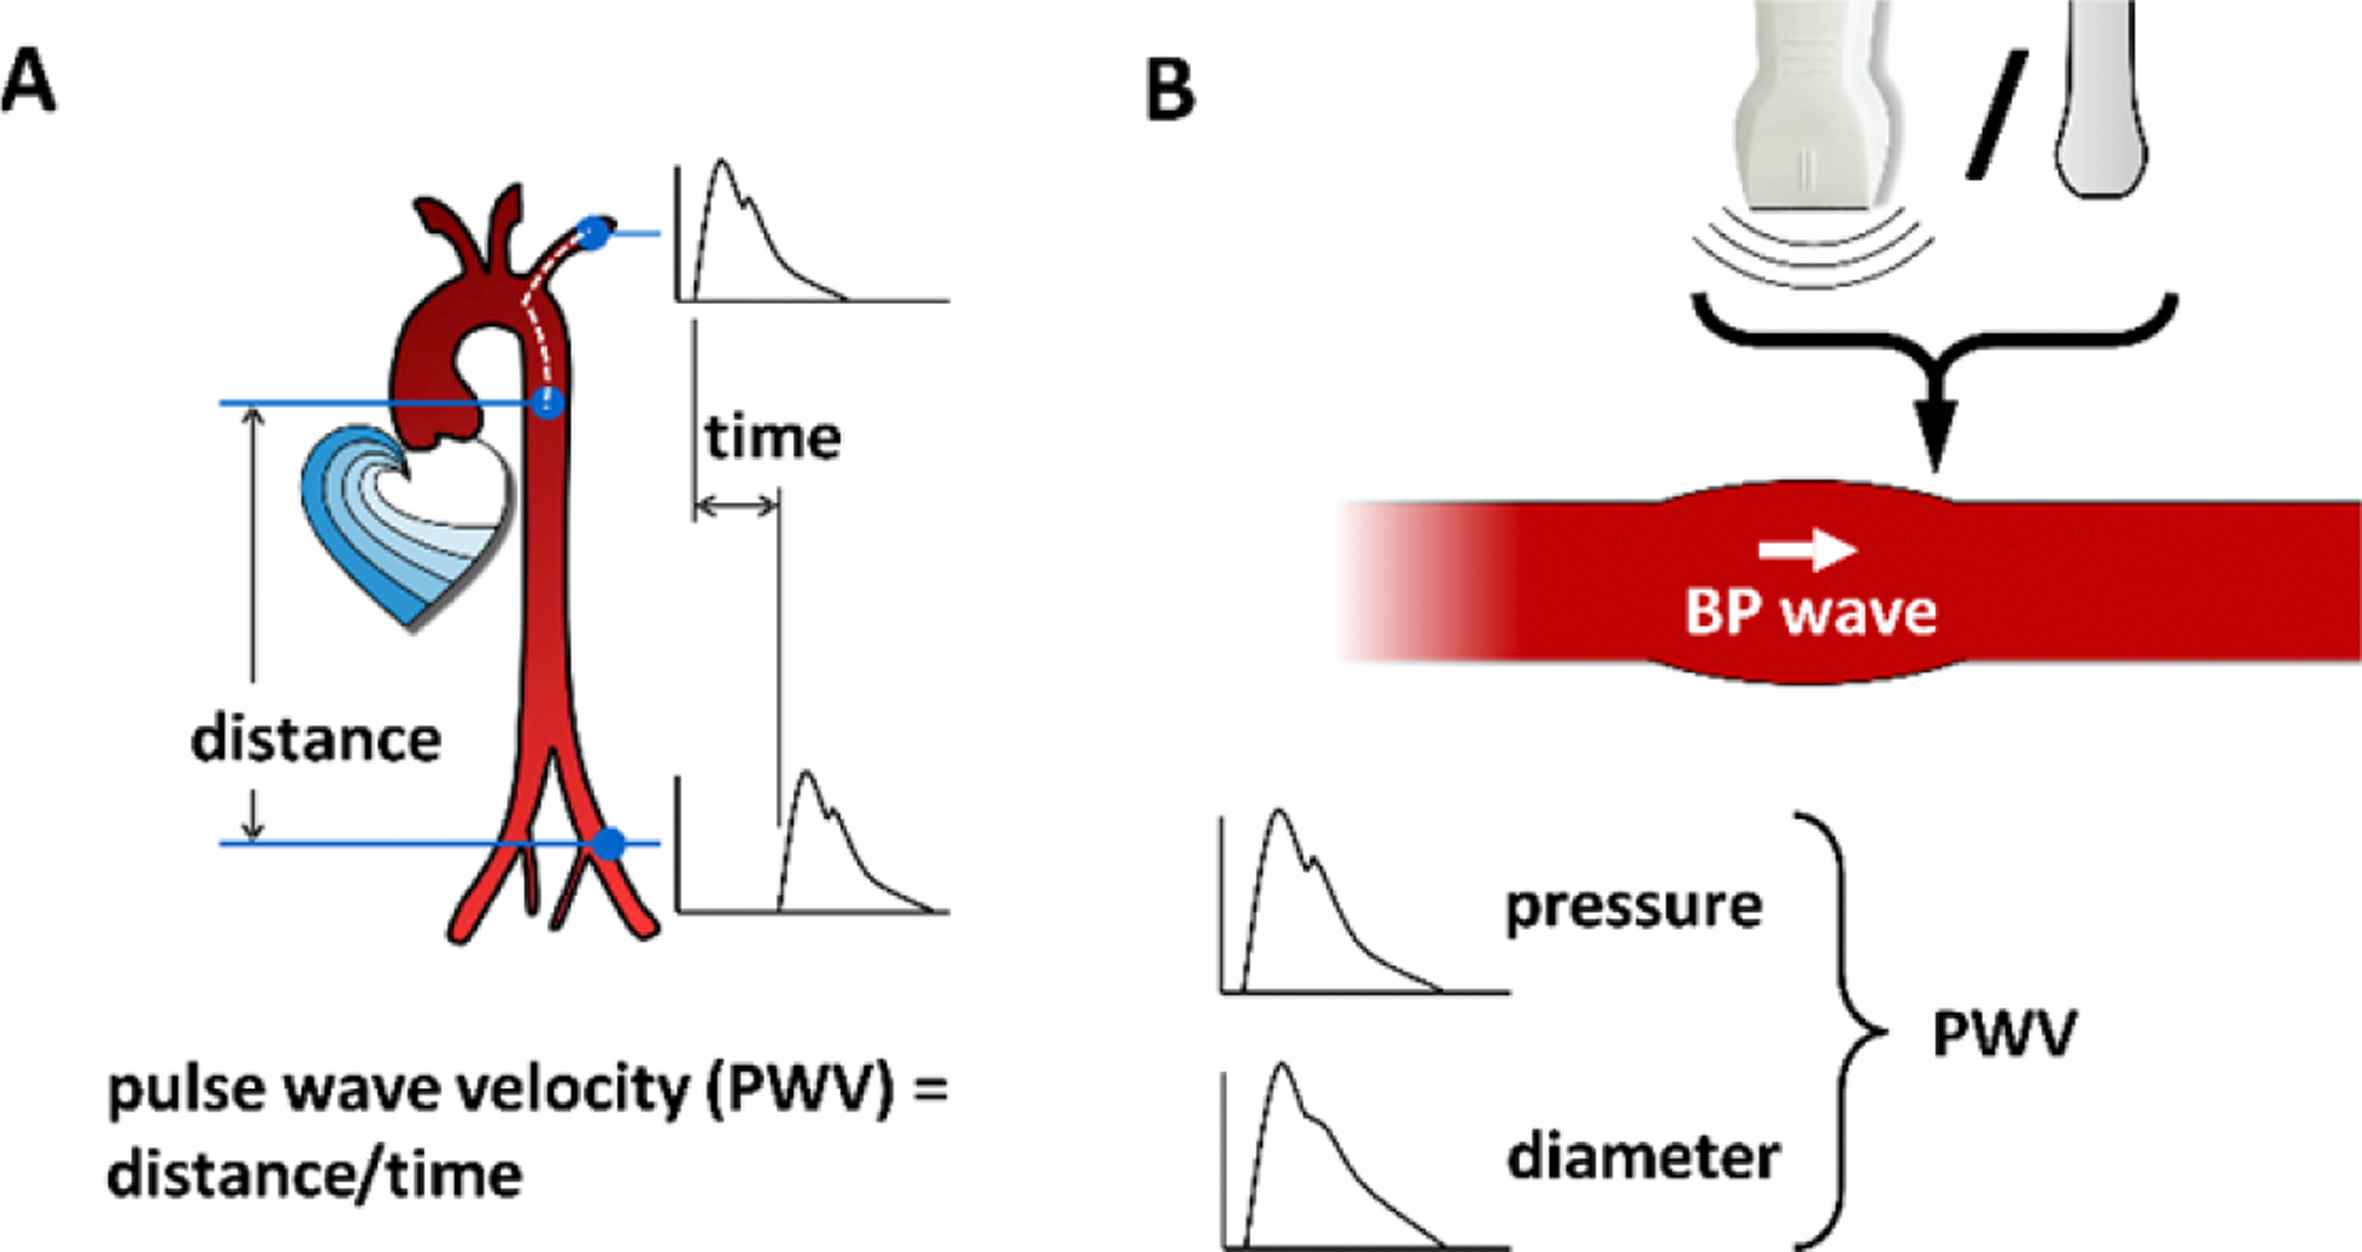
PWV measurement methods. A: Transit time pulse wave velocity involves measuring the time difference between arrival of the blood pressure wave at two measurement sites along the arterial tree as well as the distance between these sites. PWV is then calculated as distance divided by time difference. B: Local PWV involves measuring systolic and diastolic pressure (typically using applanation tonometry) and diameter (typically using ultrasonic wall tracking) at the same measurement site (e.g., the carotid artery). PWV is subsequently calculated using the Bramwell–Hill equation:
Quantification of arterial stiffness
PWV as a measure of arterial stiffness is confounded by blood pressure9–11 and heart rate12,13 at the time of measurement. In addition, local PWV measurement may be confounded by head orientation during ultrasonography.14 This paper will focus on blood pressure as a confounder of PWV.
PWV increases with blood pressure10 because intrinsic (material) wall stiffness increases with pressure.e,17 The importance of this pressure dependence is illustrated by the white coat effect — the phenomenon that in some patients, in-clinic blood pressure is much higher than out-of-clinic blood pressure.18 This increased in-clinic blood pressure also causes an (artificially) increased in-clinic PWV, which is unrelated to intrinsic arterial stiffening.
The blood pressure dependence of PWV can be handled in two ways: statistically as well as “mechanics model based”.19 Statistical correction has the disadvantage that it is only applicable in a cohort of patients, whereas a model-based approach is applicable to individual patient data. Model-based approaches can be subdivided into 1) correcting for the pressure influence, yielding a pressure-corrected PWV in e.g., metres per second, or 2) using pressure-independent indices, which are generally dimensionless.
Correcting for the blood pressure influence on pulse wave velocity
Model-based correction is based on the relationship between arterial pressure and diameter (Fig. 2A). This relationship is approximately exponential.20,21 The slope of this relationship is a measure of the stiffness of the artery, and is related to the PWV. Using a PWV and a diastolic blood pressure (DBP) and systolic blood pressure (SBP) measurement, this relationship can be characterised. Subsequently, using this relationship, the PWV fluctuation that is solely due to pressure can be predicted.9
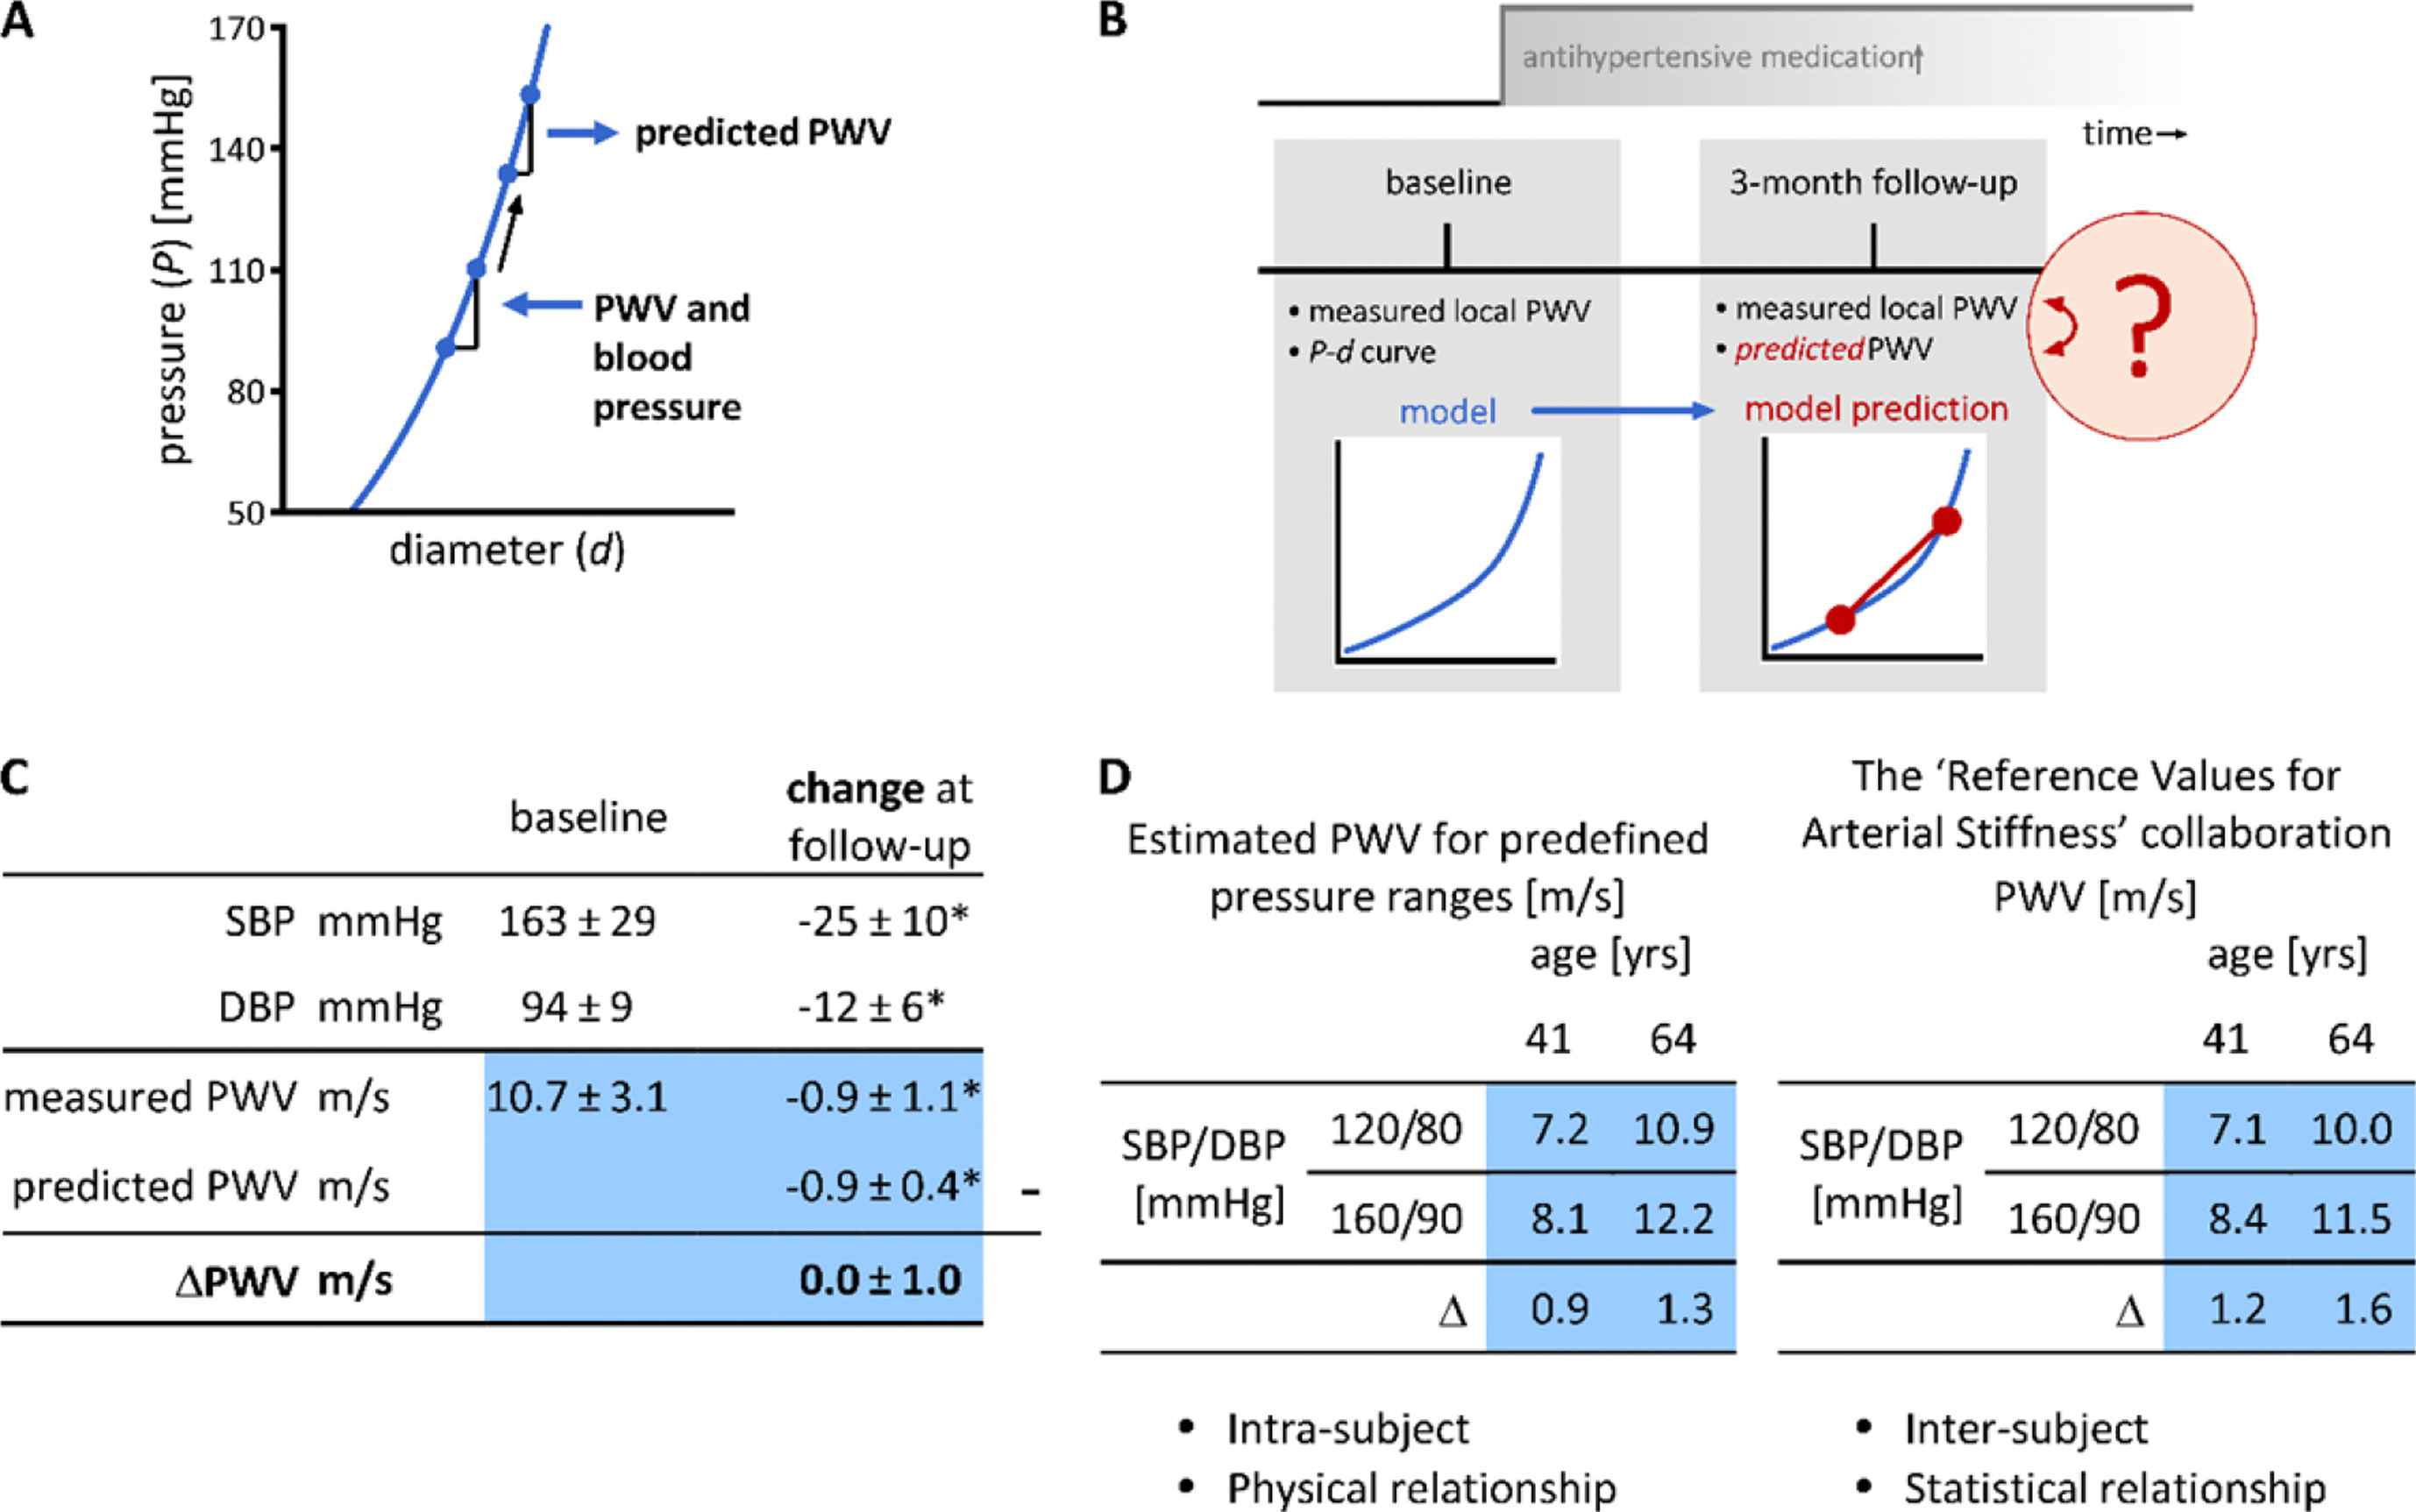
Study of pressure dependent and -independent effects of antihypertensive medication on PWV.9 A: Using a pulse wave velocity (PWV), systolic blood pressure (SBP), and diastolic blood pressure (DBP) measurement, one can parameterise an exponential curve between pressure and diameter. Using this P-d curve, the change in PWV given a change in blood pressure (here an increase is exemplified) can be predicted. B: The technique in panel A was used to predict the pressure-induced change in PWV after 3 months of follow-up. Subsequently, by comparing this predicted PWV to the measured PWV, one can infer whether or not the arterial wall changed intrinsically. C: Study results (mean ± SD), showing that the measured PWV change at follow-up was equal to the predicted PWV change, implying that intrinsically, the artery wall did not stiffen. SD, standard deviation; *p < 0.05, Wilcoxon signed-rank test. D: PWV, blood pressure and age patterns of our study9 (left) and the ‘Reference Values for Arterial Stiffness’ Collaboration study22 are strikingly similar. PWV is shown for the mean ages of two age groups in our study and predefined normotensive (120/80 mmHg) and hypertensive (160/90 mmHg) pressure ranges. Δ: difference in PWV between hypertensive and normotensive conditions.
We used this technique to quantify the pressure-independent effect of anti-hypertensive medication on local PWV (Fig. 2B).9 Our approach was to measure pressure and diameter in hypertension patients at baseline, when their medication was temporarily discontinued. Using these data, we obtained an estimate of local PWV, but also a model of the pressure–diameter relationship. After baseline measurements, medication was reinstalled or changed. At 3-month follow-up, we again measured local PWV and, additionally, we also used the baseline model, together with follow-up blood pressures to predict PWV, under the assumption that the pressure–diameter model had remained unchanged. We then compared the measured PWV at follow-up to the predicted PWV. Being equal this would imply that the artery’s intrinsic stiffness remained unchanged, whereas any difference would imply intrinsic changes in stiffness, not explained by pressure dependence.
Figure 2C summarises the results of this study. At baseline, subjects were hypertensive, and showed a PWV of 10.7 m/s. At follow-up, blood pressures decreased, as did measured PWV. However, the predicted change in PWV was equal to the measured change, implying that intrinsically, the arteries of these subjects had not stiffened. Furthermore, this study taught us that on average, PWV decreases by 1 m/s per 10 mmHg of DBP decrease — a quantity that can be used as a first-order rule of thumb.
We further split our study population in a young and an old group. Using the modelled pressure–diameter curves, we calculated PWV for fixed normotensive and hypertensive pressure ranges. Figure 2D shows these PWVs and shows that with age, PWV gets higher, but nonlinearity also gets higher.
PWVs for normotensive and hypertensive blood pressure ranges can also be calculated from the reference values for arterial stiffness study.22 However, there are two key differences between these studies. First, the blood pressure dependence in our study is based on intra-subject blood pressure differences, whereas in the reference values study it is based on inter-subject differences. Second, our study is based on physical (pressure–diameter) relationships, whereas the reference values study is based on statistical relationships. Despite these differences, the patterns are very similar, which implies that the blood pressure pattern of PWV in the reference values study is largely explicable from the intrinsic blood pressure dependence of PWV. The slightly larger PWV increase with blood pressure in the reference values study may be explained from hypertension-induced arterial remodelling.
Our PWV prediction technique was not only used to assess hypertensive patients, but also to assess arterial stiffness in cancer patients on anti-angiogenic treatment.19 Side effects of this treatment include hypertension and an increased PWV. We used our technique to assess whether the increased PWV reflected intrinsic wall stiffening. Again, local, carotid PWV was used as a stiffness measure. At baseline, the population studied was normotensive (SBP/DBP 117/73 mmHg) and showed a measured PWV of 6.8 m/s. With treatment, blood pressure increased significantly (+9 mmHg SBP and +6 mmHg DBP), as did measured PWV (+0.8 m/s). However, predicted PWV increased by only 0.4 m/s implying that the arteries did stiffen intrinsically in this study (p = 0.014). This stiffening may be explained by vasoconstriction, interaction with integrins, or deletion of the vasa vasorum due to the angiogenic treatment.23 Our prediction approach was also used to assess the diastolic cross-sectional area increase in this study. This measure also showed a pressure-independent increase in this cohort (measured: +2.7 mm2, predicted +1.9 mm2, p < 0.001).19
Pressure-independent indices of arterial stiffness
Model-based techniques can be used to correct for the pressure influence, but they can also be used to derive intrinsically pressure-independent indices of arterial stiffness. Two of such indices deemed pressure-independent are cardio-ankle vascular index (CAVI), which is based on transit-time PWV measurements, and stiffness index β, which is used for local PWV measurements.24,25 Both indices aim to estimate the exponent of the pressure–diameter relationship. However, I critically assessed the practical implementation of these indices and identified that these indices still show a residual/theoretical pressure dependence.26 Subsequently, we have proposed two corrected indices CAVI0 and β0,26 and derived equations to directly estimate CAVI0 values from current/existing CAVI measurements as provided by the Fukuda Denshi (VaSera) CAVI machine.27
The two factors causing the residual theoretical pressure dependence of CAVI and β are briefly defined as follows. Hayashi et al. showed that intrinsically, arteries show a pressure–diameter relationship as follows20:
However, stiffness index β as regularly estimated uses a modified equation, wherein the (fixed) reference pressure is substituted with (variable) diastolic blood pressure:
The magnitude of the blood pressure dependence of CAVI is illustrated in Fig. 3. Panel A illustrates that β depends on DBP; panel B shows that CAVI depends on both DBP and SBP. Panels C and D illustrate that the blood pressure dependence of β0 and CAVI0, on a theoretical basis, is absent. It is important to note that the corrected equations (β0 and CAVI0) remain easy to use and are clinically applicable.
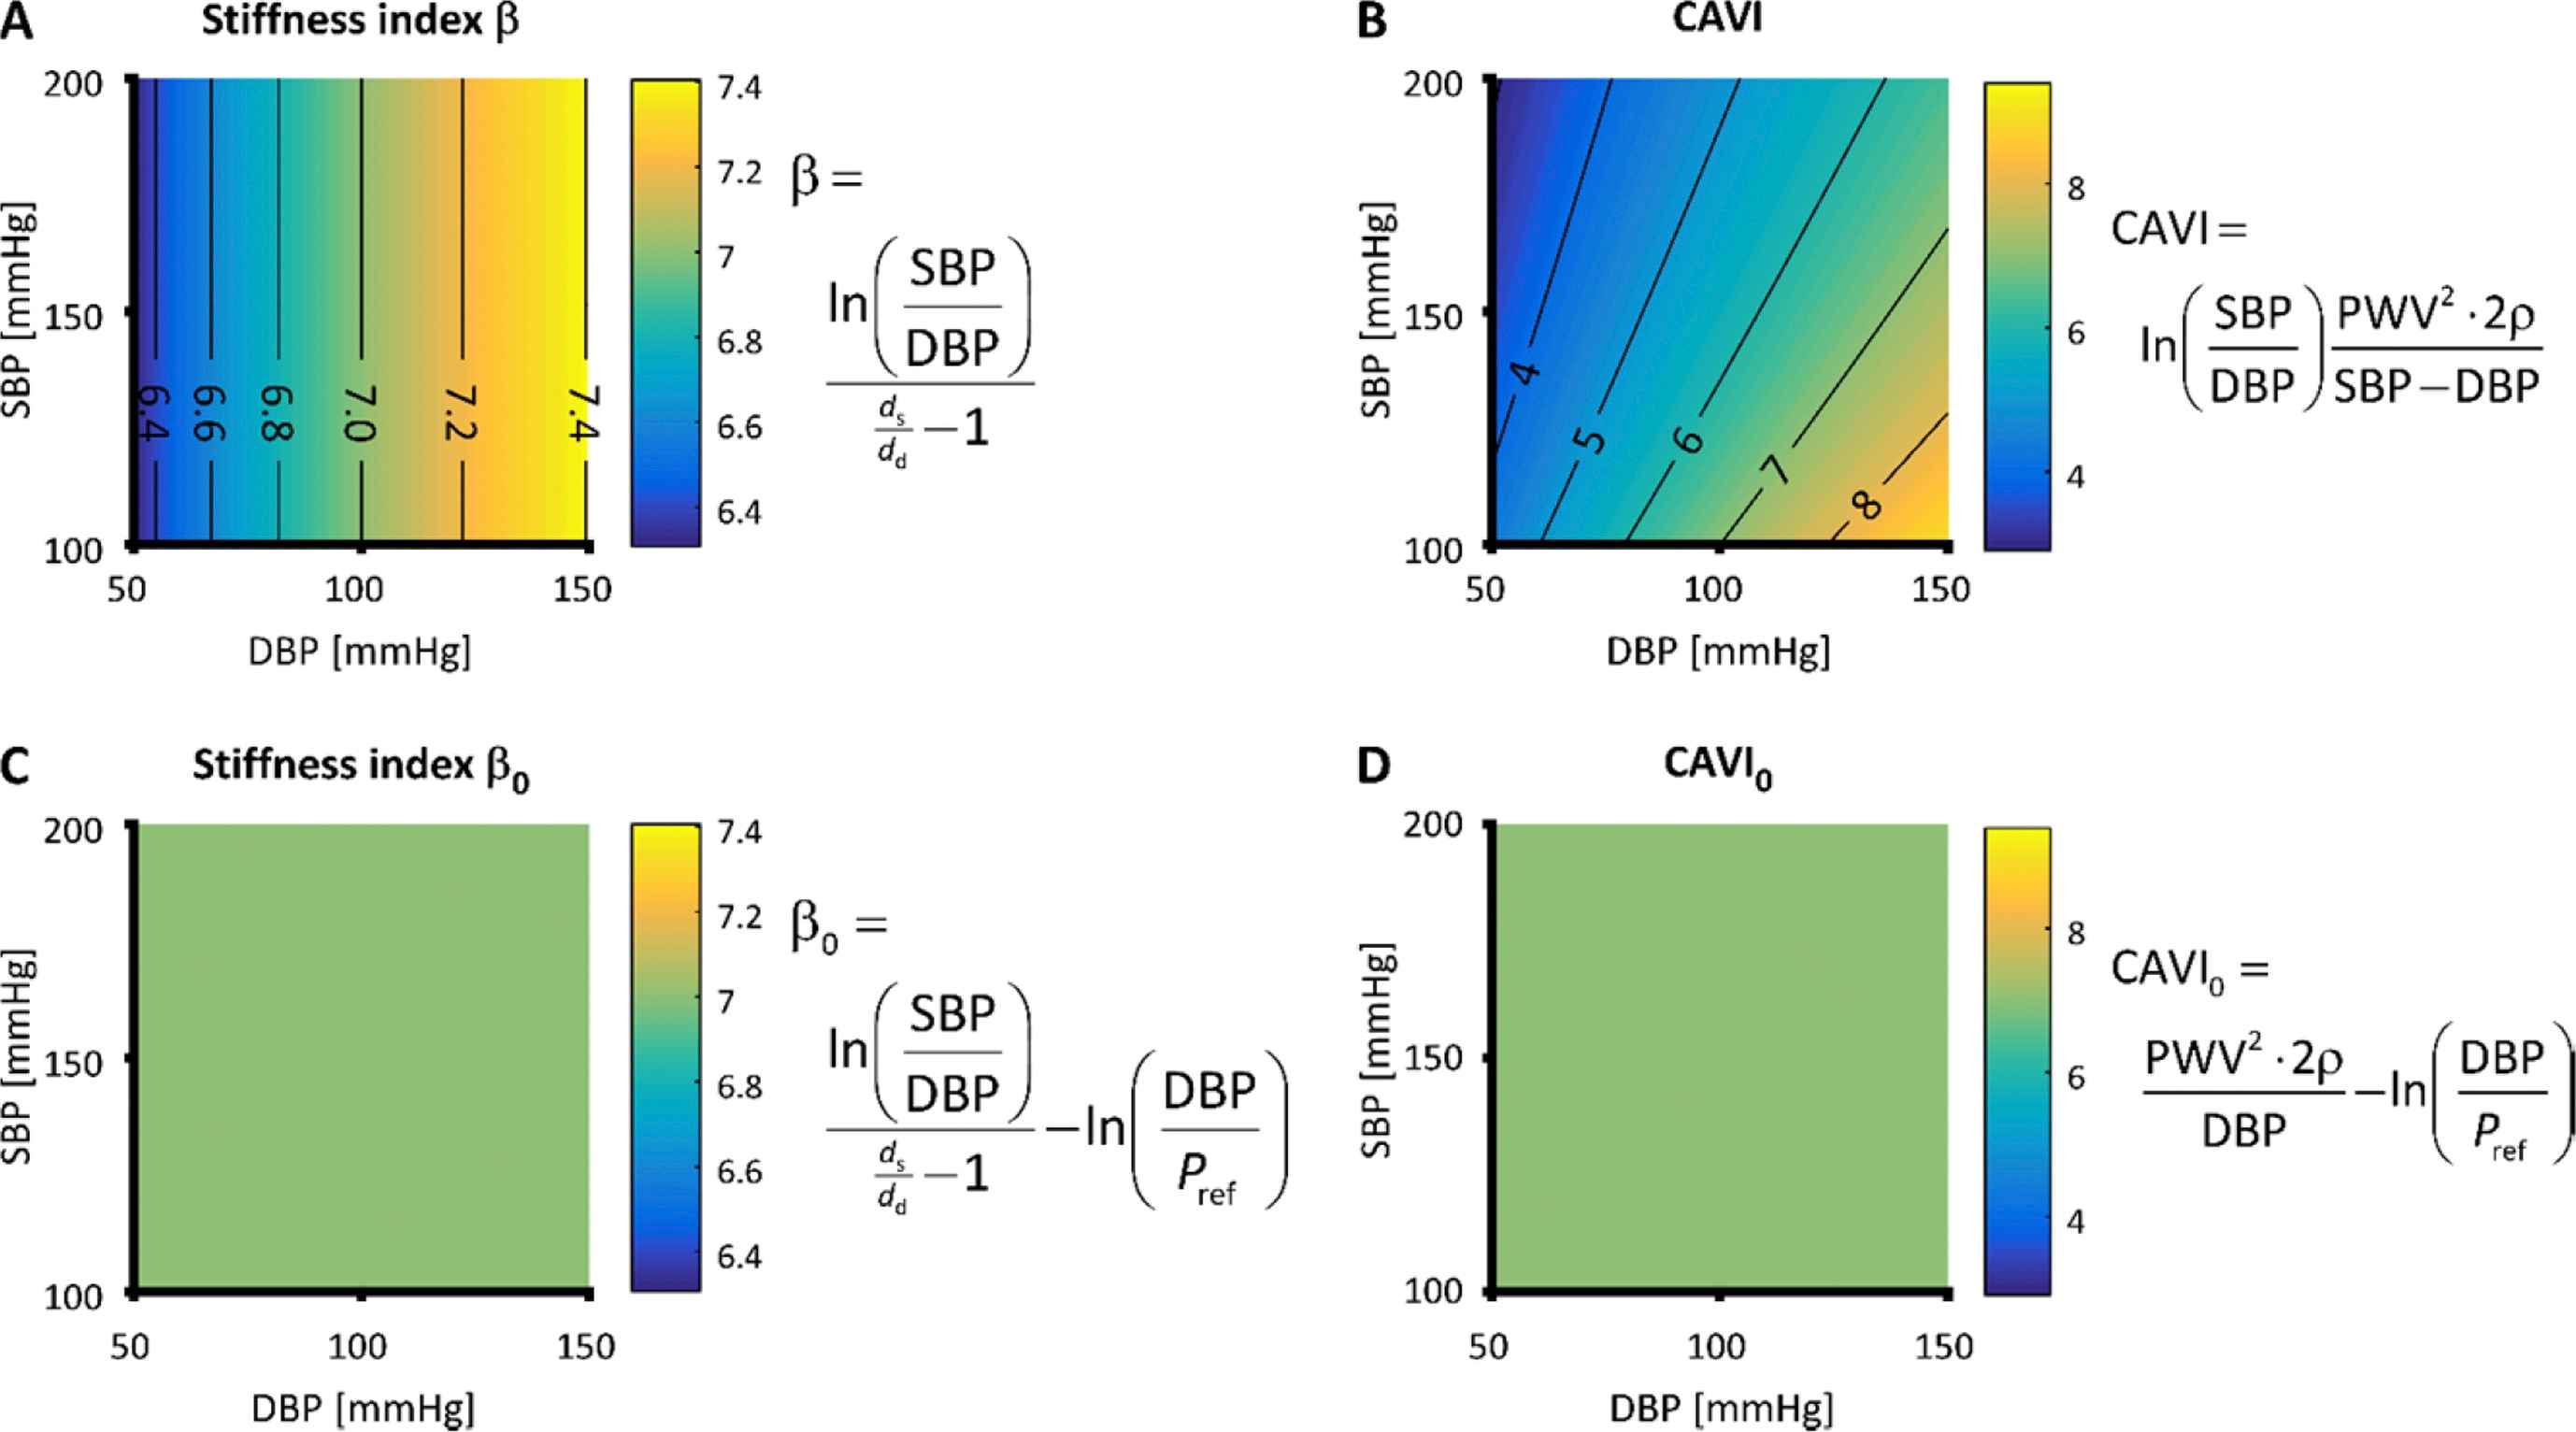
Equations and residual pressure dependences of stiffness index β (panel A), cardio-ankle vascular index (CAVI, panel B), β0 (panel C), and CAVI0 (panel D).26 Practically implemented as shown, β depends on diastolic blood pressure (DBP) and CAVI depends on both DBP and systolic blood pressure (SBP). In contrast, the newly proposed formulations β0 and CAVI0 do not show residual pressure dependence. ds and dd, systolic and diastolic diameter; Pref, reference pressure; PWV, pulse wave velocity; ρ, blood mass density.
Interpretation of arterial stiffness
Our work has not only focussed on the quantification of stiffness, but also on ways to interpret changes in stiffness. To this extent, we developed a constituent-based computer model of the arterial wall, explicitly describing collagen, elastin, and smooth muscle mechanical properties.29,30 We used this model to assess what happens to the arterial wall during normal ageing. This was accomplished by first adjusting our model parameters to let the model describe the arterial mechanical behaviour of a younger group of hypertensives (aged ∼40, local PWV of 8 m/s). Subsequently, we had the model predict — under physiologically realistic constraints on wall stress homeostasis17 — which parameters should change to describe the arterial mechanical behaviour of an older group of hypertensives (aged ∼65, local PWV of 12 m/s). This approach showed that pressure load bearing of elastin significantly decreased from 70 to 54%, whereas collagen load bearing significantly increased from 5 to 28%. Smooth muscle load bearing changed minimally from 25 to 19%. The model estimation was repeated using the same patient data however after blood pressure lowering (more than 7 mmHg diastolic), which yielded similar quantitative results.29 These findings illustrate how constituent-based modelling can help interpret arterial stiffness measurements in patients in terms of the individual arterial wall components.
To further work towards clinical applicability of this methodology, we performed an uncertainty quantification and sensitivity analysis of our approach.31 This showed that model parameter uncertainty was relatively large, and may mask the effects of vascular drug therapies. Analysis showed that the most influential measurements were diameter, distension, and wall thickness — all based on ultrasonography. Although it is hard to improve the intrinsic precision of ultrasound wall tracking32 (the highest available), its effective precision can be improved by repeating ultrasound measurements several times in the same patient, yielding sufficient reliability to study the effects of vascular drugs on arterial wall constituents.
Outlook
To optimise the aforementioned arterial constitutive model approach, in-depth biomechanical information is required on how pathologies — for example diabetes — influence arterial mechanics. Such information can be obtained through mouse models. A mouse artery can be thoroughly studied by mounting it between glass micropipettes and pressurising it, while stretching it to any length. This technique has been mastered by Prof. Humphrey and co-workers.33,34 One limitation of the current technique is that it tests arteries quasi-statically, under constant (non-pulsatile) pressure — neglecting arterial viscoelasticity.35 In the human (or mouse), however, arteries are subjected to pulsatile conditions. Therefore, to develop constitutive models applicable to patient data, the relationship of quasi-static and dynamic properties needs to be fully quantified and understood.
Conflict of interest
None.
Acknowledgements
This paper and the associated career development lecture at the Artery 17 conference in Pisa, Italy (12–14 October 2017) summarise work that I performed at and in collaboration with various universities worldwide. I am greatly indebted to all of my colleagues at these universities. In particular, the help of and support by Jay Humphrey, Alex Caulk, Arina Korneva, Sae-Il Murtada, and Abhay Ramachandra (Yale University, United States); Alberto Avolio, Mark Butlin, and Isabella Tan (Macquarie University, Australia); Koen Reesink, Tammo Delhaas, Maarten Heusinkveld, Siske Bos, Jeroen Hameleers, Bram Kroon, Peter Leenders, Anouk de Lepper, Jort Merken, Sjeng Quicken, Jos op ‘t Roodt, Anna Schueth, and Paul Spronck (Maastricht University, The Netherlands); Remco Megens (Ludwig-Maximilians University, Germany); Alun Hughes (University College London, United Kingdom); Pierre Boutouyrie, Stéphane Laurent, and Maureen Alivon (Paris Descartes University, France); Michal Mestanik, Ingrid Tonhajzerova, and Alexander Jurko (Comenius University, Slovakia); Jo de Mey and Maria Bloksgaard (University of Southern Denmark, Denmark); and Rosa Maria Bruno and Lorenzo Ghiadoni (University of Pisa, Italy) has been invaluable.
This work was supported by a 2011 and a 2016 Kootstra Talent Fellowship awarded by Maastricht University, by Endeavour Research Fellowship (
Footnotes
Formally, the actual path travelled by the pulse wave would be required, which is difficult to determine non-invasively. Several distance approximations have therefore been proposed and evaluated.4,5 Current recommendations propose the use of 0.8 times the direct distance between the measurement sites.6 However, arterial tortuosity developing with ageing and especially with several genetic arteriopathies complicates the use of this approximation.7
The Moens–Korteweg equation shows that
References
Cite this article
TY  - JOUR
AU  - Bart Spronck
PY  - 2017
DA  - 2017/12/13
TI  - Stiff vessels approached in a flexible way: Advancing quantification and interpretation of arterial stiffness☆
JO  - Artery Research
SP  - 63
EP  - 68
VL  - 21
IS  - C
SN  - 1876-4401
UR  - https://doi.org/10.1016/j.artres.2017.11.006
DO  - 10.1016/j.artres.2017.11.006
ID  - Spronck2017
ER  -