
Wave potential: A unified model of arterial waves, reservoir phenomena and their interaction☆
Invited paper for Artery Research, in association with the Career Development Lecture, Artery16 conference, Copenhagen, Denmark, 13–15 October, 2016.
- DOI
- 10.1016/j.artres.2017.04.002How to use a DOI?
- Keywords
- Windkessel; Hydraulic power; Diastolic pressure decay; Reservoir-wave model
- Abstract
Models of haemodynamics play a central role in current research directed to understanding and addressing cardiovascular disease. Although conventional windkessel and wave models are very useful, they are incompatible due to conflicting assumptions and neither comprehensively explain the basis and interdependencies of pressure/flow waves, mean pressure and reservoir filling/discharge phenomena. The hybrid reservoir-wave model was proposed to address this gap, but is not widely accepted due to theoretical inconsistencies and negative results from validation studies. We recently described a unified model of haemodynamics based on the concept of ‘wave potential’, which identifies physically meaningful information from the absolute values of the forward/backward components of pressure and flow. Within this paradigm, hydraulic power may also be separated into forward/backward components, thus allowing study of time-dependent cardiac and vascular effects that influence hydraulic power output and efficiency. Based on in vivo and numerical experiments, it has been shown that 1) absolute values of the pressure/flow/power components represent wave potential, spatial gradients of which produce waves that transfer hydraulic energy, 2) mean pressure is generated by waves, 3) wave potential is a measure of local conduit arterial reservoir function and stored hydraulic energy, and 4) the diastolic pressure decay and associated ‘self-cancelling’ diastolic waves can be explained purely on the basis of wave reflection and distal leakage of wave potential. Wave potential provides a unified and analytically simple paradigm of arterial haemodynamics that extends and is fully compatible with conventional wave separation, while overcoming the difficulties encountered with the reservoir-wave paradigm.
- Copyright
- © 2017 Association for Research into Arterial Structure and Physiology. Published by Elsevier B.V. All rights reserved.
- Open Access
- This is an open access article distributed under the CC BY-NC license.
The need for a unified model of haemodynamics
Models of haemodynamics play a foundational role in cardiovascular research, influencing the conceptual framework within which hypotheses are generated and haemodynamic variables interpreted. Desirable properties of a model include broad scope (explaining much), power (simplicity without compromising scope), internal consistency, soundness of assumptions, quantifiability (expressed mathematically and produces useful indices) and validity (accurate model predictions). Two models currently dominating the field of haemodynamics are the windkessel model and wave model. Although conflicting in terms of certain assumptions (e.g. infinite vs. finite wave speed), they are also complementary in their respective strengths for describing haemodynamics in systole (wave model) and diastole (windkessel model).
However, this conflict and complementarity in the prevailing models highlights the need for a single unified model that would likely aid investigations of cardiovascular physiology and disease. Such a model would provide an integrated analytical framework and conceptual understanding of pulse waveform features (e.g. pressure augmentation, the diastolic pressure decay and the spatial evolution of the pulse), mean pressure, blood volume storage/discharge effects in large arteries (reservoir function) and ventricular-vascular coupling dynamics. This review summarises the strengths and weaknesses of current models and provides an overview of recent efforts towards developing a unified model of haemodynamics.
Windkessel model
Windkessel models represent the arterial system with several lumped (or zero-dimensional, 0D) parameters. The original two-element windkessel, formally proposed by Otto Frank in 1899,1 elegantly describes the reservoir function of large arteries, whereby part of the blood volume ejected by the ventricle is stored in a large artery compliance (Cart) during systole and is discharged through a peripheral resistance (Rp) during diastole. This model explains the exponential decay of pressure during diastole as arising from the discharge of reservoir volume, and predicts the time constant (RpCart) governing this pressure decay. Mean arterial pressure (MAP) is also explained as arising from the resistance to cardiac output (CO), i.e. MAP = CO × Rp + CVP, where CVP is central venous pressure.
The key limitation of the two-element windkessel, however, is that wave speed is assumed to be infinite. The consequent rather poor prediction of systolic pressure/flow waveforms led to the development of a number of modified windkessel models with additional elements, e.g. the three-element windkessel and others.1 Although improving the prediction of systolic haemodynamics, these models retain the assumption of infinite wave speed and hence key wave-related phenomena, such as the systolic pressure inflection and the spatial evolution of the pressure/flow pulses, fall outside their scope.
Wave model
With a rich history that will not be reviewed here (see Nichols and O’Rourke2 and Parker3), wave models describe pressure/flow perturbations that are generated by the ventricle, propagate at a finite speed into the arterial system and undergo partial reflection wherever impedance mismatching is encountered. Pressure and flow waveforms at a given location (e.g. the ascending aorta) are interpreted as arising from a combination of forward- and backward-running waves. Measured pressure (P) and flow (Q) may be separated into forward and backward wave-related components (P± and Q±),4 while wave intensity analysis quantifies the intensity of specific wavefronts.5 Various one-dimensional (1D) models, i.e. limited instantiations or sub-models of the more general wave model, are also commonly used to study haemodynamics, ranging from the single tube and T-tube models2,6,7 to anatomically-based numerical models of arterial networks.8–10
Wave-based models have been fruitful for investigating features of the pressure/flow pulses that depend on wave propagation and reflection, such as systolic pressure inflection/augmentation, the diastolic ‘wave’ (or hump) seen in younger individuals and the spatial evolution of pressure and flow in different vessels.2 However, current wave models offer no explanation for mean pressure, which is simply taken for granted; as expressed by Taylor,7 “each injection of blood generates pressure variations about the mean, and it is with these disturbances [i.e. waves], travelling through the elastic system, that we are concerned”. Thus, absolute values of P± and Q± have been considered meaningless. Similarly, wave intensity is calculated from the derivatives of pressure and velocity, thus discarding mean values. In addition to neglecting mean pressure, doubts have also been expressed about the ability of wave models to explain the diastolic pressure decay and arterial reservoir storage/discharge effects.11,12
Reservoir-wave model
Recognising the complementary strengths of windkessel and wave models, Wang et al.12 proposed a hybrid reservoir-wave model, based on the heuristic principle that windkessel effects (diastolic pressure decay and reservoir volume storage/discharge) are independent of wave effects. Blood pressure was decomposed into a reservoir pressure (Pres, or ‘windkessel pressure’) and an excess pressure (Pex, or ‘wave pressure’).11–13 In essence, waves were considered to cause pressure fluctuations around a time-varying Pres, rather than a constant mean P. This was a unified model of haemodynamics in that it provided a framework for understanding mean pressure, the diastolic pressure decay and reservoir volume variations (via Pres), as well as wave propagation and reflection effects (via Pex). Although conceptually attractive, subsequent scrutiny of the underlying assumptions, consistency and quantitative predictions of the reservoir-wave model revealed a number of problems that hindered its widespread acceptance.14–21
First, the proposed independence of reservoir and wave effects (expressed as P=Pres + Pex) arose from an impression that ‘self-cancelling’ diastolic waves apparent in conventional wave separation are physiologically implausible.11,12 However, it was later pointed out that the equations governing the windkessel model can be derived from the equations governing the wave model via certain simplifying assumptions, and therefore the windkessel model is simply a mathematical subset of the wave model, just as ‘poodle’ is a subset of ‘dog’.14 Hence everything within the explanatory scope of the windkessel model must also lie within the scope of the wave model, making separation of perceived ‘windkessel effects’ from perceived ‘wave effects’ logically problematic (can we separate ‘poodles’ from ‘dogs’?).
An issue concerning the internal consistency of the reservoir-wave model arose because reservoir pressure was defined as Pres(t), i.e. a time-dependent, but spatially invariant, pressure. Conversely, wave effects were associated with Pex(x,t), a function of space (1D) and time. However, when calculated at different locations (e.g. proximal and distal aorta), Pres was not spatially invariant; rather, the foot of Pres propagated along the aorta.14 The wave properties of Pres are now widely acknowledged and have prompted a rethink regarding the definition and meaning of Pres that is still ongoing.22,23 However, the finding that “Pres is a wave”24 indicated that the primary objective of the reservoir-wave model (to separate wave and reservoir phenomena) was unsuccessful.
A third and related issue concerned the quantitative predictions of the reservoir-wave model. Given the presumption that all wave effects reside in Pex, proponents of this model suggested that Pex should be used instead of measured pressure (P) in wave separation and wave intensity analyses.12,13,25 Importantly, when the Pex-based wave analyses were compared with conventional wave analyses, both experimental and clinical studies reported a markedly lower degree of pressure-increasing (positive) wave reflection with the Pex-based, or in some cases a surprising predominance of pressure-decreasing (negative) wave reflection.14,25–28 Thus, some investigators concluded that systolic pressure augmentation arises primarily via reservoir effects rather than wave reflection.27,29
To evaluate the relative accuracy of Pex-based versus P-based wave analysis, a gold standard reflection coefficient (Rref) for a particular bifurcation can be calculated as
Despite these issues, several clinical studies have found that various Pres indices or the Pex integral (XSPI) provide predictive value for cardiovascular events or mortality.33–35 However, given that Pres is approximately equal to two times the backward component of pressure (2P−)35,36 and Pex ≈ ZcQ (which means that XSPI ≈ Zc × stroke volumea), these indices may not provide true added value over and above more conventional indices. Finally, one significant practical limitation is the dependence of Pres on fitting an exponential curve to diastolic pressure, with Vermeersch et al. finding that P∞ (a key parameter in this fitting procedure) could not be estimated in a “large number” of cases.18
Wave potential model
Given the difficulties of a hybrid reservoir-wave model,14,15 we sought a unified model that was based purely on one-dimensional wave theory. In particular, our aim was to 1) expand the scope of the current wave model to explain mean pressure and reservoir function, including their relation to waves, and 2) explain the diastolic pressure decay in a wave-based model paradigm.37
Conventional wave separation analysis defines the wave components as
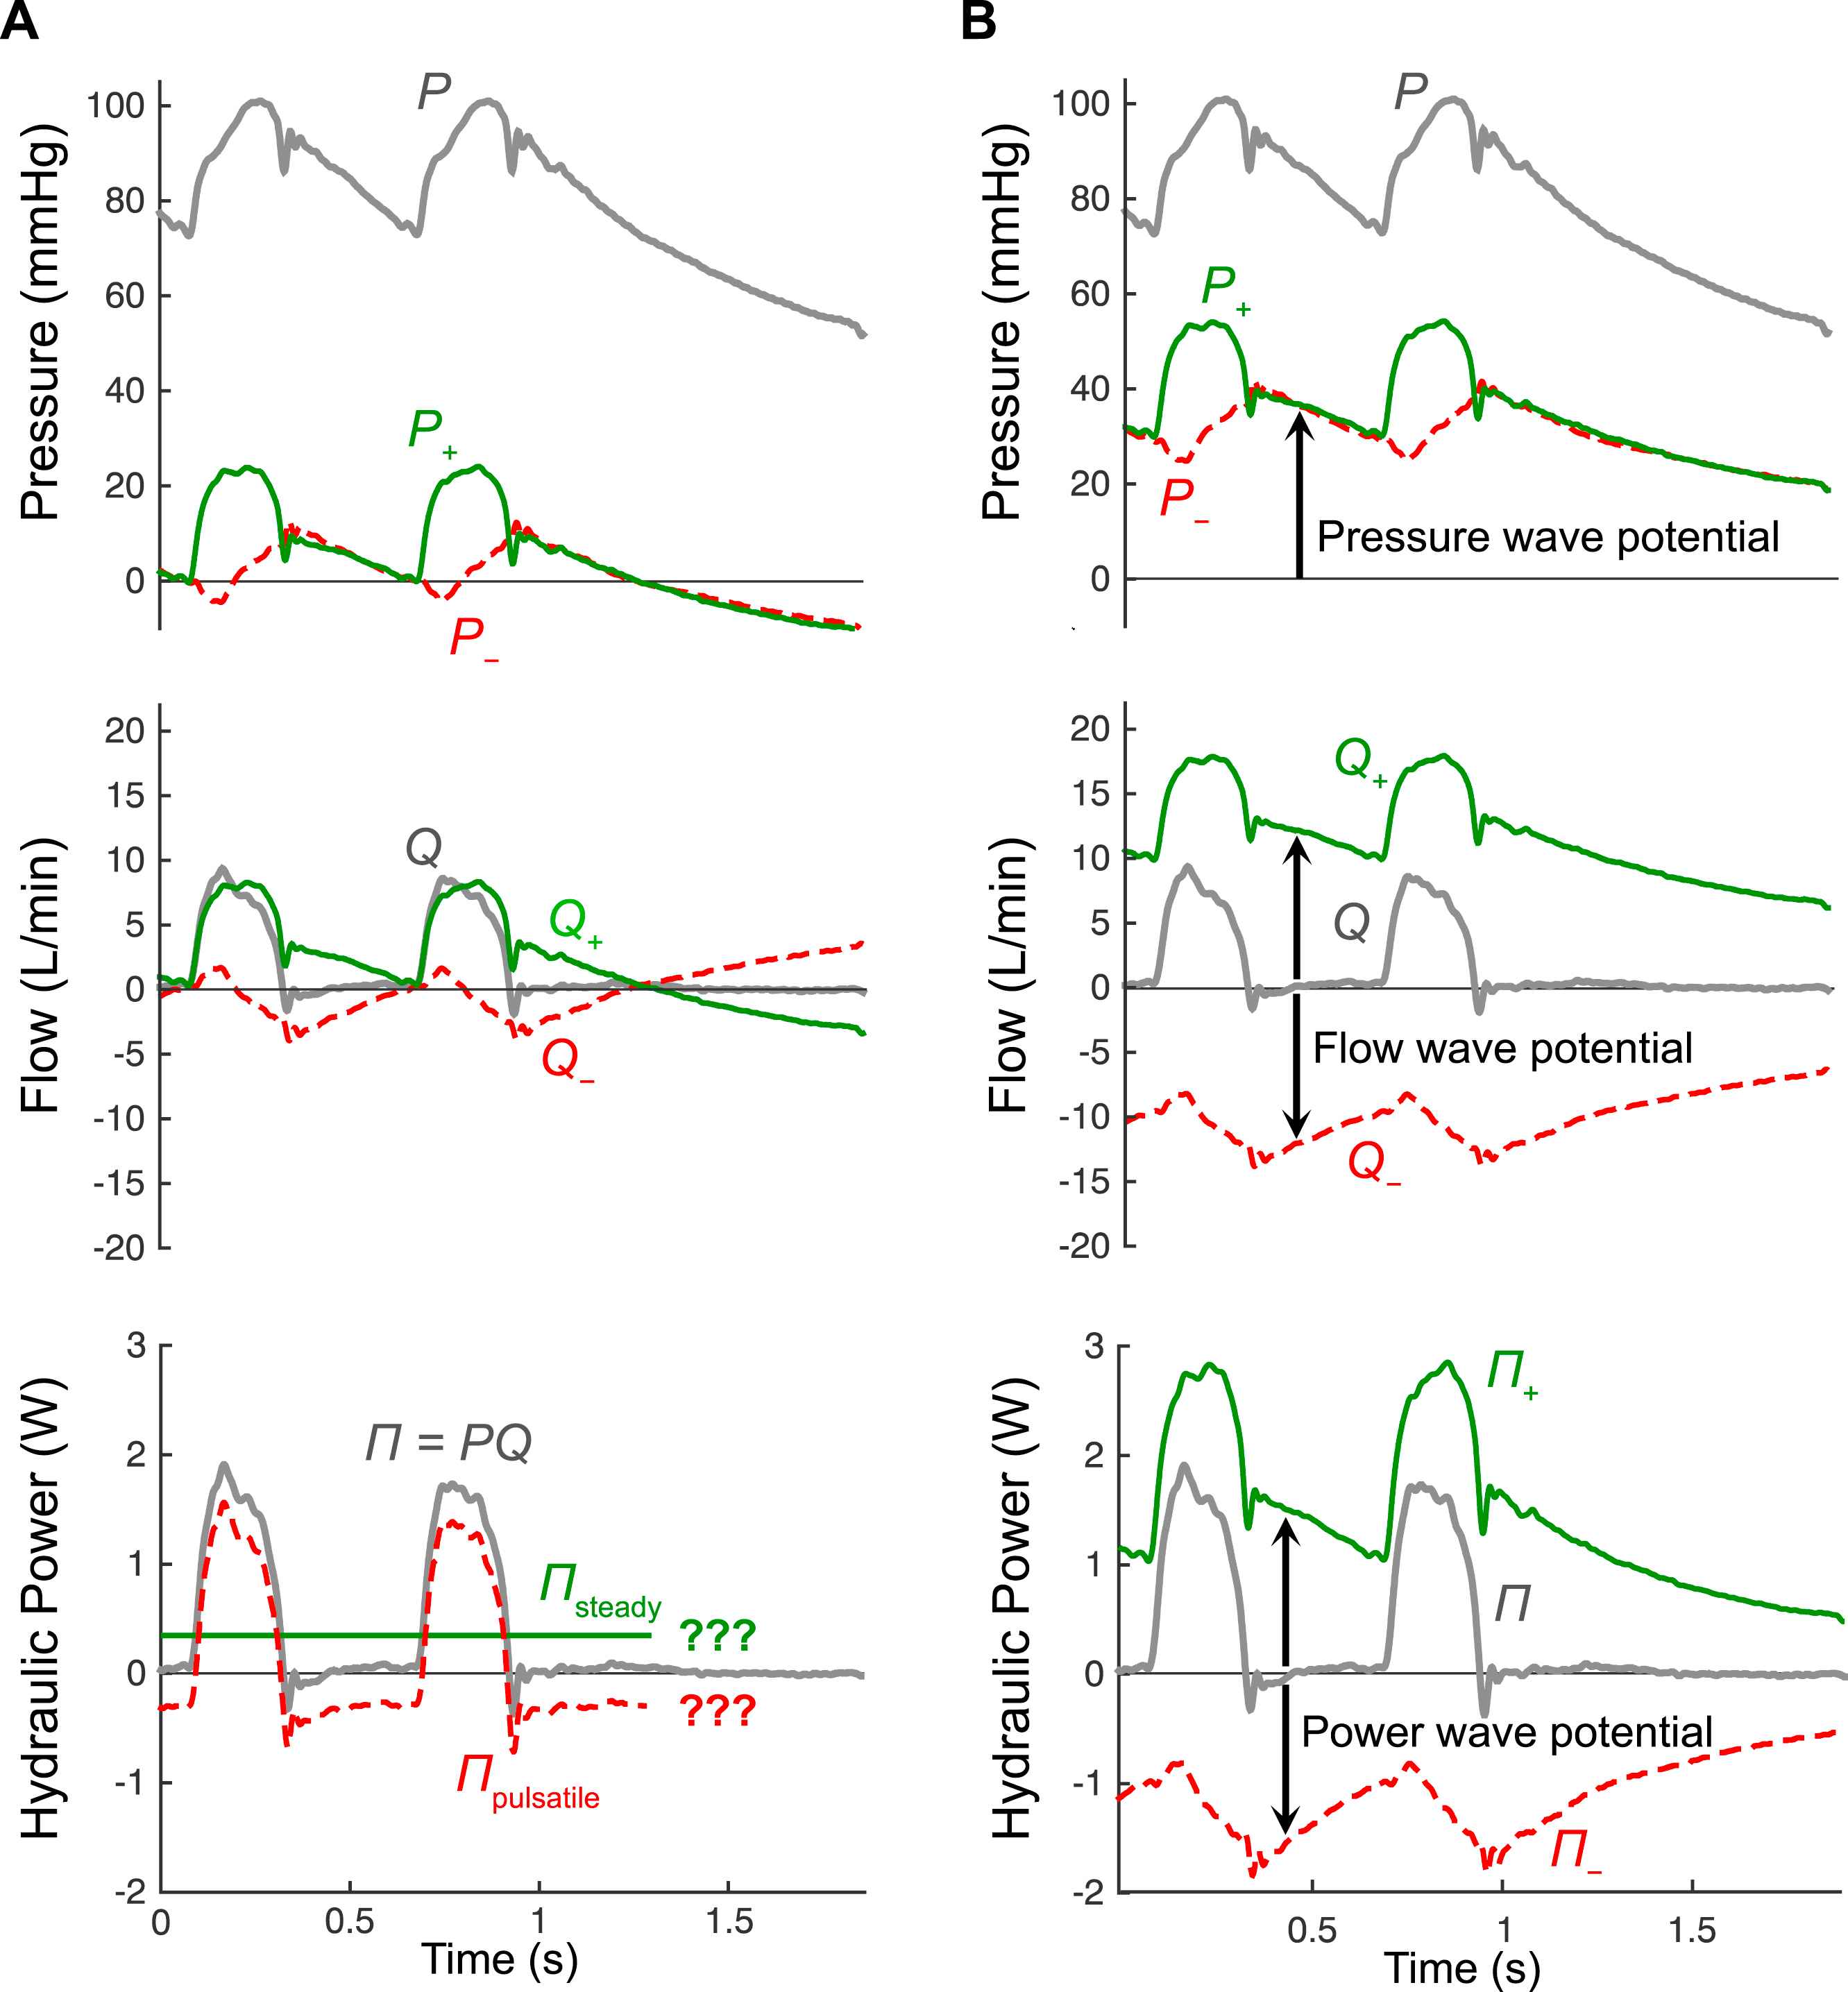
(A) Wave separation of pressure (P) and flow (Q) using conventional analysis, along with standard separation of hydraulic power (Π = PQ) into steady and pulsatile components, which can only be applied in steady state conditions. (B) Wave separation of P, Q and Π using the theory of wave potential, in which changes in the forward (+) and backward (−) components occur due to the passage of waves, while the absolute values of these components represent pressure wave potential (P±), flow wave potential (Q±) which indicates locally stored reservoir volume, and power wave potential (Π±) which indicates locally stored potential energy. Note that P=P+ + P− + Pud, where the undisturbed pressure (Pud) is 13.8 mmHg in this example. Figure adapted from Mynard and Smolich.37
The first step in developing the unified model was therefore to recognise that some time after a heart stops beating, an equilibrium will be reached in which no pressure-flow waves exist in the circulation and, in the absence of any pressure or flow gradients, there will be no potential for waves to be generated. We therefore proposed that it is physiologically meaningful to define P± = 0 and Q± = 0 in this ‘undisturbed’ state, i.e., when flow is zero everywhere and blood pressure has fallen to some final, uniform undisturbed pressure (Pud, also called mean circulatory pressure, typically ∼10 mmHg).37
On this basis, the wave components can be calculated in an absolute form (i.e. with no arbitrary constants) as
With these equations, P± and Q± asymptote to zero when the heart stops and a final equilibrium is reached,37 as is implied in Fig. 1B. This adjustment to conventional wave separation is both subtle and simple, but has profound implications for interpreting P± and Q±. In particular, when the heart is beating under steady state conditions, P± and Q± exhibit a notable offset from the time axis (arrows in Fig. 1B). This offset represents wave potential.
The concept of wave potential can be readily grasped by considering a compliant tube that is pressurised at 100 mmHg to the left and 50 mmHg to the right of a clamp (Fig. 2A). When the clamp is released, fluid will flow from left to right, i.e. from high pressure to low pressure. In this respect, the pressure difference under equilibrium conditions represented a potential for flow that was realised when the clamp was released. In addition, when the clamp is released, pressure/flow waves arise and propagate in both directions; a pressure-decreasing flow-increasing wave propagates to the left and a pressure-increasing flow-increasing wave propagates to the right. Importantly, the left-to-right differences in absolute values of P+ and Q+ and the right-to-left differences of P− and Q− before clamp release are equal to the pressure and flow effects of the forward and backward waves that are generated after clamp release (hence the term ‘wave potential’).37 These waves cause a change in local wave potential (dP± and dQ±) and a spatial transfer of wave potential; in Fig. 2A, an increased wave potential is transferred to the right (increased P+ and Q+) and a decreased wave potential is transferred to the left (decreased P− and less negative Q−).
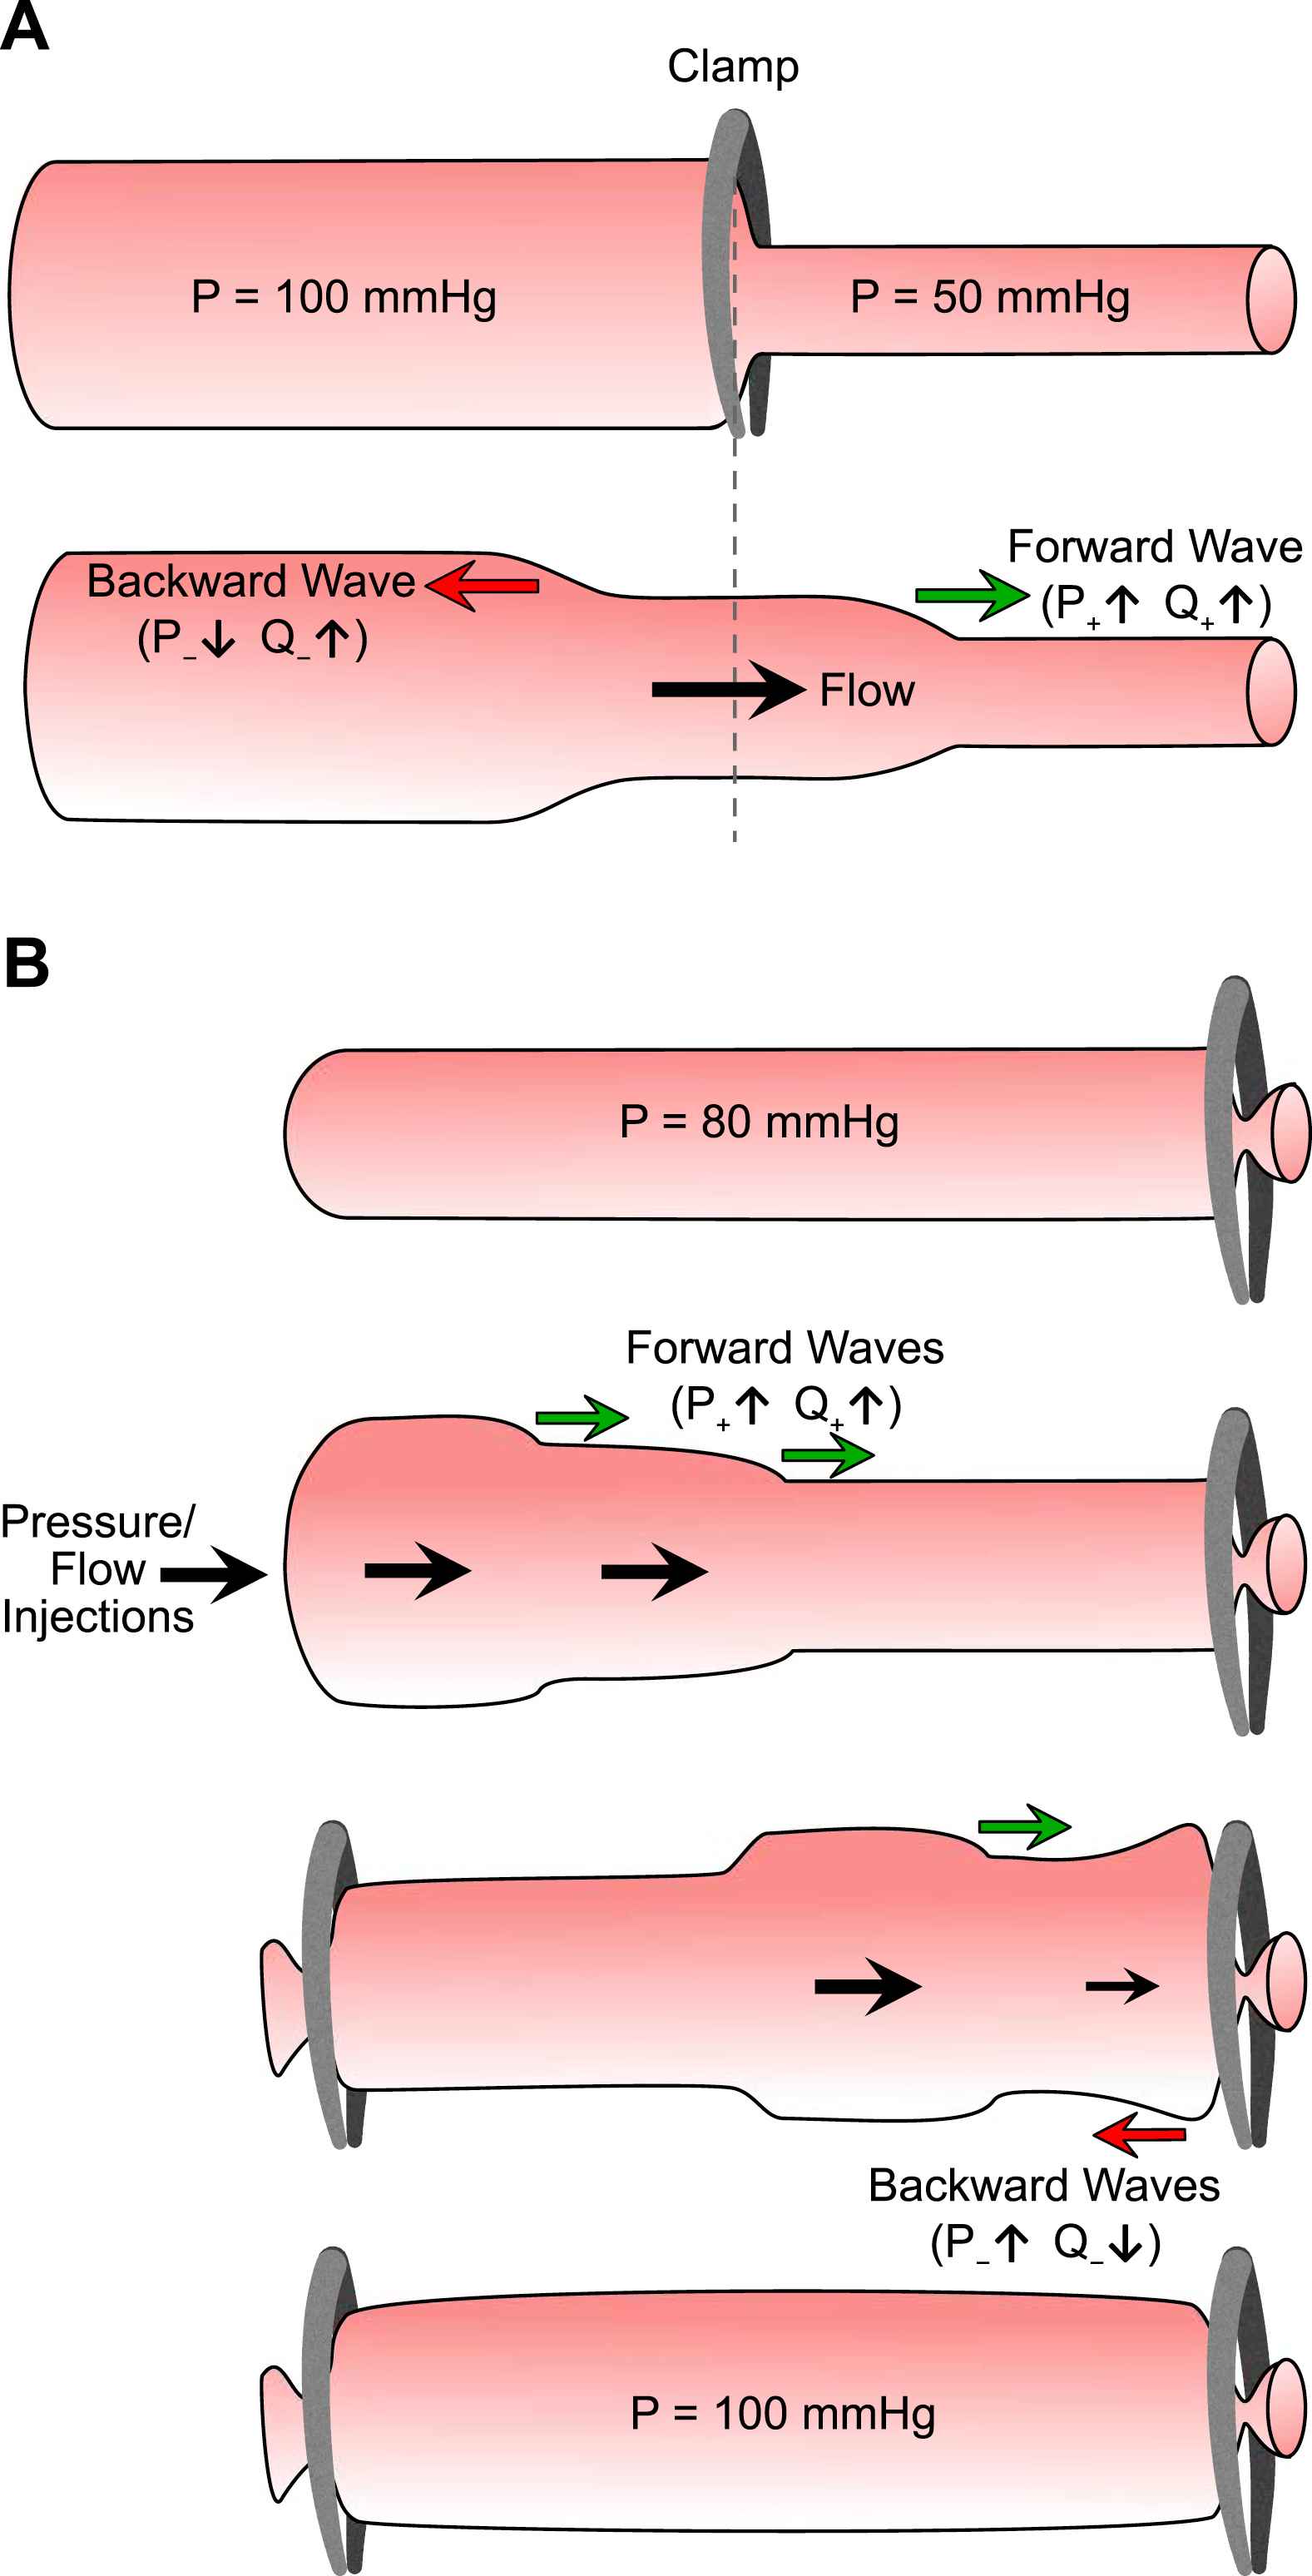
Illustrations of the meaning and significance of wave potential and interactions between waves, mean pressure and arterial volume. (A) A vessel is pressurized at 100 mmHg to the left of a clamp and 50 mmHg to the right; both sides are in equilibrium. When the clamp is removed, fluid flows from left to right and waves propagate in both directions; the difference in wave potential (absolute P± and Q±) between left and right sides before clamp release reveals the pressure/flow effects of the waves that arise after clamp release. (B) Impulsive pressure/flow waves are injected into a vessel and undergo reflection at the clamped end. After clamping the inlet also, the waves reflect, re-reflect and eventually disperse/dissipate until a new equilibrium is reached. The resultant higher pressure and fluid volume are associated with increased wave potential and show how mean pressure and arterial reservoir volume are ultimately generated by waves.
Wave potential and reservoir function
As is evident in Fig. 2A, flow wave potential (Q±) is increased by a lower characteristic impedance or a higher pressure, that is, when the tube is larger, more compliant or more pressurized. Flow wave potential therefore represents local reservoir function, with an increase in Q± representing storage of blood volume and a decrease in Q± representing discharge of blood volume. Specifically, at a particular instant in time and in a vascular segment of length dx, the stored volume (Vs), i.e. the volume that would be discharged if pressure fell to Pud, is given by37,38
Figure 3 illustrates that, all else being equal, increased arterial stiffness leads to reduced reservoir storage capacity (decreased flow wave potential), while increased peripheral resistance increases pressure and hence reservoir volume (increased Q±) and vice versa for a decreased resistance.
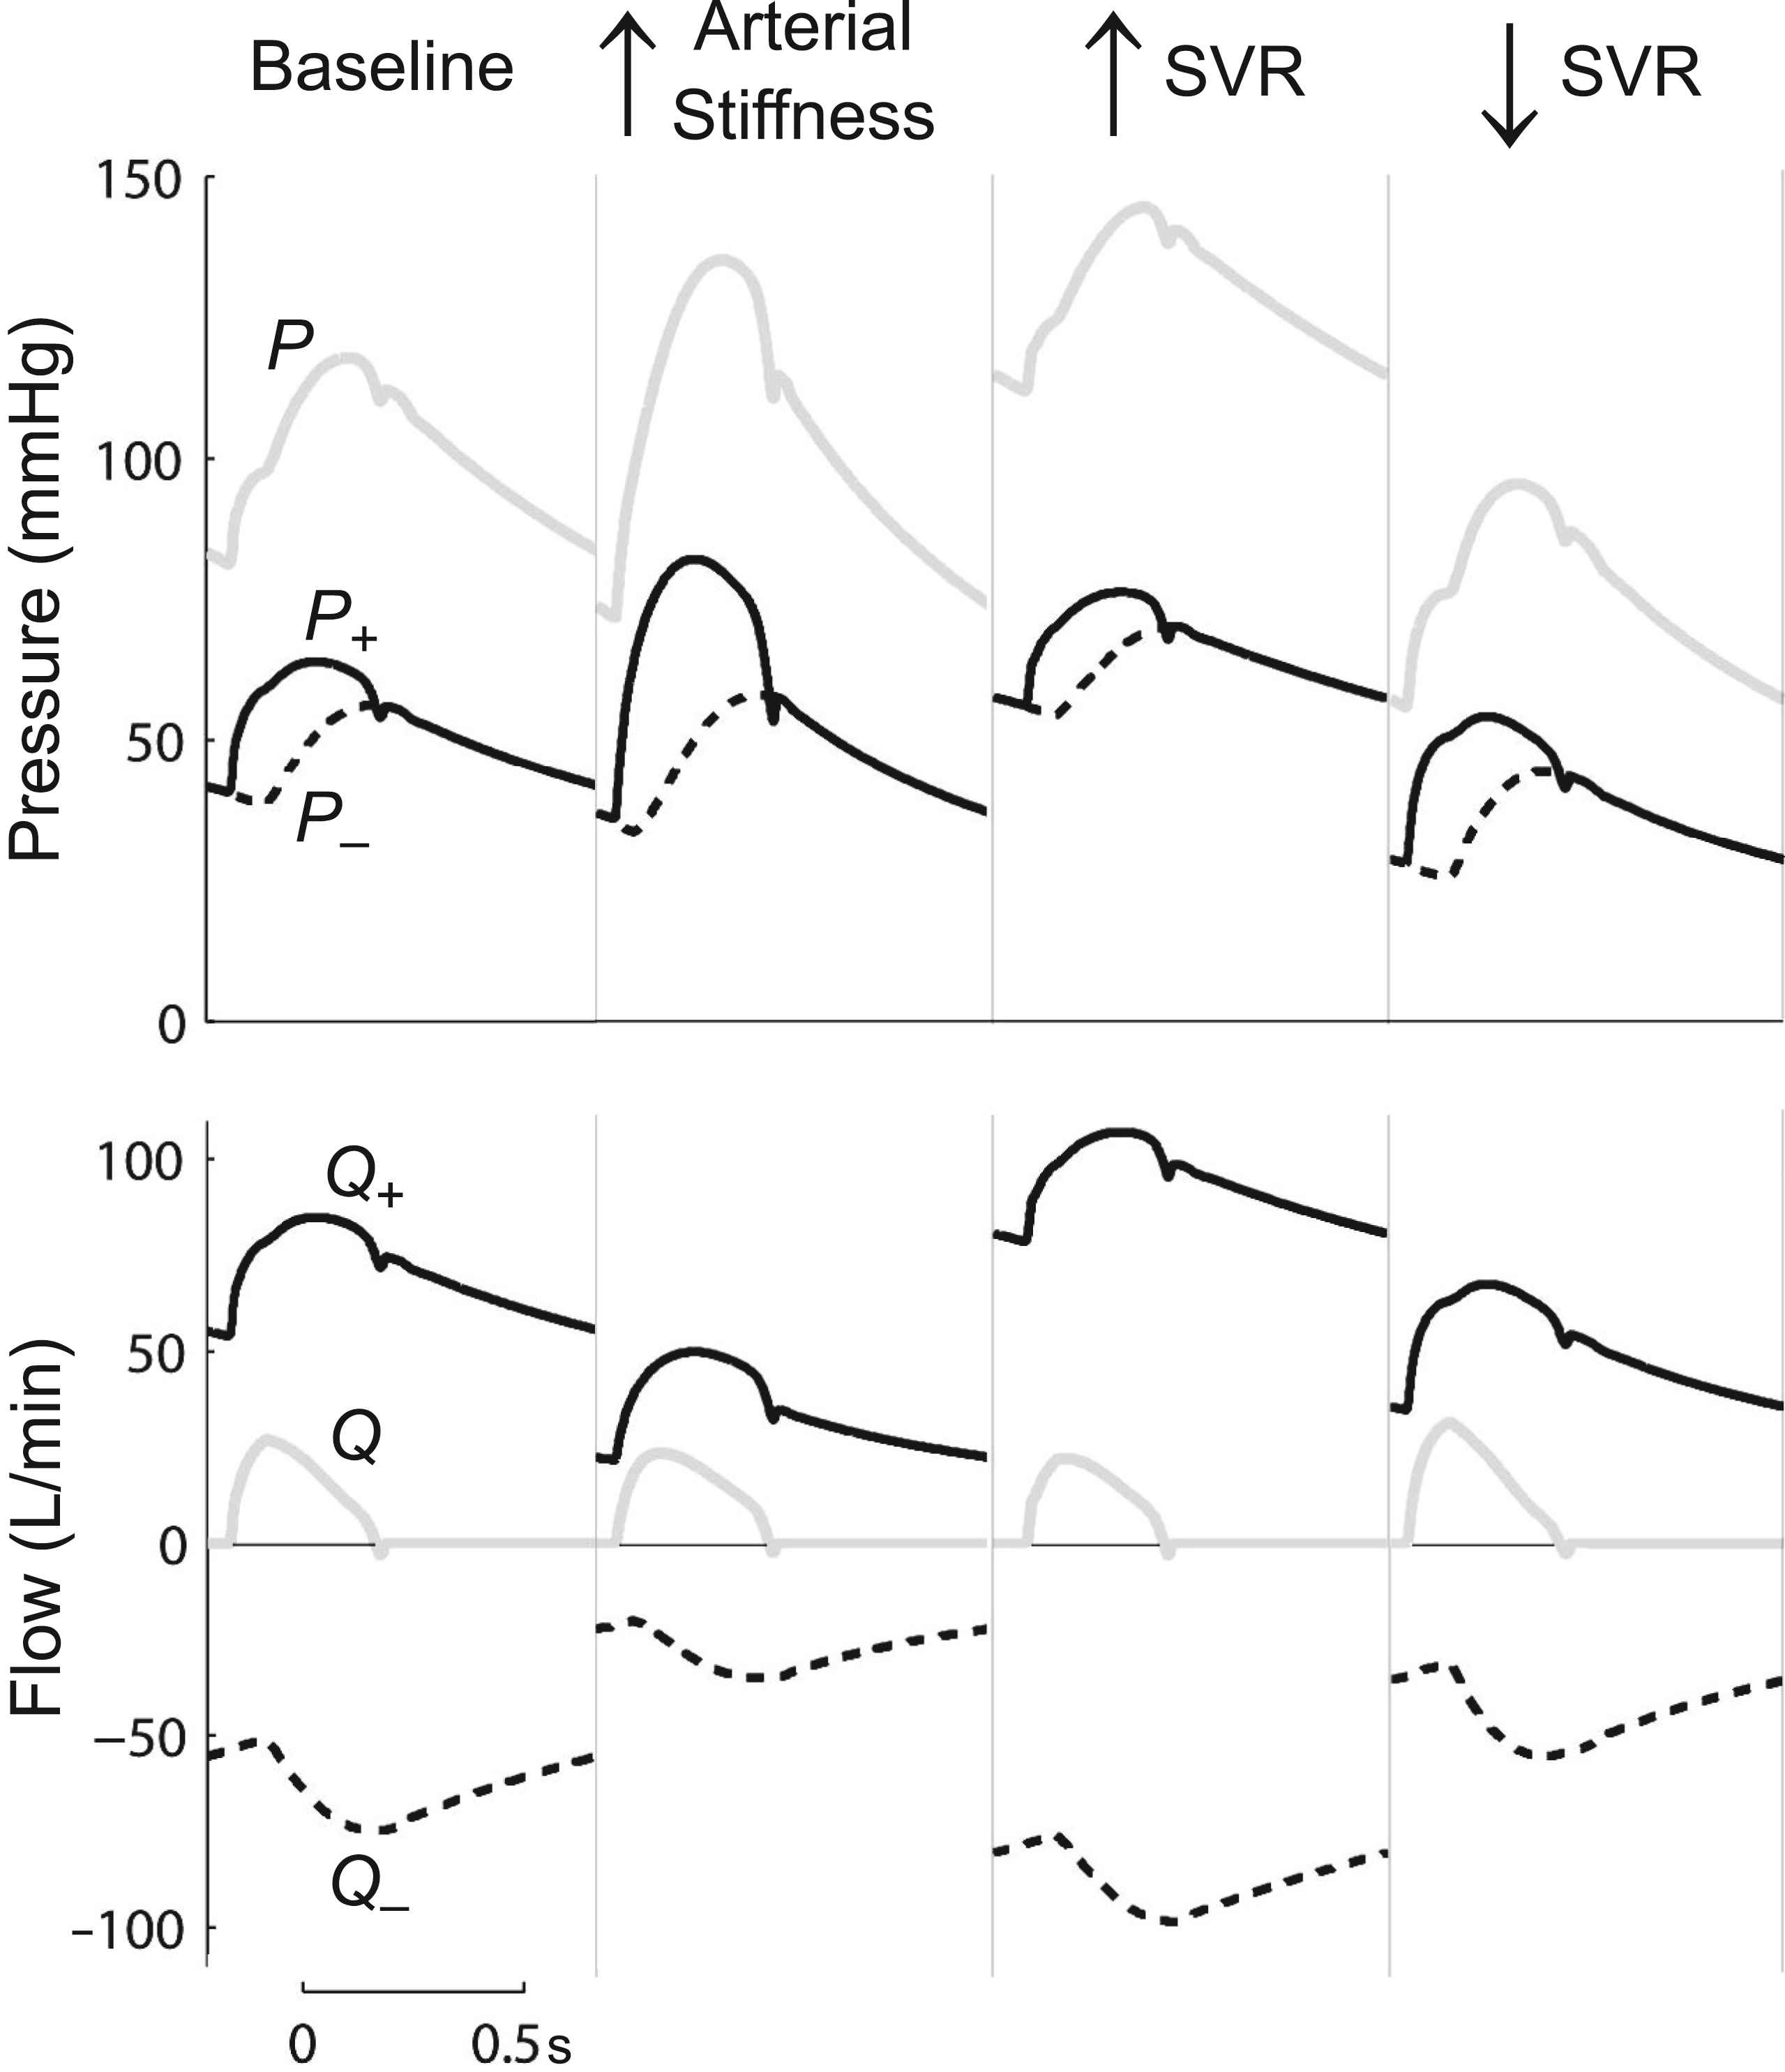
Changes in wave potential with increased arterial stiffness (arterial wave speed doubled) and increased or decreased systemic vascular resistance (SVR). Changes in the Q± offset indicate changes in reservoir volume. As in the windkessel model, a decreased reservoir volume is seen to occur due to increased large artery stiffness or decreased outlet resistance. Figure adapted from Mynard and Smolich.37
Wave potential and mean pressure
The relationship between waves and mean pressure was elegantly demonstrated by Alastruey et al., who noted that “the pulse waves generated by the … left ventricle … are the only supply of energy into the system”.10 The wave potential model also links waves and mean pressure quantitatively. Pressure at any instant is given by
Therefore, mean pressure is equal to the sum of undisturbed pressure and mean forward and backward pressure wave potential. In the clamp release example in Fig. 2A, one can see how a steady pressure can be transformed into waves. Conversely, consider another example where initial pressure in a closed-ended tube is constant at 80 mmHg (Fig. 2B). Injection of pressure/flow pulses at the inlet will produce waves (forward propagating increases of P+ and Q+) that are reflected at the clamped end (backward propagating increases of dP− and |dQ−|). If the inlet is then also clamped, the injected waves will propagate back and forth a number of times but will eventually disperse/dissipate. However, the injected fluid volume will be trapped and will distend the tube; thus the injected waves are ultimately responsible for the final increased equilibrium (mean) pressure (e.g. 100 mmHg).
Waves and the diastolic pressure decay
A similar process of wave dispersion and dissipation to that envisaged in Fig. 2B occurs in the arterial system during diastole and enables a wave-based explanation of the pressure decay.37 At the end of systole, the relaxing ventricle produces a pressure/flow-reducing forward decompression wave (FDW) that leads to valve closure. This FDW propagates into the arterial system and undergoes reflection and re-reflection at the multitude of reflection sites in the arterial network, giving rise to an ensemble of backward decompression waves (eBDW). This eBDW has low wave intensity since it is dispersed by the spatially distributed reflection, attenuated by the pressure-dependence of wave speed39 and partially dissipated by viscous losses in the arterial wall and flowing blood. Nevertheless, any portion of the eBDW arriving back at the closed valve is completely re-reflected as an ensemble of forward decompression waves (eFDW). The eBDW and eFDW have equal pressure effects and opposite flow effects, hence explaining the ‘self-cancelling’ waves.37
Thus, as in the ‘wave injection’ illustration (Fig. 2B), high frequency pressure-flow waves are injected into the arterial system during systole, the inlet is closed off (valve closes) and waves propagate back and forth and are dispersed/dissipated during diastole; however, wave potential ‘leaks’ out of the relatively high peripheral impedance (as though the distal end in Fig. 2B is not fully occluded). Alastruey et al.40 showed that the peripheral dispersion of these waves is so great that they produce a slowly decaying ‘pressure history’ that spans multiple cardiac cycles.
Wave separation for hydraulic power
The hydraulic power generated by the heart, primarily in the form of pressure power (Π = PQ), has traditionally been decomposed into steady and pulsatile components. Two drawbacks of this analysis are that it can only be performed under steady state conditions (see Fig. 1A) and it cannot be used to investigate the power effect of specific waves in the time domain. However, calculation of absolute P± and Q± in the wave potential model enables wave separation to be applied to Π via38
Figure 1B shows that, similar to Q±, the Π± waveforms exhibit an offset with respect to the time axis and the absolute values of Π± signify power wave potential.38 Just as absolute values of P± and Q± represent the maximum possible pressure and flow waves that could be produced at that location (associated with pressure falling to Pud), so Π± represents the power that would be produced by those waves. Thus, Π± represents the hydraulic energy that is stored in the compliant, pressurised arterial wall, with a change in local Π± quantifying the energy that is stored or discharged with the passage of a wave.38
Summary and future directions
Although very useful, conventional windkessel and wave models have limited explanatory scope, highlighting the need for a unified model of haemodynamics. The reservoir-wave model combined windkessel and wave concepts into a hybrid paradigm, but problems with its basic assumptions, internal inconsistency and quantitative predictions have hindered its widespread acceptance; by (attempting to) separate reservoir and wave effects, this model also does not explain how waves and reservoir phenomena (mean pressure and volume storage/discharge) interact. The wave potential model is a unified paradigm that brings a new dimension to conventional wave separation analysis, with absolute values of P± and Q± creating a quantitative link between arterial reservoir function and waves. Mean pressure and the diastolic pressure decay (including self-cancelling waves) may be readily explained in this wave-based paradigm, and a novel time domain wave analysis of hydraulic power has been proposed. Additional work is needed to further explore the relationship between waves and reservoir phenomena, the use of Π± to provide insights into ventricular-vascular coupling efficiency, and the ultimate clinical utility of the wave potential model.
Conflicts of interest
None.
Acknowledgments
JPM was funded by a CJ Martin Early Career Fellowship from the
Footnotes
This was recently pointed out by Prof Nico Westerhof during discussions at the meeting Arterial Hemodynamics: Past, Present and Future, King’s College, London (14–15 June, 2016).
References
Cite this article
TY  - JOUR
AU  - Jonathan P. Mynard
AU  - Joseph J. Smolich
PY  - 2017
DA  - 2017/04/14
TI  - Wave potential: A unified model of arterial waves, reservoir phenomena and their interaction☆
JO  - Artery Research
SP  - 55
EP  - 63
VL  - 18
IS  - C
SN  - 1876-4401
UR  - https://doi.org/10.1016/j.artres.2017.04.002
DO  - 10.1016/j.artres.2017.04.002
ID  - Mynard2017
ER  -