
Influence of Ultrasound Settings on Carotid Biomarker Assessment by B-mode Image Processing
These two authors contributed equally to this work.
- DOI
- 10.2991/artres.k.191127.001How to use a DOI?
- Keywords
- Carotid biomarker; Carotid IMT; Carotid distension; Ultrasound settings; Semi-automatic software
- Abstract
Introduction: This study aims to investigate how image settings affect carotid Intima-Media-Thickness (IMT) and diameter estimation performed with Carotid Studio (Quipu-Srl).
Methods: Fourteen healthy volunteers (24.4 ± 4.4 years; eight men) were recruited. Longitudinal scans 3-cm-deep of common-carotid-arteries with the same region-of-interest were obtained by expert operator, starting from a “default-setup” (central Time Gain Compensation-TGC; gain: 50 dB; no persistence filter) and adjusting one parameter at a time (oblique TGC; gain: 10 dB increments from 30 to 70 dB; persistence filter). The acquisition was performed twice, and repeatability was expressed for each setup as Coefficient of Variation (CV). Significant changes (p ≤ 0.05) compared with the “default-setup” were analysed by Wilcoxon signed-rank-test.
Results: Sixty and 70 dB gain resulted in overestimating IMT (from 0.460 ± 0.001 to 0.506 ± 0.030 mm and 0.538 ± 0.011 mm, p = 0.002 and 0.023 respectively vs. default-50 dB), underestimating the mean diameter (from 6.044 ± 0.040 mm to 5.763 ± 0.004 mm, p = 0.008 and to 5.698 ± 0.225 mm, p = 0.002), and for 70 dB, increasing IMT CV from 2.14 ± 1.92% to 6.85 ± 5.23% (p = 0.01) and diameter CV from 1.79 ± 1.22% to 4.77 ± 4.71% (p = 0.05). Distension CV increased from 5.71 ± 4.31% to 10.84 ± 5.91% (p = 0.041) and to 12.59 ± 7.97% (p = 0.021) for 60 and 70 dB respectively. Persistence and TGC did not affect repeatability, whereas diameter (5.955 ± 0.033 mm, p = 0.005) and distension (from 0.816 ± 0.019 mm to 0.655 ± 0.018 mm, p = 0.002) values were underestimated when persistence filter was active.
Discussion: Precision and reproducibility of carotid parameters, automatically assessed by Carotid Studio, are affected by high gain levels, due to image grey-level saturation. Persistence filter activation leads to underestimate diameter and distension, possibly due to mathematical operator behaviour and image temporal filtering. Since ultrasound setup significantly affects carotid parameter assessment, it should be reported and replicated in follow-up scans.
HIGHLIGHTS
- •
We investigated how ultrasound imaging setup may affect carotid parameters.
- •
Carotid parameters’ reproducibility was lower with high-gain values.
- •
Persistence filter leads to underestimation of diameter and distension.
- •
The scan projection seems to influence carotid parameter estimation.
- •
Image depth should be kept at the lowest attainable value for best repeatability.
- •
- Copyright
- © 2019 Association for Research into Arterial Structure and Physiology. Publishing services by Atlantis Press International B.V.
- Open Access
- This is an open access article distributed under the CC BY-NC 4.0 license (http://creativecommons.org/licenses/by-nc/4.0/).
1. INTRODUCTION
Cardiovascular disease prevention is a priority in public health. It is widely accepted by the scientific community that the description of the cardiovascular status of a person, based only on classic risk factors, may not be sufficient in terms of clinical effectiveness nor in terms of cost to the National Health System [1]. The ability to identify a “vulnerable” subject can be increased by the introduction of innovative biomarkers, such as those measurable by biomedical signals and images, able to detect the presence of vascular damage at the sub-clinical and asymptomatic stage, preceding decades the onset of disease. Some of these changes, which are asymptomatic in the initial stages of atherosclerosis, can be estimated non-invasively by means of ultrasound biomarkers. In recent years, great attention has been placed on Carotid Intima-Media Thickness (IMT) and arterial elasticity, due to their independent predictive value for cardiovascular morbidity/mortality [2]. Carotid IMT, diameter and distension are commonly measured by ultrasound-based systems. Radio Frequency (RF)-based echo-tracking is the gold standard technique, thanks to their high spatial resolution [3]; however, this kind of data output is not easily available in standard ultrasound equipment. Carotid measurements can also be obtained by B-mode data, which are instead widely available in clinical practice; when adopting semi-automatic validated systems for the image analysis, results precision was shown to be comparable with RF-based devices, when measurements are performed using each system in the recommended configuration [4]. However, ultrasound equipment setup may impact on the success of the examination when using B-mode-based systems [5]. Indeed, the performance of the measurements depends not only on the robustness of the adopted algorithm, but also by the quality of the analysed scan, which is affected by device settings [6,7].
Standardization of image settings for semi-automatic measurements is required also in other fields of application, such as for example obstetrics and gynecology [8]. The need of standardization is particularly important when the measured parameters are widespread used for the calculation of risk, the establishment of reference values and the prediction of an outcome.
This study aims to investigate how different image settings may affect carotid biomarkers estimation performed by a semi-automatic software, the Carotid Studio (Quipu Srl, Pisa, Italy), an innovative system for assessing early imaging biomarkers of cardiovascular risk.
2. MATERIALS AND METHODS
2.1. Study Population
Fourteen healthy volunteers (eight men), aged 24.4 ± 4.4 years, free of cardiovascular disease or risk factors, were recruited. Informed consent was obtained from all individual participants included in the study.
2.2. Experimental Measurements
Measurements were performed in a temperature-controlled room with subjects in supine position, according to the guidelines [3].
Brachial blood pressure was measured in the left arm after being seated for 5 min by a trained operator with an automated oscillometric device (Omron 705-IT, Japan). Brachial blood pressure was measured three times at 2-min intervals and the average value was used for analysis. Then, local carotid blood pressure was obtained by carotid tonometry (SphygmoCor® CVPH, Atcor Medical, Sidney, Australia): the curve was calibrated assuming diastolic and mean blood pressure to be constant throughout arterial tree.
B-mode longitudinal anterior and lateral scans of the left common carotid arteries, 1 cm proximal to the carotid bulb, were obtained by an expert operator maintaining the same region of interest. All ultrasound acquisitions were performed using a MyLab 25 (Esaote, Florence, Italy) with a 10-MHz linear array probe. Automatic measurement of carotid IMT, mean diameter (D) and carotid distension (ΔD) (expressed as stroke change in diameter) were obtained by analysing offline the acquired image sequences by the Carotid Studio software (Cardiovascular Suite, Quipu srl, Pisa, Italy), a system able to simultaneously assess carotid morphological and functional features from B-mode ultrasound scanning. In detail, the software measures: (1) the instantaneous diameter of the carotid artery in real-time by a contour-tracking technique applied to B-mode ultrasound image sequences of a longitudinal section of the vessel; (2) carotid IMT, automatically computed by a robust edge detection algorithm [4,9]. The same region of interest and the same calibration factor for each image depth were maintained throughout the offline image analysis.
2.3. Experimental Protocol
Starting from a default setting, identified by the experience of the operator and the available literature, different ultrasound settings were tested. The full acquisition protocol is summarized in Table 1. Two acquisitions for each step were performed to assess reproducibility. The following parameters, easily available and adjustable by the operator in the main standard ultrasound equipments [10], were varied during the protocol:
- (1)
- (2)
Time Gain Compensation (TGC) controls let the operator selectively adjust the gain at different depths in order to offset the loss in signal caused by tissue absorption and diffraction variations. Adjustments in TGC are made to approximate a uniform background level throughout the field of view. Central TGC (the default setting in clinical research) and oblique TGC setting (the most frequently used in clinical practice [12]) were tested.
- (3)
Persistence is a type of temporal smoothing filter by which small frame-to-frame variations (mainly due to electrical noise) are averaged in order to be minimized and to improve the signal-to-noise ratio. The activation of the persistence filter is effective for suppressing random image noise, but the averaging effect slows the time response to changes in the image, resulting in smearing of the representation of moving targets and hence lowering the temporal resolution of the image. Inactive (the default setting in clinical research) and active option (the most frequently used in clinical practice) were tested.
- (4)
The overall image gain control, available to the user on most B-mode systems, applies this type of gain to the echo signals amplifying them by a constant factor regardless of the depth and this results in adjusting the overall brightness of the ultrasound image. Five different overall gain were tested (30–70 dB), with 50 dB being considered as default setting [12].
| Parameters | S1 - default setup | S2 | S3 | S4 | S5 | S6 | S7 | S8 |
|---|---|---|---|---|---|---|---|---|
| Image depth (cm) | 3 | 4 | 3 | 3 | 3 | 3 | 3 | 3 |
| TGC | Central | Central | Oblique | Central | Central | Central | Central | Central |
| Persistence filter | OFF | OFF | OFF | ON | OFF | OFF | OFF | OFF |
| Image gain (dB) | 50 | 50 | 50 | 50 | 30 | 40 | 60 | 70 |
TGC, temporal gain compensation.
Study protocol: starting from S1 - default setup, longitudinal scans of the left common carotid artery were acquired adjusting a parameter at a time (the modified parameter is highlighted)
Finally, for each subject, using ultrasound default setup, longitudinal scan of the left and right common carotid arteries was obtained with both anterior and lateral approaches. Longitudinal images of the common carotid artery at different angles are suggested for carotid IMT measurement [13]. The default scan used in our lab is anterior to the sternocleidomastoid muscle. The lateral one was also tested in our protocol.
2.4. Statistical Analysis
All statistical analyses were conducted using Statistical Production and Service Solution for Windows (SPSS Inc., Chicago, IL, USA), version 24. Continuous variables are presented as mean and standard deviation. Non-parametric Wilcoxon signed-rank test was used to compare each variable between the “default” setup and the varied setups. Repeatability for each setup was tested as Coefficient of Variation (CV, defined as the percentage ratio of the standard deviation to the mean value). A p-value ≤0.05 was considered as statistically significant.
3. RESULTS
Study population characteristics are shown in Table 2.
| Variables | |
|---|---|
| Age (years) | 24.4 ± 4.4 |
| Men, n (%) | 8 (57) |
| Body weight (kg) | 65.3 ± 12.8 |
| Body height (cm) | 174.0 ± 10.7 |
| BMI (kg/m2) | 21.4 ± 2.4 |
| bSBP (mmHg) | 112.6 ± 17.2 |
| bDBP (mmHg) | 65.1 ± 7.8 |
| cSBP (mmHg) | 113.4 ± 18.0 |
| cDBP (mmHg) | 65.3 ± 8.0 |
| HR (bpm) | 59.3 ± 9.7 |
| Carotid mean diameter (mm) | 6.044 ± 0.040 |
| Carotid distension (mm) | 0.816 ± 0.019 |
| Carotid compliance coefficient (10−6 * m2 * kPa−1) | 1.287 ± 0.051 |
| Carotid distensibility coefficient (10−3 * kPa−1) | 52.335 ± 1.841 |
| Carotid stiffness (m/s) | 4.350 ± 0.042 |
| Carotid Young’s modulus (kPa) | 0.265 ± 0.003 |
| Carotid IMT (mm) | 0.460 ± 0.001 |
Values are mean ± SD or n (%). BMI, body mass index; bSBP, brachial systolic blood pressure; bDBP, brachial diastolic blood pressure; cSBP, carotid systolic blood pressure; cDBP, carotid diastolic blood pressure; HR, heart rate; IMT, intima media thickness.
Clinical characteristics of the study population
3.1. Image Depth
When increasing image depth from 3 to 4 cm, no significant changes were observed in the three carotid parameters estimation (as shown in Table 3). As reported in Table 4, mean diameter repeatability tended to be reduced, (p = 0.05) using 4 cm compared with 3 cm depth (Figures 1 and 2).
| Mean IMT (mm) | Mean diameter (mm) | Mean distension (mm) | |
|---|---|---|---|
| S1 | 0.460 ± 0.001 | 6.044 ± 0.040 | 0.816 ± 0.019 |
| S2 | 0.458 ± 0.001 | 6.035 ± 0.060 | 0.790 ± 0.014 |
| S3 | 0.454 ± 0.001 | 5.959 ± 0.046 | 0.781 ± 0.019 |
| S4 | 0.461 ± 0.013 | 5.955* ± 0.033 | 0.655* ± 0.018 |
| S5 | 0.442 ± 0.007 | 6.028 ± 0.042 | 0.755 ± 0.007 |
| S6 | 0.454 ± 0.005 | 5.985 ± 0.057 | 0.766 ± 0.009 |
| S7 | 0.506* ± 0.030 | 5.763* ± 0.004 | 0.882 ± 0.031 |
| S8 | 0.538** ± 0.011 | 5.698* ± 0.225 | 0.890 ± 0.015 |
p ≤ 0.01 vs. default setup (S1).
p ≤ 0.05 vs. default setup (S1).
Estimation of mean IMT, diameter and distension with different ultrasound setups
| CV - mean IMT (%) | CV - mean diameter (%) | CV - mean distension (%) | |
|---|---|---|---|
| S1 | 2.14 ± 1.92 | 1.79 ± 1.22 | 5.71 ± 4.31 |
| S2 | 3.06 ± 2.84 | 2.56 ± 1.95 | 6.94 ± 5.93 |
| S3 | 1.69 ± 1.53 | 1.90 ± 0.98 | 6.11 ± 3.97 |
| S4 | 2.43 ± 1.75 | 1.65 ± 1.08 | 9.37 ± 8.29 |
| S5 | 3.90 ± 2.64 | 1.76 ± 1.15 | 4.59 ± 3.25 |
| S6 | 2.95 ± 1.43 | 1.42 ± 1.69 | 4.16 ± 4.03 |
| S7 | 2.42 ± 1.88 | 2.13 ± 2.53 | 10.84* ± 5.91 |
| S8 | 6.85** ± 5.22 | 4.77* ± 4.71 | 12.59* ± 7.97 |
Significant changes with respect to the S1 (default setup) are identified by *p ≤ 0.05, **p ≤ 0.01.
Coefficient of variation of mean IMT, diameter and distension with the different ultrasound setup
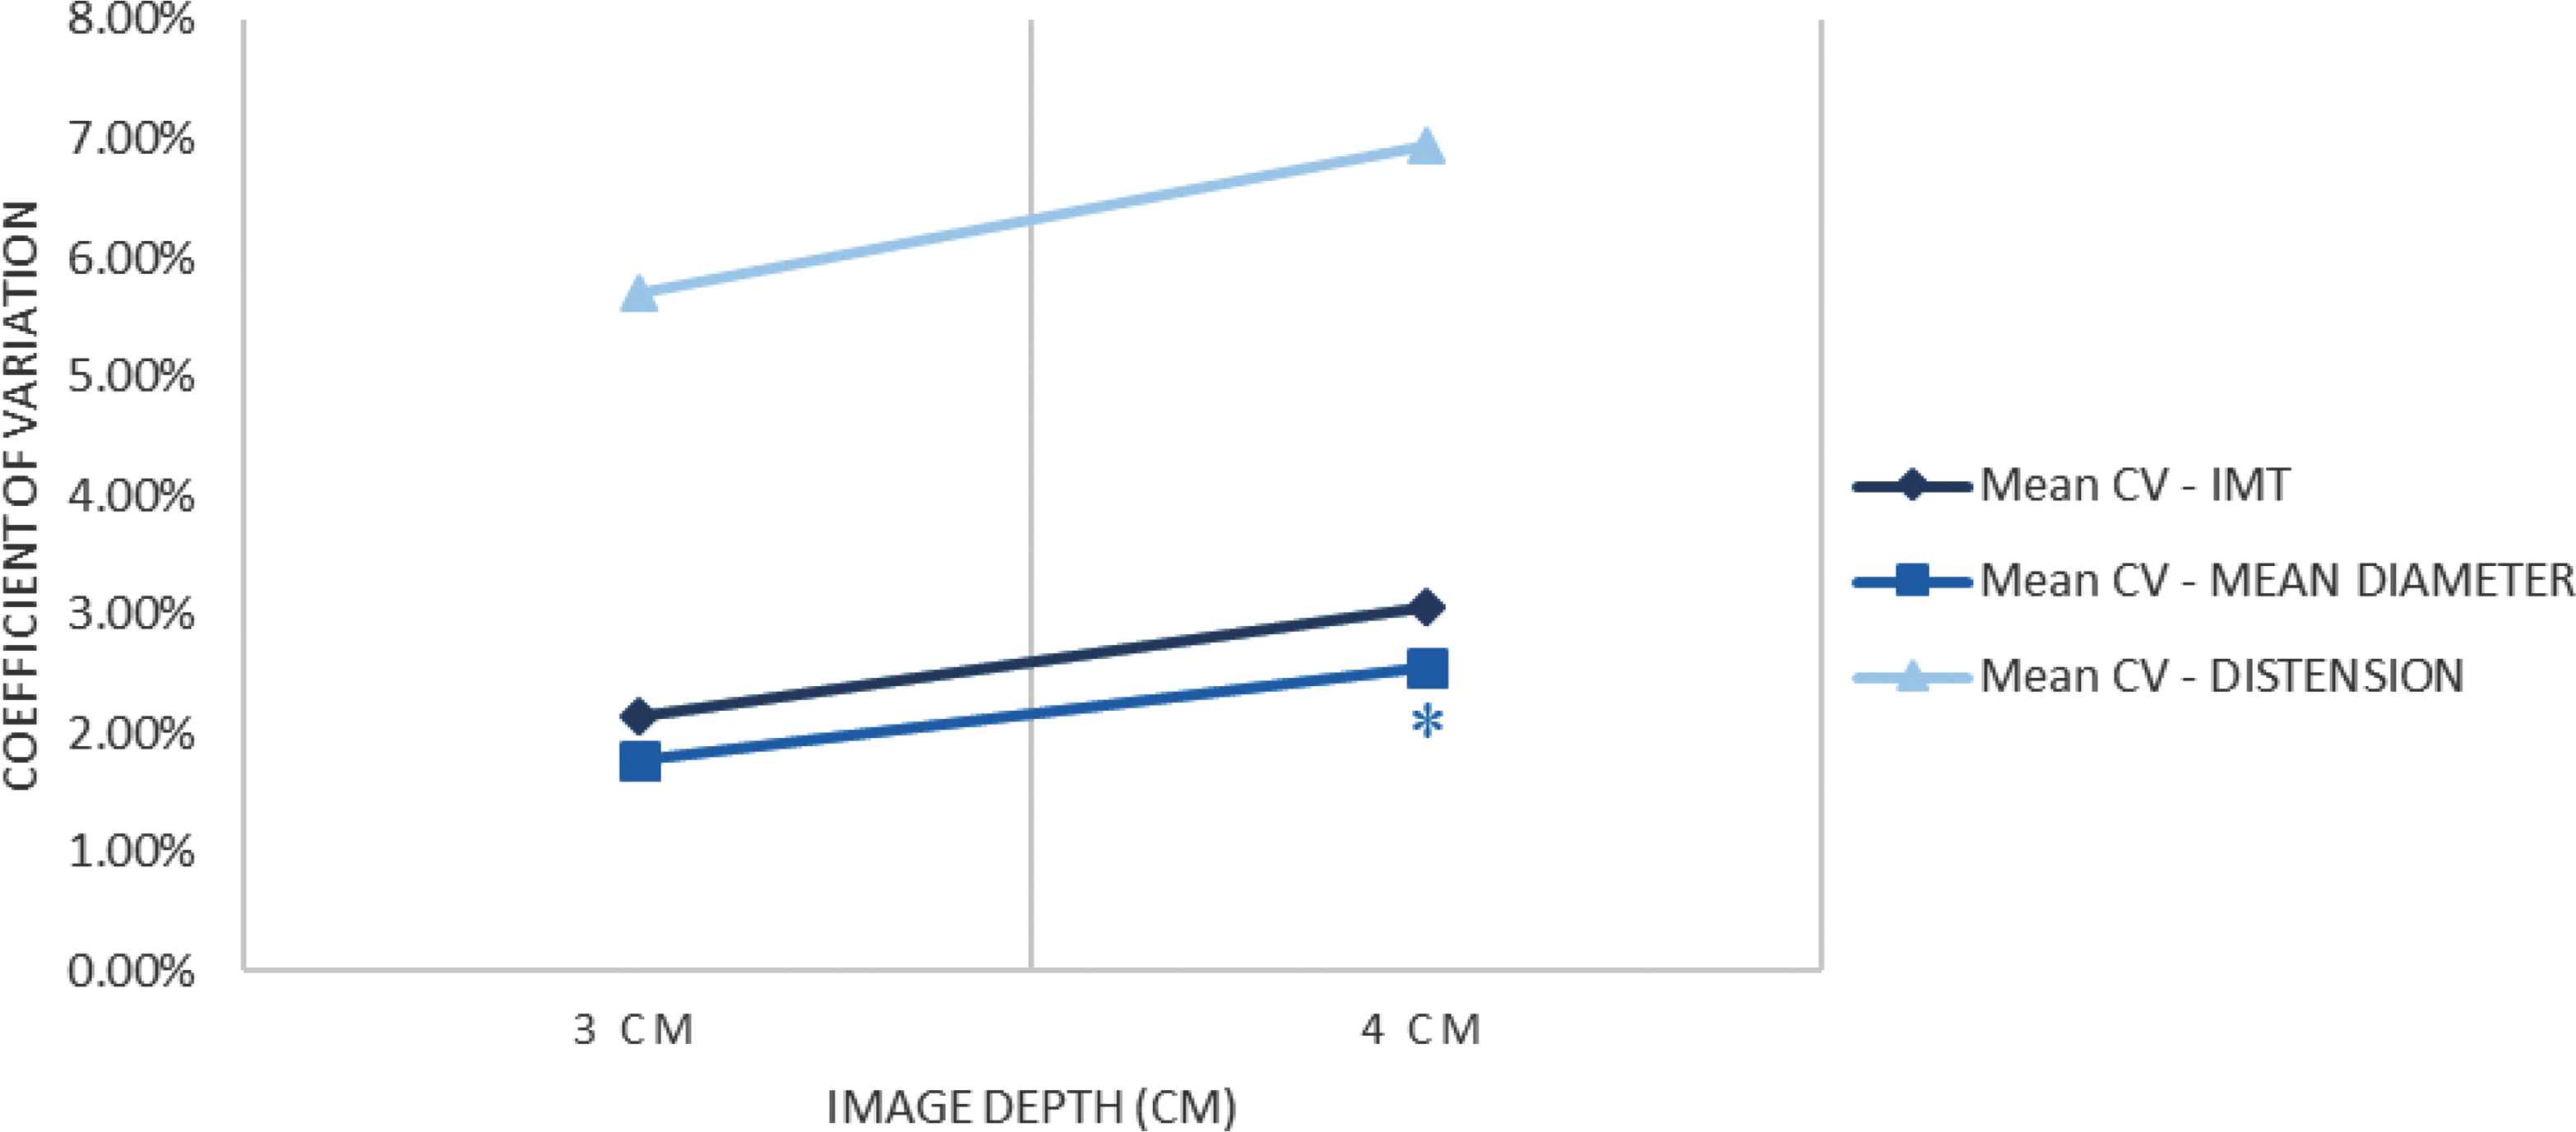
Coefficients of variation of the three main values when varying image depth. *p ≤ 0.05 vs. default setup (S1, 3 cm).
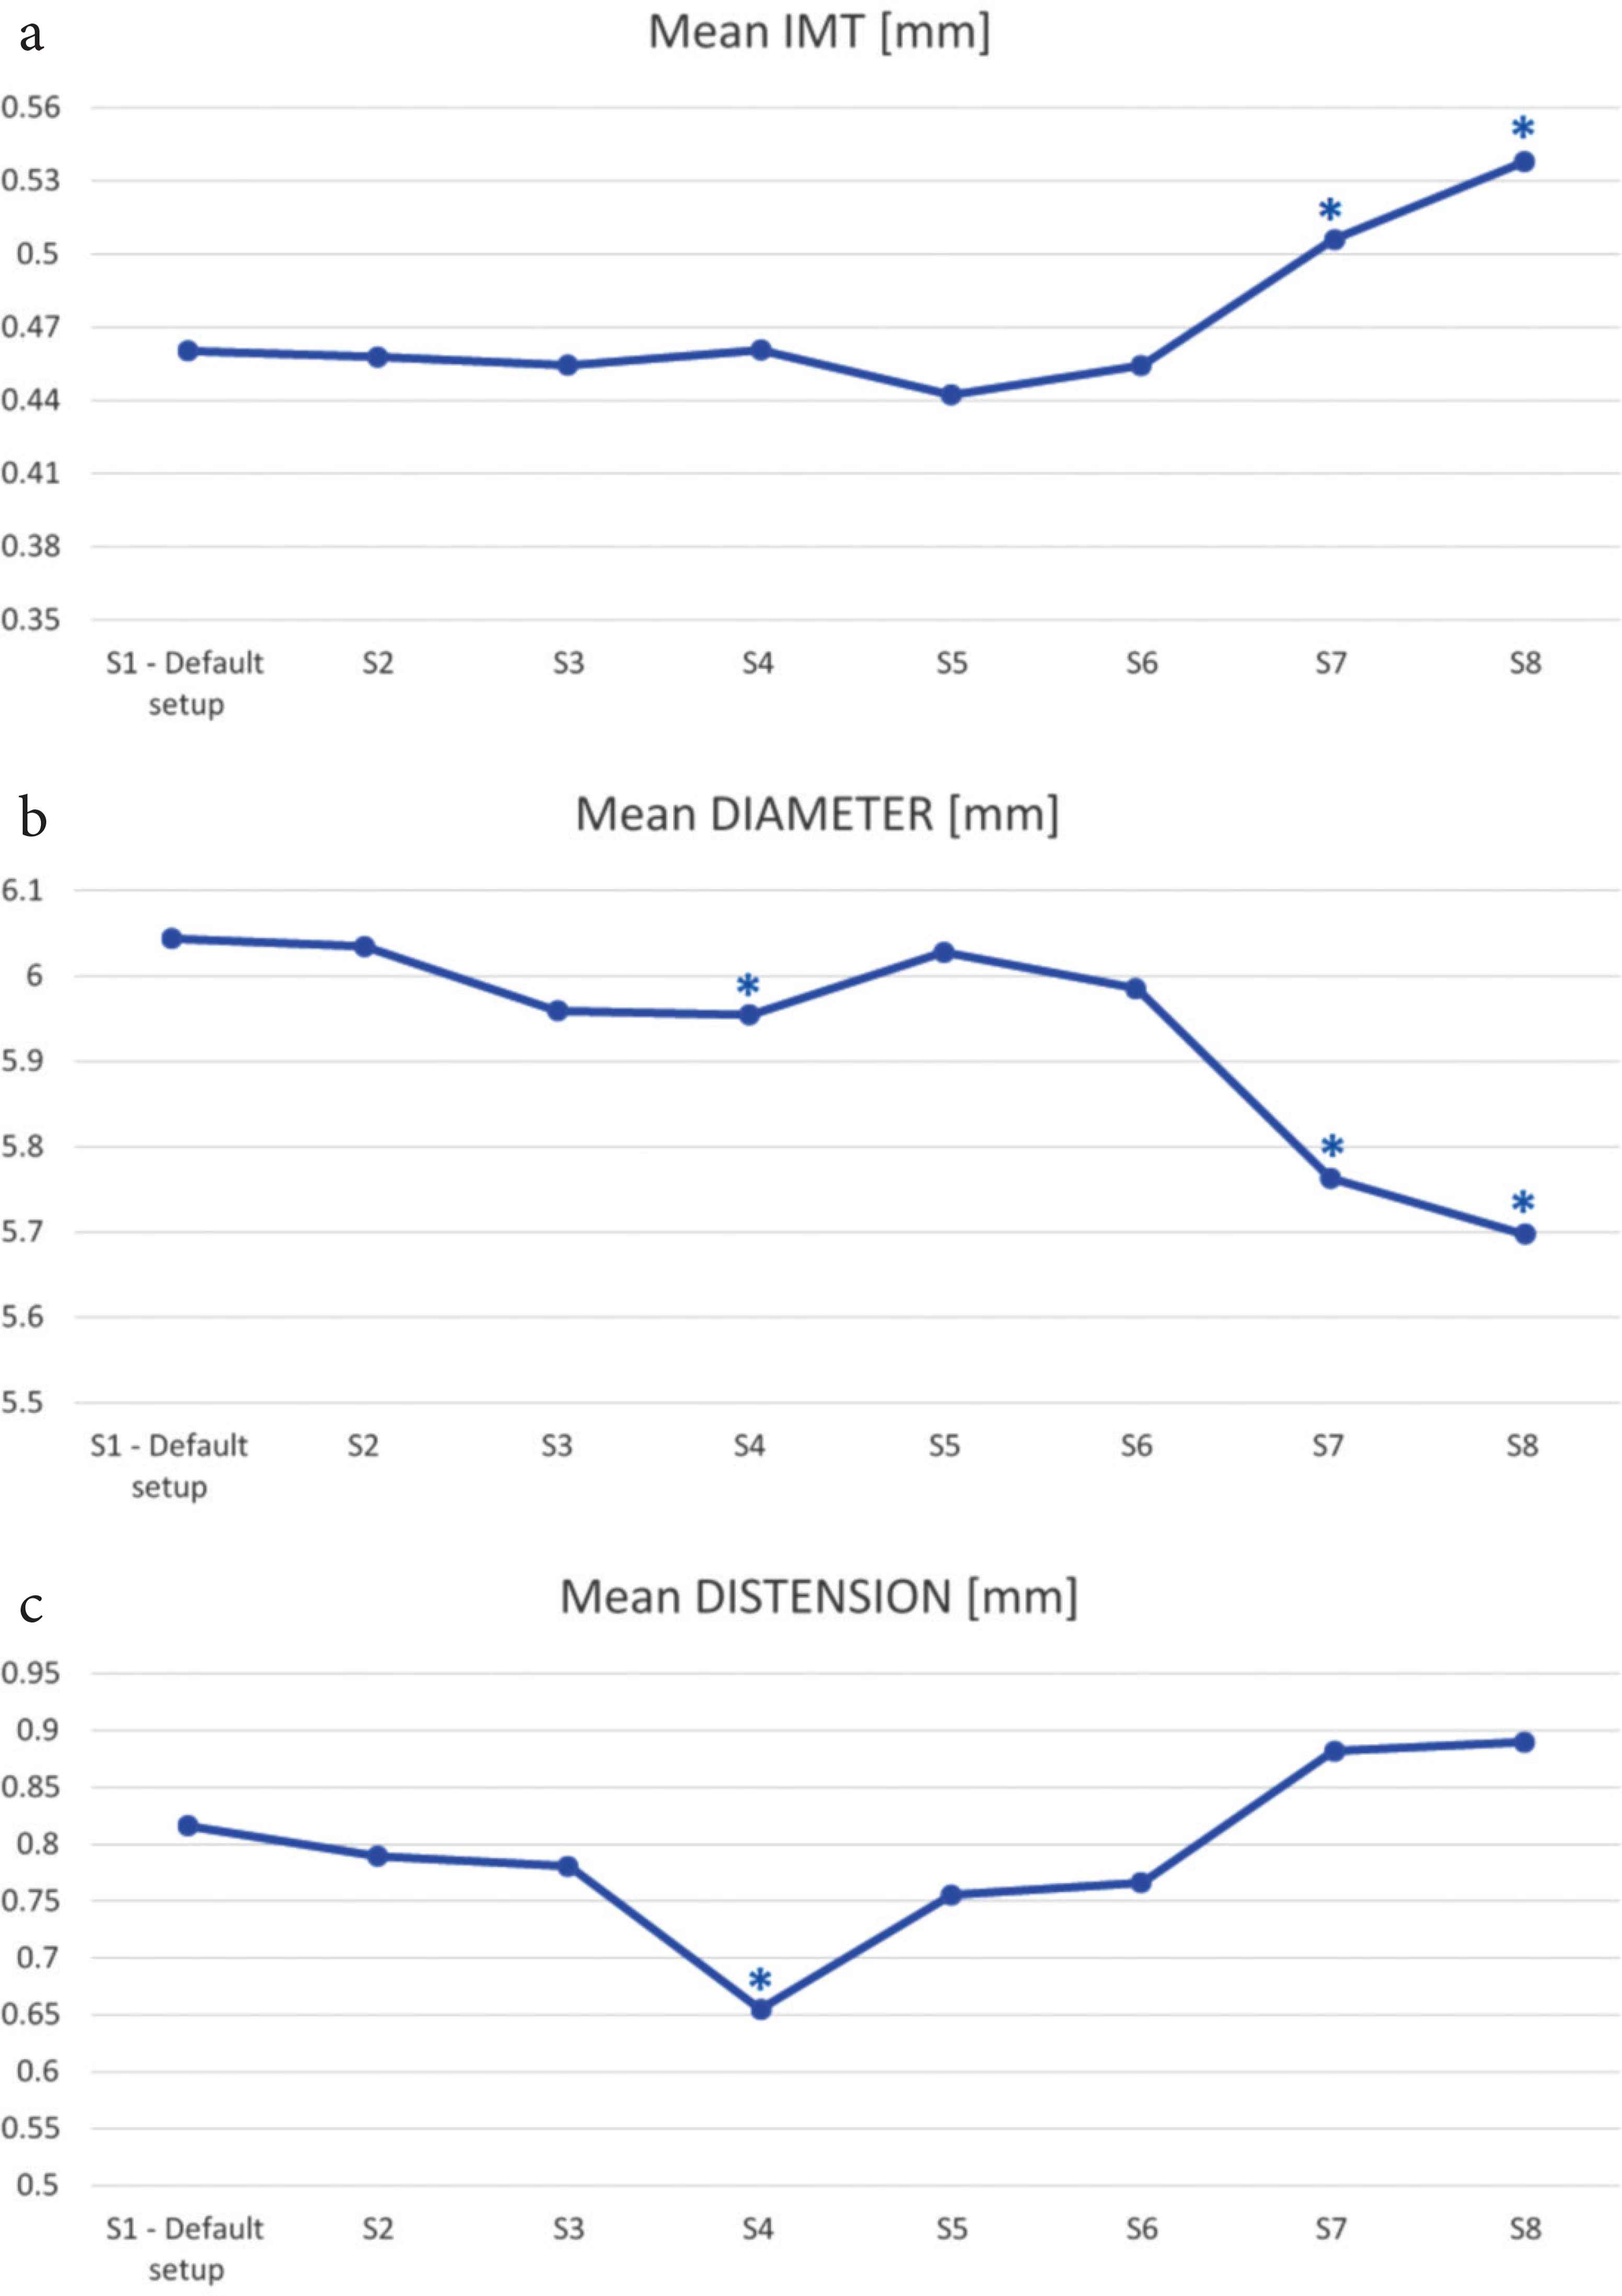
IMT (a), mean diameter (b) and distension (c) estimation on varying the ultrasound setup. *p ≤ 0.05 vs. default setup (S1).
3.2. Time Gain Compensation
Neither carotid parameter estimation nor their repeatability was affected by change in TGC (as reported in Tables 3 and 4).
3.3. Persistence
Mean diameter and distension values were underestimated significantly in the presence of the persistance filter (as shown in Figure 2b and 2c). In particular, mean diameter varied from 6.044 ± 0.040 mm in default condition to 5.955 ± 0.033 mm (p = 0.005) and distension values varied from 0.816 ± 0.019 mm to 0.655 ± 0.018 mm (p = 0.002). Conversely, when the persistence filter was activated none repeatability measurement was affected significantly.
3.4. Image Gain
A gain of 60 and 70 dB resulted in an overestimation of IMT (from 0.460 ± 0.001 mm to 0.506 ± 0.030 mm, p = 0.002 and to 0.538 ± 0.011 mm, p = 0.023) and an underestimation of the mean diameter (from 6.044 ± 0.040 mm to 5.763 ± 0.004 mm, p = 0.008 to 5.698 ± 0.225 mm, p = 0.002) compared with the default setup, as shown in Figure 2a and 2b. Compared with the default setup (50 dB gain), a gain of 70 dB caused also an increase of IMT coefficient of variation from 2.14 ± 1.92% to 6.85 ± 5.22% (p = 0.01) and mean diameter coefficient of variation from 1.79 ± 1.22% to 4.77 ± 4.71% (p = 0.05) as shown in Figure 3; the CV of the distension changed significantly both for a gain of 60 dB from 5.71 ± 4.31% to 10.84 ± 5.91% (p = 0.041) and for 70 dB compared with the default setup, increasing from 5.71 ± 4.31% to 12.59 ± 7.97% (p = 0.021). In addition, it was not technically possible to perform the measurement in two out of 14 cases with 60 dB and in two out of 14 cases with 70 dB.
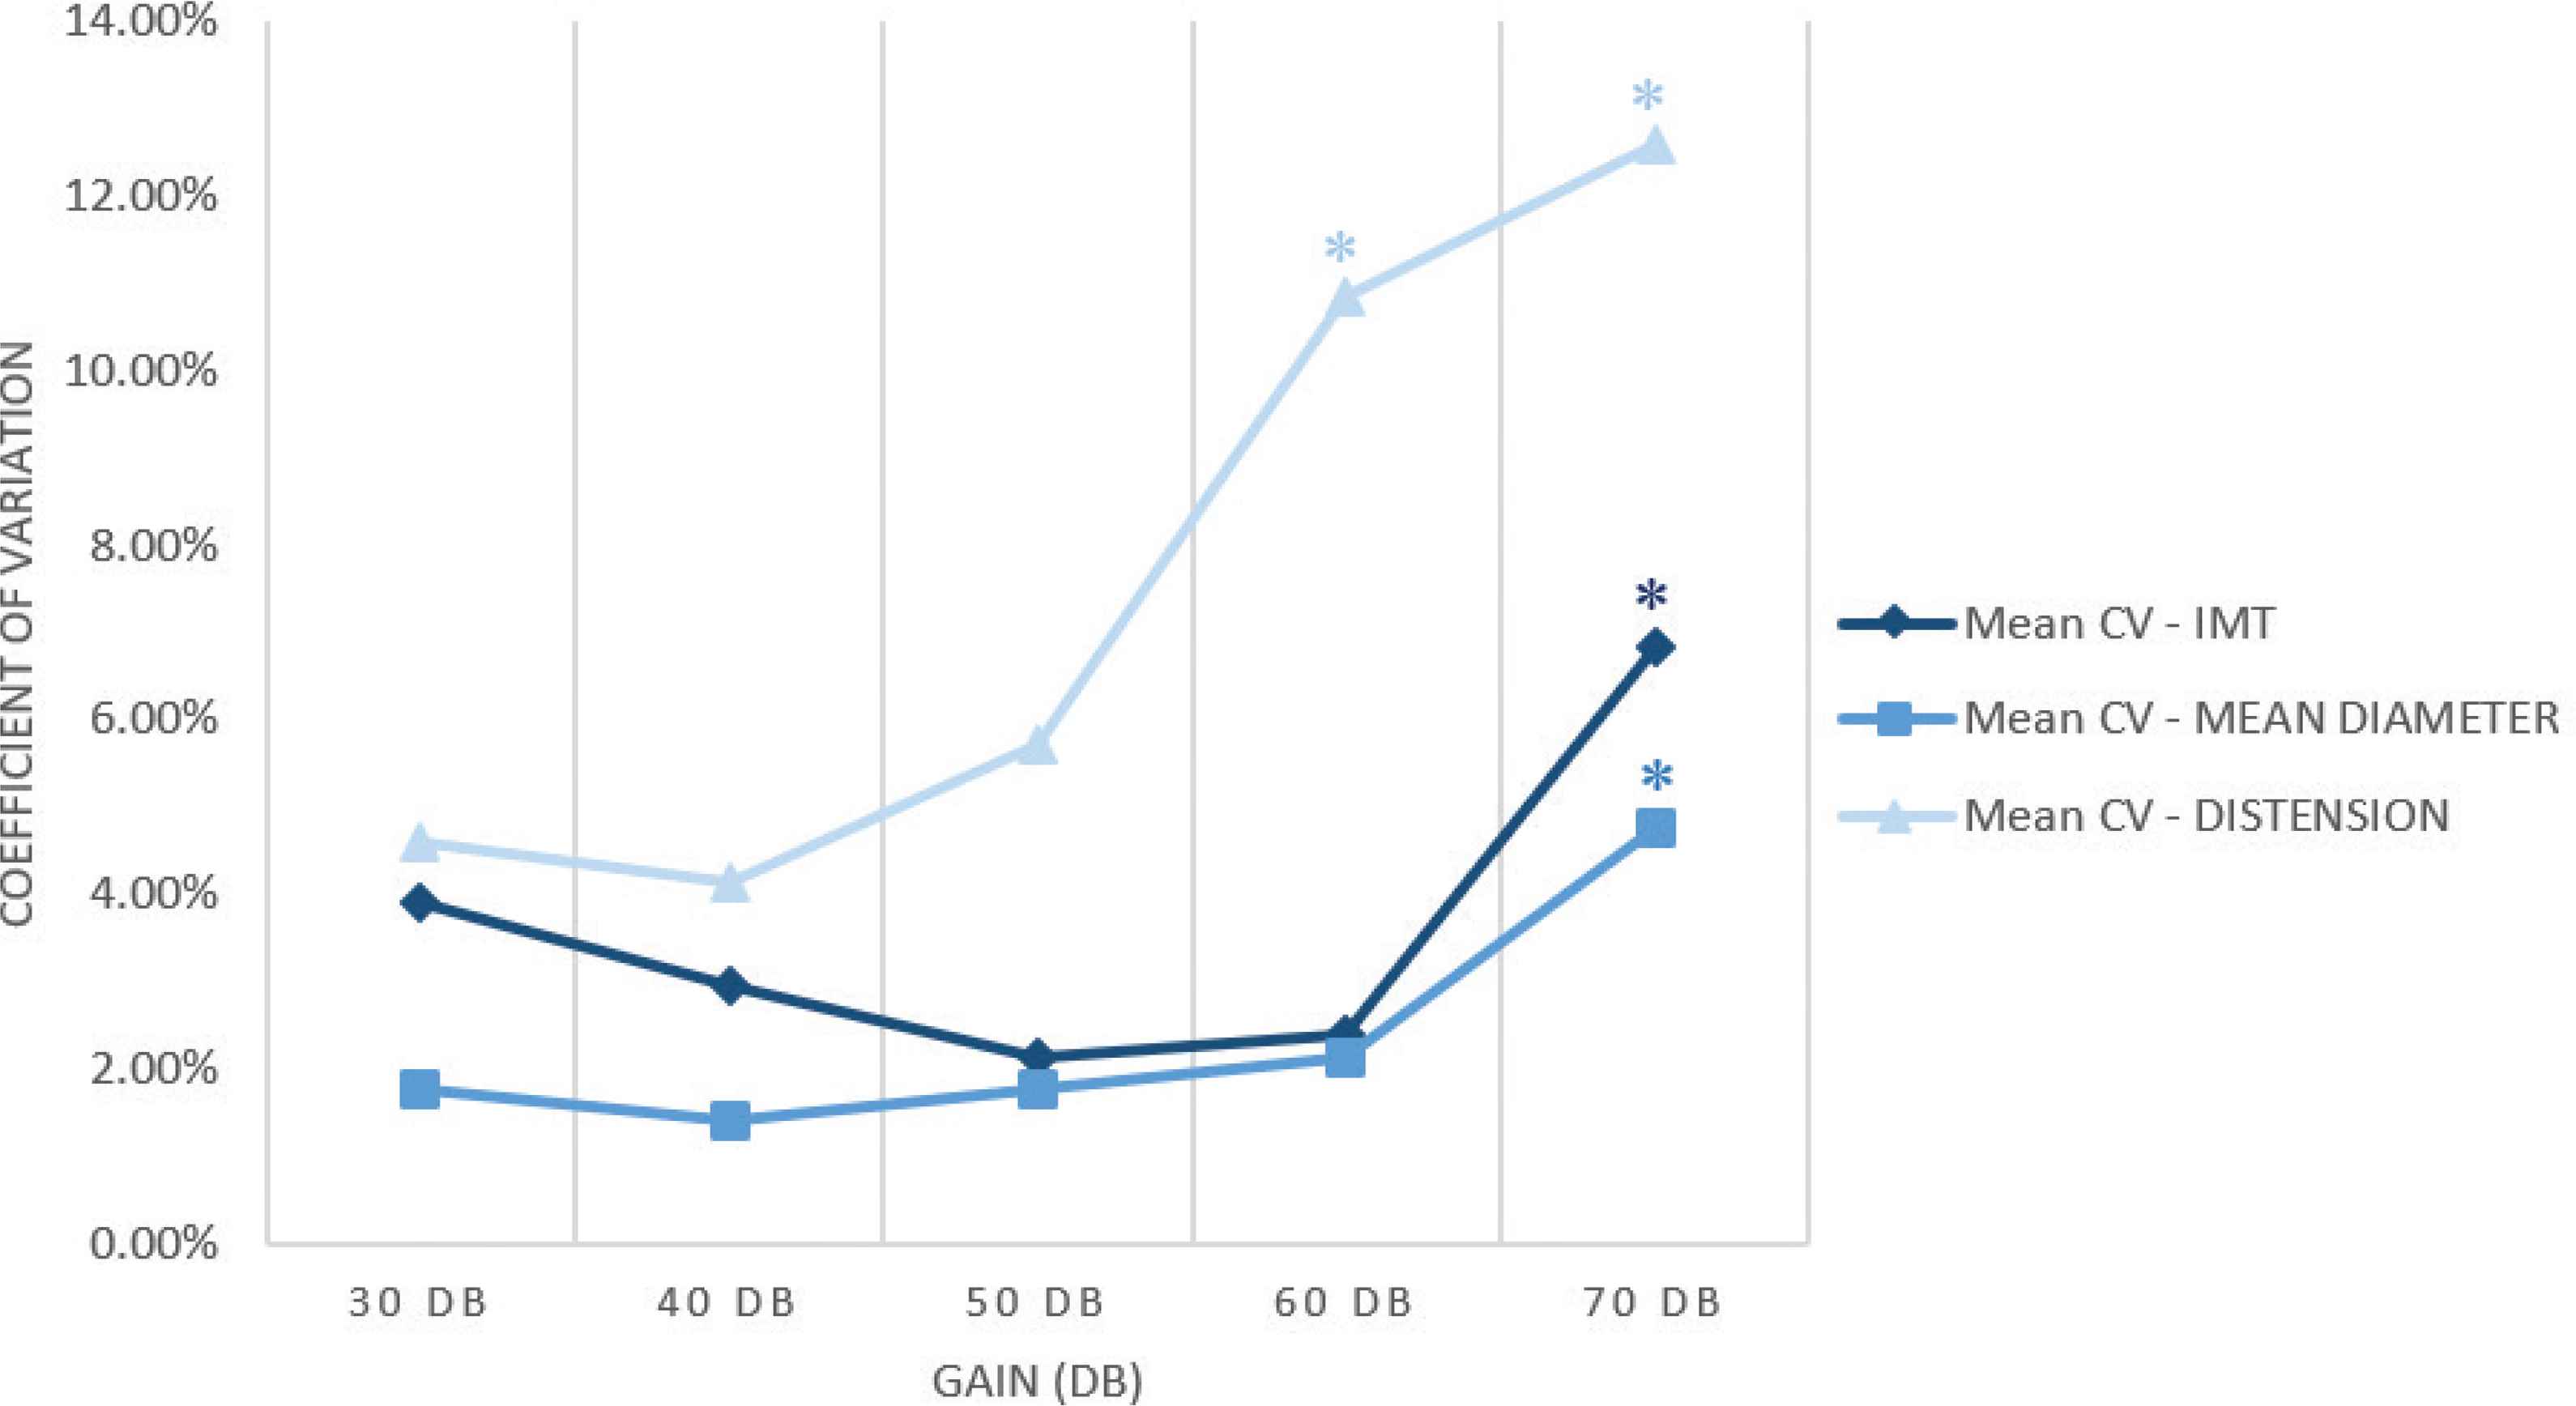
Coefficients of variation trend of the three main values on varying the image gain. The highlighted values (*) are statistically significant.
3.5. Anterior vs. Lateral Scans
Mean diameter estimation showed statistically significant differences when measured by different projection scans, both for left (p = 0.009) and right carotid artery (p = 0.006). Mean IMT, diameter and distension estimation are reported in Table 5 both for left and right carotid arteries, on varying the scan projection.
| Mean IMT (mm) | Mean diameter (mm) | Mean distension (mm) | |
|---|---|---|---|
| Right carotid - anterior scan | 0.461 ± 0.029 | 6.385 ± 0.621 | 0.833 ± 0.199 |
| Right carotid - lateral scan | 0.469 ± 0.030 | 6.652* ± 0.580 | 0.885 ± 0.189 |
| Left carotid - anterior scan | 0.460 ± 0.040 | 6.044 ± 0.467 | 0.816 ± 0.193 |
| Left carotid - lateral scan | 0.481 ± 0.058 | 6.309* ± 0.559 | 0.816 ± 0.180 |
p < 0.05 vs. anterior scan.
Estimation of mean IMT, mean diameter and mean distension of left and right carotid arteries, scanned with both anterior and lateral scans
Finally, repeatability of carotid measurements was not significantly different in the lateral scans compared with the anterior scans (IMT CV 2.73 ± 0.82% vs. 4.61 ± 0.25%, p = ns; distension CV 5.74 ± 0.05% vs. 7.24 ± 1.73%, p = ns; diameter CV 1.41 ± 0.14% vs. 1.69 ± 0.13%, p = ns).
4. DISCUSSION
Aim of our work was to investigate how different image settings may affect carotid biomarkers estimation performed by Carotid Studio, a semi-automatic software for assessing early imaging biomarkers of cardiovascular risk such as carotid IMT, diameter and distension with any ultrasound equipment. The adoption of automatic and semi-automatic systems ensures more reliable measures compared to the manual approach, anyway some technical issues should be considered. In particular, when using B-mode-based systems, the quality of the measurements and their reliability depend not only on the robustness of the adopted algorithm, but also on scan quality, which can be affected by device settings. The main result of study is that a significant decrease of Carotid Studio precision was shown at high gain values, resulting in a significant underestimation of both IMT and diameter. In addition, the activation of the persistence filter caused a significant underestimation of the distension and diameter values. Finally, mean diameter and distension estimations are also influenced by scan projection.
4.1. Impact of US Setups on Estimation and Reproducibility
At high gain values, IMT was overestimated while the mean diameter resulted underestimated compared with the measurements performed in default conditions. The distension value resulted slightly overestimated with high gain values even if not in a significant way; the level of significance was not reached probably because in about one third of cases it was not even possible to perform the measurement in these conditions. In addition, when using a high value of image gain, a significant decrease of Carotid Studio precision occurred, possibly due to the image grey-level saturation resulting in a significant change of the estimated values. In fact, a worsening of repeatability of the measurements was shown with 70 dB gain, as demonstrated by the significant increase of the coefficients of variation of all the parameters.
When increasing image depth, no significant changes in the parameter’s estimation were observed. However, it is worth noting that a slight (significant only for mean diameter) worsening of data repeatability, due to the intrinsic lower B-mode image resolution, can be observed. This phenomenon was expected and can be analytically computed. Let consider, for example, B-mode images of 512 × 512 pixels. The image resolution is 17.07 pixels/mm when the image depth is 3 cm and 12.8 pixels/mm when it is 4 cm. With these images and assuming an algorithm resolution of 0.1 pixel [14,15], we obtain that the system is able to detect spatial differences of 5.86 and 7.81 µm, respectively with 3 and 4 cm image depths. For example, considering an IMT of about 500 µm, it is possible to estimate a variation of 5.86/500 µm = 1.17% when using 3 cm image depth and of 7.81/500 µm = 1.56% for 4 cm depth. As a consequence, the final data precision is lower with a lower image resolution. More specifically, in our study the ratio between the two coefficients of variation 1.17/1.56 = 0.75, which is equal to the ratio between the two image depths: 3/4 cm = 0.75. These results confirm that changing in image depths, in particular increasing it, affects the repeatability of the measurements independently from the resolution of the adopted algorithm, due to the deterioration of the image resolution itself. For this reason, when imaging the common carotid artery, it is advisable to use the lowest depth attainable, provided that the acoustic window fully contains the region of interest. Future guidelines for carotid parameters assessment should take into account this observation, rather than recommending a fixed image depth [12].
Activation of the persistence filter led to a reduction of the diameter and distension detected values; the underestimation of the mean diameter, compared to the default setup, might be due to the different image provided by the equipment, which might result in a different localization of the grey level discontinuities by the mathematical operator [4]. Instead, image temporal filtering, due the presence of the persistence filter, might affect scan discontinuities and resulted in smoothing out the variation in instantaneous diameter curve, leading to an underestimation of the distension values.
4.2. Scan Angle
Regarding the use of the different approaches in scan acquisition, we observed that mean diameter and distension estimation were influenced by the projection. This might be probably due to possible variations related to the geometry of the carotid itself, leading to analysis of different vessel sections. This is a physiological aspect that obviously is not related to the adopted system but should be considered, for example, by recording the chosen projection for follow-up examinations [16]. Conversely, reproducibility of the three biomarkers estimation did not show any significant difference when changing the scan projection, confirming the robustness of the adopted mathematical operator in these conditions. However, it may be interesting to perform further analyses with a larger sample of subjects [17] and operators with various levels of skills in order to investigate if a real difference in scan quality might occur.
4.3. Strengths and Limitations
Some limitations of this study should be acknowledged. First, the cohort of participants is constituted by only 14 healthy, young subjects, and thus further studies are needed in order to translate these results in different populations, such as patients with cardiovascular risk factors. Second, our results are limited to one automated image analysis software and one ultrasound equipment. Indeed, as reported in Lobmaier et al. [18], not all image settings when comparing different ultrasound systems could be perfectly paired; extension of this validation protocol to different ultrasound equipments is advisable. Finally, the effect of the combination of multiple settings variation is still unknown.
5. CONCLUSION
In conclusion, the precision and repeatability of an algorithm for semi-automated image analysis, Carotid Studio, is satisfactory for a wide range of ultrasound settings. Remarkable exceptions are the use of global gain values of 60 dB and higher and the persistence filter, which hence should be avoided. The scan projection seems to influence carotid parameter estimation but not its repeatability, thus it should be documented and replicated within the same study protocol in order to obtain reliable results. Finally, image depth should be kept at the lowest attainable values in order to improve repeatability.
CONFLICTS OF INTEREST
Elisabetta Bianchini, Vincenzo Gemignani, Francesco Faita and Lorenzo Ghiadoni are co-founders of QUIPU s.r.l., Pisa, Italy a spin-off company of the Italian National Research Council and the University of Pisa.
AUTHORS’ CONTRIBUTION
MF contributed in conceptual, writing (original draft) and investigation (project’s PI). RMB and EB contributed in conceptual, supervision and writing (review and editing) the manuscript. VG and NDL contributed in methodology, software, formal analysis and data curation. FF contributed in methodology, writing (review and editing) the manuscript. RG contributed in investigation (ultrasound acquisition) and data curation. LG contributed in methodology and writing (review and editing) the manuscript.
FUNDING
This study was partially funded by
DISCLOSURE
An earlier version of this work was presented as a poster at Artery 18 Annual Meeting in Guimaraes, Portugal (2018).
Footnotes
REFERENCES
Cite this article
TY  - JOUR
AU  - Martina Francesconi
AU  - Vincenzo Gemignani
AU  - Rachele Gherardini
AU  - Nicole Di Lascio
AU  - Francesco Faita
AU  - Lorenzo Ghiadoni
AU  - Rosa Maria Bruno
AU  - Elisabetta Bianchini
PY  - 2019
DA  - 2019/12/05
TI  - Influence of Ultrasound Settings on Carotid Biomarker Assessment by B-mode Image Processing
JO  - Artery Research
SP  - 139
EP  - 144
VL  - 25
IS  - 3-4
SN  - 1876-4401
UR  - https://doi.org/10.2991/artres.k.191127.001
DO  - 10.2991/artres.k.191127.001
ID  - Francesconi2019
ER  -