
Decoupling of Heart Rate and Blood Pressure: Hemodynamic Counter-regulatory Mechanisms and their Implications
- DOI
- 10.2991/artres.k.191210.001How to use a DOI?
- Keywords
- Arterial pressure decay; hemodynamics; arterial capacitance; arterial regions
- Abstract
To investigate the dynamic relationships among Heart Rate (HR) and systemic hemodynamics in everyday life, we performed 24-h ambulatory pulse wave analyses (Mobil-O-Graph) in individuals with normal and elevated BP (n = 116) and in a double-blinded cross-over study where HR was varied pharmacologically (n = 24). In the whole cohort and in the low [24-h mean Systolic BP (SBP) < 135 mmHg] and high (SBP ≥ 135 mmHg) groups, mean HR did not correlate with mean SBP but did correlate strongly and negatively with Stroke Volume Index (SVI) and Systemic Vascular Resistance Index (SVRI) over 24 h and during night-time and daytime periods (all p < 0.000). SVI varied by about 0.2 mL/m2 per bpm in both BP groups, while SVRI varied by about 0.03 and 0.01 mmHg.s.m2/mL per bpm in the high and low BP groups, respectively, p < 0.001). On stepwise multiple linear regression, there was greater sensitivity of SVI to HR in Blacks and younger individuals, and greater sensitivity of SVRI to HR with age in addition to higher SBP. In a crossover study (monotherapy for 1 month each with nebivolol or valsartan), BP was constant throughout, while SVI and SVRI varied inversely with HR as in the main cohort with similar intercepts and coefficients; the regression equations on either drug predicted the same SVI or SVRI at HR of 70 bpm. We conclude that the decoupling of BP from HR is facilitated by the continuous counter-regulation of SVI and SVRI against HR and that HR is the primary hemodynamic setpoint. These findings have implications for pathogenetic studies and imply that hemodynamic measurements should be corrected for HR.
- Copyright
- © 2019 Association for Research into Arterial Structure and Physiology. Publishing services by Atlantis Press International B.V.
- Open Access
- This is an open access article distributed under the CC BY-NC 4.0 license (http://creativecommons.org/licenses/by-nc/4.0/).
1. INTRODUCTION
The classic approach to systemic hemodynamics has been based on a steady-state electrical circuit model (Ohm’s Law), where Blood Pressure (BP) is the product of “total” blood flow (cardiac output) and Systemic Vascular Resistance (SVR). In this model, dependency on Heart Rate (HR) is often ignored despite the fact that cardiac output is the product HR and cardiac Stroke Volume (SV). Under different clinical and physiological situations, HR and BP can vary in parallel, in opposite directions, or independently, all of which are coordinated by the central nervous system. For example, HR and BP increase in parallel acutely during exercise stress [1] and in “white coat-type” patients [2–4] but vasodilator drugs or physiological vasodilation can cause a reflex increase in HR unless the antihypertensive drug or physiologic stimulus also attenuates cardiac sympathetic outflow (e.g. by direct negative chronotropic effect as with a beta-blocker or by parallel parasympathetic activation) [5–8]. During casual observations, HR and BP appear to be largely uncorrelated [9–13].
From the formula BP = HR * SV * SVR, it is obvious that a decrease in any of the three hemodynamic determinants of BP will tend to lower BP—unless there is a compensatory increase in at least one of the other two determinants. Even though changes in HR can represent a secondary response to a primary change in vasomotor tone, it is also true that a primary change in HR can trigger a series of linked hemodynamic compensations. Specifically, if HR is lowered pharmacologically with a beta-blocker, BP will not decrease if the combined homeostatic effect of increased in cardiac filling time (and end-diastolic volume and SV) and increased SVR fully compensate for the lower HR [1,14,15]. Another example is that HR and late-systolic pressure augmentation are inversely related (augmentation index is proportional to SVR [16,17] and is increased by beta-blockers) [18–20].
A major barrier to clinically relevant hemodynamic profiling has been the absence of methods that track these variables over time and in different physiological situations. The development of cuff-based 24-h ambulatory pulse wave analysis with hemodynamic monitoring (Mobil-O-Graph, I.E.M., Stolberg, Germany) allows the collection of data over a much wider range than traditional supine hemodynamic analyses [21–24]. The present study was undertaken to evaluate whether there are indeed dynamic relationships among ambulatory HR, SV, and SVR throughout the day and how these variables are interrelated. We studied a cohort of normotensive and hypertensive individuals to ascertain whether such relationships were affected by chronic BP elevation or by age, race, and gender. We also investigated the possible role of HR as a primary hemodynamic determinant in a double-blinded crossover study of monotherapy beta-blocker (nebivolol) and angiotensin receptor blocker (valsartan).
2. MATERIALS AND METHODS
2.1. Subject Selection
Our convenience cohort included individuals who completed successful 24-h ambulatory BP and hemodynamic monitoring for clinical reasons (e.g. suspicion of white coat or secondary hypertension, evaluation of efficacy of BP control or need for drug therapy) or upon personal request, spanning both genders, two races, and a wide range of age, HR, BP, height and body weight values. In the cohort study, data analysis occurred in a de-identified dataset and their inclusion did not require informed consent. In the interventional study, subjects signed informed consent and were monitored by the Health Sciences IRB of the University at Buffalo.
2.2. Ambulatory Hemodynamic Monitoring Protocol
We used an oscillometric pulse wave analysis system (Mobil-O-Graph, I.E.M., Stolberg, Germany) to record BP and hemodynamic variables [HR, Cardiac Output (CO), SV and SVR] at 20-min intervals throughout the day and night. Studies with at least 70% adequate readings were accepted for analysis. SV for each BP determination was calculated from the corresponding HR and CO values; SV and SVR were then normalized by standard height and weight-based body-surface area nomograms to yield SV Index (SVI, in mL/m2) and SVR Index (SVRI, in mmHg.s.m2/mL). We analyzed data over 24 h, and during night-time (self-reported sleep period) and daytime.
2.3. Nebivolol–valsartan Crossover Study
The experimental design and primary results of our study of the effects of nebivolol, valsartan, and their combination on cardiac load have been published previously [25]. In brief, males and females over 18 years of age with chronic hypertension, treated or untreated, were included if their seated mean clinic Systolic BP (SBP) on at least two occasions was in the range of 145–179 mmHg or their mean seated clinic Diastolic BP (DBP) was 92–119 mmHg. The protocol was a double-blinded, double-dummy, forced-titration, random-order-entry crossover design with three experimental periods of 4 weeks each: valsartan 320 mg daily, nebivolol 40 mg daily, and the combination; there was a 1-week introductory period of half-maximal dose for each drug. Ambulatory 24-h pulse wave analysis (Mobil-O-Graph) was performed after 4 weeks on each drug. Full data were available in 24 patients. A pre-specified secondary analysis was the direct hemodynamic comparison of monotherapies (valsartan vs. nebivolol).
2.4. Statistical Analysis
Data were analyzed with IBM-SPSS software, version 20 (Armonk, NY, USA). Unpaired t-tests were used to compare the clinical characteristics of the low and high BP groups. Standard Pearson linear regressions were performed for comparisons of BP with HR. The nonlinear relationships of SVI-HR and SVRI-HR necessitated that we use of natural logarithm-transformed values. The regression equations derived were reported and graphed as 24-h mean SVI (or SVRI) vs. ln[mean 24-h HR]. We used stepwise forward multiple linear regression analysis to identify whether any simple demographic characteristic (age, race, gender, height, weight) influenced the lnSVI-HR and lnSVRI-HR relationships.
3. RESULTS
Table 1 summarizes the demographic and hemodynamic characteristic of the study population as a whole and of the low and high BP populations created by dichotomizing around a 24-h mean SBP of 135 mmHg. In all, 116 individuals were studied; for the 24 participants in the valsartan–nebivolol crossover study, the first 24-h monitoring study was also used in the cohort analysis. Full data regarding antihypertensive drug use were not available in all subjects.
| Group | ALL | Systolic BP (SBP) < 135 | SBP ≥ 135 | p* |
|---|---|---|---|---|
| Total (n) | 116 | 63 | 53 | |
| Female (n) | 66 | 33 | 33 | |
| African-American (n) | 36 | 14 | 22 | |
| Age (years) | 58 (16) | 55 (18) | 61 (13) | 0.038 |
| Weight (kg) | 82 (19) | 78 (18) | 87 (19) | 0.007 |
| Height (m) | 1.66 (0.10) | 1.68 (0.10) | 1.65 (0.11) | 0.150 |
| 24-h ambulatory values | ||||
| SBP | 134 (19) | 120 (11) | 151 (13) | 0.000 |
| Mean arterial pressure | 105 (15) | 94 (8.5) | 118 (10) | 0.000 |
| Diastolic BP (DBP) | 80 (13) | 72 (8.8) | 90 (10) | 0.000 |
| Pulse pressure | 54 (12) | 48 (9.0) | 61 (11) | 0.000 |
| Central SBP | 122 (17) | 110 (9.7) | 137 (12) | 0.000 |
| Heart rate | 69.5 (11) | 70.0 (10) | 69.0 (12) | 0.638 |
| Stroke volume index (mL/m2) | 36.6 (5.2) | 36.3 (5.4) | 37.0 (5.0) | 0.459 |
| Systemic vascular resistance index (mmHg.s.m2/mL) | 2.6 (0.51) | 2.3 (0.34) | 2.9 (0.5) | 0.000 |
| Daytime ambulatory values | ||||
| SBP | 136 (23) | 124 (11) | 151 (25) | 0.000 |
| Mean arterial pressure | 109 (15) | 98 (8.9) | 121 (10) | 0.000 |
| DBP | 84 (13) | 76 (9.3) | 93 (10) | 0.000 |
| Pulse pressure | 54 (12) | 49 (9.8) | 61 (11) | 0.000 |
| Central SBP | 126 (17) | 114 (10) | 141 (12) | 0.000 |
| Heart rate | 71.8 (12) | 72.8 (11) | 70.6 (13) | 0.328 |
| Stroke volume index (mL/m2) | 36.5 (5.1) | 36 (5.3) | 37 (4.9) | 0.192 |
| Systemic vascular resistance index (mmHg.s.m2/mL) | 2.6 (0.5) | 2.4 (0.35) | 2.9 (0.5) | 0.000 |
| Night-time values | ||||
| SBP | 128 (22) | 113 (13) | 146 (18) | 0.000 |
| Mean arterial pressure | 99 (18) | 88 (11) | 113 (14) | 0.000 |
| DBP | 75 (15) | 66 (10) | 85 (13) | 0.000 |
| Pulse pressure | 54 (13) | 47 (9.0) | 61.3 (12) | 0.000 |
| Central SBP | 118 (20) | 105 (12) | 133 (16) | 0.000 |
| Heart rate | 65.5 (11) | 65.2 (10) | 65.8 (12) | 0.754 |
| Stroke volume index (mL/m2) | 37.2 (6.1) | 37.3 (6.8) | 37.2 (5.3) | 0.895 |
| Systemic vascular resistance index (mmHg.s.m2/mL) | 2.6 (0.57) | 2.3 (0.4) | 2.9 (0.6) | 0.000 |
p-values compare low and high BP subgroups. Data are presented as mean (SD). All BP values are in mmHg. BP, blood pressure; HR, heart rate.
Study population
Figure 1 demonstrates the general lack of correlation between 24-h HR and mean 24-h SBP and DBP in both low and high BP populations. There was a very weak association between 24-h HR and 24-h DBP only in the low BP group (r2 = 0.08, p = 0.05).
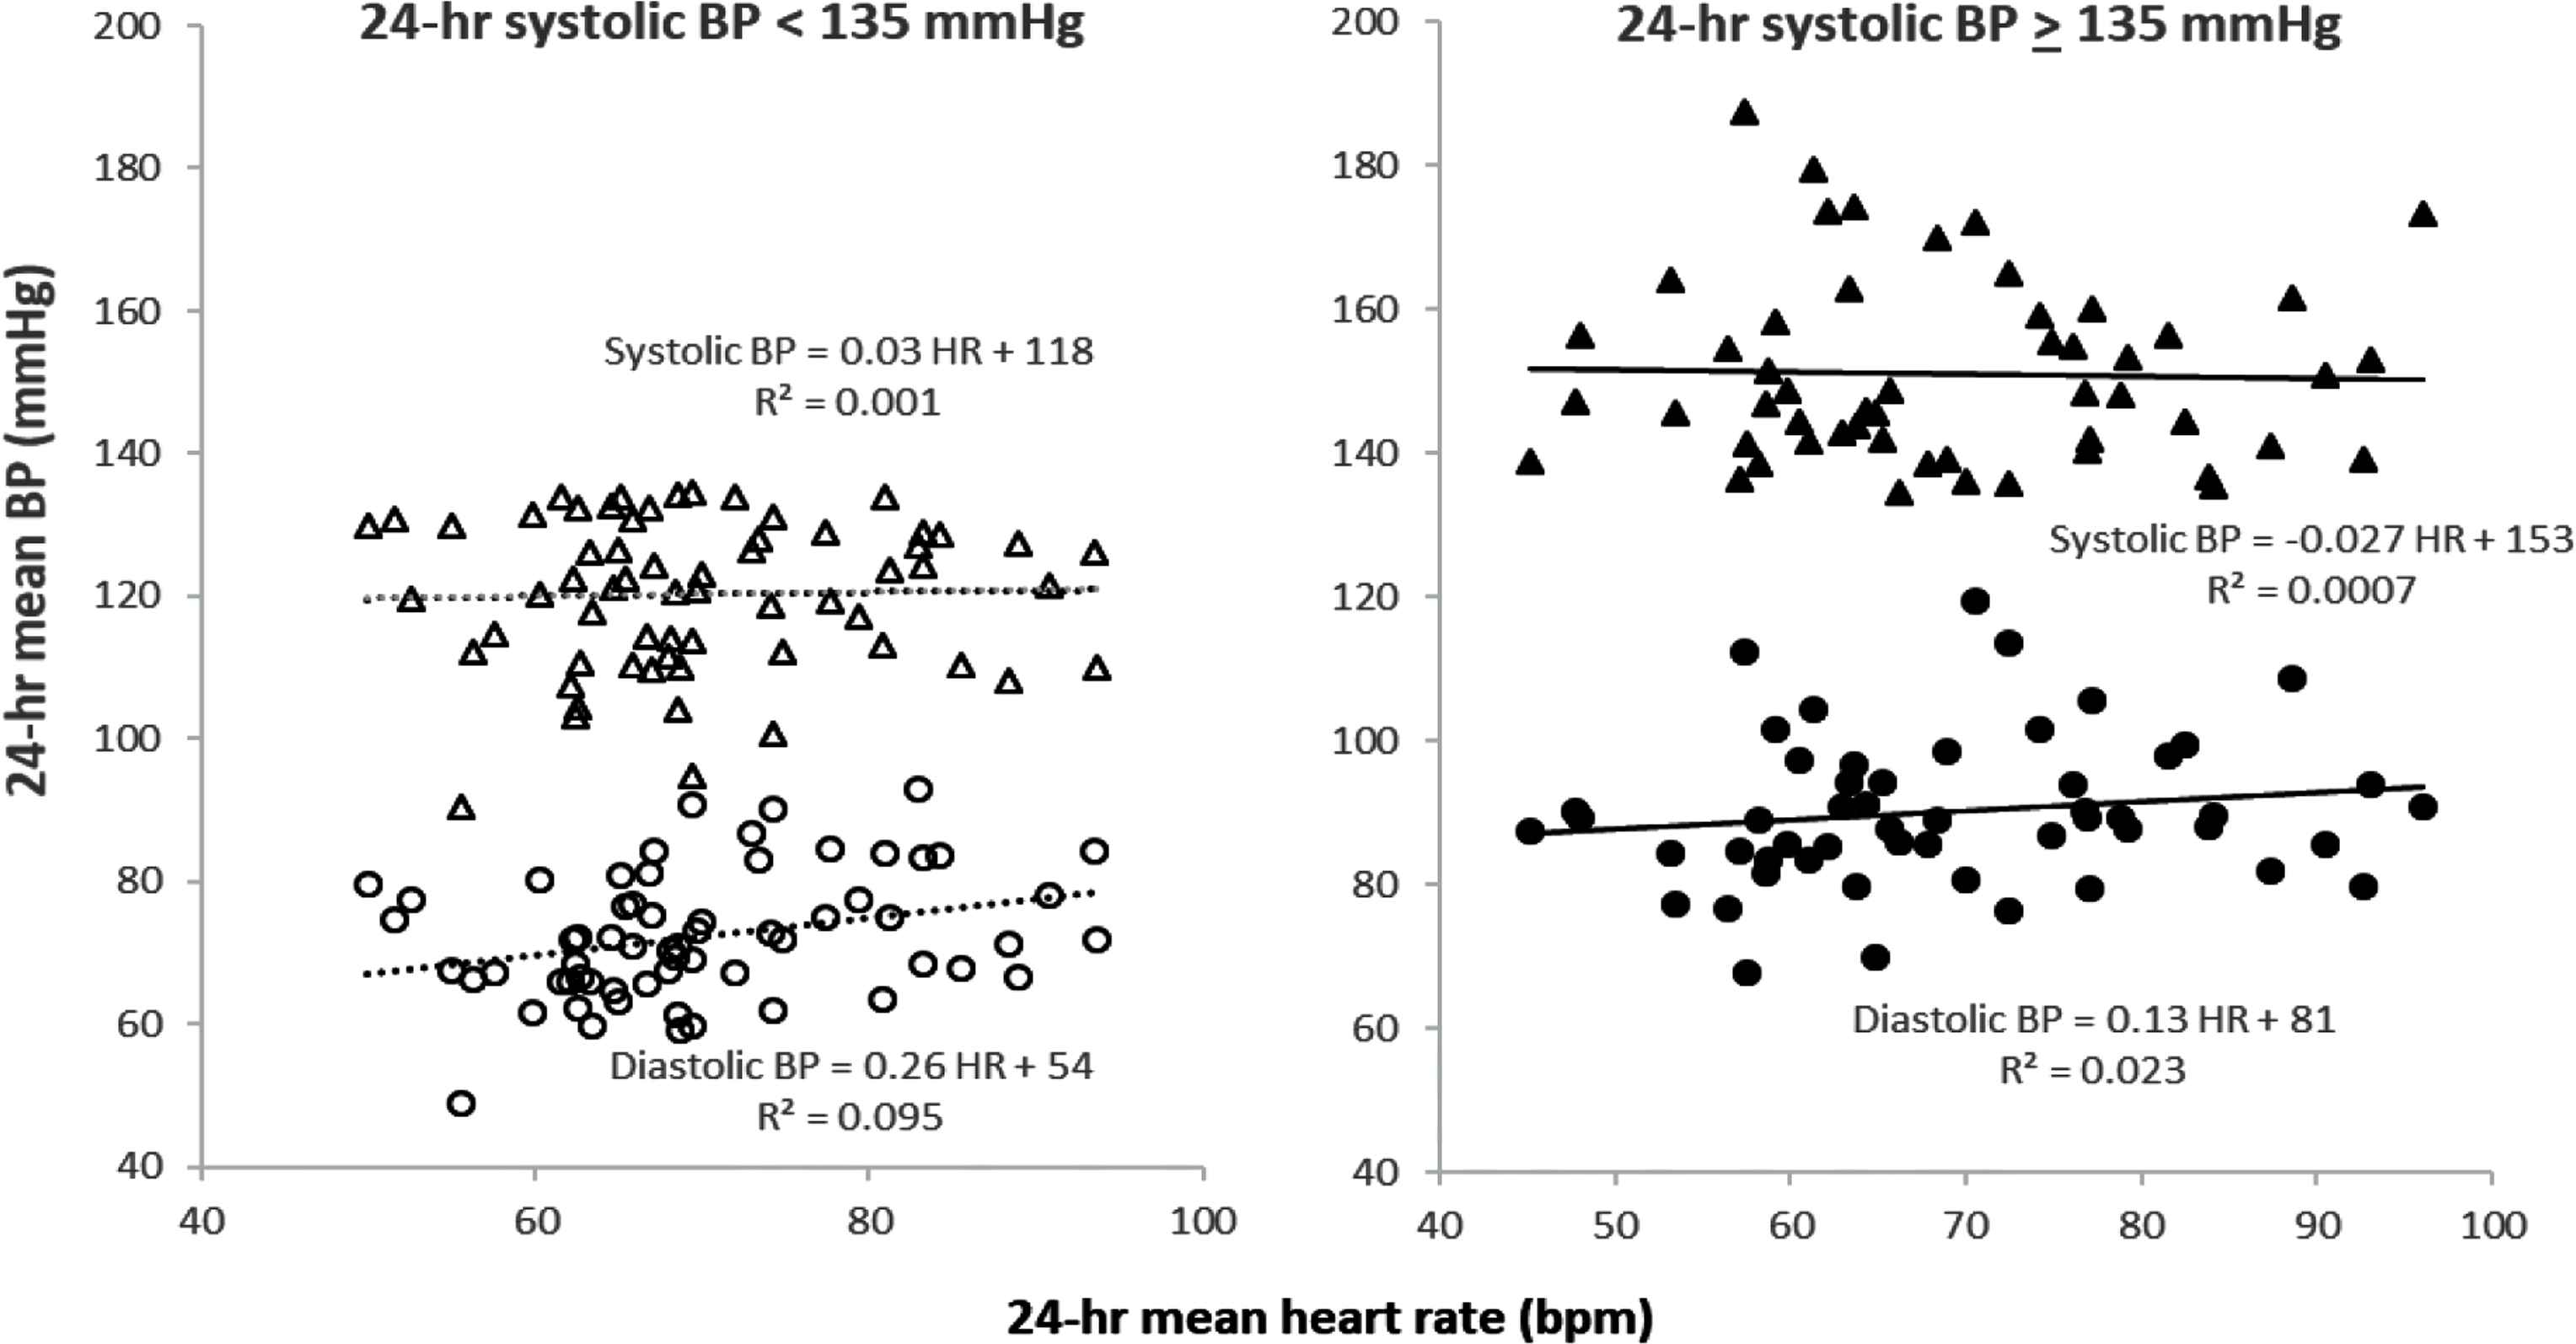
Dissociation of 24-h mean heart rate and 24-h mean systolic and diastolic BP in low (left panel) and high (right panel) BP groups. Near-zero values for r2 and the corresponding flat slopes of the linear regressions document the lack of association of 24-h mean HR and 24-h mean systolic BP in both groups. A weak association between 24-h mean HR and 24-h mean diastolic BP was present in the low BP group (p < 0.05) but not in the high BP group.
Figure 2 demonstrates strong negative correlations between ln[24-h mean HR] and the corresponding 24-h means of SVI and SVRI in the low and high BP groups (r2 between 0.14 and 0.39, p < 0.000 each). These correlations were almost as strong for linear models. The negative slopes of the SVI-lnHR and SVRI-lnHR regressions also serve as approximations of the sensitivities or “gains” of HR on SVI and SVRI. Similar relationships were found within individuals but this analysis was not included in the present report. Overall, a change in HR of 1 bpm caused a corresponding change in SVI of about 0.2 mL/m2 in both the low and high BP groups; for SVRI-lnHR, we observed greater HR sensitivity in the high (compared with low) BP group (0.026 vs. 0.011 mmHg.s.m2/mL per bpm, p < 0.000).
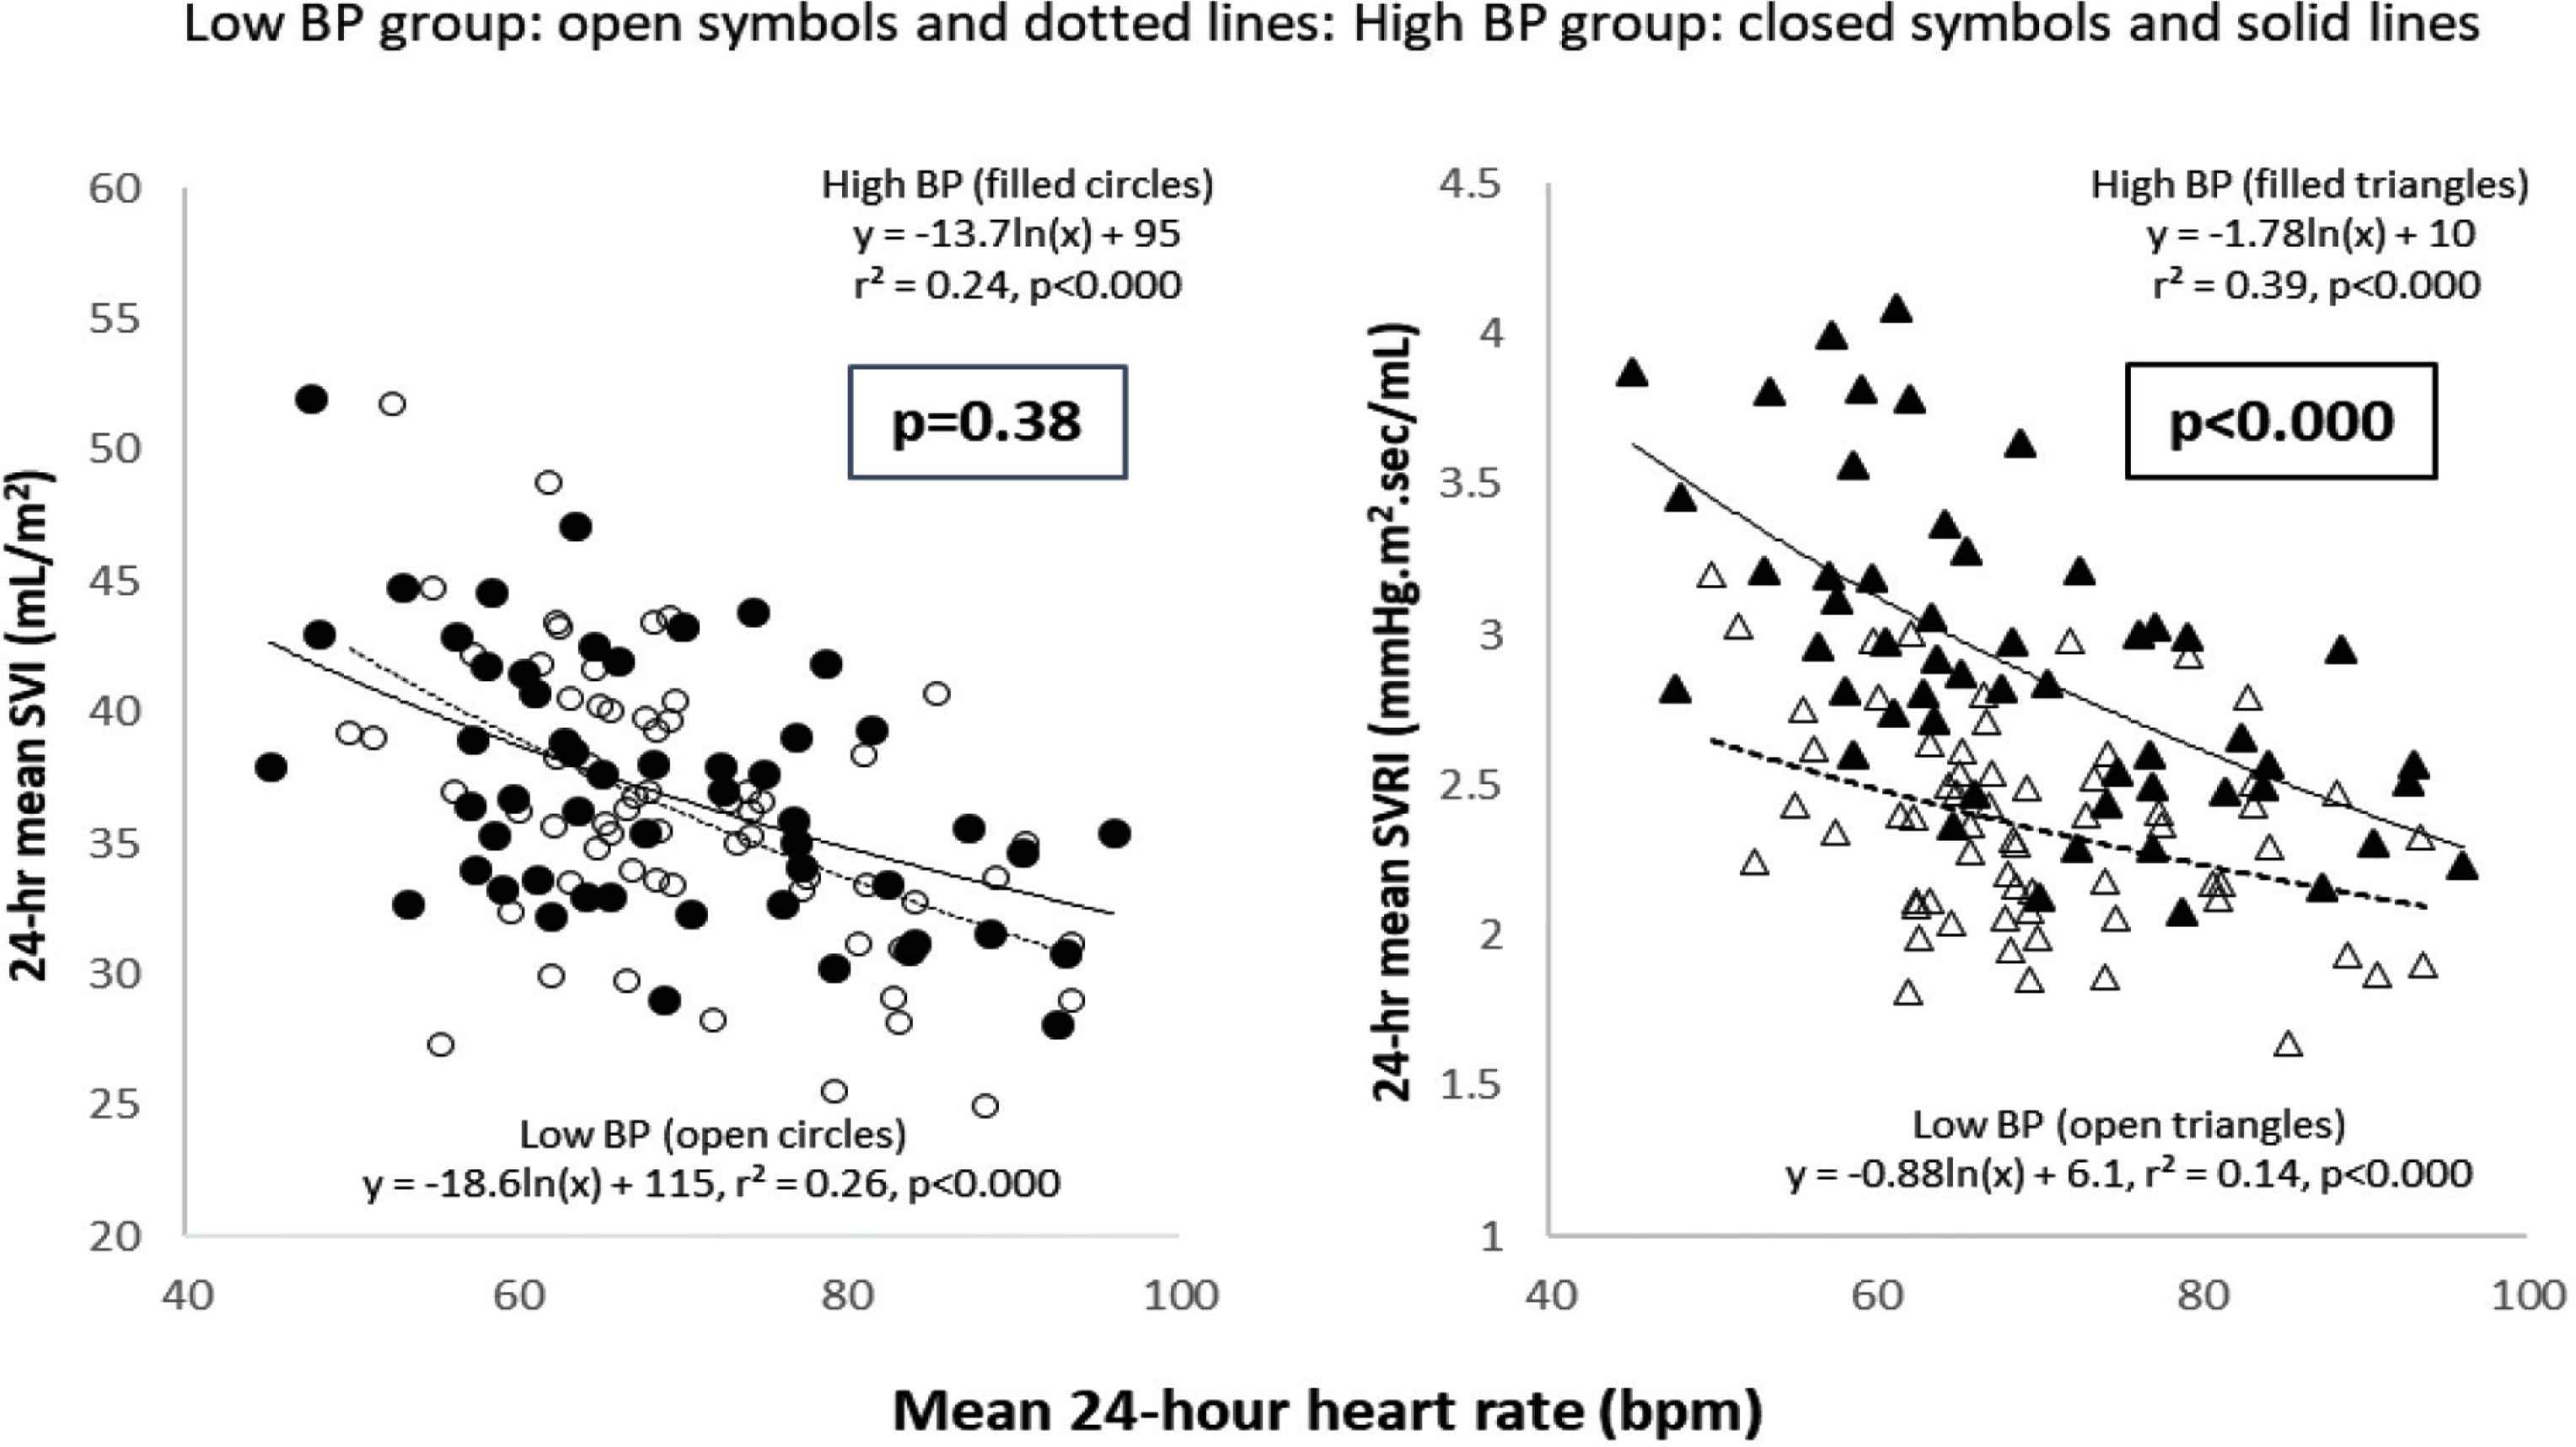
Inter-relationships of 24-h hemodynamic variables with HR. Left panel: 24-h mean SVI vs. 24-h mean HR; strong negative ln-linear correlations existed for both low and high BP groups and the respective regression coefficients for both groups were similar, as were the mean 24-h SVI/24-h HR ratios (p = 0.38). Right panel: 24-h mean SVRI vs. 24-h mean HR; strong negative ln-linear correlations existed for both low and high BP groups. Compared with the lower BP group, the high BP group had a higher intercept, regression coefficient, and mean 24-h SVI/24-h HR ratio (p < 0.000). SVI, stroke volume index; SVRI, systemic vascular resistance index.
Table 2 demonstrates that the strong negative correlations between SVI or SVRI and lnHR observed over 24-h were also present in the night-time and daytime hours (graphic data not shown).
| Systolic BP - HR | Stroke volume index - HR | Systemic vascular resistance index - HR | |
|---|---|---|---|
| 24-h, r2 | −0.061 HR + 139, 0.0013 | −16 (ln HR) + 104, 0.248* | −1.5 (ln HR) + 8.9, 0.223* |
| Daytime, r2 | −0.052 HR + 142, 0.0011 | −16 (ln HR) + 105, 0.271* | −1.5 (ln HR) + 9.0, 0.237* |
| Night-time, r2 | 0.038 HR + 126, 0.0003 | −17 (ln HR) + 107, 0.210* | −1.3 (ln HR) + 8.0, 0.141* |
p < 0.000. Pearson linear regressions for systolic BP vs. HR; ln-linear regressions for stroke volume index or systemic resistance index vs. HR. No differences for any of the three regression equations were detected among periods.
Consistency of daytime, night-time and 24-h hemodynamic relationships
Table 3 demonstrates the model parameters for the forward stepwise multiple regression analyses that tested the impact of age, race, gender, height, and weight on the 24-h mean SVR-lnHR and SVRI-lnHR relationships. For SVI-lnHR, Black race and younger age were associated with greater mean 24-h ratios of SVI and SVRI to HR (p < 0.002 and 0.004, respectively); gender, height, and weight did not enter the model. For SVRI-lnHR, older age was associated with a greater coefficient and higher 24-h SVRI/HR ratio (p < 0.001). Race, gender, height, and weight did not enter the model. SBP (already demonstrated to be related to SVRI-lnHR sensitivity; Figure 2) was not included in the model due to high collinearity with age.
| Stepwise multiple regression models | |||||||
|---|---|---|---|---|---|---|---|
| SVI/HR slope | |||||||
| Model | Model r (p) | Unstandardized coefficients | Standardized coefficients | t | Sig. | ||
| B | SE | β | |||||
| 1 | (Constant) | 0.325 (<0.000) | −0.243 | 0.027 | −9.058 | 0.000 | |
| Black race | −0.166 | 0.045 | −0.325 | −3.663 | 0.000 | ||
| 2 | (Constant) | 0.409 (<0.000) | −0.470 | 0.082 | −5.715 | 0.000 | |
| Black race | −0.141 | 0.045 | −0.277 | −3.174 | 0.002 | ||
| Age | 0.004 | 0.001 | 0.254 | 2.905 | 0.004 | ||
| Excluded variables: gender, weight, height | |||||||
| SVRI/HR slope | |||||||
| 1 | (Constant) | 0.292 (<0.001) | 0.013 | 0.006 | 2.263 | 0.026 | |
| Age | 0.000 | 0.000 | −0.292 | −3.258 | 0.001 | ||
Excluded variables: race, gender, weight, height. SBP was not included in these models because of high collinearity with age. SVI, stroke volume index; SVRI, systemic vascular resistance index; HR, heart rate.
Demographic models
Figure 3 demonstrates the results of the nebivolol–valsartan crossover study. Mean (SD) for 24-h HR was 62 (8) bpm with nebivolol and 78 (14) bpm with valsartan (p < 0.000); mean 24-h SBP and DBP were similar with both drugs: nebivolol 147 (15)/89 (12), valsartan 143 (16)/88 (12) mmHg (pNS). Mean 24-h SV was 73 (8.1) vs. 67 (7.8) mL, respectively (p < 0.001) and mean 24-h SVR was 1.5 (0.17) vs.1.3 (0.16) mmHg.s/mL, respectively [25] (p < 0.001). Left panel demonstrates the decoupling of BP and HR. Center and right panels depicts the SVI-lnHR and SVRI-lnHR regression equations on each drug. These individual drug-specific regression equations were very similar on both drugs, as evidenced by their abilities to predict the same SVI (30 mL/m2) and SVRI (2.9 vs. 3.0 mmHg.s.m2/mL) at HR = 70 bpm.
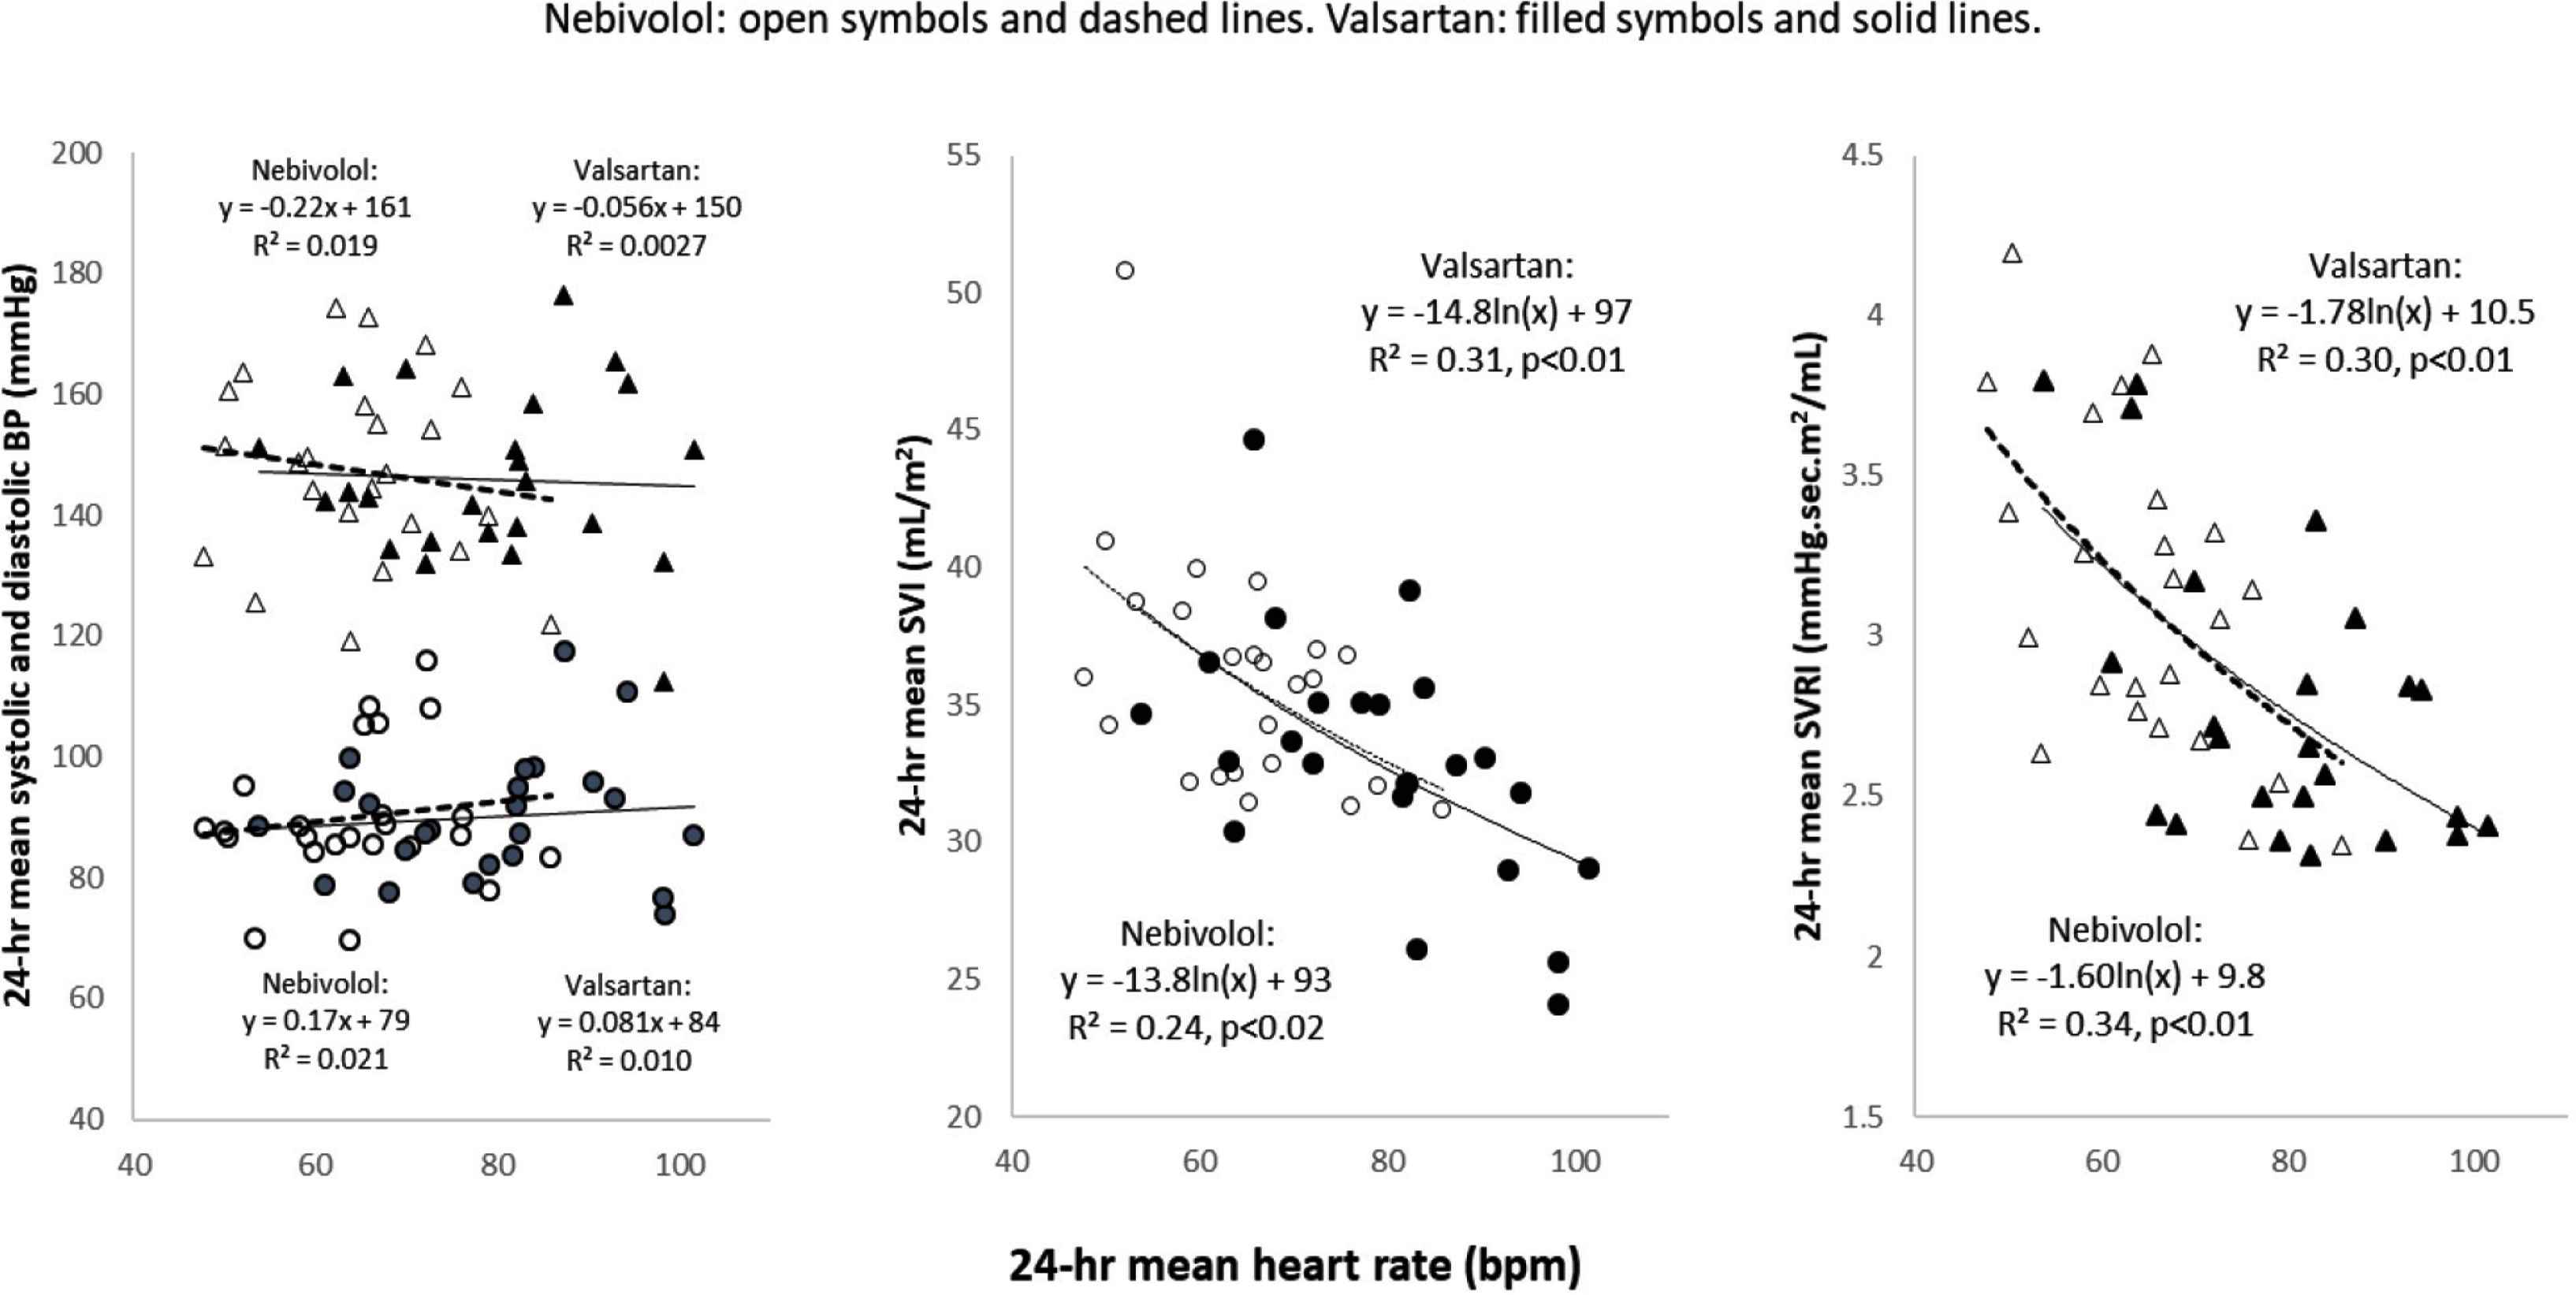
Similarity of 24-h hemodynamic patterns during nebivolol and valsartan. Twenty-four patients received 1 month each of single-blinded daily nebivolol (max 40 mg) or valsartan (max 320 mg) in a random entry order crossover study. Left panel: BP values were similar on both drugs; 24-h mean HR was slower on nebivolol by 14 bpm. Center panel: ln-linear regression coefficients and intercepts for 24-h SVI-HR and 24-h SVRI-HR were similar; at HR = 70, the predicted SVI values from the nebivolol and valsartan curves were identical (34 mL/m2). Right panel: ln-linear coefficients and intercepts for 24-h SVI-HR and 24-h SVRI-HR were also similar on both drugs; at HR = 70, the predicted SVRI was 2.9 mmHg.s.m2/mL from the valsartan curve and 3.0 mmHg.s.m2/mL from the nebivolol curve. SVI, stroke volume index; SVRI, systemic vascular resistance index.
4. DISCUSSION
Present findings are entirely novel and have many potential ramifications. First, in a cohort stratified by low or high blood pressure, we found no meaningful correlation between 24-h mean SBP (or DBP) and 24-h mean HR in either group. Thus, HR and BP are generally independent of each other (“decoupled”) across populations with normal and modestly elevated BP. This statement, however, does not mean that HR is unimportant hemodynamically. In the cohort as a whole and in all subgroups tested, we found very strong nonlinear inverse relationships between 24-h mean SVI and SVRI and the natural log (ln) of the corresponding 24-h mean HR. The same conclusions would have been drawn if we had compared ln[24-h mean SVI] or ln[24-h mean SVRI] with 24-h mean HR. Since, by definition, BP = HR * SV * SVR, “decoupling” of BP and HR can occur only if there is matched counter-regulation of SVI or SVR against HR. The physiologic benefit of this important counter-regulatory principle seems obvious: improved BP homeostasis, the value of which is almost certainly greatest at the extremes of HR, where it is necessary to protect against hypotension at low HR and excessively high BP at high HR. The robustness of these between-subjects inverse relationships for SVI and SVRI vs. HR is surprising strong and predictable. Further, the persistence of these same relationships during daytime, night-time, or 24-h observation periods strongly suggests that the basic relationships of SVI or SVRI with HR are not dependent on measurement period, posture, or general activity level. In related preliminary studies, we have found notable differences in hemodynamic sensitivity to HR between- and within-subjects, potentially justifying this speculation [26].
Even though present correlations do not prove causality, a strong argument can be made that HR is the primary cause of the hemodynamic variation and that HR serves as the hemodynamic setpoint. The converse, that the hemodynamic changes are primary, is inconsistent with known cardiovascular homeostatic or pharmacologic mechanisms. SV-HR dependency directly affects ventricular filling time, cardiac Starling force, and therefore SV but small changes in SV do not affect HR. Mechanisms underlying the counter-regulation of SVR against HR are probably more complex. Since the adaptive counter-regulation is probably relatively immediate, it may involve alterations in arteriolar myogenic tone (a vascular Starling-type response), flow-modulated release of nitric oxide and other autacoids, macro- and microvascular flow redistributions, or altered microcirculatory blood viscosity. A lag time of several seconds would allow activation of the autonomic nervous system. Vasoconstriction per se does not cause a meaningful change in HR unless SBP is elevated (i.e. a “Cushing-type” reflex), which was not seen in this study. In our pharmacologic study, at constant BP, nebivolol clearly reduced HR and increased SV and SVR compared to valsartan but in predictable proportional fashion. Further, as already discussed, the SVI and SVRI were entirely predicted by their near-identical relationships with lnHR on both drugs.
With respect to the hemodynamics of chronic hypertension, our findings demonstrate that counter-regulation of SVR against HR is heightened in hypertension, while HR-SV counter-regulation is very similar in normotensives and mild-to-moderate hypertensives. Heightened sensitivity of SVR to HR was also found in blacks and older people. This suggests that current dogma should be modified. Although it has been found in previous studies that supine SVR is higher in hypertension, the idea that there is adaptation by the peripheral vasculature to changes in HR is new. Based on static, supine investigations, many experts have suggested that increased cardiac output characterizes early hypertension, while elevated SVR predominates in chronic hypertension [2,4,27–30]. There are also tight associations among age, SBP and SVR, and the driving forces underlying these trends appear to be age-related increases in sympathetic nervous activity and progressive structural vascular changes (e.g. increased arterial stiffness and arteriolar wall thickening) [28,29,31,32]. HR is not generally age-dependent and in other well-conducted observational studies, “inappropriate” elevation of both cardiac output and SVR is found throughout all phases of hypertension [33–35], supporting the notion that the heart does play a substantial role in the maintenance of elevated BP. In this context, even if SV remains “normal,” it is inappropriate because it contributes to an unwanted increase in cardiac output and BP [34,35]. In late hypertensive heart disease and in preserved ejection fraction heart failure, SV declines and SBP returns to “normal” values despite persistent elevation of SVR [36]. These findings and our observations suggest that there are clinically relevant hemodynamic subgroups that merit further study.
Further application of ambulatory hemodynamic profiling may help clarify certain paradoxes regarding the prognostic significance of HR and the variable benefits of drugs that affect HR. In the general population, high HR as a risk factor for future hypertension and premature cardiovascular mortality [27,37–39], leading many to assume that beta-blockers should reliably reduce morbidity and mortality—but this is apparently not the case. Reducing HR with beta-blocker or ivabradine is clearly beneficial in heart failure [40,41] but beta-blockers are no longer recommended as first-line agents in hypertension [42], in large part because they are inferior to other “first-line” antihypertensive drugs (diuretics, renin-angiotensin blockers, and calcium antagonists) in reducing adverse outcomes [43]. No clear explanation exists for these anomalous effects but it seems possible that different hemodynamic subpopulations may experience different outcomes when HR is decreased. For example, if an individual with a blunted counter-regulatory SV or SVR response to HR-slowing is given a beta-blocker, there may be clinically significant signs of hypoperfusion or hypotension [44]. In this context, alterations in ventricular compliance and relaxation could reduce the impact of SV-HR counter-regulation and potentially imperil organ perfusion and functional responses.
There are other potentially important practical ramifications for clinical testing and diagnosis, especially as regards normalization of hemodynamic variables to HR. A related example is augmentation index; this variable is closely related to SVR and is generally reported after normalization to HR = 75 bpm. HR-normalization is not used in echocardiographic, radionuclide, and invasive studies but based on our data, if HR varies by 20 bpm, the expected change in SVI would be about 4 mL/m2, a variation of about 15–20%. HR-normalized ambulatory hemodynamic subtyping might allow better choices of antihypertensive (or heart failure) drugs [45].
There are several limitations to this study. First, Ohm’s law is typically applied to steady-state flow. However, pulsatility is also implied because cardiac output is the product of HR and SV. Flow-resistance analysis been useful in many pathophysiologic and pharmacologic studies in hypertension [5,25,28,46,47]. Second, although we have presented data derived from a relatively small convenience sample, we represented a range of values of BP, HR, age, height, weight, and race. The robustness of the statistical associations we have reported argues strongly that our results can be generalized. Third, the oscillometric Mobil-O-Graph/ARCSolver pulse wave analysis system is proprietary in nature and, as yet, relatively limited in usage, with no classic methods comparison available, although some data are available in normotensive and hypertensive populations and in cardiac disease [22–24]. Finally, we did not have complete data on background drug use in our observational cohort but it is unlikely that this information would have had substantial effect on our results and conclusions because two very dissimilar drugs did not affect the basic relationships we have described.
5. PERSPECTIVES
Appreciation of the impact of the dynamic interplay between the heart and peripheral circulation has been constrained by reliance on resting hemodynamics. Using ambulatory 24-h hemodynamic monitoring, the mechanisms underlying the decoupling of BP and HR can be clearly identified as linked counter-regulation of SV and SVR against HR. HR appears to be the primary hemodynamic setpoint based on our crossover study, in which HR-lowering with beta-blocker, caused a matched counter-regulatory increase in both SV and SVR. Mean 24-h SV/HR varied with race and age, while the corresponding SVR/HR varied with ambient BP and age. It is thus possible that ambulatory hemodynamic profiling may identify further hemodynamic trends or clinical subpopulations.
CONFLICTS OF INTEREST
During the past 12 months, Dr. Izzo has received research grants from AstraZeneca, Boehringer-Ingelheim, Novartis and Sanofi and for unrelated studies.
AUTHORS’ CONTRIBUTION
JLI is responsible for all aspect of the study. PO contributed in data acquisition and analysis. Data analysis were carried out by MAA and KE.
FUNDING
Forest Laboratories provided funding for the nebivolol-valsartan sub-study.
ACKNOWLEDGMENTS
The authors wish to thank Natalie Rodziewicz, Sajeer Bhura, and Saba Asif for assistance in data collection.
Footnotes
REFERENCES
Cite this article
TY  - JOUR
AU  - Joseph Lewis Izzo
AU  - Muhammed Absar Anwar
AU  - Kalamaini Elango
AU  - Rahil Ahmed
AU  - Peter Osmond
PY  - 2019
DA  - 2019/12/24
TI  - Decoupling of Heart Rate and Blood Pressure: Hemodynamic Counter-regulatory Mechanisms and their Implications
JO  - Artery Research
SP  - 87
EP  - 94
VL  - 25
IS  - 3-4
SN  - 1876-4401
UR  - https://doi.org/10.2991/artres.k.191210.001
DO  - 10.2991/artres.k.191210.001
ID  - Izzo2019
ER  -