
High Sensitivity Troponin T and NT-proBNP in Patients Receiving Chimeric Antigen Receptor (CAR) T-Cell Therapy
 , Ameet Patel2, , Shi Huang1, Yan Ru Su1, Kimberly B. Dahlman2, , Kelsey Tomasek1, Yueli Zhang1, Richard T. O’Neil3, Jamye F. O’Neal4, Isik Turker1, Douglas B. Johnson2, Joe-Elie Salem5, 6, Javid J. Moslehi1, 6, Olalekan Oluwole2, *,
 Division of Cardiovascular Medicine, Yale School of Medicine, New Haven, CT, USA
- DOI
- 10.2991/chi.k.210718.001How to use a DOI?
- Keywords
- Chimeric antigen receptor T cell; troponin; BNP; cardiotoxicity; lymphoma
- Abstract
Retrospective studies suggest that chimeric antigen receptor T-cell (CAR T) therapy may lead to cardiac injury, but this has not been assessed systematically or prospectively. In this prospective study of 40 patients who received CAR T, we systematically measured high-sensitivity troponin T (hsTropT) and N-terminal pro-B natriuretic peptide (NTproBNP) at baseline and on day 1, days 7, and 21 after CAR T. Biomarker elevations with respect to timepoint and cytokine release syndrome (CRS) status were examined using repeated measure analysis of variance. hsTropT did not differ with time or with the presence of grade 2 CRS. Median hsTropT was 12.1 ng/L [interquartile range (IQR): 9.2, 20.1] at baseline, 13.1 ng/L (IQR: 9.6, 24.2) at day 1, 11.9 ng/L (IQR: 9.6, 18.0) at day 7, and 15.3 ng/L (10.8, 20.2) at day 21. In contrast, NTproBNP rose on day 1 (PWilcox = 0.0002) and day 7 (PWilcox = 2.7 × 10⁻⁵), and the degree of elevation differed by the presence of grade 2 CRS (Pinteraction = 0.002). Median NTproBNP was 179 pg/mL (IQR: 116, 325) at baseline, 357 pg/mL (IQR: 98, 813) at day 1, 420 pg/mL (IQR: 239, 1242) at day 7, and 177 pg/mL (IQR: 80, 278) at day 21. In conclusion, hsTropT l did not differ across timepoints after CAR T therapy, but NTproBNP rose at day 7, the prognostic implications of which should be the target of future research, as the indications for this therapy expand.
- Copyright
- © 2021 International Academy for Clinical Hematology. Publishing services by Atlantis Press International B.V.
- Open Access
- This is an open access article distributed under the CC BY-NC 4.0 license (http://creativecommons.org/licenses/by-nc/4.0/).
1. INTRODUCTION
Chimeric antigen receptor T-cell (CAR T) therapy against CD-19 surface antigen has shown remarkable promise in achieving durable remissions for relapsed/refractory B cell lymphomas, mantle cell lymphoma and acute lymphoblastic leukemia, with four products now approved (axicabtagene-ciloleucel, brexucabtagene autoleucel, tisagenlecleucel and lisocabtagene maraleucel) [1,2]. Cytokine release syndrome (CRS) is a known significant toxicity contributing to organ dysfunction in patients treated with CAR T therapy [3]. Data on the cardiovascular toxicities of CAR T therapy are limited, and have largely been limited to case reports and clinical trial safety reporting [4,5]. Previous analyses have raised the possibility that CAR T-cell therapies may be associated with cardiac toxicities, with an increase in troponin signifying cardiac damage, especially in the setting of CRS [6]. However, these were retrospective studies where troponin was checked as a result of a clinical indication and only in a subset of patients.
Troponin T is a subunit of a heterotrimeric troponin complex that exists within tropomyosin, which spans most of the actin filament and triggers myocyte contraction upon influx of calcium ions. Extrusion of troponin T from cardiomyocytes is interpreted as a sign of myocyte injury or necrosis, as occurs in ischemia [7]. B natriuretic peptide is a protein produced in cardiac atrial and ventricular myocytes, and their production and secretion is upregulated upon cardiac wall stress. Secretion of B natriuretic peptide and its pro-peptides is a sign of cardiac stretch, as occurs in volume overload in heart failure [8]. Whether CAR T administration systematically increases these cardiac biomarkers remains unclear.
2. MATERIALS AND METHODS
2.1. Population
In this prospective study, we systematically assessed cardiac biomarkers in all patients who received CAR T therapy at Vanderbilt between February 2016 and October 2020 (IRB #200125). Inclusion criteria were all adults ≥18 years of age with relapsed/refractory B-cell lymphoma, leukemia, or multiple myeloma eligible for CAR T-cell therapy under commercial or clinical trial enrollment. Patients were excluded if they had myocardial infarction, history of cardiac revascularization, unstable angina, or other clinically significant cardiac disease at least 12 months prior to CAR T therapy. All patients were followed up for at least 1 year, with an overall median follow-up time of 602 days.
2.2. Treatment
Thirty-seven patients started lymphodepleting chemotherapy on day-5, and three patients started on day-4. Lymphodepleting chemotherapy consisted of cyclophosphamide 500 mg/m2 for 3 days and fludarabine 30 mg/m2 for 3 days, with intravenous (IV) fluids given before and after cyclophosphamide. Patients were treated with either axicabtagene-ciloleucel, brexucabtagene autoleucel, tisagenlecleucel, or experimental anti B-cell maturation antigen (anti-BCMA) therapies.
2.3. Laboratory Measurements
Serum levels of high-sensitivity troponin T (hsTropT) and N-terminal pro-B natriuretic peptide (NTproBNP) were systematically assessed at baseline, on day 1, days 7 and 21 after CAR T. Baseline laboratory values were obtained in the window of 5–8 days prior to CAR T, with the exception of six outliers, including three patients who provided baseline samples in advance (on days-36, -20, and -13) and three patients who provided baseline samples on the same day as CAR T. For the purposes of plotting, the label “0” will be used to denote baseline.
Blood collected from study patients was allowed to clot and separate for a minimum of 30 min before being centrifuged within 60 min of collection. These samples were then centrifuged for 15 min at 850–2040g to obtain the serum component, which was aliquoted into fresh cryovials, and frozen at −80°C for storage until measurement of hsTropT and NTproBNP levels. The Elecsys troponin T 5th generation assay operates on a sandwich principle, whereby antigen in the sample, a biotinylated anti-cardiac troponin T-specific monoclonal antibody, and an anti-cardiac troponin T-specific monoclonal antibody labeled with a ruthenium complex react to form a sandwich complex [9]. After the addition of streptavidin-coated microparticles, the reaction complex becomes bound to the solid phase via the interaction of biotin and streptavidin, and is aspirated into a measuring cell, where the reaction mixture is magnetically captured onto the surface of the electrode. Unbound substances are removed with ProCell washing. Application of a voltage to the electrode causes a chemiluminescent emission which is measured by a photomultiplier to determine the concentration of hsTropT. The Elecsys NTproBNP II assay operates on the same sandwich principle, except the biotinylated monoclonal antibodies are specific to NTproBNP instead of troponin T [10]. These assays were run on an automated immunoassay analyzer using electrochemiluminescence technology. Lab data were collected and managed using REDCap electronic data capture tools hosted at Vanderbilt University Medical Center [11].
2.4. Variables
Clinical variables, which were chart-extracted by two physicians, included demographic information (e.g. date of birth, date of death), baseline cardiac history (e.g. history of myocardial infarction, history of heart failure), tumor type, treatment information (e.g. CAR T regimen, CAR T day 0), CRS grade, CRS treatment, availability of echocardiography, and post-treatment cardiovascular events. CRS grading was based on the American Society for Transplantation and Cellular Therapy (ASTCT) consensus statement [12]. Abnormal values were defined as hsTropT > 14 ng/L or a NTproBNP > 125 pg/mL as recommended in the Elecsys package insert, based on population-wide studies of individuals with and without cardiac disease. Scoring for ICANS in all patients was based on CARTOX10 grading assessment tools [13]. Major adverse cardiovascular events (MACE) were defined as the composite of nonfatal myocardial infarction, nonfatal stroke, new heart failure, and cardiovascular death.
2.5. Statistical Analysis
Demographic and clinical characteristics were summarized as median with interquartile range (IQR) for continuous variables, and as number with proportion for categorical variables. The relationship between serum creatinine and hsTropT, as well as the relationship between estimated glomerular filtration rate (eGFR) and hsTropT, was examined by simple correlation and by linear regression adjusted for age and gender. The Wilcoxon signed rank test with continuity correction was used to assess the association between baseline and day 7 serum creatinine, by whether hsTropT increased between baseline and day 7; McNemar’s Chi-squared test with continuity correction was used to assess the association between baseline eGFR and day 7 eGFR, by whether hsTropT increased between baseline and day 7.
In the main analysis, repeated measure analysis of variance (ANOVA) was conducted to examine whether hsTropT and NTproBNP changed after CAR T. Paired Wilcoxon Rank Sum tests were conducted to compare hsTropT and NTproBNP levels post-CAR T to baseline levels. The Benjamini–Hochberg method was used to adjust for multiple comparisons. We examined whether CRS grade and baseline abnormal/normal status impact the hsTropT and NTproBNP change after CAR T, by including an interaction term between timepoint and CRS status (or baseline abnormal/normal status) in the ANOVA. A significant interaction of time and CRS grade (or baseline abnormal/normal status) indicates the biomarkers are changing differently by CRS grade (or baseline abnormal/normal status). In separate analyses, paired Wilcoxon Rank Sum tests and trend plots were separated by CRS grade and whether baseline hsTropT and NTproBNP were normal. The repeated measure ANOVA was based on complete cases (33 patients) with hsTropT and NTproBNP measured at all four timepoints. hsTropT and NTproBNP were natural-log transformed due to non-normality. The Huynd-Feldt correction was conducted if the sphericity assumption was not met.
3. RESULTS
The forty patients met inclusion/exclusion criteria. Patients had a median age of 63 years; 26/40 (65%) were male; and 26/40 (65%) had relapsed or refractory (≥2 median lines of therapy) diffuse large B cell lymphoma (Table 1). Thirty-six patients received prior anthracycline, at a median cumulative dose of 300 mg/m2. Three patients previously received carfilzomib and ibrutinib. No patients received any mediastinal radiation. Thirty-five patients had normal baseline renal function. There was no correlation between baseline hsTropT and baseline serum creatinine (p = 0.76; Figure S1). After adjustment for age and gender, there was no association between baseline hsTropT and baseline serum creatinine (p = 0.48) or between baseline hsTropT and baseline eGFR (p = 0.26). Between baseline and day 7 BMPs, there was no significant worsening in serum creatinine (p = 0.16) or in eGFR (p = 0.62) in patients with increased hsTropT. No patient had a history of myocardial infarction, coronary artery bypass, or stroke.
| Characteristic | All patients (n = 40) | Complete case patients (n = 33) |
|---|---|---|
| Age in years, median (IQR) | 63 (55, 66) | 63 (55, 66) |
| Male gender, n (%) | 26 (65%) | 22 (67%) |
| Type of relapsed/refractory cancer, n (%) | ||
| Diffuse large B cell lymphoma | 26 (65%) | 21 (64%) |
| Acute lymphocytic leukemia | 4 (10%) | 3 (9%) |
| Mantle cell lymphoma | 3 (7.5%) | 2 (6%) |
| Multiple myeloma | 3 (7.5%) | 3 (9%) |
| Marginal zone lymphoma | 2 (5%) | 2 (6%) |
| Chronic lymphocytic leukemia | 1 (2.5%) | 1 (3%) |
| Follicular lymphoma | 1 (2.5%) | 1 (3%) |
| Previous cardiotoxic chemotherapy | ||
| Anthracycline | 36 (90%) | 30 (91%) |
| Carfilzomib | 3 (7.5%) | 3 (9%) |
| Ibrutinib | 1 (2.5%) | 1 (3%) |
| Prior cumulative anthracycline dose, mg/m2, median (IQR) | 300 (248, 300) | 300 (240, 300) |
| Baseline serum creatinine in mg/dL, median (IQR) | 0.81 (0.70, 0.97) | 0.80 (0.70, 0.96) |
| Normal baseline estimated glomerular filtration rate in mL/min/1.73 m2 (eGFR) | 35 (88%) | 28 (85%) |
| Cardiovascular disease history | ||
| Prior myocardial infarction | 0 | 0 |
| Prior coronary artery bypass | 0 | 0 |
| Prior percutaneous coronary intervention | 2 | 0 |
| Prior stroke | 0 | 0 |
| Heart failure | 3 | 2 |
| Atrial fibrillation | 6 | 4 |
| Atrioventricular block (1st degree) | 1 | 1 |
| Atrioventricular block (2nd degree) | 0 | 0 |
| Atrioventricular block (3rd degree) | 0 | 0 |
| Paroxysmal supraventricular tachycardia | 1 | 1 |
| Valvular disease | 6 | 5 |
| Hypertension | 16 | 11 |
IQR, interquartile range.
Characteristics of patients who received CAR T-cell therapy
A total of 24/40 (60%) received axicabtagene-ciloleucel; 8/40 (20%) brexucabtagene autoleucel; 5/40 (13%) tisagenlecleucel and 3/40 (8%) anti-BCMA therapies in a trial setting. At baseline, 36/40 (90%) had normal left ventricular ejection fraction (LVEF ≥ 50%), while 3/40 (8%) had LVEF 30–45%; 1/40 did not have a pre-treatment echocardiogram (Table 2). CRS occurred in the majority of patients (30/40, 75%), with maximum grade 2 in 17/40 (43%) and grade 1 in 14/40 (35%). No CRS occurred in the remaining patients (9/40; 23%). Among the 30 patients who experienced CRS, its median onset was day 3 (IQR: 1, 4) and median resolution was day 6 (IQR: 4, 7). No patient experienced MACE during 1-year follow-up. The all-cause mortality at 1 year was 18% (7/40), and over a median follow-up time of 588 days (IQR: 430, 825), it was 28% (11/40).
| Characteristic | All patients (n = 40) (%) | Complete case patients (n = 33) (%) |
|---|---|---|
| Type of CAR T received, n (%) | ||
| axicabtagene-ciloleucel (Yescarta) | 24 (60) | 21 (64) |
| brexucabtagene autoleucel (Tecartus) | 8 (20) | 6 (18) |
| tisagenlecleucel (Kymriah) | 5 (13) | 3 (9) |
| Experimental anti B-cell maturation antigen (anti-BCMA) therapies | 3 (7.5) | 3 (9) |
| Pre-treatment left ventricular ejection fraction (LVEF) | ||
| Normal LVEF ≥ 50%, n (%) | 36 (90) | 30 (91) |
| Moderately reduced LVEF 30–45%, n (%) | 3 (7.5) | 2 (6) |
| No pre-treatment echocardiogram | 1 (2.5) | 1 (3) |
| Post-treatment LVEF | ||
| Normal LVEF ≥ 50%, n (%) | 10 (25) | 9 (27) |
| Moderately reduced LVEF 30–45%, n (%) | 0 (0) | 0 (0) |
| No post-treatment echocardiogram | 30 (75) | 24 (73) |
| Maximum grade of cytokine release syndrome (CRS)*, n (%) | ||
| Grade 2 | 17 (43) | 15 (45) |
| Grade 1 | 14 (35) | 11 (33) |
| No CRS | 9 (23) | 7 (21) |
| Immune effector cell-associated neurotoxicity syndrome | 19 (48) | 16 (48) |
| All-cause mortality at 1 year | 7 (18) | 5 (15) |
| All-cause mortality at median 588 days of follow-up** | 11 (28) | 8 (24) |
CRS treatment statistics: Among the 17 patients who had CRS of maximum grade 2, 10/17 received corticosteroids, 10/17 received intravenous fluids, and 13/17 received tocilizumab. Among 13 patients who had CRS of maximum grade 1 or no CRS, 5/23 received corticosteroids, 2/23 received intravenous fluids, and 8/23 received tocilizumab.
Cause of death was progression of cancer in 6/11; or indiscernible from chart review due to use of outside hospitals or hospice agencies in 5/11.
Treatments, syndromes, and outcomes of patients who received CAR T-cell therapy
The median hsTropT was 12.1 ng/L (IQR: 9.2, 20.1) at baseline, 13.1 ng/L (IQR: 9.6, 24.2) at day 1, 11.9 ng/L (IQR: 9.6, 18.0) at day 7, and 15.3 ng/L (10.8, 20.2) at day 21 (Figure 1A and Table 3). hsTropT levels did not differ significantly across timepoints (F(3,96) = 1.42, p = 0.24) (Individual patient trends are available in Figures S2 and S3; Pairwise Wilcoxon comparisons are available in Table S1). There was no interaction between CRS grade and timepoint (F(3,93) = 0.17, p = 0.92) (Figure 1C). A total of 17 (42.5%) patients had abnormal hsTropT (>14 ng/L) at baseline. Among the other 23 patients, 11 developed abnormal hsTropT at a subsequent timepoint. There was a significant interaction between baseline hsTropT status and timepoint (F(3,93) = 3.05, p = 0.04), indicating that the hsTropT levels were changing differently over time by baseline hsTropT status (Figure 1E). As can be seen in Figure 1E, in the group with normal baseline hsTropT, there were no significant differences in hsTropT with time, whereas in the group with abnormal baseline hsTropT, there was a significant decline in hsTropT at day 7 compared to day 1.
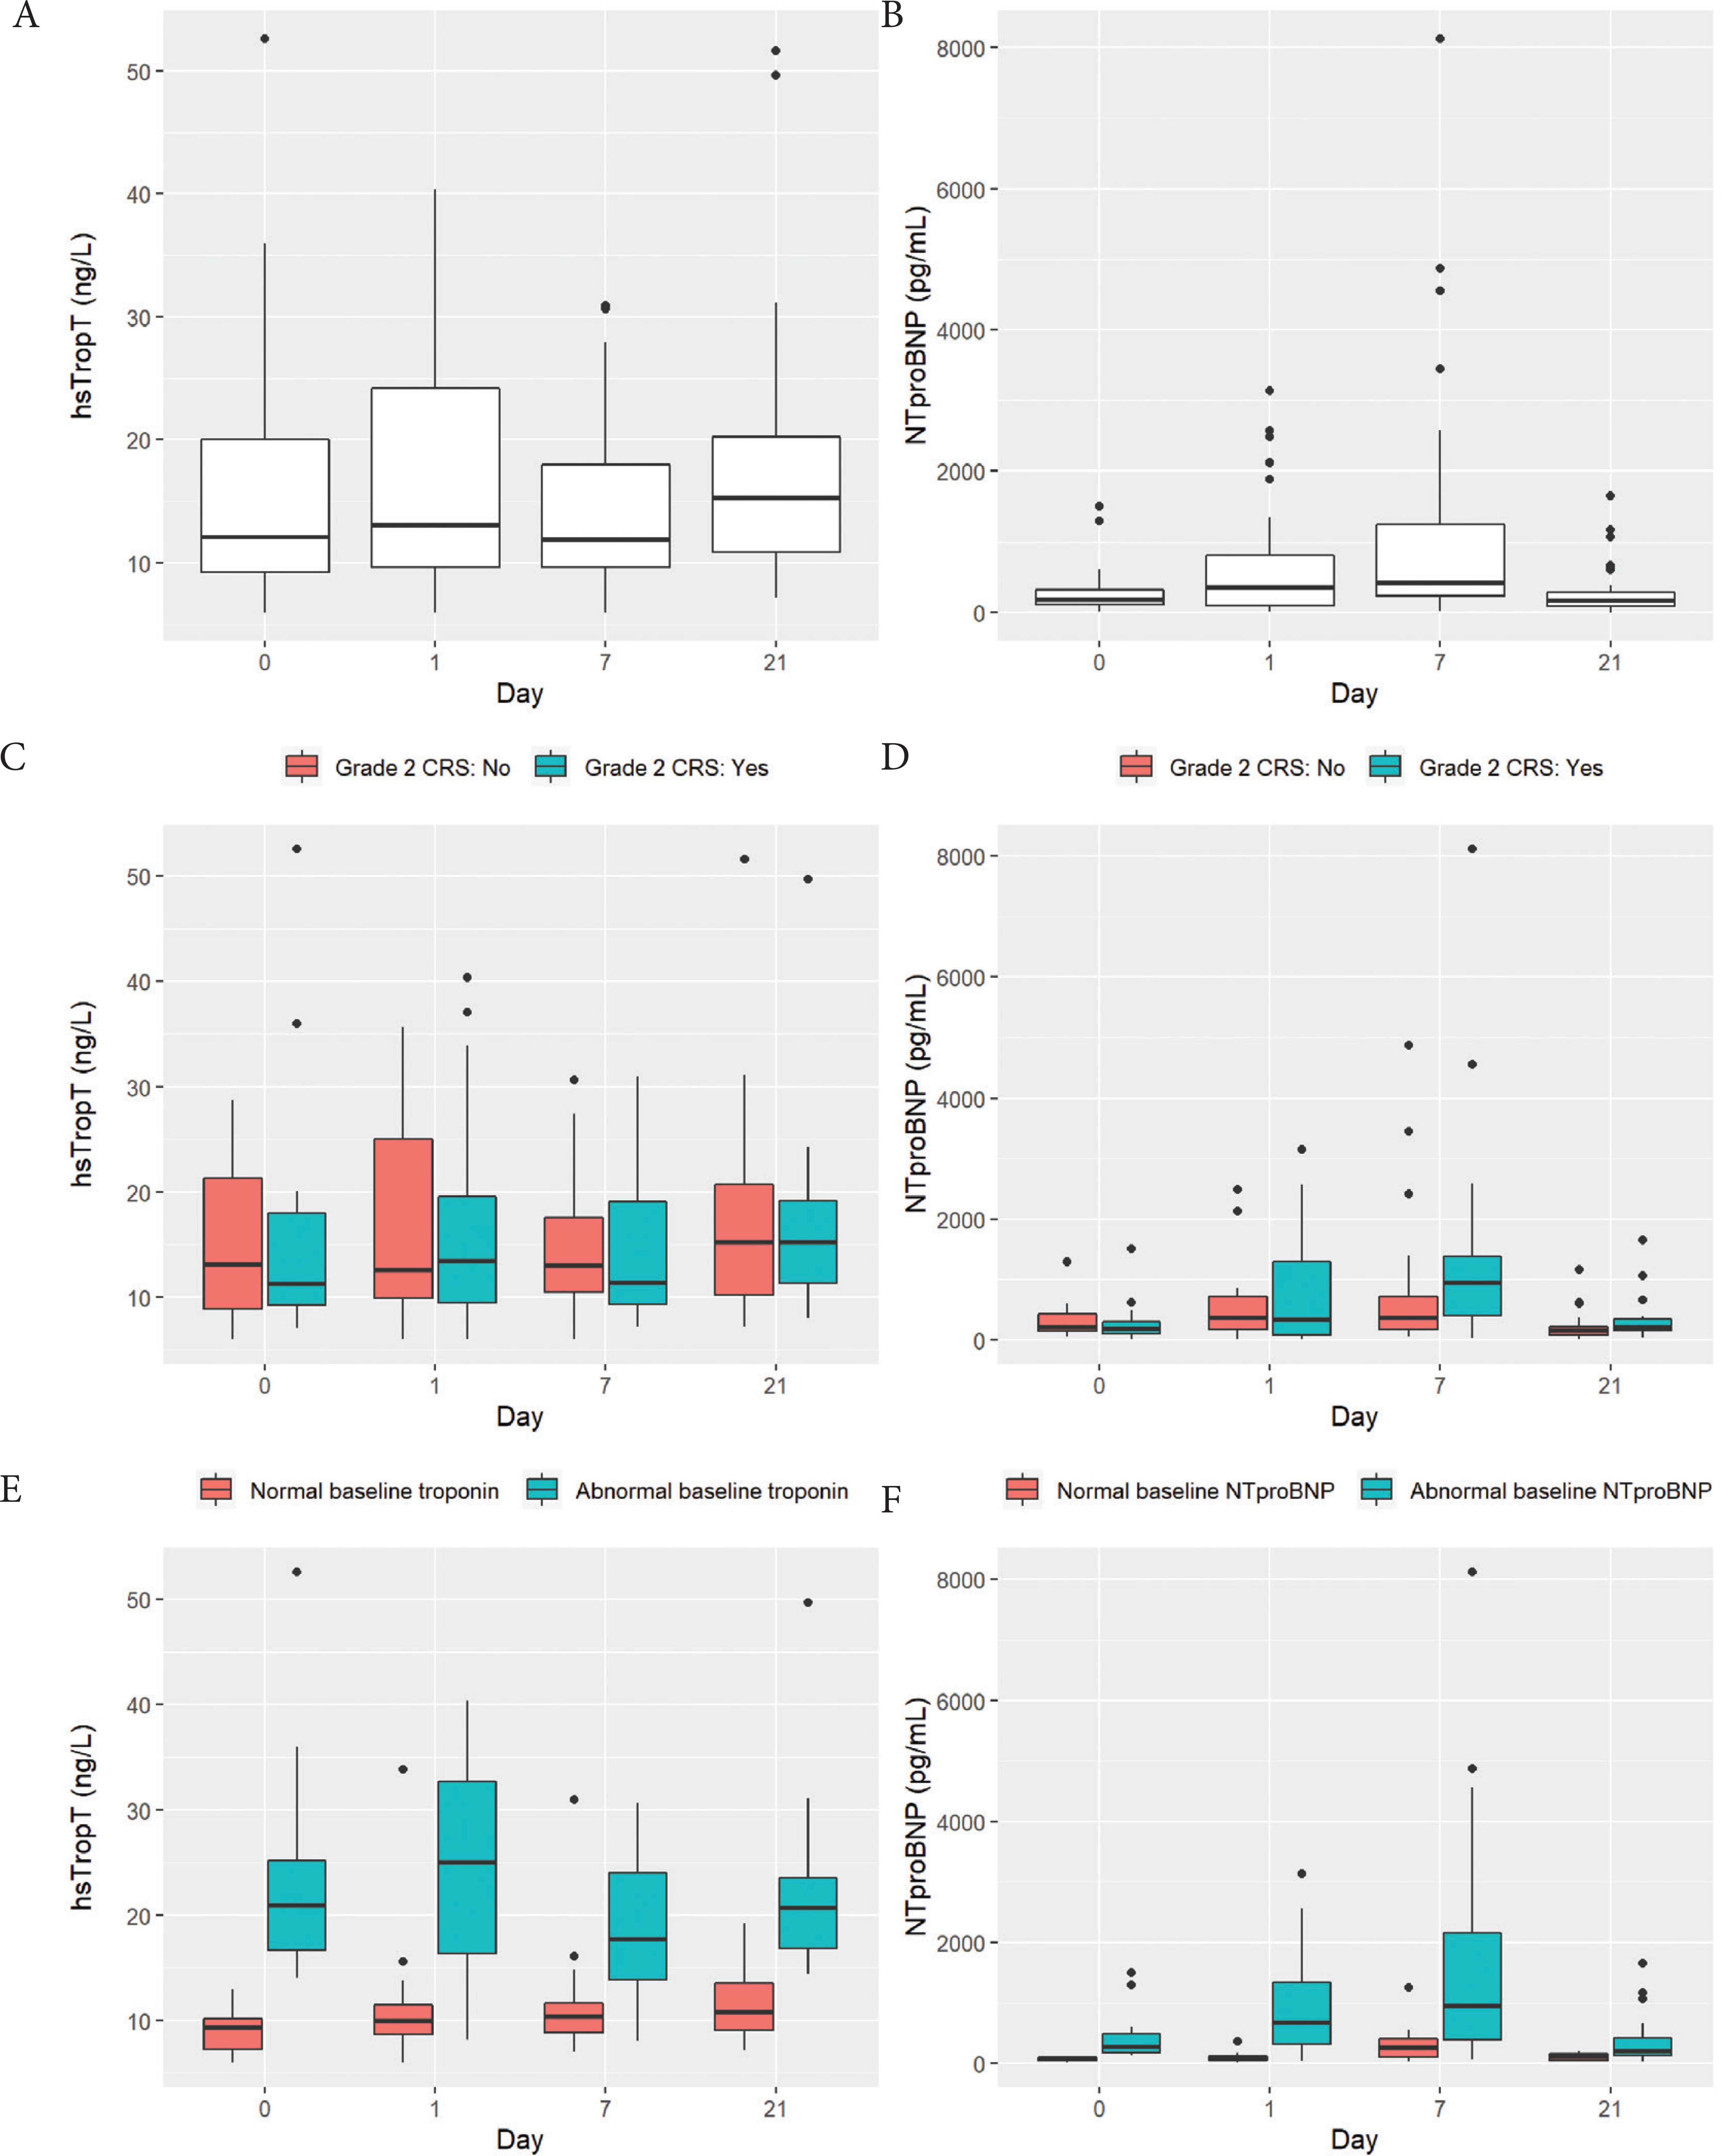
Visual depiction of levels of high sensitivity troponin T (hsTropT) and N-terminal pro-B natriuretic peptide (NTproBNP) among 40 patients who underwent chimeric antigen receptor (CAR) T cell therapy. Boxplots depict the 25th, 50th, and 75th percentile of each distribution with horizontal lines, whiskers extend 1.5 times the interquartile range above the third quartile and below the first quartile, and solid dots depict outliers. (A and B) Levels of hsTropT and NTproBNP at baseline, day 1, days 7 and 21. (C and D) Levels of hsTropT and NTproBNP stratified by whether patients experienced grade 2 cytokine release syndrome (n = 17/40; teal colored) or not (n = 23/40; salmon colored). (E) Levels of hsTropT stratified by whether it was abnormal (>14 ng/L) at baseline (n = 17/40; teal-colored) or not (n = 23/40; salmon-colored). (F) Levels of NTproBNP stratified by whether it was abnormal (>125 pg/mL) at baseline (n = 26/40; teal-colored) or not (n = 14/40; salmon-colored).
| hsTropT levels: Overall | NTproBNP levels: Overall | ||||
| Day | Full group (n = 40) | Day | Full group (n = 40) | ||
| BL | 9.212.120.1 | BL | 116.0179.1324.8 | ||
| 1 | 9.613.124.2 | 1 | 97.8357.2813.4 | ||
| 7 | 9.611.918.0 | 7 | 238.6420.01241.5 | ||
| 21 | 10.815.320.2 | 21 | 79.7176.8278.4 | ||
| hsTropT levels: by grade 2 CRS vs. not | NTproBNP levels: by grade 2 CRS vs. not | ||||
| Day | No CRS (n = 22) | Yes CRS (n = 18) | Day | No CRS (n = 22) | Yes CRS (n = 18) |
| BL | 8.913.121.3 | 9.211.318.0 | BL | 136.4213.9427.6 | 91.5178.9291.3 |
| 1 | 9.912.625.0 | 9.513.519.6 | 1 | 169.6368.2710.8 | 78.0344.41293.5 |
| 7 | 10.513.017.6 | 9.311.419.1 | 7 | 166.0373.6711.5 | 393.7949.31381.8 |
| 21 | 10.215.320.8 | 11.315.319.2 | 21 | 77.5146.4212.7 | 150.9206.6334.5 |
| hsTropT levels: by abnormal vs. normal baseline hsTropT | NTproBNP levels: by abnormal vs. normal baseline NTproBNP | ||||
| Day | Normal baseline hsTropT (n = 20) | Abnormal baseline hsTropT (n = 17) | Day | Normal baseline hsTropT (n = 20) | Abnormal baseline hsTropT (n = 17) |
| BL | 7.39.310.2 | 16.721.025.2 | BL | 48.184.5102.1 | 179.0276.4485.1 |
| 1 | 8.710.011.5 | 16.425.032.7 | 1 | 55.274.8113.8 | 322.9679.01340.0 |
| 7 | 8.810.411.6 | 13.817.824.0 | 7 | 109.6260.7410.8 | 383.9949.22164.0 |
| 21 | 9.110.813.6 | 16.920.823.6 | 21 | 52.1120.3158.2 | 138.1210.9424.6 |
Levels of high sensitivity troponin T (hsTropT) and N-terminal pro-B natriuretic peptide (NTproBNP) among 40 patients who underwent chimeric antigen receptor (CAR) T cell therapy. a b c represent the lower quartile a, the median b, and the upper quartile c. (A and B) Levels of hsTropT and NTproBNP at baseline (BL), day 1, days 7 and 21. (C and D) Levels of hsTropT and NTproBNP stratified by whether patients experienced grade 2 cytokine release syndrome or not (E) Levels of hsTropT stratified by whether it was abnormal (>14 ng/L) at baseline or not. (F) Levels of NTproBNP stratified by whether it was abnormal (>125 pg/mL) at baseline or not
The median NTproBNP was 179 pg/mL (IQR: 116, 325) at baseline, 357 pg/mL (IQR: 98, 813) at day 1, 420 pg/mL (IQR: 239, 1242) at day 7, and 177 pg/mL (IQR: 80, 278) at day 21 (Figure 1B). NTproBNP levels differed significantly across timepoints (F(3,96) = 16.0, p < 0.001): compared to baseline, it was significantly higher on day 1 (p < 0.001) and day 7 (p < 0.001) but not at day 21 (p = 0.50) (Individual patient trends are available in Figures S2 and S3; Pairwise Wilcoxon comparisons are available in Table S1). In addition, there was a significant interaction between CRS grading and timepoint (F(3,93) = 5.54, p = 0.002), which indicates that the NTproBNP levels were changing over time differently by CRS grade (Figure 1D). As can be seen in Figure 1D, the NTproBNP levels increased more in patients without grade 2 CRS at day 1 and 7 compared to patients with grade 2 CRS at the same timepoints. A total of 26 (65%) patients had abnormal NTproBNP (>125 pg/mL) at baseline. Among the other 14 patients, 11 developed abnormally elevated NTproBNP at a subsequent timepoint. In addition, there was a significant interaction between baseline NTproBNP status and timepoint (F(3,93) = 3.67, p = 0.015), indicating that the NTproBNP levels were changing over time differently by baseline NTproBNP status. Thus, the group with abnormal baseline NTproBNP had a larger rise from baseline to day 1, as well as a larger decline from day 7 to day 21, compared to the group with normal baseline NTproBNP (Figure 1F).
4. DISCUSSION
In this prospective study of 40 patients receiving CAR T, we systematically assessed cardiac biomarkers at baseline and following treatment in all patients irrespective of diagnostic concern for cardiac dysfunction. We show that hsTropT remains unchanged compared to baseline, but NTproBNP rises at day 1 and peaks at day 7 post-CAR T, when the CRS incidence was shown to be the highest in previous clinical studies [4]. We also found that levels of NTproBNP, but not hsTropT, differed significantly between patients with and without grade-2 CRS. This is the first study to systematically and prospectively, to provide an unbiased assessment of cardiac biomarkers following CAR T therapy. These results necessitate the evaluation of our current surrogate biomarkers in a prospective fashion moving forward, as protocol decisions are being made about inpatient management of CAR T therapy toxicities.
A number of recent studies have retrospectively assessed cardiac sequelae of CAR T. In Alvi et al.’s [6] cohort of 137 patients, 53 had troponin T measured as part of clinical care after CAR T therapy; 29 (55%) had a positive troponin T. Among the 29 patients with troponin T elevations, the median troponin T was 0.1 mg/mL (upper normal limit used: 0.03 mg/mL) and the median tropo T was 63 ng/L (upper normal limit used: 14 ng/L), consistent with minimal elevations. Twenty-nine patients also had echocardiograms following CAR T as part of clinical care; eight (28%) showed a new reduction in LVEF – occurring only in patients who had CRS grade ≥2 and a troponin increase. However, troponin measurements on the 53 patients were presumably obtained because of clinical suspicion, thus being susceptible to selection bias. Lefebvre et al. [14] showed that 21% of patients receiving CAR T had a major adverse cardiac event at 1 year, but cardiac biomarkers were not systematically assessed. Finally, Ganatra et al. [15] showed that 10% of patients treated with CAR T develop cardiomyopathy, usually in the setting of high-grade CRS. However, all of these studies were done retrospectively. In the three landmark JULIET, ELIANA, and ZUMA-1 trials, no patients in any trial developed MI, two developed heart failure, and four experienced cardiac arrest [4,16,17]. Notably, cardiac biomarkers were not systematically assessed in a prospective manner in the aforementioned retrospective studies or randomized trials.
The mechanism by which CRS might cause cardiotoxicity has not yet been elucidated. CRS is known to upregulate interleukin-6 and plasminogen activator inhibitor and to cause vascular endothelial leakage [18]. In a recent study of patients with CRS from CAR T therapy, none developed cardiotoxicity independent of developing CRS [19]. Interestingly, in our study, NTproBNP increased more in patients without than in patients with grade 2 CRS. We speculate that this is because the latter were administered tociluzimab, whereas patients who did not experience grade 2 CRS were not. Tociluzimab attenuates cytokine release, thus sparing the myocardium from further inflammation. Accordingly, in Alvi et al.’s [6] study, a delay in tociluzimab administration was associated with a 1.7-fold increase in cardiovascular events. In addition, CRS causes systemic vasodilation, reducing afterload and perceived preload, which may be a plausible explanation for the lower NTproBNP in those patients with grade 2 CRS. It remains to be seen if these patterns continue to be seen in future larger, prospective studies.
Our study is limited by its small sample size, reducing the power to detect differences between groups. However, it is the first to prospectively assess cardiac biomarkers in a cohort of patients treated with CAR T, reducing the bias introduced by retrospective analysis and preferential measurements of troponins by clinical teams with concern of cardiac dysfunction. We systematically assessed high sensitivity assays on all patients, and at four pre-defined time points including at baseline. Although our study is subject to the regression to the mean phenomenon, our separate analyses by baseline status of NTproBNP and hsTropT found no significant decreases in their levels in the patients with abnormal baseline values. Of note, our institutional policy excludes patients with MI in the last 12 months and, thus, our patients may be less predisposed to developing MACE. Interestingly, at least 40% of patients had abnormal hsTropT or NTproBNP at baseline. The impact of pre-CAR T lymphodepleting chemotherapy on hsTropT and NTproBNP is not known and needs to be investigated. Future studies should be prospective and focus on tracking both left ventricular function and cardiac enzymes to reconcile the findings of these early studies of the cardiac side effect profile of CAR T in the literature.
In conclusion, in our prospective analysis, hsTropT did not differ across timepoints after CAR T therapy, but NTproBNP rose at day 7, the prognostic implications of which should be the target of future research. In addition, a significant proportion of patients had cardiac enzymes that were abnormal at baseline. Elucidating the cardiovascular risks of CAR T will be an important endeavor in the coming years since an increasing number of patients with poor baseline cardiovascular risk profiles will receive CAR T, as the indications for this therapy expand.
COMPETING INTERESTS
DBJ reports consulting fees from Array Biopharma, BMS, Iovance, Jansen, Merck, Novartis. JES reports receiving consulting fees from Bristol-Myers Squibb. OO reports consulting fees from Kite/Gilead, Spectrum, Pfizer and Bayer. JJM has served on advisory boards for Bristol Myers Squibb, Takeda, Regeneron, Audentes, Deciphera, Ipsen, Janssen, ImmunoCore, Boston Biomedical, Amgen, Myovant, Triple Gene/Precigen, Cytokinetics and AstraZeneca. The remaining authors have no conflicts of interest.
AUTHORS’ CONTRIBUTION
OO and JJM secured funding. JJM, OO, JRH and AP designed the study. KT, JFO, YRS, KBD, YZ and RTO collected samples and measured biomarkers. JRH and SH performed statistical analysis. JRH drafted the initial manuscript. JJM, OO, AP, JES and SH critically revised the manuscript. All authors approved the final version of the manuscript.
FUNDING
The project was supported by
SUPPLEMENTARY MATERIALS
Supplementary data related to this article can be found at
Footnotes
REFERENCES
Cite this article
TY  - JOUR
AU  - Jiun-Ruey Hu
AU  - Ameet Patel
AU  - Shi Huang
AU  - Yan Ru Su
AU  - Kimberly B. Dahlman
AU  - Kelsey Tomasek
AU  - Yueli Zhang
AU  - Richard T. O’Neil
AU  - Jamye F. O’Neal
AU  - Isik Turker
AU  - Douglas B. Johnson
AU  - Joe-Elie Salem
AU  - Javid J. Moslehi
AU  - Olalekan Oluwole
PY  - 2021
DA  - 2021/08/02
TI  - High Sensitivity Troponin T and NT-proBNP in Patients Receiving Chimeric Antigen Receptor (CAR) T-Cell Therapy
JO  - Clinical Hematology International
SP  - 96
EP  - 102
VL  - 3
IS  - 3
SN  - 2590-0048
UR  - https://doi.org/10.2991/chi.k.210718.001
DO  - 10.2991/chi.k.210718.001
ID  - Hu2021
ER  -