
Forecasting COVID-19 Cases in Algeria using Logistic Growth and Polynomial Regression Models
 , Malavika Babu2
- DOI
- 10.2991/dsahmj.k.210630.001How to use a DOI?
- Keywords
- COVID-19; logistic growth model; polynomial regression model; forecasting
- Abstract
Coronavirus disease 2019 (COVID-19) continues to spread worldwide since its emergence in December 2019 in Wuhan, China, and as of January 3, 2021 more than 84.4 million cases and 1.8 million deaths have been reported. To predict COVID-19 cases in Algeria, we applied two models—the logistic growth model and the polynomial regression model—using the data on COVID-19 cases reported by the Algerian Ministry of Health from February 25 to December 2, 2020. Results showed that the polynomial regression model better fitted the data of COVID-19 in Algeria compared with the logistic model. The first model estimated the number of cases on January 19, 2021 to reach 387,673. This model can help Algerian authorities in the fight against this disease.
- Copyright
- © 2021 Dr. Sulaiman Al Habib Medical Group. Publishing services by Atlantis Press International B.V.
- Open Access
- This is an open access article distributed under the CC BY-NC 4.0 license (http://creativecommons.org/licenses/by-nc/4.0/).
1. INTRODUCTION
Coronavirus Disease 2019 (COVID-19), which is caused by a virus from the family of Coronaviridae, is the third epidemic reported in the 21st century, after severe acute respiratory syndrome in 2003 and Middle East respiratory syndrome in 2012 [1]. However, the propagation of this disease is faster compared with the other two. It originated from Wuhan, China, in December 2019, and began to spread widely and rapidly in all countries and regions of the planet, and was declared a pandemic in March 2020. The number of cases continues to rise, reaching a total of more than 84.4 million and resulting in nearly 2 million deaths by January 3, 2021 [2].
It is important to understand the epidemic evolution and evaluate the protective measures applied by national authorities. To attain these objectives, mathematical and statistical models provide a valuable framework for prediction of cases but also to help authorities plan control and preventive measures against the pandemic. These models, which use various sources of data, can test multiple strategies in simulations prior to their actual application [3].
Since the first reported COVID-19 cases, numerous models have been used to predict the curve evolution and to estimate the final number of cases. Among these tools, logistic growth models have been previously used to describe epidemic spread [4,5]. These simpler tools are very popular and have been applied for COVID-19 short-term forecasting [6–9] and also for prediction of the final number of cases [10–12]. Roosa et al. [13] applied a generalized logistic growth model to evaluate the impact of preventive actions and predict the final number of cases in China. Vattay [14] used the logistic growth model to compare COVID-19 death figures in Hubei (China) and Italy, and predicted the end date in Italy. Wu et al. [15] used four logistic growth models (the classical logistic growth, the generalized logistic, the generalized Richards, and the generalized growth models) to analyze the growth of COVID-19 in Chinese provinces and further applied them to predict the number of cases in other European, American, and Asian countries.
Roosa et al. [16] used a generalized logistic growth, the Richards growth model, and a subepidemic wave model for short-term prediction of COVID-19 cases in two provinces of China: Guangdong and Zhejiang. They observed that the generalized logistic growth and Richards models showed similar predictions, whereas the subepidemic model showed a lower prediction accuracy.
Balaban [17] compared the performance of five growth models (i.e., logistic growth, von Bertalanffy growth, exponential growth, Gaussian growth, and Richards growth models) and used them to forecast COVID-19 spread in Turkey. The author showed that the von Bertalanffy model had the best performance, but the exponential model predicted the total deaths and cases better than the other models. Meanwhile, Zhou et al. [18] used the logistic growth and the Susceptible–Exposed–Infectious–Removed (SEIR) models to predict the spread of COVID-19. They reported that the total number of cases estimated by the logistic model was consistently lower than that estimated by the SEIR model.
In another study, Batista [12] tried to estimate the final number of COVID-19 cases worldwide using the logistic and Susceptible–Infected–Removed (SIR) models. The author used the logistic model to forecast daily predictions and the size of the COVID-19 epidemic for China, South Korea, as well as the rest of the world [12].
Malhotra and Kashyap [19] calibrated the SIR model and the logistic growth model to predict the end of COVID-19 pandemic in India and three states.
Another tool regarded as one of the best tools to analyze and predict pandemic growth is polynomial regression. This special type of multiple regression method was applied in several studies to analyze the behavior of COVID-19 [20–24]. It has shown 99.85% accuracy in the study of Yadav et al. [25].
Prakash et al. [26] used artificial neural network and regression to model the COVID-19 curve in India and other countries such as the United States, Italy, and Spain. The authors observed that the results of polynomial regression are similar to the real data in India and the United States, but not in Italy and Spain. They also used these models to predict the epidemic’s peak in the cited countries.
Belfin et al. [27] used an SEIR and polynomial regression models to estimate the peak of the COVID-19 epidemic and the basic reproduction number in India, respectively.
Meanwhile, Amar et al. [28] applied seven regression models for the COVID-19 dataset. They reported that the fourth-degree polynomial regression model is the most adapted. Moreover, the exponential, fifth-degree, and sixth-degree polynomial regression models are all considered excellent tools.
In the same way, Chakraborty et al. [29] compared the performance of the linear regression model, granular box regression, and the polynomial regression model in predicting the spread of COVID-19 in India. The authors reported that the polynomial regression model outperformed the two other models.
Algeria repotted its first case on February 25, 2020. Since then, a total number of 99,897 cases and 2762 deaths have been reported [30]. Despite the different preventive measures applied since March 2020, the number of cases continued to increase. Thus, the short- and long-term estimation of the number of COVID-19 cases and prediction of the curve evolution are of great importance to understand the epidemic curve. The current work was conducted to predict the number of case using a logistic growth model.
2. MATERIALS AND METHODS
2.1. Data Sources
In the present study, the used datasets of COVID-19 confirmed cases were taken from the daily reports of the Algerian Ministry of Health from February 25 (when the first case was reported) to December 2, 2020 [30]. The number of confirmed cases was based on reverse transcription-polymerase chain reaction positive test results. The number of COVID-19 cases in Algeria as of December 2, 2020 was 85,084. In parallel, the number of recovered and dead persons reached 54,979 and 22,464, respectively.
To predict the number of cumulative cases of COVID 19 in Algeria, we used both modified logistic growth model and polynomial regression.
2.2. Modified Logistic Growth Model
Logistic growth is defined as follows. During the starting period, the growth increases exponentially, but at a later phase, as we approach the maximum it becomes stable. In the case of COVID-19, this maximum is represented by the total number of inhabitants in the world, knowing that when all people are sick, the growth will systematically decrease.
The modified logistic growth model is described by the following equation [31,32]:
- •
The number of cases at the first period (initial value) is: C/(1 + a)
- •
The maximum growth rate is at t = ln(a)/b
- •
If y = c (when the population is at maximum), y/C = 1. Therefore, 1 − (y/c) = 0 (growth = 0).
2.3. Polynomial Regression
Polynomials are generally used in curvilinear situation, as even complex nonlinear relationships can be adequately modeled by polynomials over reasonably small ranges of x’s. The kth-order polynomial model in one variable is generally defined as follows:
In this equation, we used polynomial regression with 6 degrees.
3. RESULTS
3.1. Logistic Growth Model
Figures 1 and 2 show that the logistic growth model does not work well for COVID-19 cases in Algeria. The model shows flattening but the number of cases is actually still increasing. To get a better fit using the logistic growth model, we had to wait for several more days to ascertain the trend of the data in upcoming days.
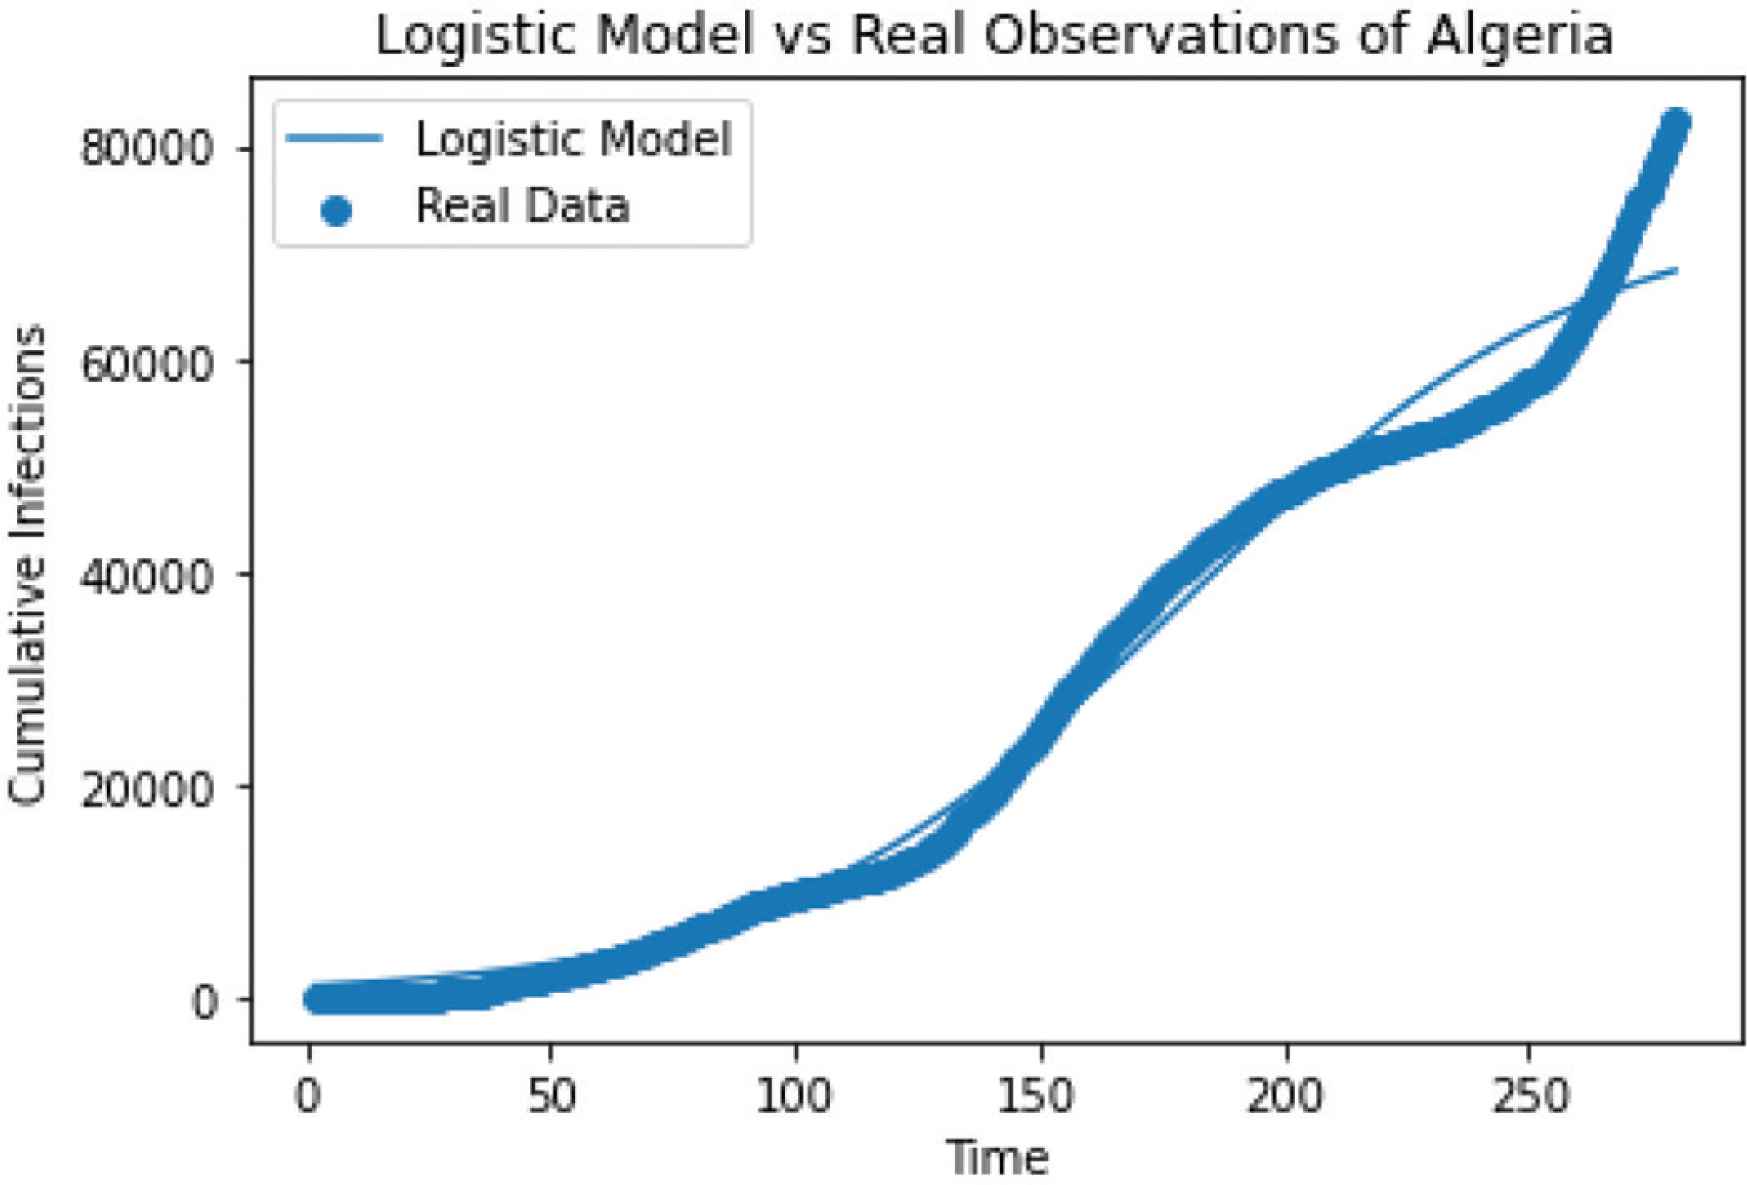
Modeling COVID-19 cases in Algeria using the logistic growth model.
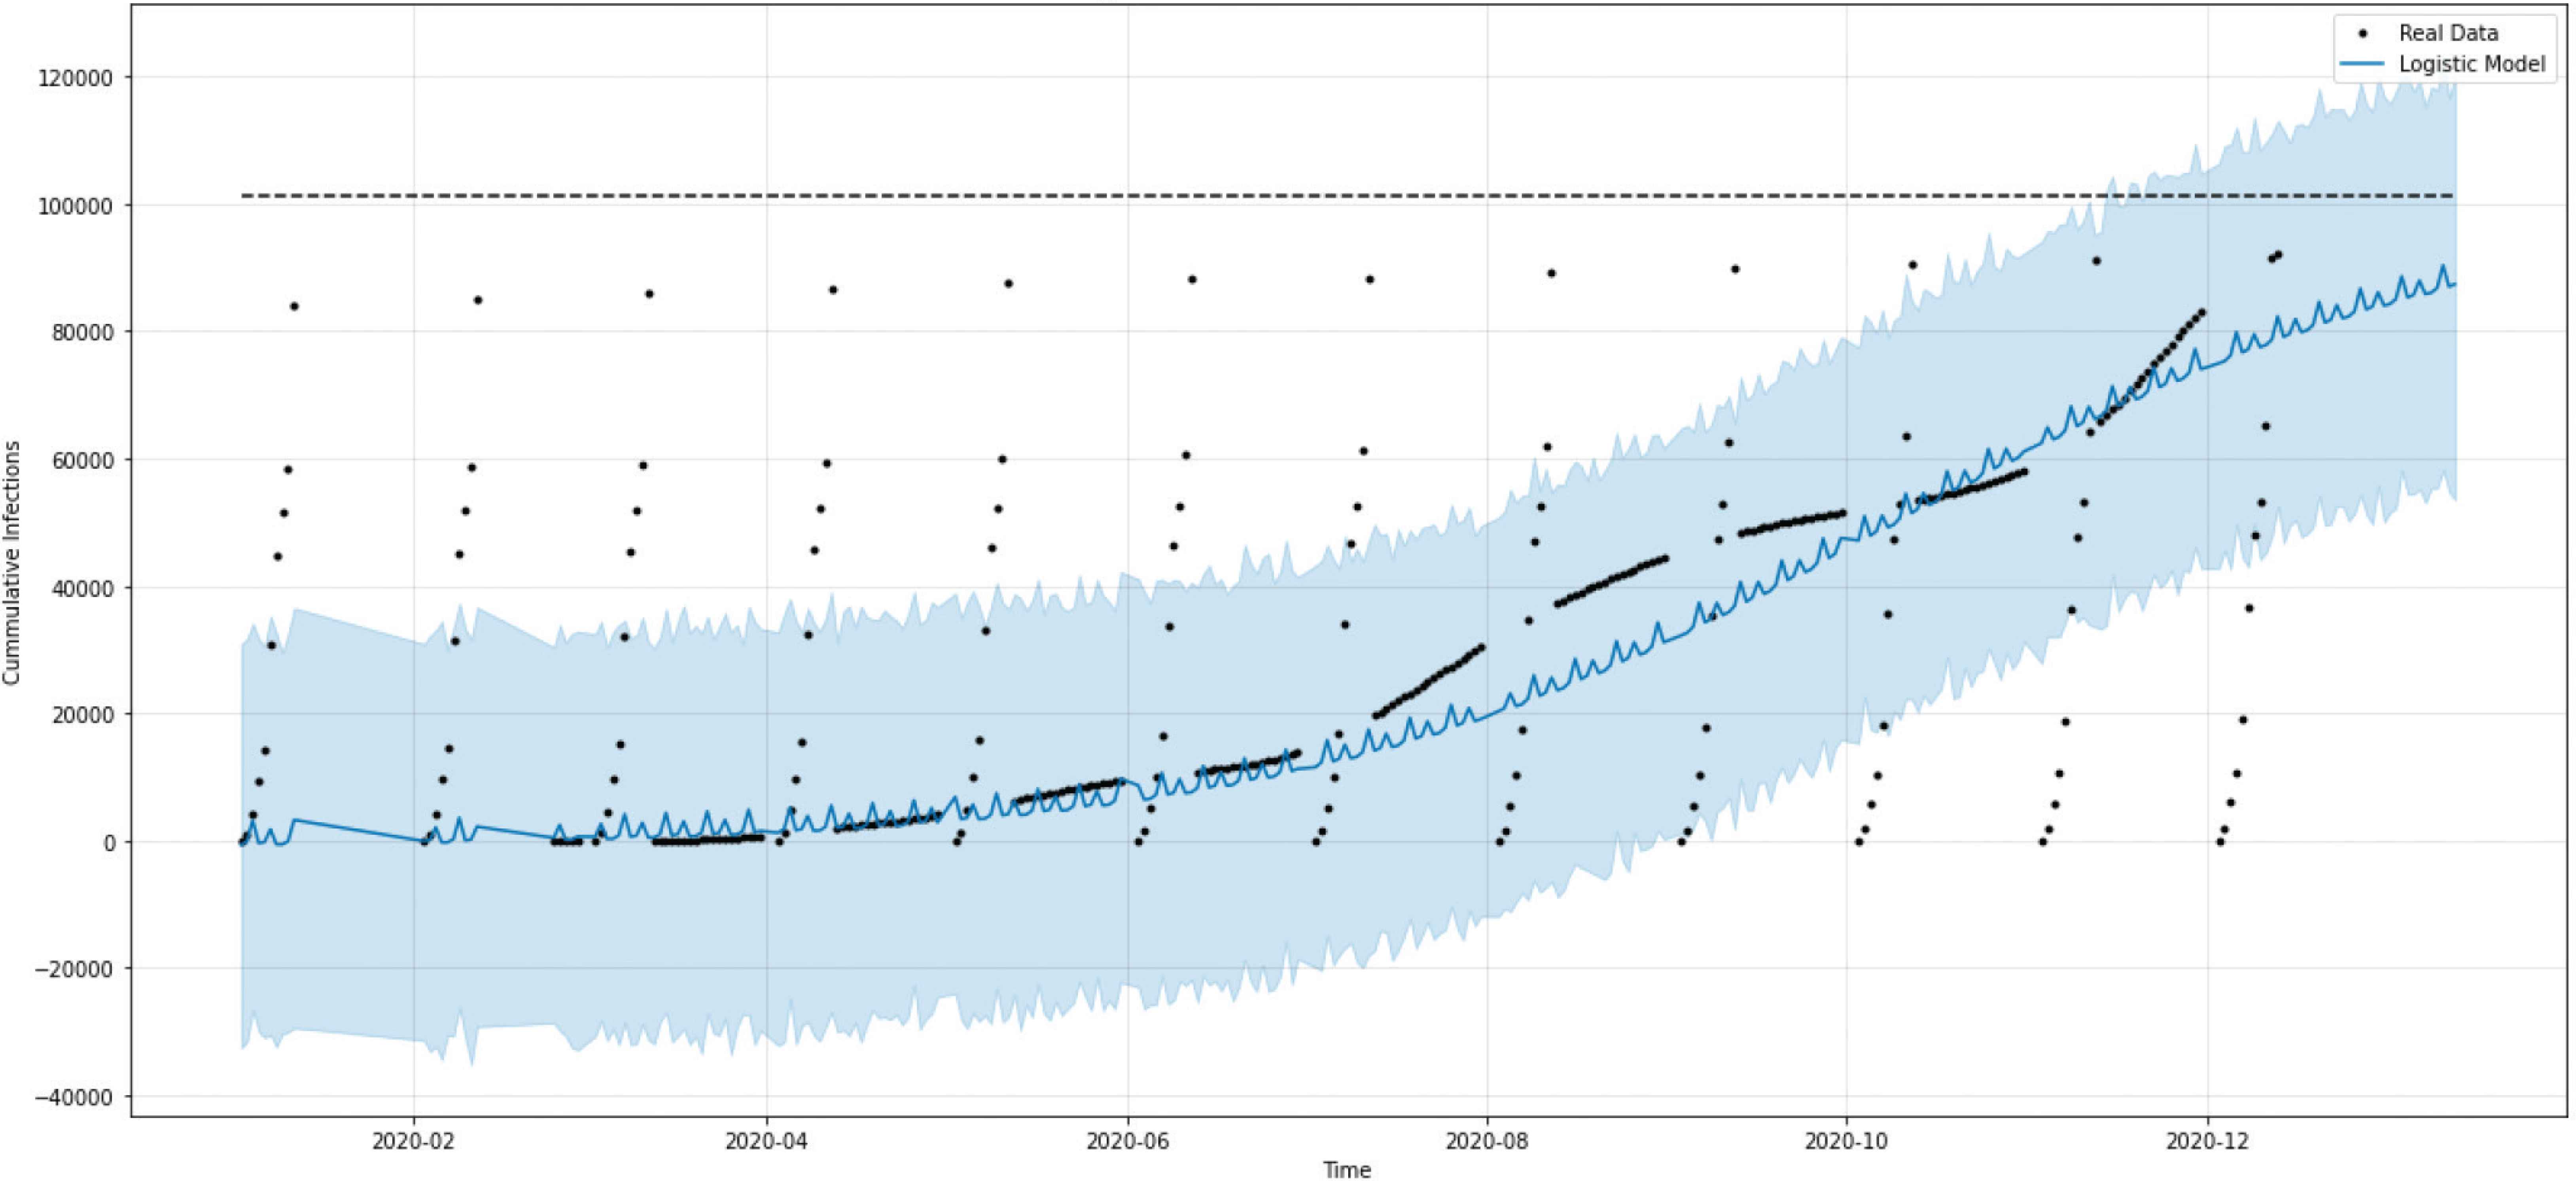
Prediction of COVID-19 cases in Algeria using the logistic growth model.
3.2. Polynomial Regression
As shown in Figure 3, the data fitted well in the polynomial regression model. The predictions in Table 1 show that the total number of COVID-19 cases will reach 387,673 (372,809–402,538) cases on January 19, 2021.
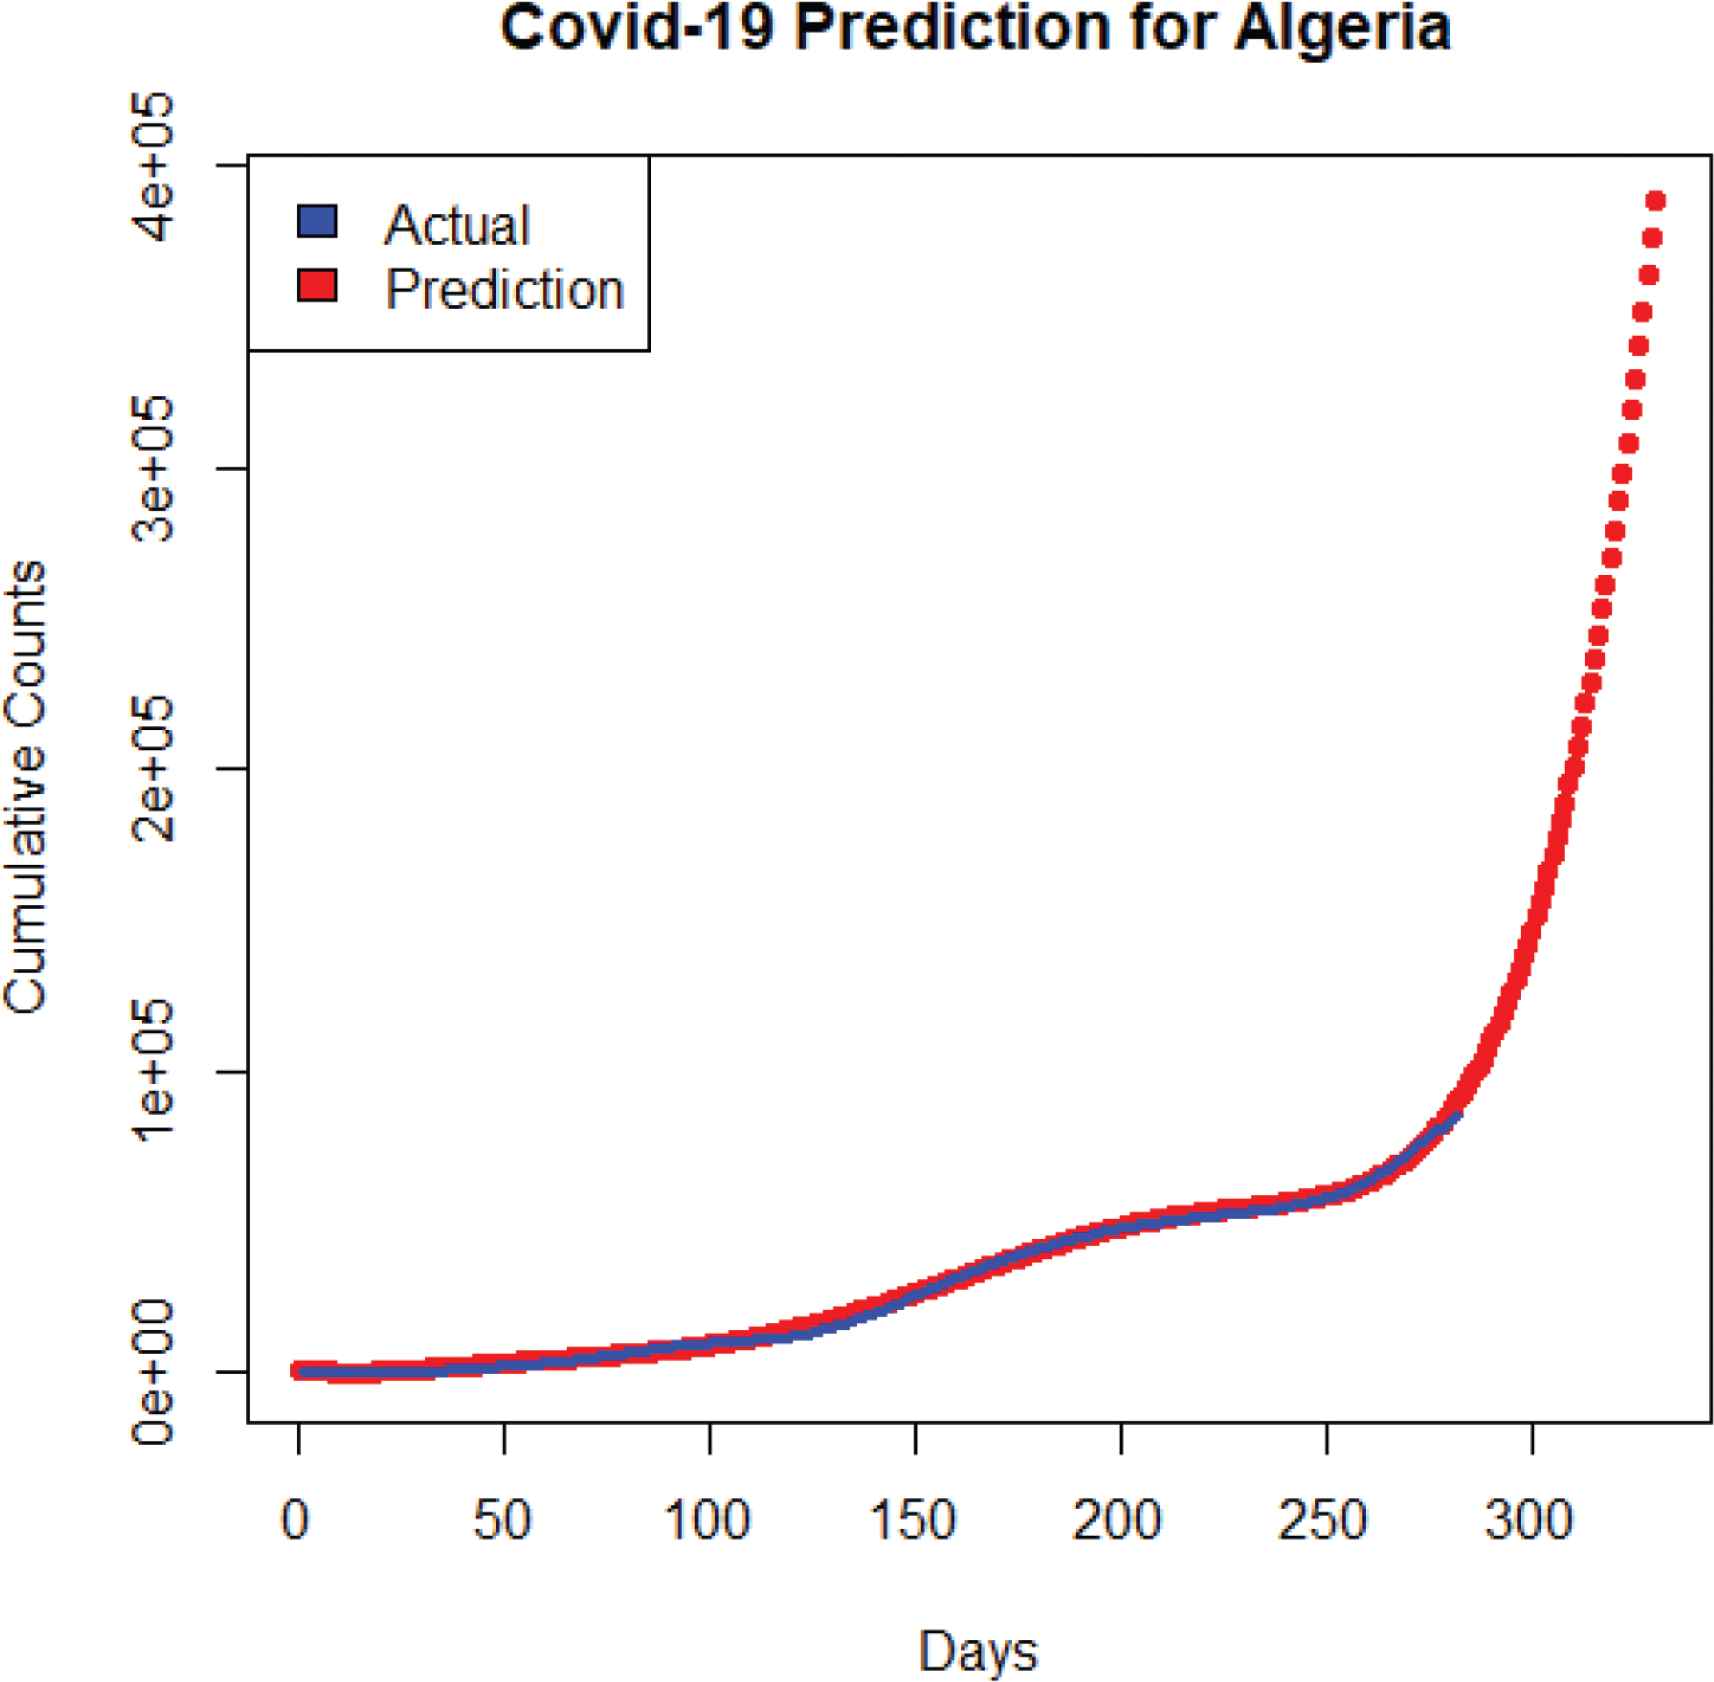
Predicted COVID-19 cases in Algeria using the polynomial regression model.
| Days | Date | Observed cases | Predicted cases | Lower | Upper |
|---|---|---|---|---|---|
| 282 | 2 December 2020 | 85084 | 89,340 | 88543 | 90,136 |
| 283 | 3 December 2020 | NA | 91,433 | 90566 | 92,300 |
| 284 | 4 December 2020 | NA | 93,629 | 92685 | 94,572 |
| 285 | 5 December 2020 | NA | 95,930 | 94903 | 96,956 |
| 286 | 6 December 2020 | NA | 98,341 | 97226 | 99,455 |
| 287 | 7 December 2020 | NA | 100,865 | 99655 | 102,074 |
| 288 | 8 December 2020 | NA | 103,506 | 102196 | 104,817 |
| 289 | 9 December 2020 | NA | 106,270 | 104851 | 107,688 |
| 290 | 10 December 2020 | NA | 109,158 | 107625 | 110,691 |
| 291 | 11 December 2020 | NA | 112,177 | 110523 | 113,831 |
| 292 | 12 December 2020 | NA | 115,330 | 113547 | 117,113 |
| 293 | 13 December 2020 | NA | 118,621 | 116702 | 120,540 |
| 294 | 14 December 2020 | NA | 122,056 | 119994 | 124,118 |
| 295 | 15 December 2020 | NA | 125,638 | 123425 | 127,851 |
| 296 | 16 December 2020 | NA | 129,373 | 127000 | 131,745 |
| 297 | 17 December 2020 | NA | 133,264 | 130724 | 135,804 |
| 298 | 18 December 2020 | NA | 137,318 | 134602 | 140,034 |
| 299 | 19 December 2020 | NA | 141,540 | 138639 | 144,441 |
| 300 | 20 December 2020 | NA | 145,933 | 142838 | 149,028 |
| 301 | 21 December 2020 | NA | 150,504 | 147205 | 153,802 |
| 302 | 22 December 2020 | NA | 155,257 | 151746 | 158,769 |
| 303 | 23 December 2020 | NA | 160,199 | 156464 | 163,934 |
| 304 | 24 December 2020 | NA | 165,335 | 161366 | 169,303 |
| 305 | 25 December 2020 | NA | 170,670 | 166457 | 174,882 |
| 306 | 26 December 2020 | NA | 176,209 | 171742 | 180,677 |
| 307 | 27 December 2020 | NA | 181,960 | 177227 | 186,694 |
| 308 | 28 December 2020 | NA | 187,928 | 182916 | 192,940 |
| 309 | 29 December 2020 | NA | 194,119 | 188817 | 199,421 |
| 310 | 30 December 2020 | NA | 200,539 | 194935 | 206,143 |
| 311 | 31 December 2020 | NA | 207,194 | 201275 | 213,113 |
| 312 | 1 January 2021 | NA | 214,092 | 207844 | 220,339 |
| 313 | 2 January 2021 | NA | 221,237 | 214649 | 227,826 |
| 314 | 3 January 2021 | NA | 228,638 | 221694 | 235,582 |
| 315 | 4 January 2021 | NA | 236,301 | 228987 | 243,615 |
| 316 | 5 January 2021 | NA | 244,233 | 236534 | 251,931 |
| 317 | 6 January 2021 | NA | 252,440 | 244342 | 260,538 |
| 318 | 7 January 2021 | NA | 260,930 | 252418 | 269,443 |
| 319 | 8 January 2021 | NA | 269,711 | 260768 | 278,654 |
| 320 | 9 January 2021 | NA | 278,790 | 269399 | 288,180 |
| 321 | 10 January 2021 | NA | 288,173 | 278319 | 298,028 |
| 322 | 11 January 2021 | NA | 297,870 | 287534 | 308,206 |
| 323 | 12 January 2021 | NA | 307,887 | 297053 | 318,722 |
| 324 | 13 January 2021 | NA | 318,233 | 306882 | 329,585 |
| 325 | 14 January 2021 | NA | 328,916 | 317029 | 340,804 |
| 326 | 15 January 2021 | NA | 339,944 | 327501 | 352,386 |
| 327 | 16 January 2021 | NA | 351,325 | 338308 | 364,342 |
| 328 | 17 January 2021 | NA | 363,068 | 349455 | 376,680 |
| 329 | 18 January 2021 | NA | 375,181 | 360953 | 389,409 |
| 330 | 19 January 2021 | NA | 387,673 | 372809 | 402,538 |
NA, not available.
Predicted cumulative COVID-19 case number for Algeria
4. DISCUSSION
In this work, we used two types of models to predict COVD-19 cases in Algeria: logistic growth model and polynomial growth model.
Results showed that the logistic growth model, despite its wide use in forecasting COVID-19 curve, exhibited discordance between real and fitted data from March 25 to December 2, 2020. In the same manner, Abusam et al. [33] showed that both Velhust and Richards models are not well adapted and needs more parameterization for COVID-19 predictions in Kuwait.
Regarding the polynomial regression model, results showed that this model fitted well COVID-19 data in Algeria. These results are in accordance of those of Amar et al. [28], who showed that the exponential and polynomial regression (fourth-degree, fifth-degree, and sixth-degree) models fitted excellently the COVID-19 evolution, especially the fourth-degree polynomial regression model.
However, the limitation of our model is that we cannot make predictions for more than 60 days. Usually, polynomial regression is used for short-term prediction. This type of model was widely used in the case of COVID-19 [20–24] and has shown excellent accuracy in certain cases [25].
5. CONCLUSION
A forecast study of COVID-19 cases in Algeria was conducted in this study using logistic growth and polynomial regression models based on data from February 25 to December 2, 2020. Results showed that the polynomial regression model is more adaptable for COVID-19 forecasting in Algeria. Thus, we used this model to predict the short-term future cases until January 19, 2020. The number of cases for this date was projected to reach 387,673 cases. This model could help the Algerian government in adapting the best strategies against the COVID-19 epidemic.
CONFLICTS OF INTEREST
The authors declare they have no conflicts of interest.
AUTHORS’ CONTRIBUTION
ML contributed in design, data collection, writing and reading the final manuscript. BM contributed in data analysis and writing the manuscript.
REFERENCES
Cite this article
TY  - JOUR
AU  - Mohamed Lounis
AU  - Malavika Babu
PY  - 2021
DA  - 2021/07/08
TI  - Forecasting COVID-19 Cases in Algeria using Logistic Growth and Polynomial Regression Models
JO  - Dr. Sulaiman Al Habib Medical Journal
SP  - 83
EP  - 87
VL  - 3
IS  - 3
SN  - 2590-3349
UR  - https://doi.org/10.2991/dsahmj.k.210630.001
DO  - 10.2991/dsahmj.k.210630.001
ID  - Lounis2021
ER  -