
Estimating the Incidence of SARS-CoV-2 Cases in Belize Based on Mortality Rate
 , Cyleen Morgan2, , Chieh-Wen Ed Hsu2, Biru Yang3
- DOI
- 10.2991/dsahmj.k.210531.001How to use a DOI?
- Keywords
- COVID-19; Markov model; mortality rate; wavelength; undetected cases; Belize
- Abstract
Developing countries such as Belize have been facing profound challenges in their quest to effectively track cases of Coronavirus Disease 2019 (COVID-19) and contain the pandemic within their own territory. We assume that at the heights of a COVID-19 wave the number of daily reported cases are substantially lower (often under-reported) than the true number of cases that exist and are reported on a daily basis. Here, we attempt to quantitatively derive the number of daily undetected cases of Severe Acute Respiratory Syndrome Coronavirus 2 (SARS-CoV-2) in Belize. We also used the Markov’s Model to correlate the current mortality rate in Belize with the reported incidence of SARS-CoV-2 infections in Belize. We also proposed a differential mathematical model for estimating a dynamic mortality rate. Finally, we demonstrated the ability to estimate the wavelength and amplitude of a COVID-19 wave. Nations worldwide can anticipate two COVID-19 waves annually with an average of 3 months apart. How vaccines and emerging variants potentially skew the amplitude of a COVID-19 wave requires further inquiry. Our findings are therefore relevant to all countries in their quest to develop and implement swift and versatile national healthcare response measures. The present study, however, is particularly relevant to the countries with underdeveloped healthcare systems. These countries often experience economic and resource challenges around building an effective COVID-19 surveillance system to test and report daily COVID-19 cases.
- Copyright
- © 2021 Dr. Sulaiman Al Habib Medical Group. Publishing services by Atlantis Press International B.V.
- Open Access
- This is an open access article distributed under the CC BY-NC 4.0 license (http://creativecommons.org/licenses/by-nc/4.0/).
1. INTRODUCTION
A year has elapsed since the emergence of Coronavirus Disease 2019 (COVID-19) pandemic caused by Severe Acute Respiratory Syndrome Coronavirus 2 (SARS-CoV-2). As of March 26, 2021, over 126,293,566 cases have been confirmed worldwide, resulting in over 2,770,518 deaths [1]. COVID-19 has presented an ever-growing threat to public health systems everywhere and specifically to local economies worldwide [2]. For various reasons (including those discussed below), the nature of SARS-CoV-2 has made it immensely challenging for effective screening and diagnosis [3].
In particular, developing countries like Belize have been facing profound challenges in their quest to effectively track COVID-19 cases and contain outbreaks on a local and national level [4–6]. We anticipate that the number of daily reported cases is significantly lower than the actual occurrence in the community. We presume that this disparity is attributed to the substantial number of asymptomatic or undetected patients, as well as lack of testing and reporting due to a fragmented public health surveillance system.
Understanding the true incidence of COVID-19 (sum of reported and undetected cases) with respect to its wavelength and amplitude, is essential to surveillance and effective disease control, and is critical to the Gross National Wellbeing of all nations. This information can assist epidemiologists, particularly in developing countries, to gauge the dynamic process of restrictions, relaxations, and other forms of public health interventions on a daily basis for disease containment [7,8].
In order to acquire a more accurate count of the cases, we used the Markov’s Model to correlate the current mortality rate reported by the World Health Organization (WHO) with the true incidence of COVID-19 in Belize [9]. On March 23, 2020, Belize reported its first case of COVID-19 [1,10]. The initial wave resulted in a total of 18 cases and two deaths, followed by a trough [1,11]. The second wave began in September 2020, peaking at 506 daily confirmed cases in December 2020 [1].
Coronavirus disease 2019 is a rapidly evolving pandemic and there is a substantial lag in identifying, testing and reporting new cases at the peak of the waves [3–5]. Inadequate access to healthcare facilities and testing in numerous remote communities in Belize may also be a contributing factor to unreported cases and even unreported deaths [7,8,11]. We have therefore developed a mathematical model for estimating the true incidence of COVID-19, projecting future mortality numbers, and estimating the length and amplitude of COVID-19 waves. Our study is particularly useful to populations with underdeveloped healthcare systems.
2. MATERIALS AND METHODS
2.1. WHO Data
The data up to November 12, 2020 were retrieved from the WHO (Table 1). Statistical analysis was performed using Prism 5 and Microsoft Excel 2016.
| Variable | Abbreviation | Definition |
|---|---|---|
| New reported daily cases | NRDC | Number of cases reported every 24 h |
| Confirmed cases | CC | Persons who tested positive for SARS-CoV-2 |
| Adjusted daily cases | ADC | The number of SARS-CoV-2 related deaths multiplied by the mortality rate minus the recovered cases |
| Cumulative deaths | CD | Summation of daily deaths |
| Mortality rate | MR | WHO reported deaths divided by confirmed cases |
| Recovered daily cases | RDC | Individuals who have had two consecutive negative tests after being identified as a confirmed case |
| Undetected cases | UC | Cases that have not been identified or have not been reported. This may include asymptomatic cases but not recovered cases |
| Incidence | I | Proportion of persons who contracted SARS-CoV-2 since the start of the pandemic |
| Active cases | AC | The difference between cumulative reported cases and cumulative recovered cases |
Defining key epidemiological variables
2.2. Deriving Mortality Rate, Adjusted Daily Cases and Undetected Cases
Mortality Rate (MR), Adjusted Daily Cases (ADCs) and Undetected Cases (UCs) were calculated using the following equations.
2.3. First-order Markov’s Model to Correlate WHO Mortality Rate with the Incidence Rate
The diseased state leads to two other mutually exclusive states, the recovered state, and the final and ultimate state (deceased) (Figure 1). Using the WHO mortality rate collected from its website, we may presume that 3% of the total population with COVID-19 may eventually die from this cause. We can therefore extrapolate the mortality rate to derive a true reflection of the population with COVID-19, which can be termed ‘adjusted cases’.
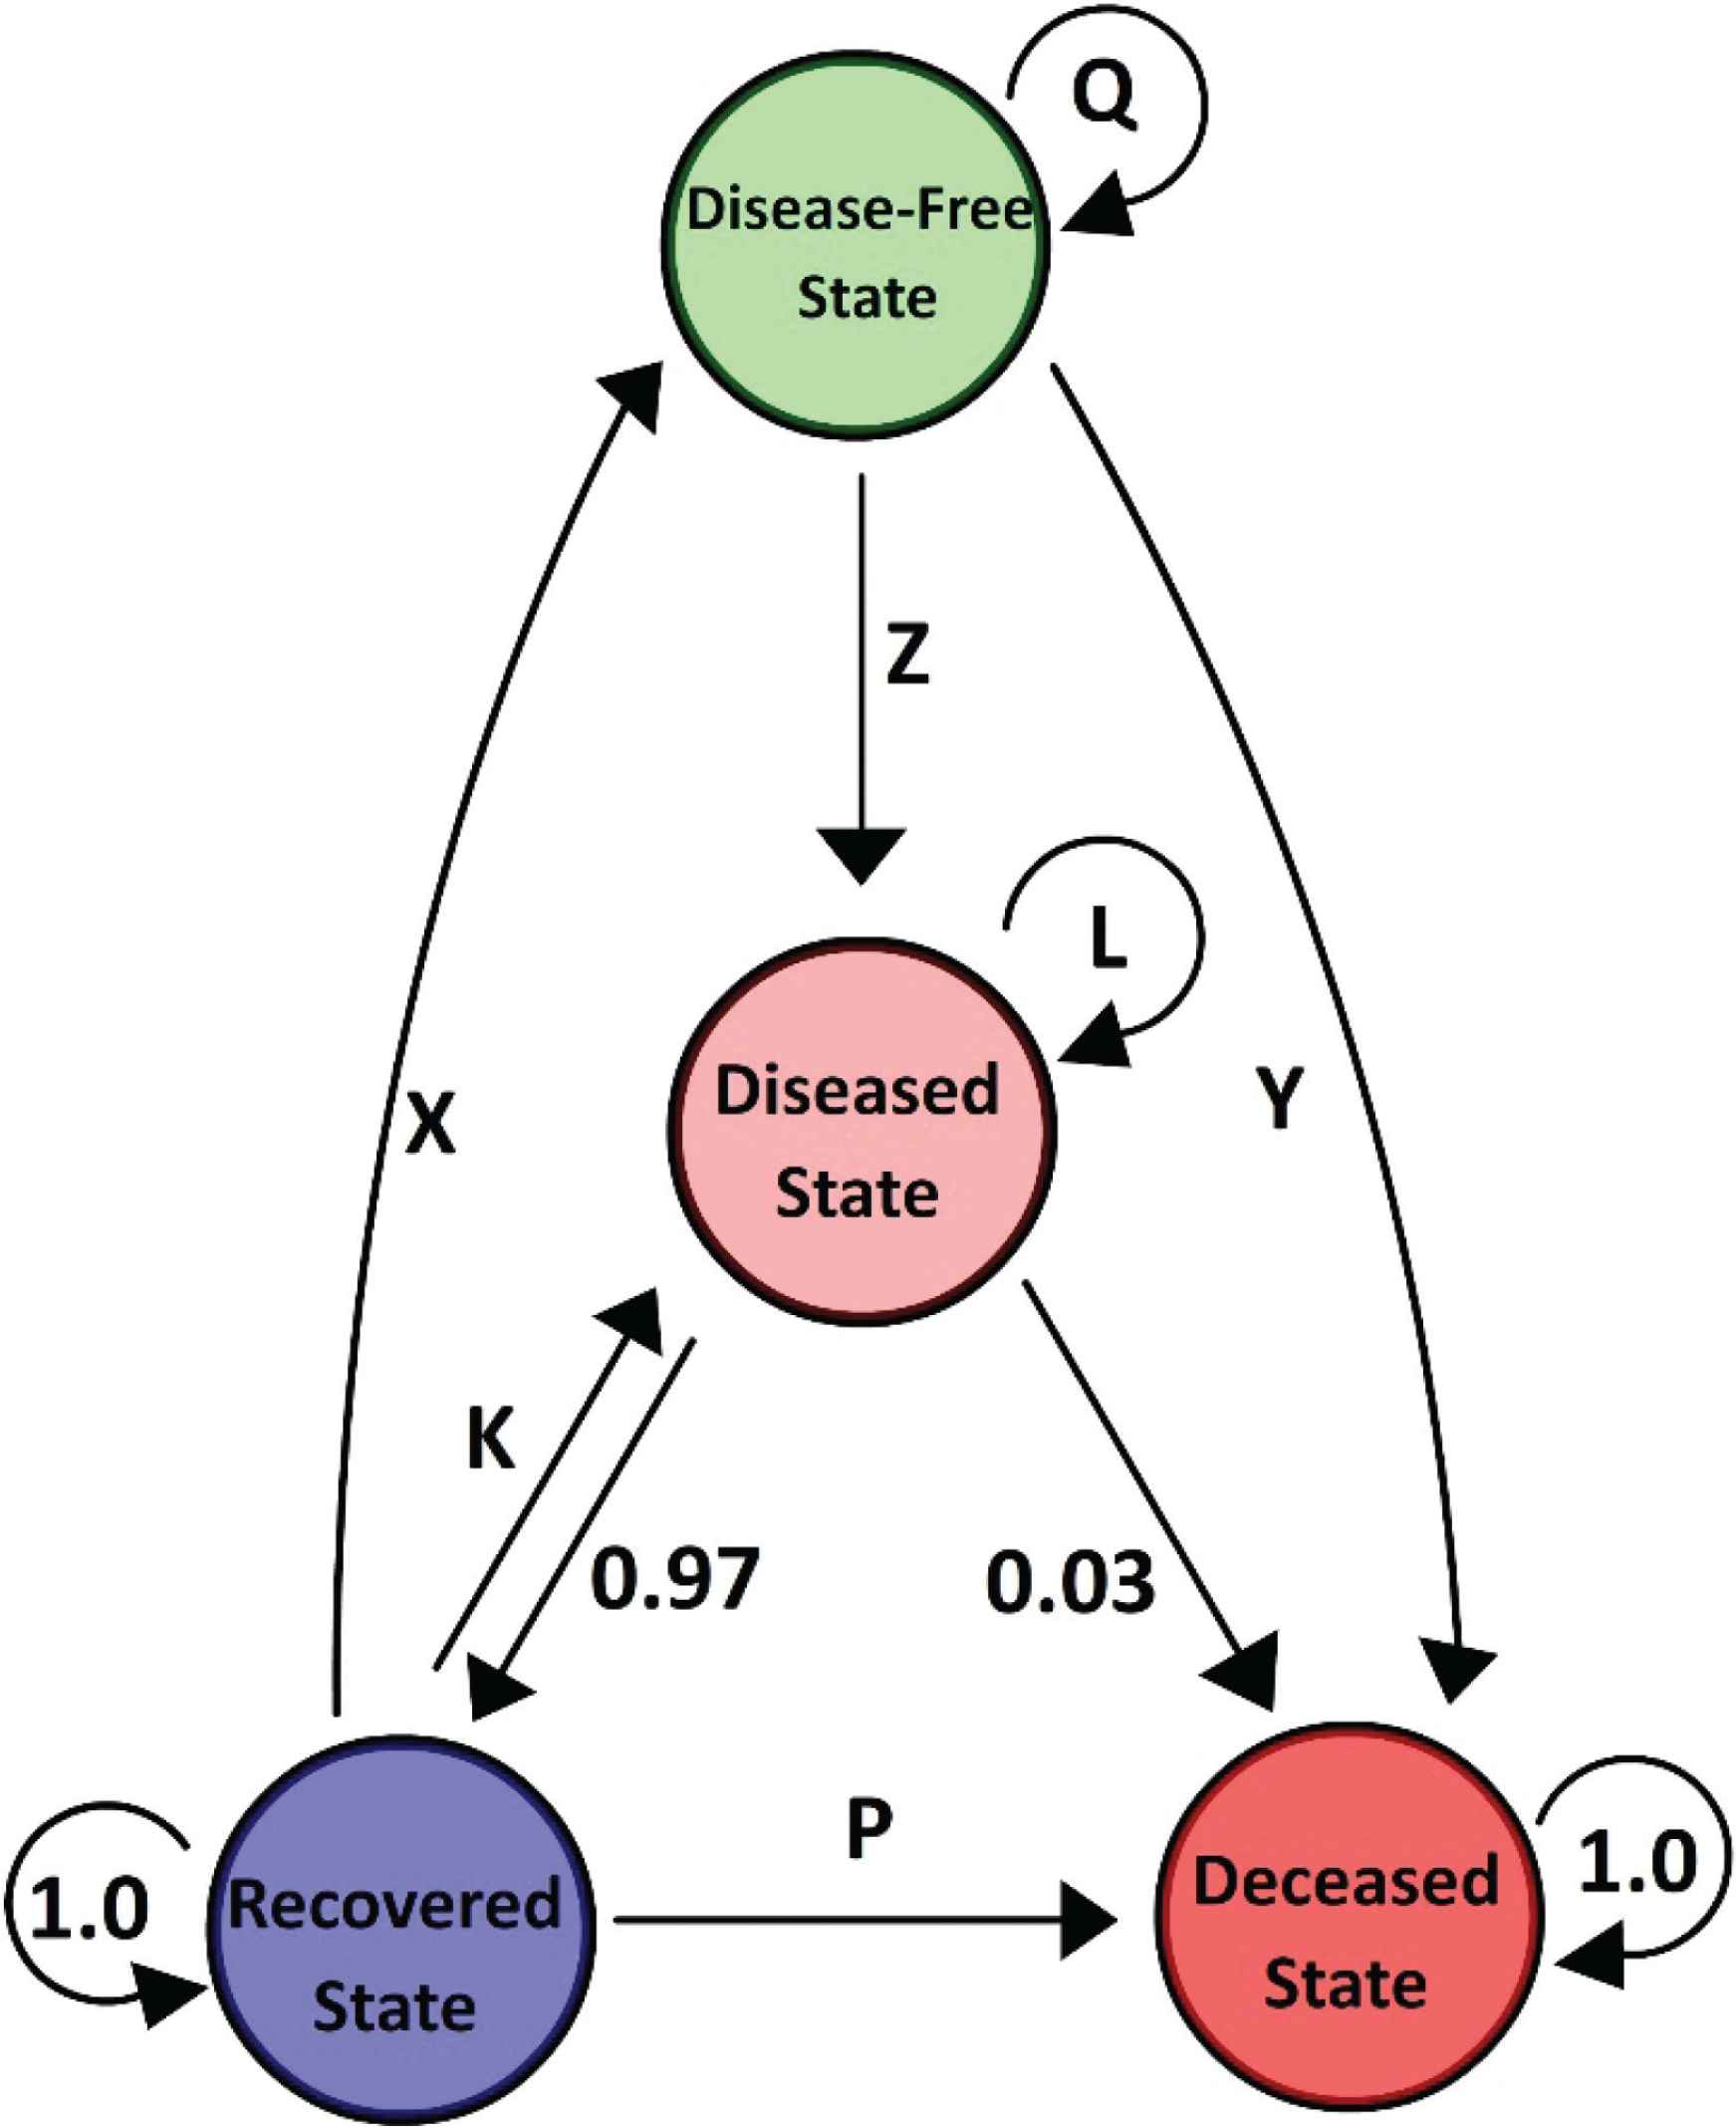
First-order Markov’s Model to correlate WHO mortality rate with the incidence rate. The diseased state leads to two other mutually exclusive states, the recovered state, and the final and ultimate state (diseased). Using the WHO mortality rate collected from its website, we may presume that 3% of the total population with COVID-19 may eventually die from this cause. We can therefore extrapolate the mortality rate to derive a true reflection of the population with COVID-19, which can be termed ‘Adjusted Cases’.
The matrix describing the Markov Chain was called the transition matrix (Figure 2). In the transition matrix M, the rows represent now, or from (Mt) while the columns represent next, or to (Mt+1). (a and b) represent the conditional probability that next = b, given that now = a; that is, the probability of going from state a to state b (Equation 4).
The transition matrix P must list all possible states in the state space S. While, P is a square matrix (N × N), as Mt+1 and Mt both take values in the same state space S (of size N). The rows of P should sum to 1, but not necessarily for the columns of P.
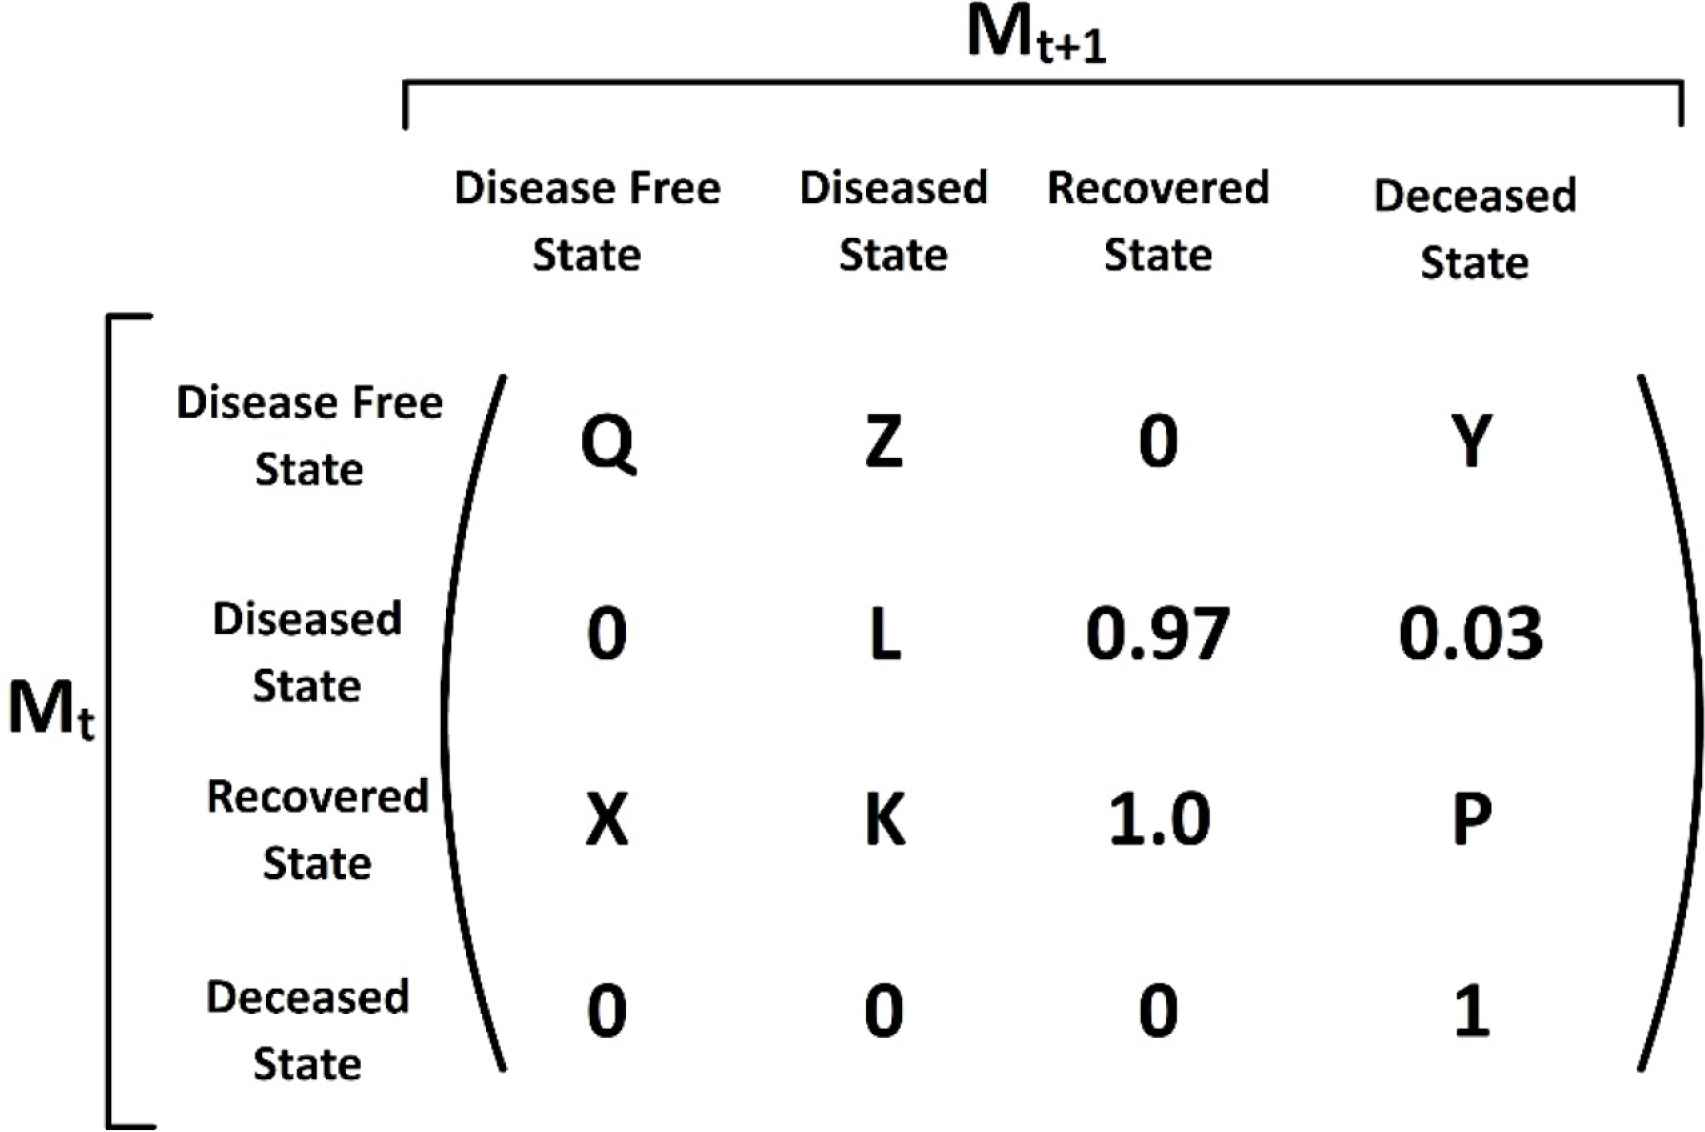
The matrix describing the Markov Chain is called the transition matrix. Here the transition matrix was employed to analyze the Markov Chain (Figure 1).
2.4. Estimating the Length and Amplitude of a COVID-19 Wave
Data retrieval was from the WHO dataset that included 18 counties from around the world. Using arithmetic means, the average time from peak to trough was approximated at 3 months (Supplementary Table S1). The average trough time of the baseline (time between end of first wave and start of second wave) was determined to be ~3 months (Supplementary Table S1). The baseline (ratio of peak to trough) was estimated to be when the 7-day average of daily confirmed cases remained at ≤10% of the peak value (Figure 3).
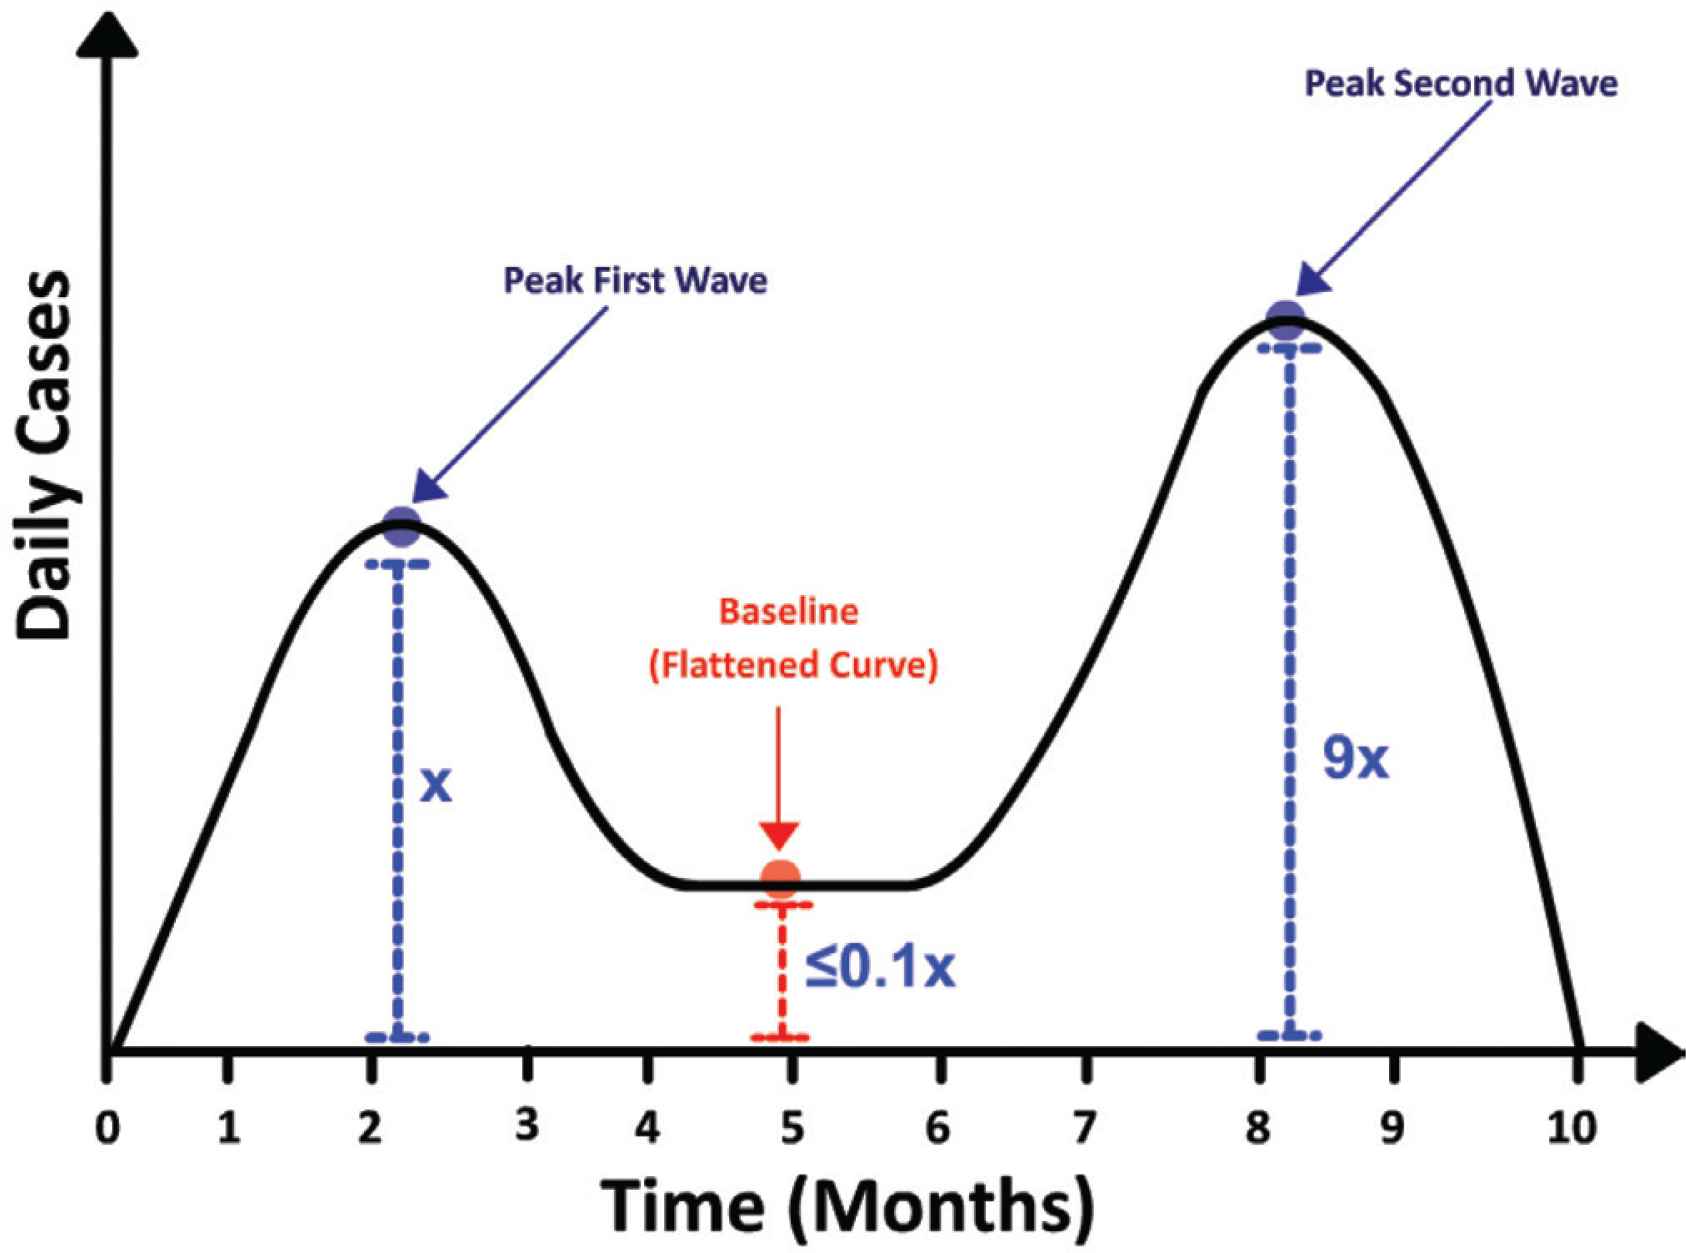
Estimating COVID-19 wavelength and wave amplitude.
2.5. Estimating Undetected Cases
We termed the active community cases that were unidentified as UCs. UCs also included cases that were asymptomatic but not those that had recovered. We therefore derived UCs as the difference between the sum of recovered daily cases and newly reported daily cases from the ADCs in accordance with Equation (3).
3. RESULTS AND DISCUSSION
The Markov Chain models uncertain processes over time, which is particularly useful for computing sequential or repetitive outcomes [9,12]. In this context, an individual is in one of a finite number of health states; that is, disease-free, diseased, recovered or deceased [9]. In this first-order Markov model, each state in the sequence depends on the preceding state [9,12,13]. On this premise, we propose that the mortality rate represents the transition probability between the diseased state and the deceased state. Likewise, the transition probability between the deceased state and the recovered state is the percentage difference.
As of March 26, 2021, the WHO mortality rate was estimated at 2.1% whereas, on October 1, 2020, the rate was estimated at 3% [1]. We propose several explanations for this variability. First, multiple studies suggest that the emerging SARS-CoV-2 variants are significantly more infectious than the wild-type strain that first emerged in Wuhan, China, in December 2019 [14,15]. Consequently, these mutants are able to spread from person to person at a faster rate [16]. On the premise of comparable virulence in the mutants to the wild type, there would appear to be a decrease in mortality rate as suggested by Equation (1). To accommodate for this dynamic mortality rate over time, we derived two mathematical functions from the WHO dataset to model the daily deaths over time [Deaths(t)] and the new recorded daily cases over time [NRDC(t)] [(Supplementary Figure S5 and Equation (1)]. Inputting daily cases and daily deaths into Equation (1) at any given point time would yield a mortality rate at that specific point in time.
The second variability addresses the issue of unreported deaths, particularly in developing countries like Belize. Nearly half of our deceased COVID-19 patients were confirmed with the infection postmortem, and most of the deaths were in poverty-stricken communities in Belize [17–19]. This suggests that there was a significant under-reporting of COVID-19-related deaths during the peaks of the waves. On this premise, we assume that the magnitude of the deceased state is proportional to the mortality rate, which in turn reflects the quantitative incidence rate of SARS-CoV-2 in Belize. We can therefore estimate incidence by deriving ADCs [Equation (2)]. The incidence is expected to be greater than the reported cases due to the lag in contact tracing, and the time taken to test and report results [4,6,11,20]. Quantitative estimates of undetected cases provide critical information in driving epidemiologists and other health policy stakeholders to adjust policies and implement effective and innovative containment measures [5].
Finally, we attempted to estimate the duration of a COVID-19 wave. Based on the peak to trough data for 18 cities (Supplementary Tables S1 and S2), with relatively well-established healthcare infrastructure and transparent reporting, we determined the mean duration of a COVID-19 wave as ~3 months (96 days) [21]. This value is of importance as it dictates critical economic projections, and consequently, the response to those projections. Finally, we attempted to estimate the duration of the trough (flattened curve) – time period in which new daily cases are at baseline levels and in equilibrium with recovered cases. We propose that baseline is achieved when the count of daily cases is no greater than 10% of the peak count of daily cases. Consequently, when the 7-day average begins to exceed 10% of the peak, it may indicate the start of a new COVID-19 wave. In addition, we report that the second COVID-19 wave is approximately 10-fold greater than the first wave, as demonstrated by increased hospitalizations [16].
As of March 2021, there are at least three worrisome variants that have been identified – UK variant (B.1.1.7), South African variant (B.1.351), and the Brazil variant (P.1). All three variants carry mutations that result in a more infectious virus [16]. There are also more than five vaccines on the global market including Astra Zeneca, Moderna, Pfizer–BionNTech, Gamaleya Sputnik V and Bharat Biotech Covaxin. As to how the emerging variants and the vaccines will impact the amplitude and wavelength is prospectively undetermined [22].
Belize’s second wave began in September 2020 and reached a baseline in late January 2021 [1]. Based on these data, we anticipate that a third wave may appear in late April 2021. Taken together, we can estimate that a COVID-19 wave is ~3 months, followed by 3 months at baseline levels.
In conclusion, the COVID-19 pandemic has devastated many economies and disrupted millions of lives worldwide [3]. Quantitatively assessing the incidence, wavelength, and amplitude will enable governments to pursue effective and efficient macroeconomic interventions. These findings are therefore relevant to all countries in their quest to develop and implement swift and versatile national healthcare response measures. More important, this study is relevant to underdeveloped healthcare systems in which efficient and robust testing and reporting of daily COVID-19 cases pose an immense challenge.
CONFLICTS OF INTEREST
The authors declare they have no conflicts of interest.
AUTHORS’ CONTRIBUTION
PM and CM conceived of the presented idea. PM developed the theory and performed the computations. CWEH and BY verified the analytical methods. CWEH encouraged PM and CM and supervised the findings of this work. All authors discussed the results and contributed to the final manuscript.
ACKNOWLEDGMENTS
The authors thank Paul Morgan Sr. for editing the manuscript and offering important critiques.
SUPPLEMENTARY MATERIALS
Supplementary data related to this article can be found at
REFERENCES
Cite this article
TY  - JOUR
AU  - Paul Morgan
AU  - Cyleen Morgan
AU  - Chieh-Wen Ed Hsu
AU  - Biru Yang
PY  - 2021
DA  - 2021/06/14
TI  - Estimating the Incidence of SARS-CoV-2 Cases in Belize Based on Mortality Rate
JO  - Dr. Sulaiman Al Habib Medical Journal
SP  - 88
EP  - 92
VL  - 3
IS  - 3
SN  - 2590-3349
UR  - https://doi.org/10.2991/dsahmj.k.210531.001
DO  - 10.2991/dsahmj.k.210531.001
ID  - Morgan2021
ER  -