
Anti-Diabetic Effects of Different Phenolic-Rich Fractions from Rhus Chinensis Mill. Fruits in vitro
- DOI
- 10.2991/efood.k.210222.002How to use a DOI?
- Keywords
- AGEs inhibition; Chinese sumac; DPP-IV inhibition; α-glucosidase inhibition; interaction
- Abstract
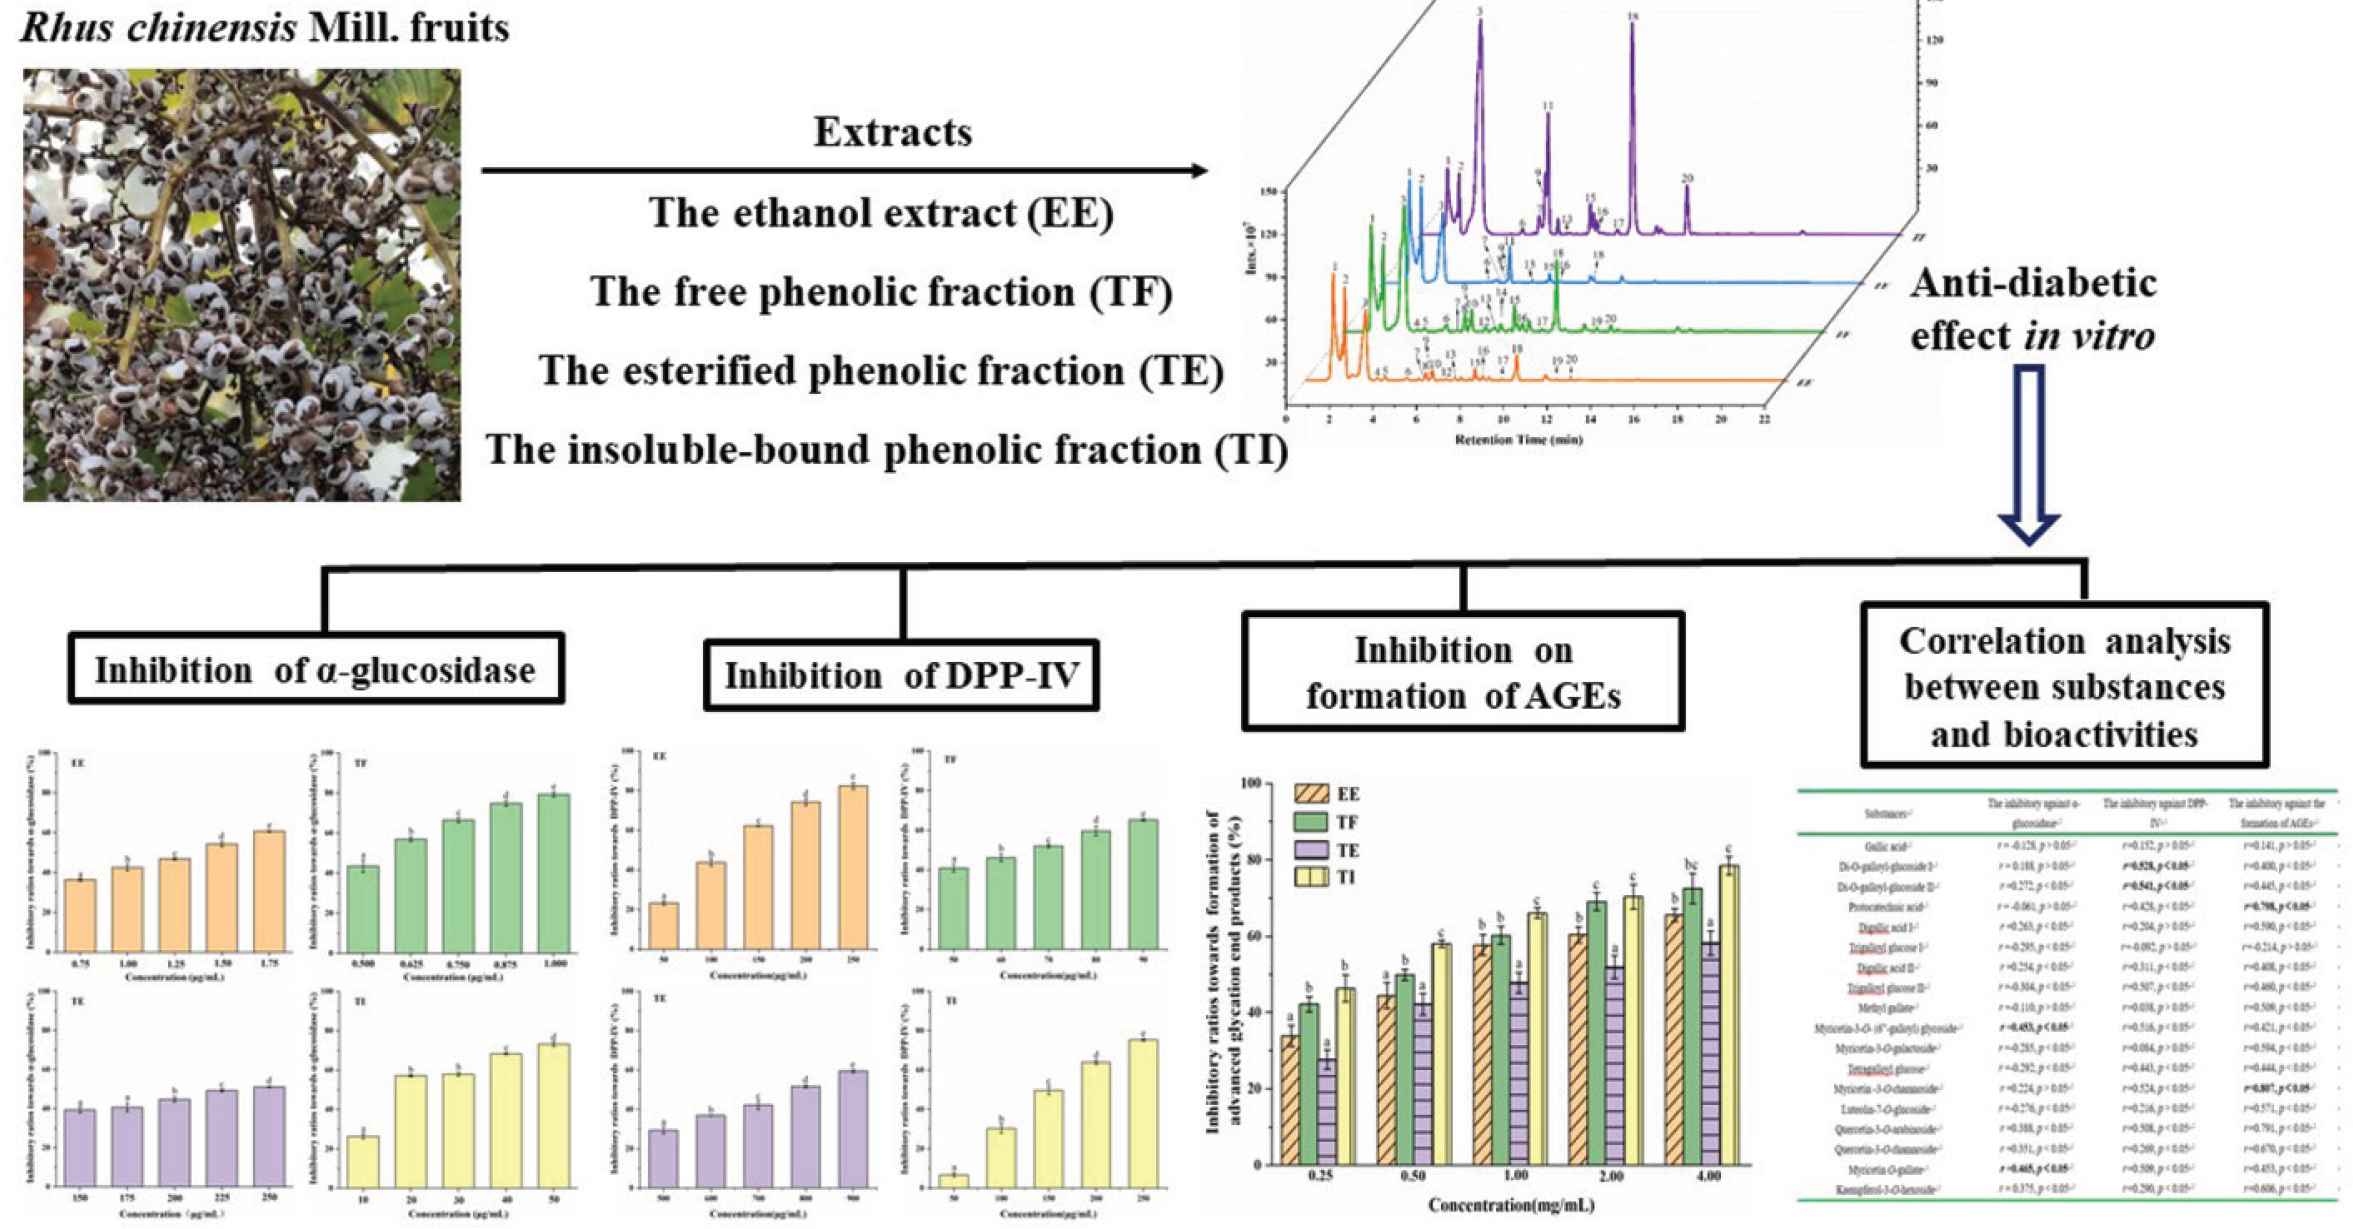
This study investigated the inhibitory effects of the Ethanol Extract (EE), Free Phenolic (TF), Esterified Phenolic (TE) and Insoluble-bound Phenolic (TI) from Rhus chinensis Mill. fruits on α-glucosidase, Dipeptidyl Peptidase-4 (DPP-IV), and the formation of Advanced Glycation End (AGE) products. Results showed that the TF had the strongest inhibition against α-glucosidase and DPP-IV with IC50 of 0.56 ± 0.04 and 66.08 ± 1.36 μg/mL, respectively (p < 0.05). TI exhibited the strongest inhibitory effect on the formation of AGEs with IC50 of 0.43 ± 0.03 mg/mL (p < 0.05). Two major compounds (myricetin-3-O-rhamnoside and quercetin-3-O-rhamnoside) showed additive or synergistic effects on α-glucosidase inhibition, while displayed antagonistic effect on DPP-IV inhibition. Correlation analysis indicated that myricetin-3-O-(6″-galloyl) glycoside and myricetin O-gallate contributed significantly on α-glucosidase inhibition, while di-O-galloyl-glucoside and its isomer may contribute remarkably toward DPP-IV inhibition. Protocatechuic acid and myricetin-3-O-rhamnoside showed a positive correlation with the suppression of AGEs formation. Those results may provide some scientific information for exploring R. chinensis fruits as nutraceuticals and/or functional foods to prevent or improve diabetes.
- Graphical Abstract
- Copyright
- © 2021 The Authors. Publishing services by Atlantis Press International B.V.
- Open Access
- This is an open access article distributed under the CC BY-NC 4.0 license (http://creativecommons.org/licenses/by-nc/4.0/).
1. INTRODUCTION
In modern life, people live with a fast-paced lifestyle, intaking with high-fat and high-carbohydrate diets and ignoring the physical exercise, which may lead to many chronic diseases. Diabetes, which could be divided into Type 1 Diabetes Mellitus (T1DM) and Type 2 Diabetes Mellitus (T2DM), is one of the most common chronic diseases and the prevalence of diabetes has rapidly risen in numbers of countries during the last 30 years, gradually become a global problem [1]. There were 451 million diabetic patients worldwide in 2017, more than 90% of them are T2DM patients, and it is estimated that the number of people with diabetes worldwide will reach 600 million by 2040 [2]. The complications, such as diabetic nephropathy, diabetic retinopathy, diabetic neuropathy and the increasing risk of heart disease are more frightening than diabetes itself [3], which seriously affects people’s lifespan and quality. Diabetes has not only brought great health effects to patients but also great economic burden on society [4], so how to prevent or treat diabetes is a high-profile research topic. The present medical clinical treatments of T2DM mainly possess non-negligible side effects, especially on gastrointestinal tract. Therefore, the exploitation of natural functional foods with minimal or no side effects is urgent. In recent years, there have been kinds of reports to explore the T2DM mechanisms and many studies have confirmed that many plant bioactive ingredients showed good inhibitory activities toward diabetic related enzymes, like α-glucosidase, and Dipeptidyl Peptidase-4 (DPP-IV).
In human beings, α-glucosidase catalyzes hydrolysis of starch into simple sugars, helping digestion of dietary carbohydrates to produce glucose for intestinal absorption and increase in blood glucose levels. DPP-IV, using Glucose-dependent Insulinotropic Polypeptide (GIP) and Glucagon-like Peptide-1 (GLP-1) as substrates, is another key strategy for blood glucose control. Both GIP and GLP-1 could stimulate insulin biosynthesis, and induce β-cell differentiation, and thereby, inhibiting DPP-IV could protect GLP-1 and GIP to effectively control blood glucose level [5,6]. Diabetic patients are exposed to high levels of glucose for a long time, and this persistent hyperglycemia could induce kinds of aberrant physiological changes. The increasing formation of Advanced Glycation End (AGE) is one of the abnormal physiological changes, which was recognized as the major pathogenesis link between hyperglycemia and complications of diabetes [7]. AGEs are also the causative factor for the pathogenesis of cataracts, atherosclerosis, and neurodegenerative diseases [8]. So, inhibiting the formation of AGEs is an efficient therapy to alleviate diabetic complications to improve the health condition of diabetics.
Rhus chinensis Mill., also known as Chinese sumac, is commonly used as a herb to treat inflammation, diarrhea, malaria, jaundice, alcoholic toxicity and phlegm according to the record of Traditional Chinese Medicine [9]. Previous studies had confirmed that R. chinensis fruits possessed several bioactivities, such as antioxidant and pancreatic lipase inhibitory effects in vitro [10], prevention of liver fibrosis [11], nonalcoholic fatty liver [12] and alcoholic fatty liver [13] in vivo. However, no study has been performed to investigate the in vitro anti-diabetic effect of R. chinensis fruits. Therefore, in this study, the effects of different extracts from R. chinensis fruits on α-glucosidase, DPP-IV and AGEs formation were comparatively investigated, which may be useful for further exploring this kind of fruits as a functional food in preventing or improving diabetes.
2. MATERIALS AND METHODS
2.1. Chemicals and Reagents
α-Glucosidase (from Saccharomyces cerevisiae, EC:3.2.1.20; Type I, lyophilized powder, ≥10 units/mg protein), p-nitrophenyl-α-d-glucopyranoside (purity ≥99.0%) were purchased from Sigma-Aldrich (St. Louis, MO, USA). DPP-IV inhibitor screening assay kit was obtained from Cayman Chemicals (Ann Arbor, MI, USA). Bovine Serum Albumin (BSA) was purchased from Beijing BioDee Biotechnology Co., Ltd. (Beijing, China).
2.2. Sample Preparation and Analysis
Rhus chinensis fruits were collected from Tengchong County, Baoshan City, Yunnan province, China, in November 2019. After sifting the raw materials to remove the branches and leaves, the fruits were washed, freeze-dried, powdered to pass through a 40-mesh sieve. Then the powder was stored at −20°C for future experiments. The Ethanol Extract (EE), Free Phenolic (TF), Esterified Phenolic (TE) and Insoluble-bound Phenolic (TI) fractions of R. chinensis fruits were prepared according to previous reports [10,14,15]. Briefly, as for EE, the defatted fruits were ultrasonically extracted by 80% ethanol and the solid–liquid ratio was 1:10. The fruits were extracted twice and then filtered and concentrated. After freeze-drying, EE fraction was obtained. The extract methods of other three fractions were as follows: firstly, defatted fruits powder was ultrasonically extracted by the mixture of 70% methanol and 70% acetone (1:1, v/v; 1:5, w/v) for 30 min and then centrifugated. This process was repeated twice and combined filtrate was evaporated (Hei-VAP, Heidolph, Germany) to get the aqueous phase for the further extraction of the soluble phenolic fraction (TF and TE). And the residue was used to extract the TI fraction. The aforementioned aqueous phase was adjusted to pH 2 and then extracted with diethyl ether and ethyl acetate (1:1, v/v). Then, the mixture of diethyl ether and ethyl acetate was evaporated and lyophilized to get TF fraction. The remaining aqueous phase was added 4 M of NaOH (1:10, v/v) to be hydrolyzed for 4 h at room temperature and then the same method performed as TF fraction was used for obtaining TE fraction. As for TI, the remained residues were hydrolyzed with 4 M NaOH (1:10, v/v) for 4 h and filtered and adjusted to pH 2. After that, the same method performed as TF fraction was applied to get TI fraction.
2.3. Measurement of Total Phenolic and Total Flavonoid Content
The Total Phenolic Content (TPC) and the Total Flavonoid Content (TFC) of each fraction of R. chinensis fruits was measured based on the Folin–Ciocalteu and colorimetric methods, respectively, described earlier [16]. Absorbance of each reaction mixture was measured by a SpectraMax M5 microplate reader (Molecular Device, Sunnyvale, CA, USA).
2.4. Inhibition of α-Glucosidase Assay
Inhibitory effects of different samples (EE, TF, TE, TI) and acarbose (positive control) toward α-glucosidase were measured according to the published study [17]. Absorbances were recorded by a SpectraMax M5 microplate reader. The inhibitory ability of each sample was calculated by the following formula: Inhibitory ratio (%) = (1 − slope of sample/slope of control) × 100%.
2.5. Inhibition of DPP-IV
Inhibitory effects of four samples and sitagliptin (positive control) against DPP-IV was measured according to the instruction book of the screening assay kit. Inhibition ratio (%) = [(DPP-IV activity of control − DPP-IV activity of sample)/DPP-IV activity of control] × 100%, where the DPP-IV activity was calculated by using the slope (Δ fluorescence/min).
2.6. Interactions of Myricetin-3-O-rhamnoside and Quercetin-3-O-rhamnoside on α-Glucosidase and DPP-IV Inhibition
Interactions of myricetin-3-O-rhamnoside and quercetin-3-O-rhamnoside on α-glucosidase and DPP-IV inhibition were analyzed by CalcuSyn software (Biosoft, Ferguson, MO, USA). The dose ratios between myricetin-3-O-rhamnoside and quercetin-3-O-rhamnoside were chose as 1:1 and 1:2 according to their content ratio in all extracts in the present work. The interaction effects were determined by Combination Index (CI). CI ≤ 0.90, 0.90 < CI < 1.10 and CI ≥ 1.10 indicate synergistic, additive and antagonistic effects, respectively.
2.7. Inhibition of AGEs
Bovine serum albumin/fructose model was used to evaluate the antiglycation ability of samples according to the previous method [18] with little modification. The total reaction system was made up of 50 mg/mL BSA, 250 mM fructose and 0.02% sodium azide with or without inhibitors dissolved in phosphate buffer (0.2M, pH 7.4). BSA alone or fructose alone were set as blank solutions. All mixtures were incubated at 37°C for 14 days in the aseptic conditions without light. After incubation, the fluorescence of each mixture was measured by using a Spectra Max M5 microplate reader as Fsample. The mixture without inhibitor was defined as blank and the fluorescence was named Fcontrol.
2.8. Statistical Analysis
All data in the present work are expressed as the mean value (n = 3) ± Standard Deviation (SD) and analyzed by using one-way analysis of variance. Turkey’s procedure was applied for detecting the significance of difference (p < 0.05). Pearson’s correlation analyses between various phenolic substances and each bioactivity was analyzed by SPSS 21.0 (SPSS Inc., Chicago, IL, USA) and the calculation was based on the content of each compound and inhibitory ratio at certain tested concentration. All other analyses were performed with Origin 8.5 software (OriginLab, Northampton, MA, USA).
3. RESULTS AND DISCUSSION
3.1. TPCs, TFCs and Phytochemical Composition of Different Fractions from R. chinensis Fruits
The TPCs and TFCs of all fractions are summarized in Table 1. Among those four different fractions, TF fraction possessed the highest TPC with 434.14 ± 21.31 mg of gallic acid equivalents/g extracts, followed by the EE with TPC of 361.33 ± 19.90 mg of gallic acid equivalents/g extracts. As for the TFCs, the content of TI was the most with 220.9 ± 15.57 mg of rutin equivalents/g of extracts, followed by TF, with the content of 162.59 ± 11.22 mg of rutin equivalents/g of extracts. Previous studies had confirmed that different plants had different phenolic composition, for example, in Lonicera species, free phenolics were the major form [19]. However, the insoluble-bound phenolic fraction was the main phenolic fraction of oil palm fruits [15] and the content of the esterified phenolics were the highest in camelina and sophia seeds [20]. The different results of TPCs or TFCs between the previous reports [10,14] and the current study may due to the different picking years, region and/or growth environment. Previous studies had proved that Acer truncatum leaves at different seasons possessed different phenolic compounds [21]. A studied had also confirmed that the environmental factors contributed more than genetic background on the composition of phenolic acid in rice grains [22].
| Peak no. | Compounds | [M − H]− (m/z) | Molecular formula | MS2/MS fragment ions | Extracts#,* | |||
|---|---|---|---|---|---|---|---|---|
| EE | TF | TE | TI | |||||
| 1 | Malic acid | 133.0131 | C4H6O5 | 115.0024 (100) | √ | √ | √ | √ |
| 2 | Citric acid | 191.0187 | C6H8O7 | 87.0074 (100), 111.0075 (62.20), 57.0332 (40.32) | √ | √ | √ | √ |
| 3 | Gallic acid | 169.0134 | C7H6O5 | 69.0332 (100), 125.0232 (71.18), 124.0154 (58.91) | 32.76 ± 0.26a | 65.37 ± 2.19c | 37.06 ± 0.27b | 113.20 ± 0.87d |
| 4 | Di-O-galloyl-glucoside I | 483.0779 | C20H20O14 | 169.0134 (100), 331.0674 (14.67) | 0.80 ± 0.09a | 0.72 ± 0.06a | – | – |
| 5 | Di-O-galloyl-glucoside II | 483.0777 | C20H20O14 | 169.0134 (100), 331.0674 (13.30) | 1.25 ± 0.10a | 1.34 ± 0.09b | – | – |
| 6 | Protocatechuic acid | 153.0186 | C7H6O4 | 108.0204 (100), 109.0282 (73.02), 91.0176 (20.37) | 1.36 ± 0.10b | 3.49 ± 0.13d | 0.75 ± 0.05a | 2.95 ± 0.13c |
| 7 | Digallic acid I | 321.0256 | C14H9O9 | 125.0233 (100), 169.0135 (78.07) | 0.18 ± 0.01a | 0.61 ± 0.05c | 0.31 ± 0.02b | 4.85 ± 0.22d |
| 8 | Trigalloyl glucose I | 635.0900 | C27H24O18 | 169.0134 (100), 635.0901 (79.50), 483.0786 (79.02) | 2.32 ± 0.18b | 5.12 ± 0.39c | 0.28 ± 0.02a | – |
| 9 | Digallic acid II | 321.0255 | C14H10O9 | 125.0233 (100), 169.0135 (78.07) | 0.69 ± 0.06a | 1.76 ± 0.12c | 1.03 ± 0.08b | 15.04 ± 0.57d |
| 10 | Trigalloyl glucose II | 635.0887 | C27H24O18 | 635.0900 (100), 169.0134 (73.41), 483.0786 (54.12) | 2.64 ± 0.16a | 5.52 ± 0.30b | – | – |
| 11 | Methyl gallate | 183.0293 | C8H8O5 | 140.0106 (100), 139.0027 (61.74), 124.0155 (13.50) | – | – | 9.55 ± 0.14a | 31.92 ± 1.22b |
| 12 | Myricetin-3-O-(6″-galloyl) glycoside | 631.0950 | C28H23O17 | 479.08369 (100), 631.0956 (86.56) | 0.51 ± 0.04a | 1.17 ± 0.08b | – | – |
| 13 | Myricetin-3-O-galactoside | 479.0878 | C21H20O13 | 316.0226 (100), 317.0277 (24.80) | 0.95 ± 0.08b | 1.93 ± 0.14c | 0.86 ± 0.05b | 0.49 ± 0.04a |
| 14 | Tetragalonyl glucose | 787.1008 | C34H28O22 | 169.0134 (5.72), 635.0898 (35.87) | – | 2.08 ± 0.15 | – | – |
| 15 | Myricetin-3-O-rhamnoside | 463.0889 | C21H20O12 | 316.0227 (100), 317.0285 (30.76) | 3.11 ± 0.23b | 6.79 ± 0.25c | 1.68 ± 0.09a | 7.88 ± 0.32d |
| 16 | Luteolin-7-O-glucoside | 447.0941 | C21H20O11 | 285.0407 (100), 284.0329 (24.76) | 0.82 ± 0.02b | 1.64 ± 0.15c | 0.45 ± 0.03a | 0.41 ± 0.02a |
| 17 | Quercetin-3-O-arabinoside | 433.0783 | C20H18O11 | 300.0279 (100), 301.0331 (27.06) | 0.22 ± 0.01a | 0.46 ± 0.02b | – | 0.76 ± 0.04b |
| 18 | Quercetin-3-O-rhamnoside | 447.0934 | C21H20O11 | 300.0279 (100), 301.0351 (71.04) | 3.57 ± 0.14b | 10.35 ± 0.36c | 2.49 ± 0.12a | 36.38 ± 0.59d |
| 19 | Myricetin O-gallate | 615.1002 | C28H24O16 | 317.0305 (100), 169.0134 (5.61) | 0.58 ± 0.02a | 1.41 ± 0.06b | – | – |
| 20 | Kaempferol-3-O-hexoside | 431.0986 | C21H20O10 | 284.0330 (100), 285.0406 (83.91), 255.0300 (22.43) | 0.24 ± 0.02a | 0.87 ± 0.05b | – | 6.19 ± 0.16c |
| TPC (mg of gallic acid equivalents/g of extracts) | 361.33 ± 19.90c | 434.14 ± 21.31d | 134.04 ± 7.21a | 242.75 ± 15.28b | ||||
| TFC (mg of rutin equivalents/g of extracts) | 125.07 ± 10.25b | 162.59 ± 11.22c | 95.12 ± 6.27a | 220.97 ± 15.57d | ||||
EE, ethanol extract; TF, free phenolics; TE, esterified phenolics; TI, insoluble-bound phenolics; TPC, total phenolic content; TFC, total flavonoid content. Values were expressed as the mean ± SD (n = 3). Content of each phenolic compound was expressed as mg/g of dry extract. Content values of the same phenolic compound labeled with different superscript letter means significantly different (p < 0.05).
Gallic acid standard was used for quantifying the compounds 3, 4, 5, 7, 8, 9, 10, 11, 14; protocatechuic acid standard was used for quantifying the compound 6; myricetin-3-O-rhamnoside standard was used for quantifying the compounds 12, 13, 15, 19; luteolin-7-O-glucoside standard was used for quantifying the compound 16; quercetin-3-O-rhamnoside standard was used for quantifying the compounds 17 and 18; kaempferol standard was used for quantifying the compound 20.
Phytochemical identification and phenolic quantitation of different extracts from Rhus chinensis Mill. fruits by UHPLC-ESI-HRMS/MS
Phytochemical composition of each fraction from R. chinensis fruits was identified by UHPLC−ESI−HRMS/MS in negative mode as shown in Supplementary Figure S1. The phenolic quantification results are presented in Table 1. Acidified water (0.1% formic acid) and acetonitrile were used as the mobile phases A and B, respectively. The elution gradient as follows: 0–2 min, 5%–20% B; 2–14 min, 20%–23% B; 14–17 min, 23%-5% B; 17–22 min, 5% B and the mass spectrometry conditions was as the same as the previous study [10]. A total of 20 phytochemicals were identified in the present work, 18 of which were characterized as phenolic compounds. Among those phenolic compounds, gallic acid and quercetin-3-O-rhamnoside were the most two phenolic compounds that can be detected in all four fractions. This finding was consistent with the results reported earlier [10,14].
3.2. Inhibition of α-Glucosidase and DPP-IV
Previous studies have already reported that the different extracts of sumac fruits possessed good inhibitory activities toward digestive enzymes. For example, extracts from R. chinensis fruits showed excellent inhibitory activities to pancreatic lipase [10,14] and extract from Rhus coriaria L had a good inhibitory activity to α-amylase [23]. However, the inhibitory activities of R. chinensis fruits on α-glucosidase and DPP-IV are still not reported.
The results of inhibitory capacities of different fractions from R. chinensis fruits to α-glucosidase are illustrated in Figure 1. All samples exhibited good inhibitory abilities toward α-glucosidase under the tested concentrations in a dose-dependent manner. Among those extractions, TF possessed the strongest inhibitory ability and IC50 value was 0.56 ± 0.04 μg/mL (p < 0.05), followed by EE with IC50 value of 1.36 ± 0.04 μg/mL and the IC50 values of the TI and TE fractions were 27.65 ± 1.38 and 230.36 ± 5.39 μg/mL, respectively. Numerous of literatures indicated that the inhibitory activity of α-glucosidase is related to phenolic substances in plants. For example, Zhang et al. [24] had found that the major contributors from Lens culinaris to the inhibitory activity on α-glucosidase was the phenolic compounds. Moreover, it is found that the enzyme inhibitory capacity of plant extract has close relationship to the phenolic composition [25]. According to the results presented in Table 1 in the present work, these four extracts possessed different composition and contents of phenolic substances, which may explain their different inhibitory capacities. In addition, the results of correlation analysis in Table 2 indicated that myricetin-3-O-(6″-galloyl) glycoside and myricetin O-gallate had the closest relationship with the α-glucosidase inhibitory effect. A previous study had reported a similar finding that myricetin 3-O-(2‴-O-galloyl-α-
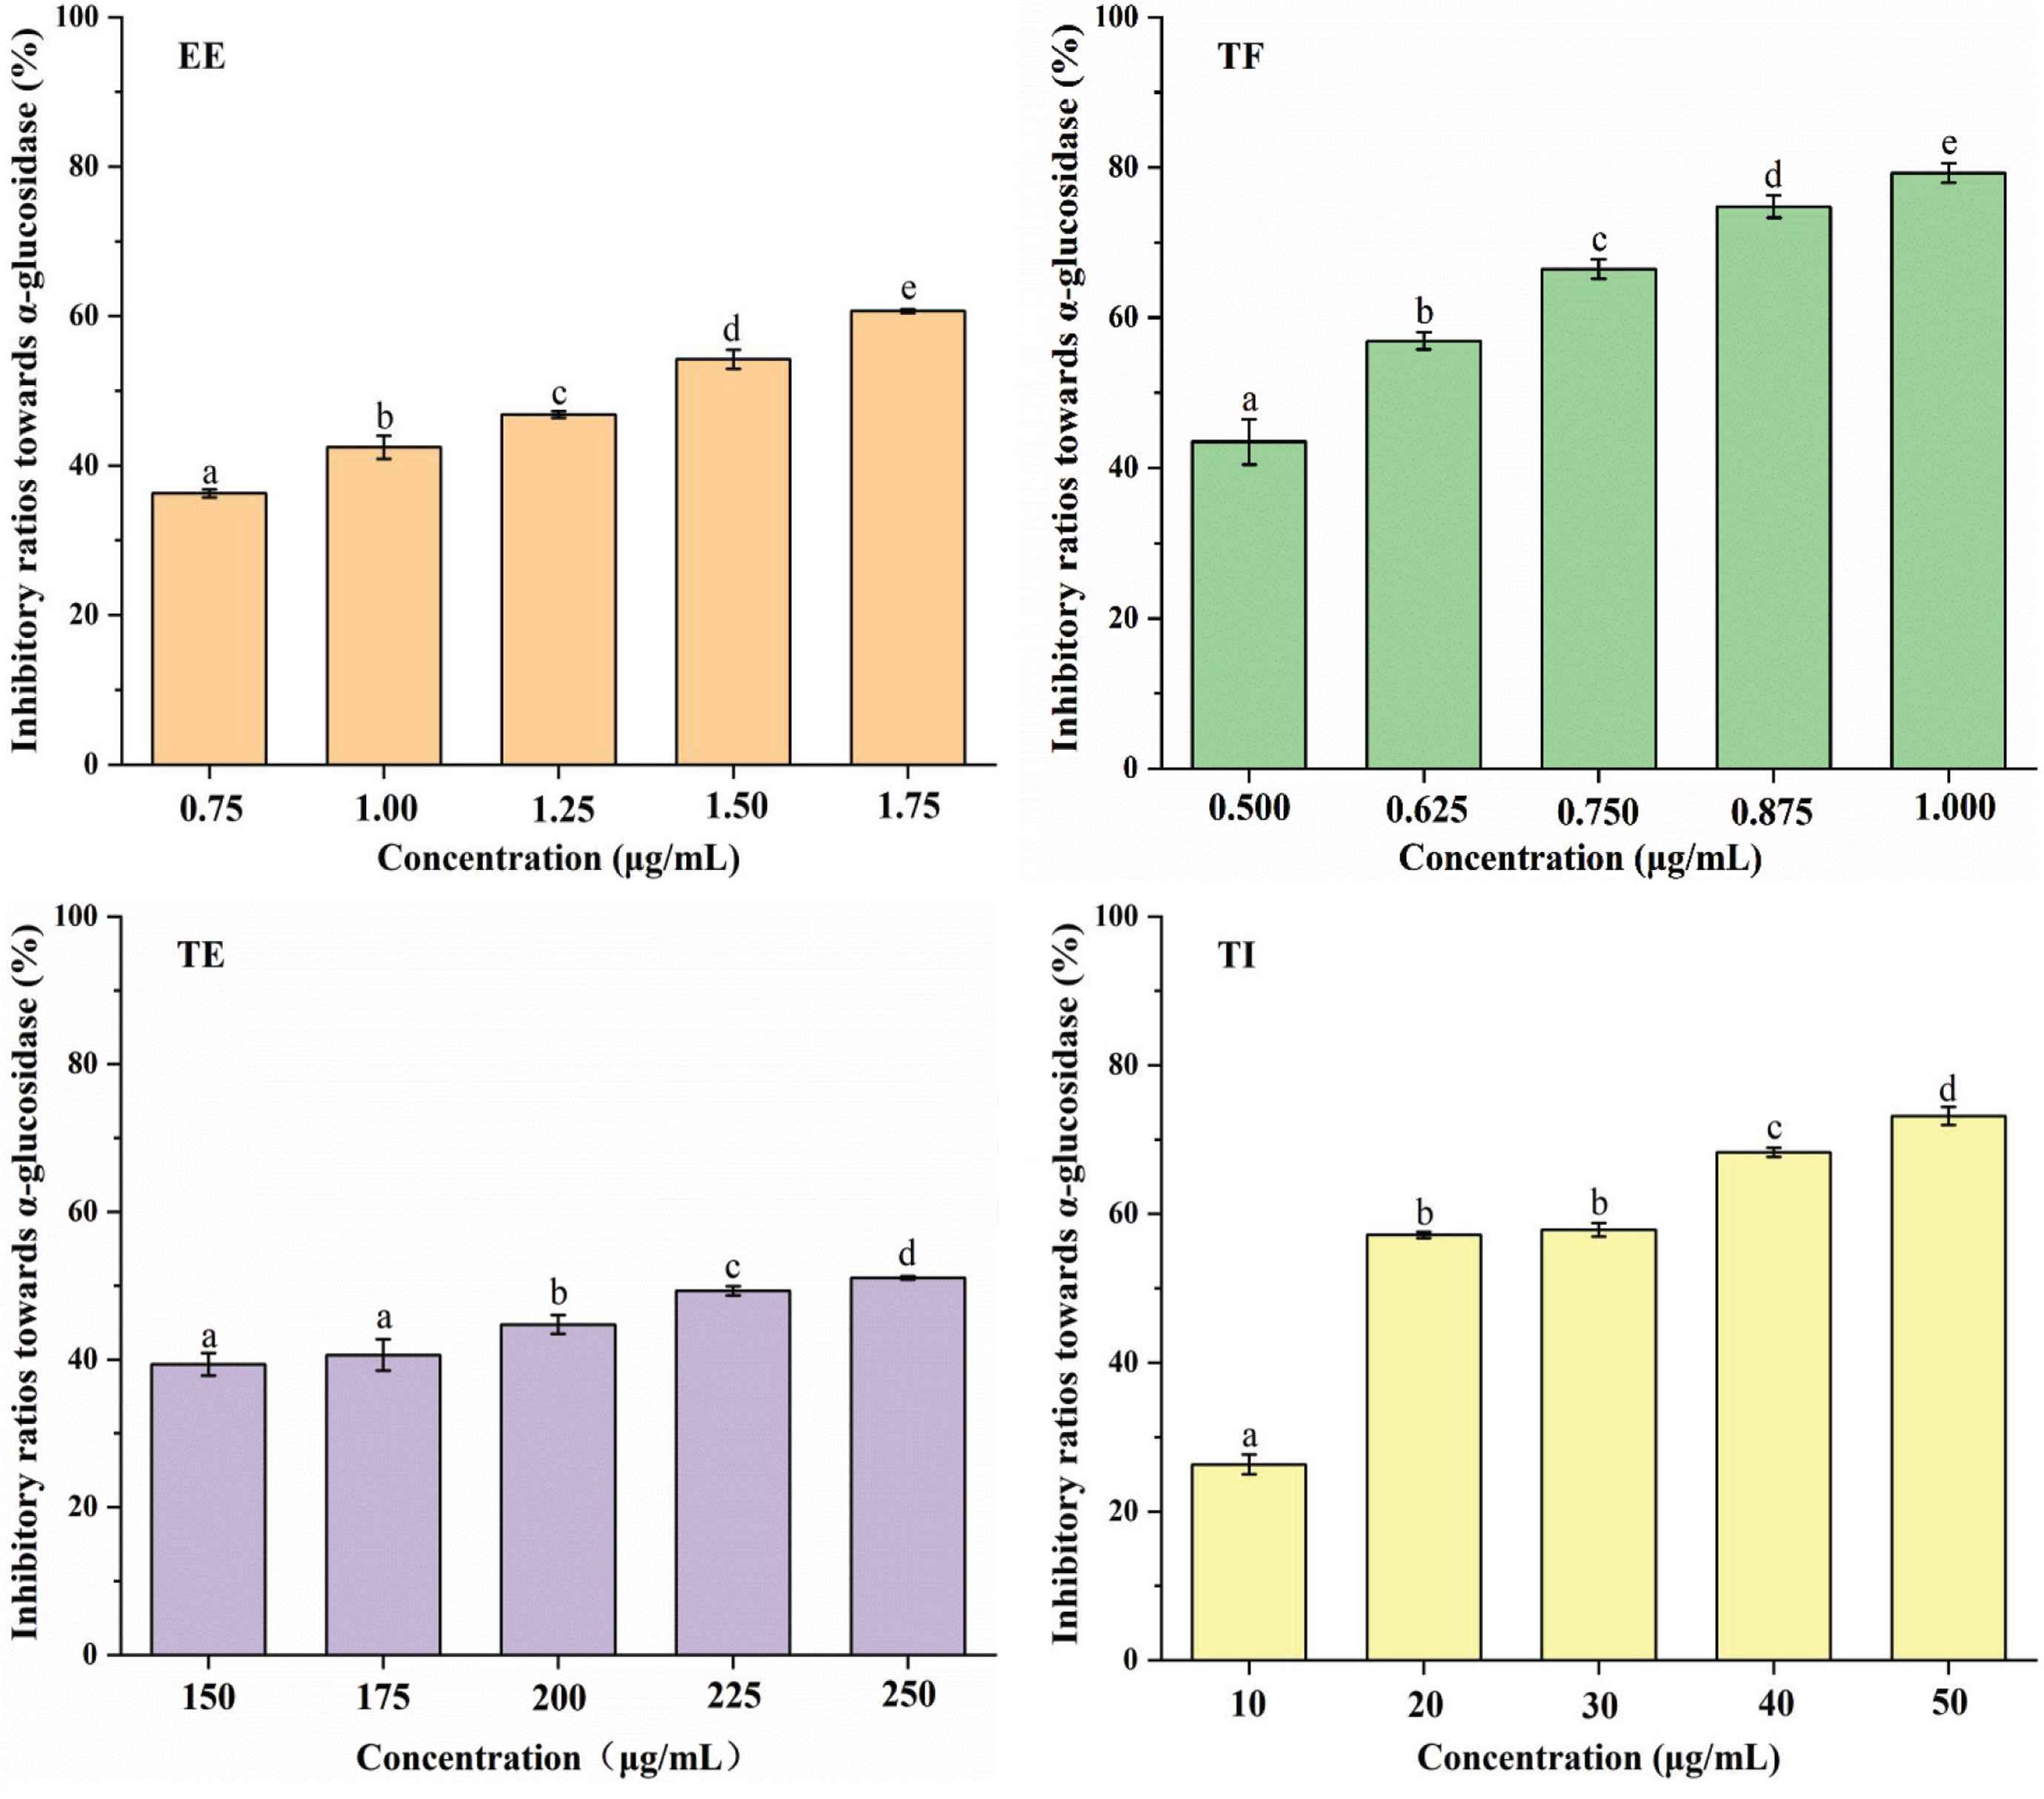
Inhibitory activities of different phenolic-rich extracts from Rhus chinensis Mill. fruits toward α-glucosidase. All values are expressed as mean ± SD (n = 3). Different letters indicate significant differences at the p < 0.05.
| Substances | The inhibitory effects against α-glucosidase | The inhibitory effects against DPP-IV | The inhibitory effects against the formation of AGEs |
|---|---|---|---|
| Gallic acid | r = −0.128, p > 0.05 | r = 0.152, p > 0.05 | r = 0.141, p > 0.05 |
| Di-O-galloyl-glucoside I | r = 0.188, p > 0.05 | r = 0.528, p < 0.05 | r = 0.400, p < 0.05 |
| Di-O-galloyl-glucoside II | r = 0.272, p < 0.05 | r = 0.541, p < 0.05 | r = 0.445, p < 0.05 |
| Protocatechuic acid | r = −0.061, p > 0.05 | r = 0.428, p < 0.05 | r = 0.798, p < 0.05 |
| Digallic acid I | r = 0.263, p < 0.05 | r = 0.204, p > 0.05 | r = 0.590, p < 0.05 |
| Trigalloyl glucose I | r = −0.295, p < 0.05 | r = −0.092, p > 0.05 | r = −0.214, p > 0.05 |
| Digallic acid II | r = 0.254, p < 0.05 | r = 0.311, p < 0.05 | r = 0.408, p < 0.05 |
| Trigalloyl glucose II | r = −0.304, p < 0.05 | r = 0.507, p < 0.05 | r = 0.460, p < 0.05 |
| Methyl gallate | r = −0.110, p > 0.05 | r = 0.038, p > 0.05 | r = 0.509, p < 0.05 |
| Myricetin-3-O-(6″-galloyl) glycoside | r = 0.453, p < 0.05 | r = 0.516, p < 0.05 | r = 0.421, p < 0.05 |
| Myricetin-3-O-galactoside | r = −0.285, p < 0.05 | r = 0.084, p > 0.05 | r = 0.594, p < 0.05 |
| Tetragalloyl glucose | r = −0.292, p < 0.05 | r = 0.443, p < 0.05 | r = 0.444, p < 0.05 |
| Myricetin-3-O-rhamnoside | r = 0.224, p > 0.05 | r = 0.524, p < 0.05 | r = 0.807, p < 0.05 |
| Luteolin-7-O-glucoside | r = −0.276, p < 0.05 | r = 0.216, p > 0.05 | r = 0.571, p < 0.05 |
| Quercetin-3-O-arabinoside | r = 0.388, p < 0.05 | r = 0.508, p < 0.05 | r = 0.791, p < 0.05 |
| Quercetin-3-O-rhamnoside | r = 0.351, p < 0.05 | r = 0.269, p < 0.05 | r = 0.670, p < 0.05 |
| Myricetin O-gallate | r = 0.465, p < 0.05 | r = 0.509, p < 0.05 | r = 0.453, p < 0.05 |
| Kaempferol-3-O-hexoside | r = 0.375, p < 0.05 | r = 0.290, p < 0.05 | r = 0.606, p < 0.05 |
The value of r was the degree of linear correlation in the Pearson’s correlation coefficient analysis. The absolute value of r reveals the correlation relationship between the various phenolics and different bioactivities. The higher value shows the stronger relationship, and a positive value indicates a positive correlation, and a negative value indicates a negative correlation.
Pearson’s correlation analyses between various phenolic substances and different biological activities
The inhibitory activities to DPP-IV of all tested samples are illustrated in Figure 2. Those four extracts could also strongly inhibit DPP-IV in a dose-response manner and these four fractions exhibited different inhibitory activities. Among them, TF possessed the strongest inhibitory activity with the lowest IC50 value of 66.08 ± 1.36 μg/mL (p < 0.05). The inhibitory ratios of TF varied from 40.94% to 65.23% when the tested concentrations ranged from 50 to 90 μg/mL. The IC50 values of EE and TI were 125.83 ± 3.34 and 164.19 ± 3.37 μg/mL, respectively. TE, however, had the highest 794.94 ± 13.25 μg/mL, indicating that the TE exerted the weakest DPP-IV inhibitory effect (p < 0.05). According to the results summarized in Table 2, it is found that di-O-galloyl-glucoside I and its isomer may be the phenolic substances that contributed significantly on DPP-IV inhibition. Besides, myricetin-3-O-rhamnoside, myricetin-3-O-(6″-galloyl) glycoside, quercetin-3-O-arabinoside and myricetin O-gallate also showed significantly positive correlation to the DPP-IV inhibition. It is worth noting that trigalloyl glucose I had no remarkable correlation to the inhibitory effect, but its isomer did. This result may be due to their different structure. Previous study had found that gallic acid possessed a good inhibition toward DPP-IV, but protocatechuic acid did not show a strong DPP-IV inhibition [6]. However, according to Table 2 in this study, protocatechuic acid instead of gallic acid displayed a significant correlation to DPP-IV inhibition. This different result may be due to complicated composition of extracts used in the present work and the interaction between different substances. In a previous study, a similar phenomenon was also found: cyanidin-3-O-glucoside had obviously lower value of r than rutin when analyzed with the DPP-IV inhibition results of different exerts from Prinsepia utilis Royle fruits, while the experimental results of pure compounds showed that cyanidin-3-O-glucoside possessed a much better DPP-IV inhibition than rutin [28]. Another study had also confirmed that the inhibition effect on DPP-IV of fermented blueberry and blackberry not due to the existence of a certain compound but the several phenolic compounds [29].
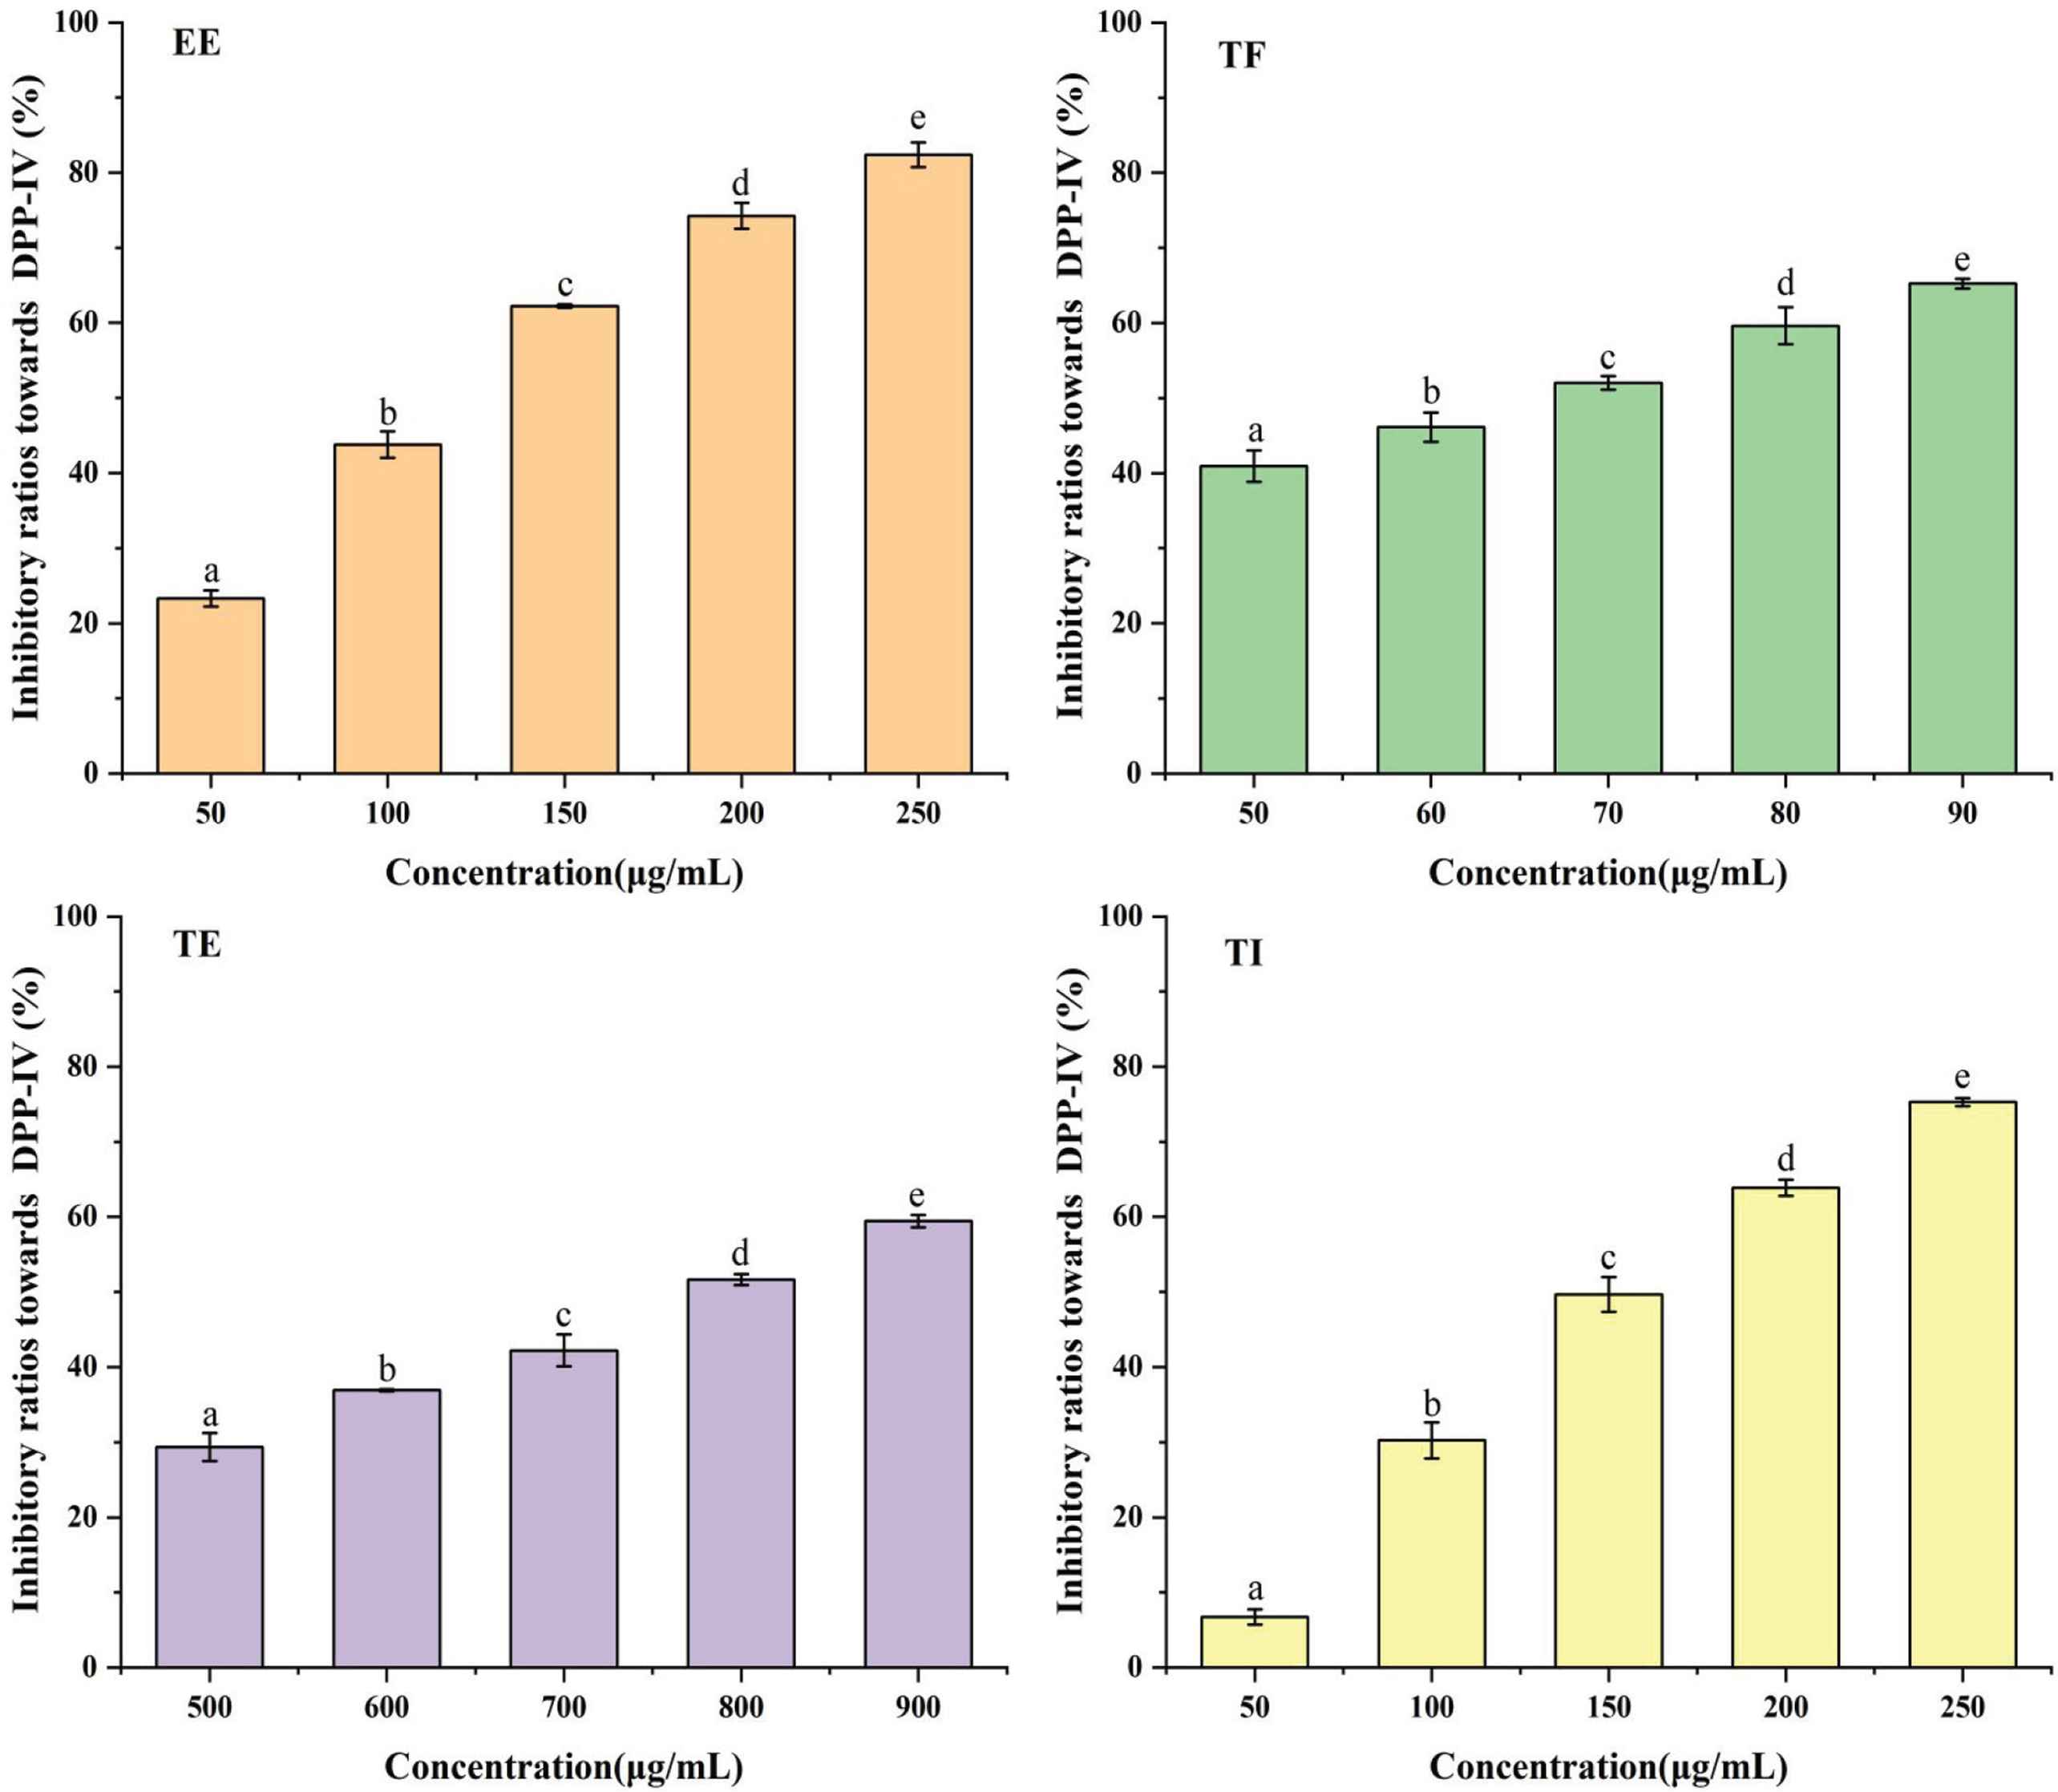
Inhibitory activities of different phenolic-rich extracts from Rhus chinensis Mill. fruits toward DPP-IV. All values are expressed as mean ± SD (n = 3). Different letters indicate significant differences at the p < 0.05.
3.3. Analyses of Synergistic Effects
Since myricetin-3-O-rhamnoside and quercetin-3-O-rhamnoside were the main flavonoids detected in all extracts of R. chinensis fruits, the α-glucosidase and DPP-IV inhibitory effects of myricetin-3-O-rhamnoside and quercetin-3-O-rhamnoside and their combinations were measured. The inhibition results of these two compounds at different concentrations against α-glucosidase and DPP-IV are displayed in Figure 3. Both myricetin-3-O-rhamnoside and quercetin-3-O-rhamnoside showed good inhibitory effects toward α-glucosidase and DPP-IV in a dose-dependent manner, and myricetin-3-O-rhamnoside exhibited better inhibitory capacities toward α-glucosidase and DPP-IV than quercetin-3-O-rhamnoside. The IC50 values of myricetin-3-O-rhamnoside and quercetin-3-O-rhamnoside of α-glucosidase inhibition were 93.12 ± 0.32 and 146.30 ± 8.78 μg/mL, and their IC50 values of DPP-IV inhibition were 67.83 ± 2.97 and 71.79 ± 1.05 μg/mL, respectively.
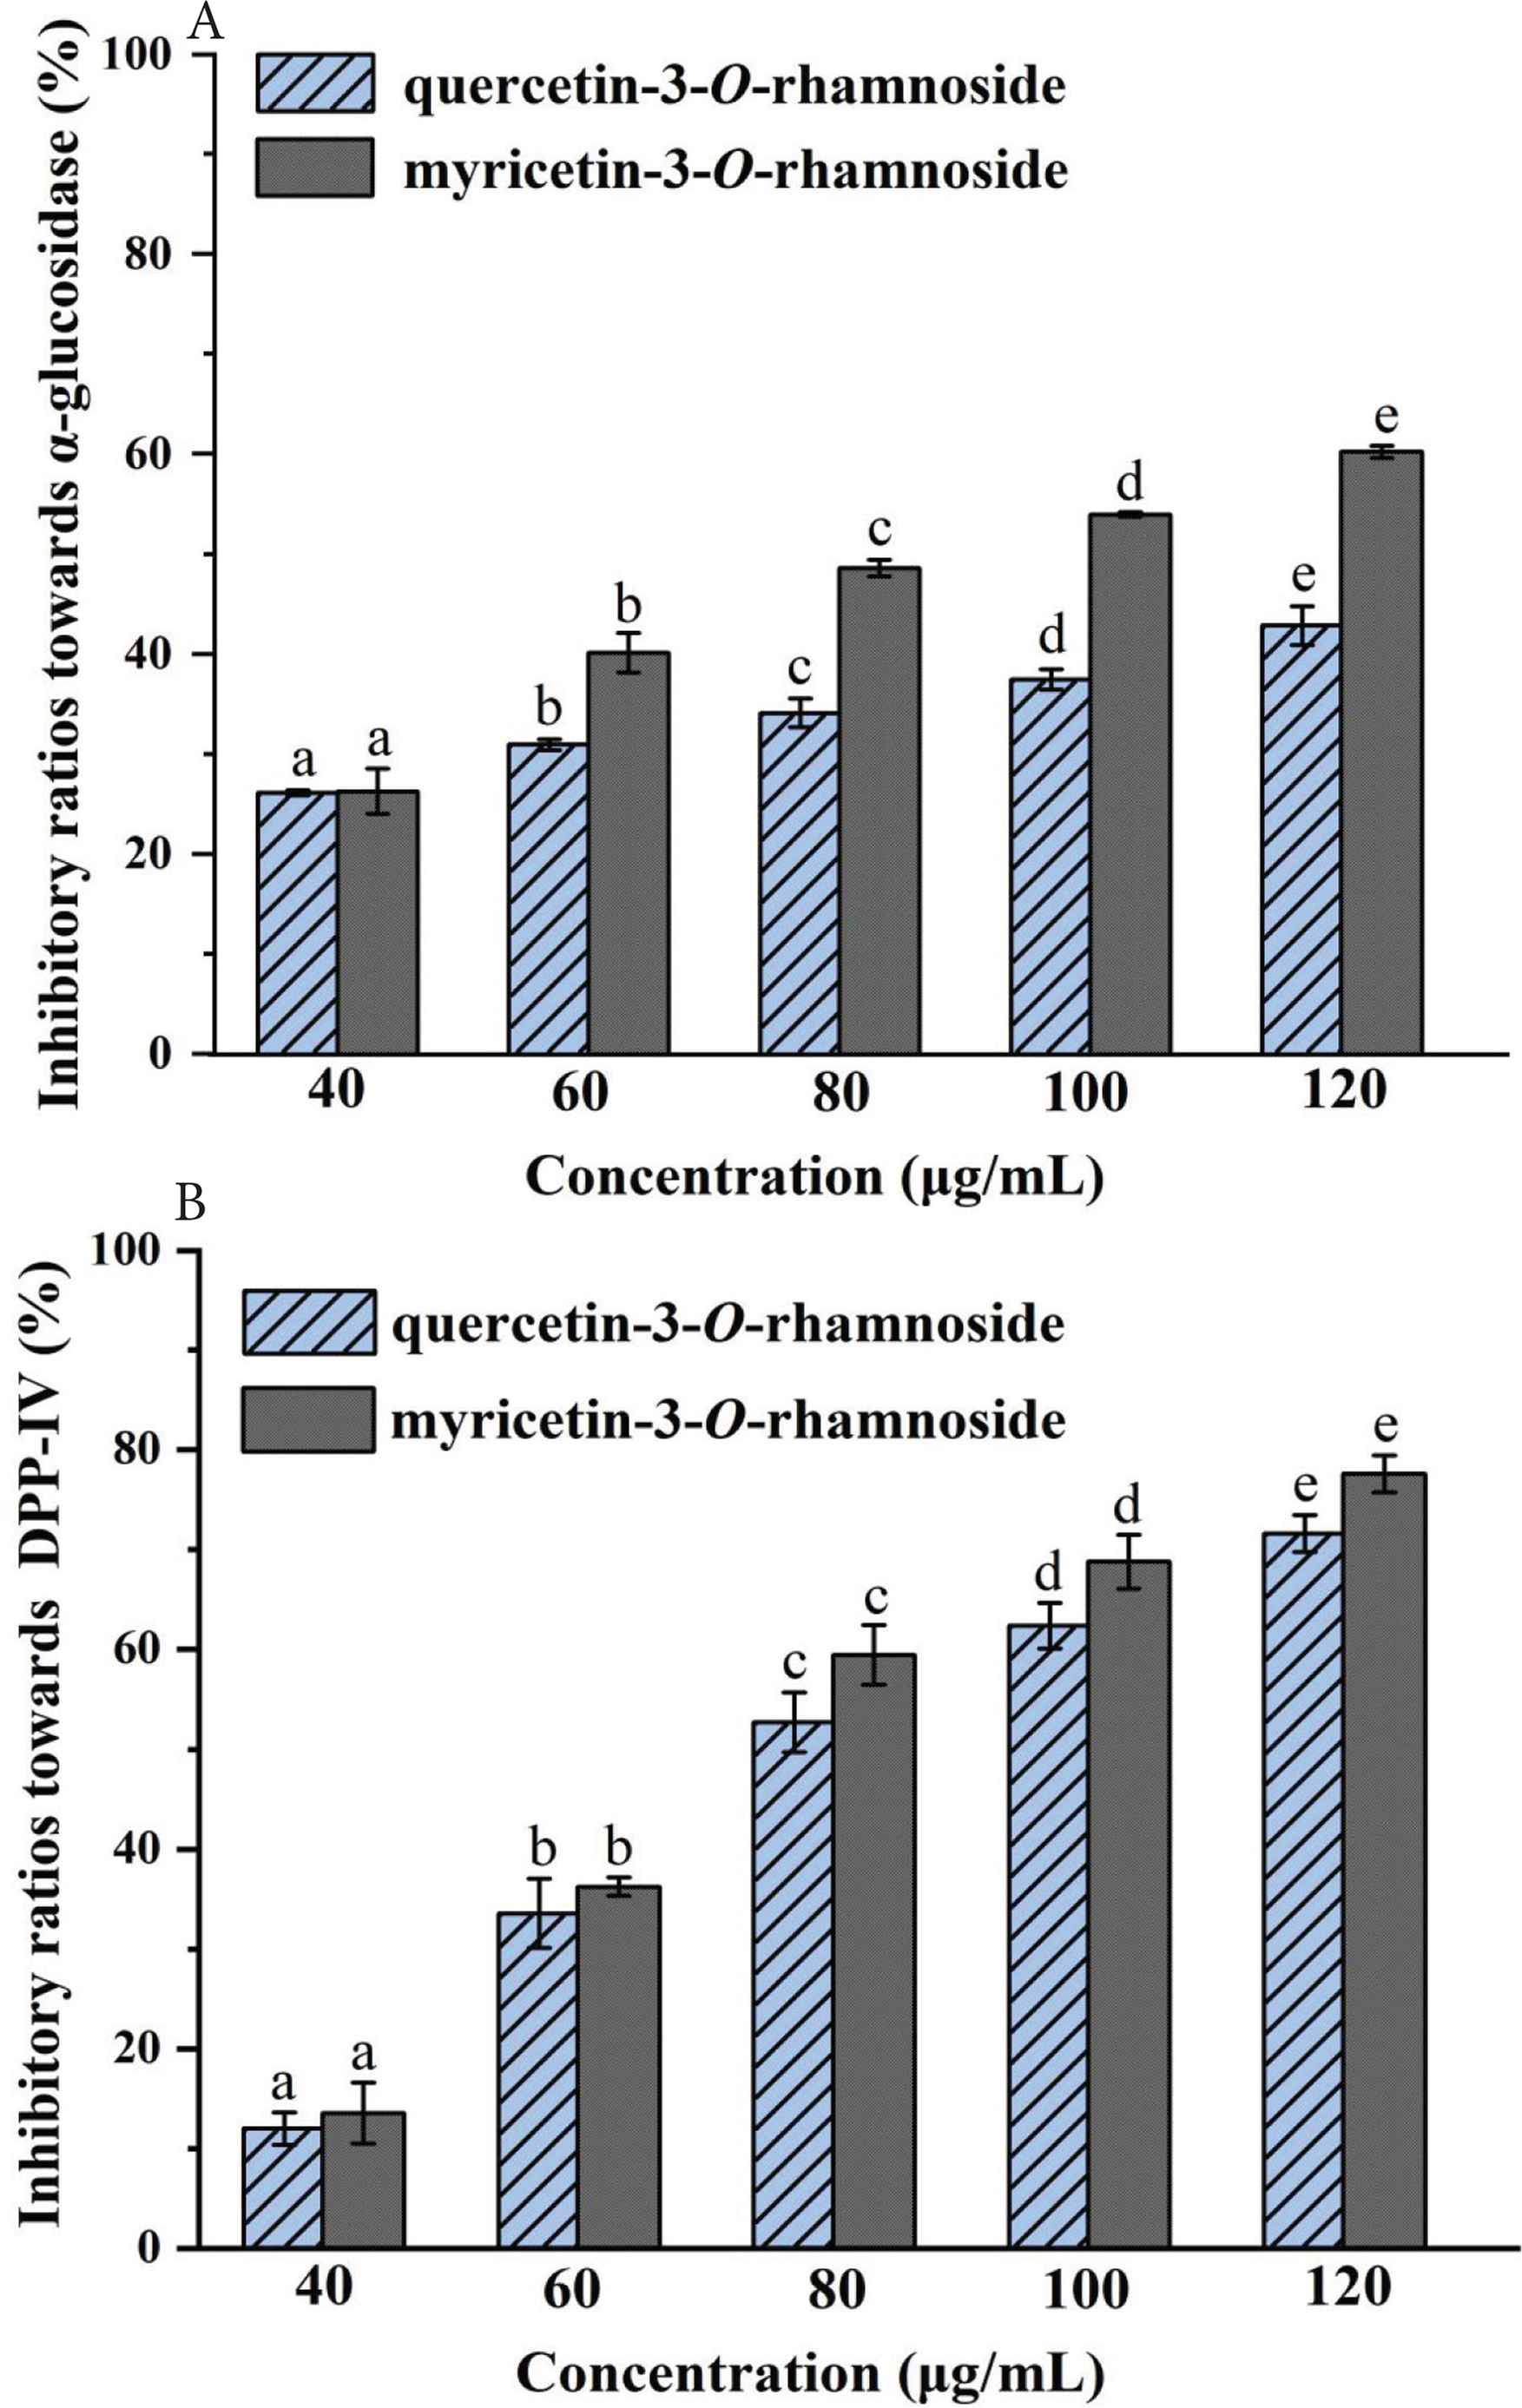
Inhibitory activities of myricetin-3-O-rhamnoside and quercetin-3-O-rhamnoside toward α-glucosidase (A) and DPP-IV (B). All the values are expressed as mean ± SD (n = 3). Different letters indicate significant differences at the p < 0.05.
Table 3 presents the interaction results of myricetin-3-O-rhamnoside and quercetin-3-O-rhamnoside on α-glucosidase inhibition. As shown in Table 3, when the ratio of myricetin-3-O-rhamnoside and quercetin-3-O-rhamnoside was set as 1:1, the CI value dropped from 0.958 to 0.826 when the concentration ranging from 40 to 120 μg/mL, suggesting that the interaction effects on α-glucosidase inhibition of those two compounds changed from additive effect to synergistic effect. When the ratio of myricetin-3-O-rhamnoside and quercetin-3-O-rhamnoside was set as 1:2, the CI value dropped from 1.278 to 0.988 when the myricetin-3-O-rhamnoside concentration ranging from 20 to 60 μg/mL, indicating that the interaction effects on α-glucosidase inhibition of those two compounds changed from antagonistic effect to additive effect. This finding was similar with the previous study that the interaction effects of catechin-caffeic acid combination on α-glucosidase inhibition changed from antagonistic to addictive effect at ratio of 1:2 [30]. According to the interaction results, the different inhibitory abilities of the different extracts toward α-glucosidase may be due to different interaction effects of phenolic compounds in the extracts.
| Combination dose | Myricetin-3-O-rhamnoside | Quercetin-3-O-rhamnoside | Inhibition ration on α-glucosidase (%) | CIa | Fab | CI for Fa | Myricetin-3-O-rhamnoside | Quercetin-3-O-rhamnoside |
|---|---|---|---|---|---|---|---|---|
| μg/mL, for combination test | μg/mL, calculation at corresponding Fa | |||||||
| 1:1 | 40.0 | 40.0 | 40.97 ± 0.37 | 0.958 | 25.0% | 1.133 | 21.10 | 21.10 |
| 60.0 | 60.0 | 53.08 ± 0.90 | 0.875 | 50.0% | 0.903 | 54.81 | 54.81 | |
| 80.0 | 80.0 | 60.23 ± 0.19 | 0.879 | 75.0% | 0.833 | 142.32 | 142.32 | |
| 100.0 | 100.0 | 66.40 ± 0.32 | 0.855 | 85.0% | 0.832 | 247.28 | 247.28 | |
| 120.0 | 120.0 | 71.45 ± 1.18 | 0.826 | |||||
| 1:2 | 20.0 | 40.0 | 28.46 ± 0.47 | 1.278 | 25.0% | 1.372 | 17.15 | 34.30 |
| 30.0 | 60.0 | 36.93 ± 0.37 | 1.191 | 50.0% | 1.086 | 51.00 | 102.00 | |
| 40.0 | 80.0 | 43.10 ± 0.33 | 1.171 | 75.0% | 1.021 | 151.64 | 303.27 | |
| 50.0 | 100.0 | 48.07 ± 0.58 | 1.162 | 85.0% | 1.053 | 284.96 | 569.92 | |
| 60.0 | 120.0 | 55.50 ± 0.78 | 0.988 | |||||
CI, combination index. CI ≤ 0.90, 0.90 < CI < 1.10 and CI ≥ 1.10 indicate synergistic, additive and antagonistic effects, respectively.
Fa, fraction affected by the combination dose of myricetin-3-O-rhamnoside and quercetin-3-O-rhamnoside.
Interaction between myricetin-3-O-rhamnoside and quercetin-3-O-rhamnoside on α-glucosidase inhibition
Table 4 presents the interactions between myricetin-3-O-rhamnoside and quercetin-3-O-rhamnoside on DPP-IV inhibition. When the concentration ratio of myricetin-3-O-rhamnoside and quercetin-3-O-rhamnoside was set as 1:1, unlike the trend of the α-glucosidase inhibition, CI values gradually increased with the increasing concentration. During the test concentrations from 40 to 120 μg/mL, CI increased from 1.493 to 1.867, all values were more than 1.10, suggesting that those two compounds were always antagonistic effect when inhibiting DPP-IV in combination. When the concentration ratio of myricetin-3-O-rhamnoside and quercetin-3-O-rhamnoside was set as 1:2, a similar phenomenon was observed, namely CI value gradually increased with the increasing concentration and interaction type was always antagonistic effect. This finding of the antagonistic effect may be used to explain why the extracts from R. chinensis fruits showing weaker inhibitory effects than myricetin-3-O-rhamnoside or quercetin-3-O-rhamnoside. However, even under antagonistic action, the inhibitory effects of those extracts were also pretty good, especially EE and TF, which further confirmed the prospect of R. chinensis fruits on the prevention or treatment T2DM.
| Combination dose | Myricetin-3-O-rhamnoside | Quercetin-3-O-rhamnoside | Inhibition ration on DPP-IV (%) | CIa | Fab | CI for Fa | Myricetin-3-O-rhamnoside | Quercetin-3-O-rhamnoside |
|---|---|---|---|---|---|---|---|---|
| μg/mL, for combination test | μg/mL, calculation at corresponding Fa | |||||||
| 1:1 | 40.0 | 40.0 | 19.42 ± 1.84 | 1.493 | 25.0% | 1.590 | 25.21 | 25.21 |
| 60.0 | 60.0 | 39.43 ± 0.91 | 1.782 | 50.0% | 1.736 | 54.81 | 54.81 | |
| 80.0 | 80.0 | 58.17 ± 1.77 | 1.802 | 75.0% | 1.897 | 142.32 | 142.32 | |
| 100.0 | 100.0 | 69.85 ± 1.94 | 1.844 | 85.0% | 1.998 | 137.69 | 137.69 | |
| 120.0 | 120.0 | 77.68 ± 1.18 | 1.867 | |||||
| 1:2 | 20.0 | 40.0 | 12.37 ± 0.5 | 1.351 | 25.0% | 1.597 | 17.02 | 34.30 |
| 30.0 | 60.0 | 28.93 ± 0.89 | 1.701 | 50.0% | 2.055 | 39.17 | 78.34 | |
| 40.0 | 80.0 | 41.59 ± 1.34 | 1.884 | 75.0% | 2.648 | 90.15 | 180.30 | |
| 50.0 | 100.0 | 50.65 ± 1.26 | 2.070 | 85.0% | 3.067 | 146.06 | 292.12 | |
| 60.0 | 120.0 | 58.10 ± 1.92 | 2.207 | |||||
CI, combination index. CI ≤ 0.90, 0.90 < CI < 1.10 and CI ≥ 1.10 indicate synergistic, additive and antagonistic effects, respectively.
Fa, fraction affected by the combination dose of myricetin-3-O-rhamnoside and quercetin-3-O-rhamnoside.
Interaction between myricetin-3-O-rhamnoside and quercetin-3-O-rhamnoside on DPP-IV inhibition
3.4. Inhibition to the Formation of AGEs
Advanced glycation ends are a kind of irreversible final products of Maillard reaction, which are formed by a series of reactions between the free amino groups of protein, amino acid, lipid or nucleic acid and carbonyl group of reducing sugar, like condensation, rearrangement, cleavage and oxidation modification [31,32]. Additional, AGEs are closely associated to the diabetic that glycosylation facilitates the development of diabetic complications [33]. Inhibiting the generation of AGEs is considered as an effective method to prevent or delay the incidence of many chronic diseases caused by diabetes.
As can be seen from Figure 4, the four extracts presented different inhibitory capacities towards the AGEs formation under the tested concentrations in a dose-dependent manner. Among those extracts, the TI possessed the strongest inhibitory capacity, while TE showed the weakest suppression (p < 0.05). At the low concentrations (0.25 and 0.50 mg/mL), there was no significant difference between EE and TE. However, when the concentration of EE increased to 1.00 mg/mL, its inhibitory activity has no significant difference with that of TF (p > 0.05) but showed significantly different from that of TE and TI (p < 0.05). When the concentration reached 4.00 mg/mL, the inhibitory capacities of TF and TI exceeded 70%. The IC50 values of the EE, TF, TE and TI were 0.87 ± 0.06, 0.50 ± 0.04, 1.94 ± 0.15 and 0.43 ± 0.03 mg/mL, respectively.
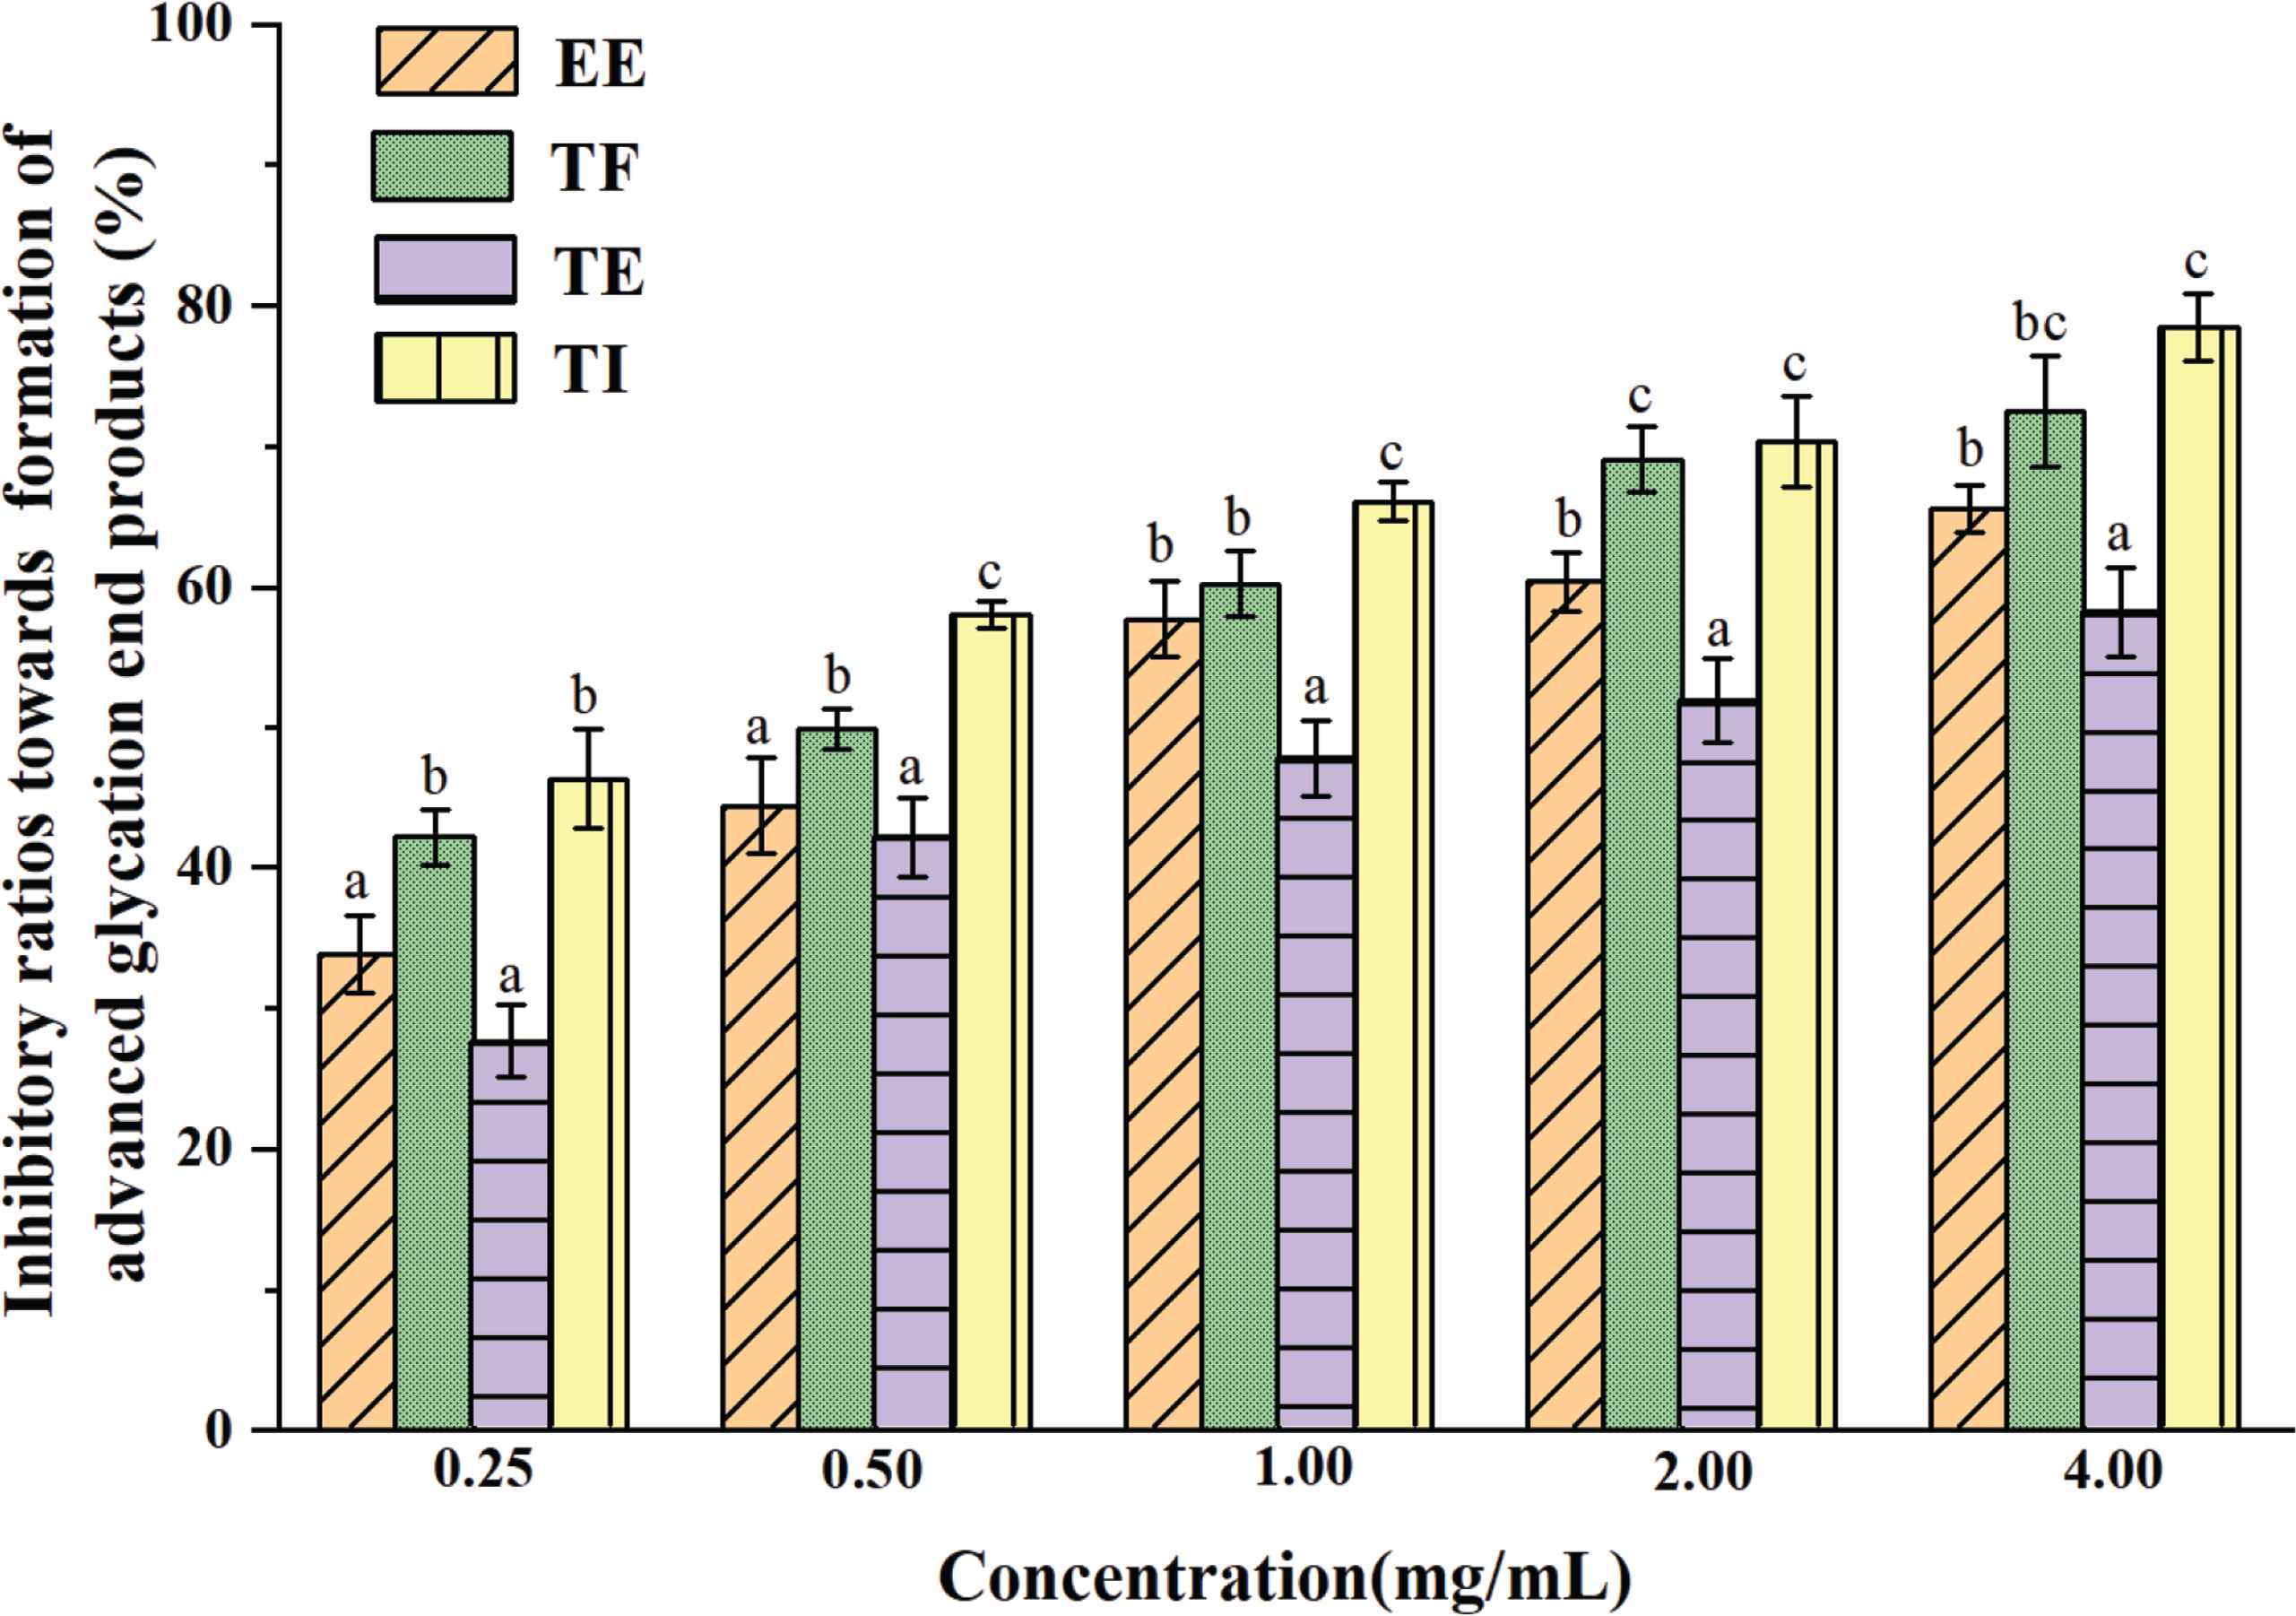
Inhibitory activities of different phenolic-rich extracts from Rhus chinensis Mill. fruits toward the advanced glycation end products formation. All values are expressed as mean ± SD (n = 3). Different letters indicate significant differences at the p < 0.05.
It is well known that the free radicals are involved in the formation of AGEs, and previous studies had proved that the anti-glycation of phenolic compounds may be due to their good antioxidant properties [33,34]. Our previous study had reported that different extracts of R. chinensis fruits exhibited strong ABTS and DPPH radical scavenging activities [10]. Moreover, the ethanol extract of R. chinensis fruits can improve the antioxidant defensive systems in rats with nonalcoholic fatty liver and mice with fibrosis liver in vivo [11,12]. According to those results, it is reasonable to assume that the good inhibitory effect of those extracts toward AGEs formation may be due to their good antioxidant activities. Moreover, as shown in Table 2, both protocatechuic acid and myricetin-3-O-rhamnoside possessed the highest r-values, revealing that these two substances may contribute significantly in the inhibitory effect against the AGEs formation. Previous studies had reported that these two compounds also exhibited strong antioxidant or radical scavenging activities [35,36]. Besides, quercetin-3-O-arabinoside, quercetin-3-O-rhamnoside as well as kaempferol-3-O-hexoside also contributed significantly to the suppression of AGEs formation, which may be also due to their good antioxidant properties [37,38].
4. CONCLUSION
In this study, the in vitro anti-diabetic effects of different phenolic-rich extracts of R. chinensis fruits, namely TF, TE, TI and EE, were investigated based on their inhibitory activities toward α-glucosidase, DPP-IV and the AGEs formation. Results showed that the TF exhibited the strongest inhibitory effects against α-glucosidase and DPP-IV, and TI possessed the strongest inhibitory activity on the AGEs formation. Myricetin-3-O-rhamnoside and quercetin-3-O-rhamnoside, two main flavonoids detected in all extracts, also showed pretty good inhibitory effects towards α-glucosidase and DPP-IV. Interaction analysis revealed that those two compounds displayed additive or synergistic effects on α-glucosidase inhibition, however, showed antagonistic effect on DPP-IV inhibition. Correlation results indicated that myricetin-3-O-(6″-galloyl) glycoside and myricetin O-gallate contributed remarkably to the α-glucosidase inhibition of those extracts, while di-O-galloyl-glucoside and its isomer may significantly contributed to the DPP-IV inhibition. In addition, protocatechuic acid and myricetin-3-O-rhamnoside may take a main responsibility to suppress the AGEs formation. This study suggested that R. chinensis fruits may have potential development and utilization prospects in prevent or treat type 2 diabetes.
CONFLICTS OF INTEREST
The authors declare they have no conflicts of interest.
AUTHORS’ CONTRIBUTION
XL contributed in conceptualization, experiment design, data curation and original draft writing. YF and QM contributed in methodology and in validation. SC and JY contributed in writing review and editing. SC contributed in supervision and project administration.
ACKNOWLEDGMENTS
The present work was financially supported by
SUPPLEMENTARY MATERIAL
Supplementary data related to this article can be found at
Footnotes
REFERENCES
Cite this article
TY  - JOUR
AU  - Xiaojing Liu
AU  - Yishan Fu
AU  - Qian Ma
AU  - Junjie Yi
AU  - Shengbao Cai
PY  - 2021
DA  - 2021/03/02
TI  - Anti-Diabetic Effects of Different Phenolic-Rich Fractions from Rhus Chinensis Mill. Fruits in vitro
JO  - eFood
SP  - 37
EP  - 46
VL  - 2
IS  - 1
SN  - 2666-3066
UR  - https://doi.org/10.2991/efood.k.210222.002
DO  - 10.2991/efood.k.210222.002
ID  - Liu2021
ER  -