
A Hybrid Swarm Intelligence Approach for Blog Success Prediction
- DOI
- 10.2991/ijcis.d.190423.001How to use a DOI?
- Keywords
- Blog success model; Prediction mechanism; Particle swarm optimization; Self-organizing map
- Abstract
Successful blogs receive high ratings and generate marketing value. What factors contribute to the success of a blog and how to predict its success level are questions worth discussing. A hybrid swam intelligence approach is proposed in this study to predict blog success level. First, this study develops a research model of blog success with six factors from content, technology, and social views of point, which include currentness, design, reliability, security, interaction, and connectivity. A questionnaire is designed based on the blog success model. Two hundred ten valid samples are collected from Internet users with experience in using or creating blogs. A hybrid approach combining particle swarm optimization (PSO) and self-organizing map (SOM) is proposed to predict blog success level. The results of 10-fold validation are examined to compare the hybrid PSO–SOM approach with the results from three classifiers: C5.0, classification and regression trees (CARTs), and support vector machine (SVM). For blog success prediction, the results indicate the PSO–SOM approach demonstrates higher accuracy among these methods.
- Copyright
- © 2019 The Authors. Published by Atlantis Press SARL.
- Open Access
- This is an open access article distributed under the CC BY-NC 4.0 license (http://creativecommons.org/licenses/by-nc/4.0/).
1. INTRODUCTION
A blog can be a simple web space for writing a diary or recording thoughts. It can also be a site for publishing or presenting creative works to readers and not limited by space and time. Most blogs are free to create; thus they have attracted a large number of users and had continuously progressed. As of August 2016, Tumblr hosts around 309.9 million blogs [1]. On August 17, 2016, there were over 409 million people view more than 22.2 billion WordPress Blogs pages each month [2]. The statistics imply that blogs are widely accepted by the majority of Internet users and continue to be popular around the world.
Some blogs become more popular than others. In particular, those successful blogs with a high traffic rank relative to other sites create value in marketing. However, a large number of blogs are less interesting and have fewer visitors. What factors influence the success of a blog and how can the success of a blog be predicted more accurately are questions worth discussing. The objective of this research is to develop a blog success model and to adopt a hybrid swarm intelligence approach to predict blog success level.
Particle swam optimization (PSO) is one of swarm intelligence-based techniques that simulate the social behavior of multi-agents in a population, whereas self-organizing map (SOM) is a type of neural network that is trained using unsupervised learning and used in cluster analysis. Previous studies have combined SOM and PSO for clustering problems. Li and Zhang [3] integrated SOM and PSO for alert clustering. Achuthan and Madangopal [4] used SOM and PSO for segregating the group information from the waste input image. SOM and PSO were combined to reduce computational complexity and increase clustering accuracy [5]. PSO is often used to modify SOM model parameters until the intended result is achieved. However, PSO and SOM are seldom combined to be used for classification problems. This study proposes a supervised PSO–SOM approach to classify blogs according to their success level.
In this study, a six-factor model of blog success is developed from content, technology, and social point of views. A questionnaire with 30 items is designed based on the blog success model. Two hundred ten valid samples are collected from Internet users with experience in using or creating blogs. PSO is adopted to find the optimal weights for the input variables of SOM. With the fitness function of PSO to evaluate the population and search for the optimal weights, those blogs with equal success level (measured as explained in the first paragraph of Subsection 4.2) are expected to be segmented into the same cluster by SOM. To evaluate the prediction performance, the proposed PSO–SOM method was compared with three classifiers namely C5.0, classification and regression tree (CART), and support vector machine (SVM).
2. BLOG SUCCESS MODEL
As blogs develop rapidly during the Internet era, blog applications have become increasingly diversified. It is a frequently updated website or web page, typically one run by an individual. A variation of the personal blog is one that collaborates works with a group of people such as authors from newspapers and other media outlets. From simple narratives of personal feelings and experiences, blogs have developed into venues for publishing a person's or multi-authors' works. Some blogs are primarily textual, some focus on photographs (photoblogs), audio (podcasts), videos (video blogs or “vlogs”), and microblogging is another type of blogging, featuring very short posts [6]. A blog becomes a media tool for delivering trending subject matters to society.
Blogs are interactive venues by which readers can reply to or comment on a posted article. Bloggers can recommend a list of other blogs, a blogroll, to the visitors of their blogs. Relationships can be established between bloggers and between the blogger and readers. Blogs networks have online social network properties. Chiu et al. [7] observed most links in blog networks are weak ties; however, tie strength is found positively associated with both transitivity and reciprocity.
Kim et al. [8] focused on how others perceive bloggers and empirically verified measurements for e-impressions which is defined as impressions formed through interpersonal online interactions in blogs. The meta-dimensions with the two axes, sociability and formality, are developed within blog domains. Moreover, 15 adjectives such as sociable, warm, cheerful, nice, amiable for soft dimension; and polished, creative, and novel for creative dimension are utilized to measure online impression.
Corporations have also begun to develop corporate blogs as a means for marketing and business strategies. Dobele et al. [9] examined how a company utilizes its blog to generate and enhance online word-of-mouth diffusion; and indicated a blogs' popularity could be guided by share of voice, measured by the number of comments posted and responded to, and the number of blogs linking to a website. Dennis et al. [10] developed a framework for corporate blogs that examines how blogs' content and management fit with their target audience can have impacts on blog visibility which is measured by the number of inlinks point to the blog from an external domain.
Regarding the determines of blog success, Mohr [11] analyzed timeline information from top-ranked blogs for identifying key factors that determine blog growth and success. The findings show that the most successful blogs are those created by well-connected individuals with access to unique content not found anywhere. According to Du and Wagner [12], blog success can be addressed from the views of three value dimensions, namely, content, social, and technological values. First of all, blogs attract readers through the content that is original and relevant to blogs' target audience. Second, the social value of blogs refers to their community and communication features. Communication is no longer one way with blogs. Recipients of information can also transmit their opinions to the publisher. Blog social network is established through connections among their readers and other bloggers [13]. Finally, the technological value of a blog supports the development of its content and social values. The web technologies manage the blog content and enable the social network of blogs.
To measure the success of a blog, Du and Wagner [12] evaluated blog success concerning popularity rank and growth. This study uses the number of visitors, popularity, the loyalty of readers, and recommendations as for measures of blog success. Six factors are identified from the content, technology, and social value dimensions based on our previous study [14]. The content dimension involves currentness and design. The technology dimension pertains to reliability and security. The social dimension concerns interaction and connectivity. The blog success model developed in this research is shown in Figure 1. The descriptions of the six success factors are presented in Table 1.

The blog success model.
|
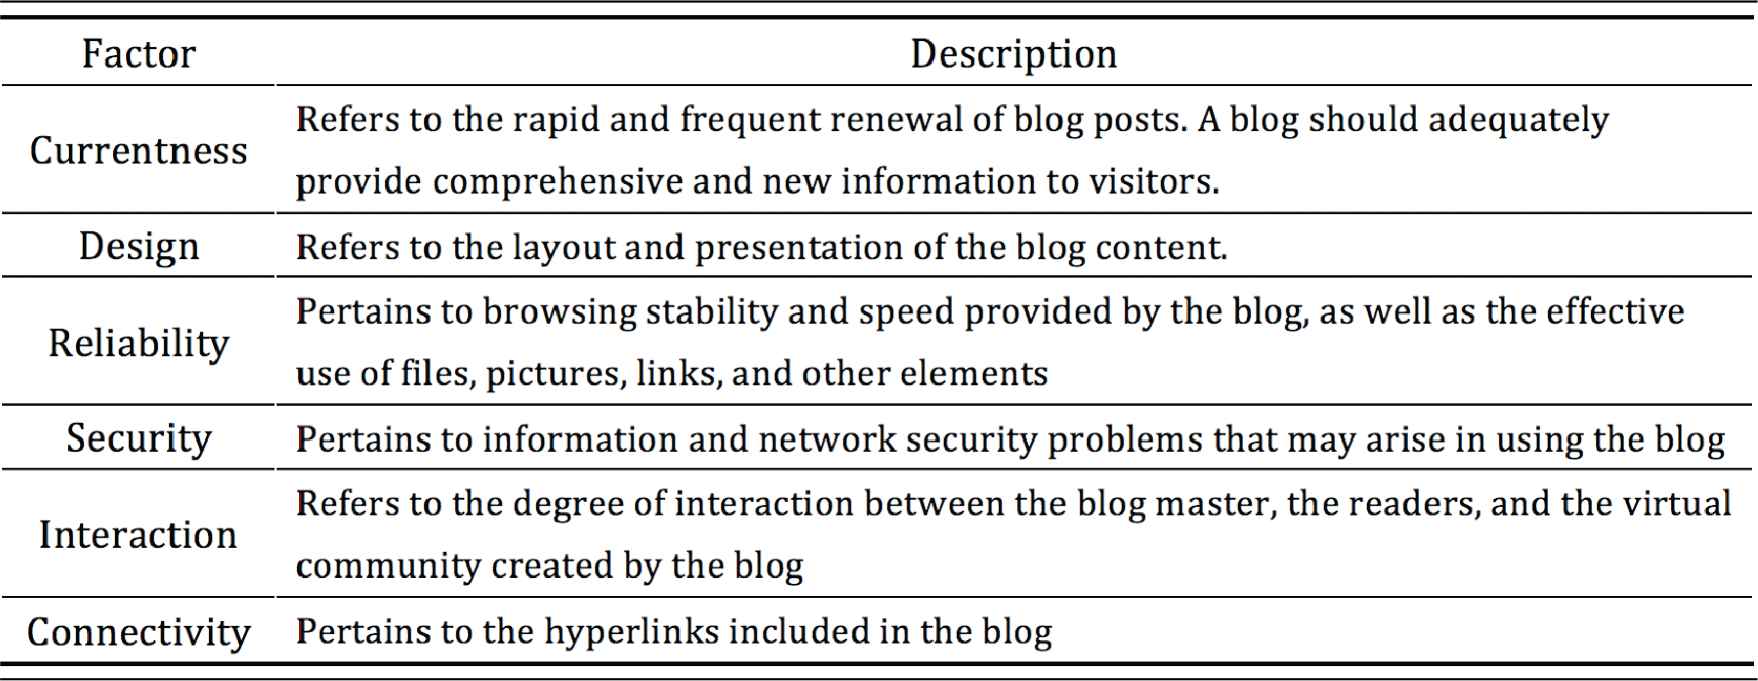
Factor descriptions.
Currentness refers to the ability of a blog to provide rapid and up-to-date posts to satisfy the requirements of visitors obtaining new information; frequent updating is vital to achieving this goal; and design refers to the ease of use for the interface, impressive design, and unique features in the blog. The design of a blog should use colors more pleasing to the eye and adequately represent an original style.
Reliability primarily refers to the normal display of blog content; the efficient downloading of files and functioning of web pages. A stable web server provides reliability to a blog. Security involves protecting users against problems such as virus infection, data theft, or hacking. Instances have occurred in the past wherein personal information or photos have been stolen by hackers and then spread online. Furthermore, information and network safety issues are particular concerns in blogs.
Interaction refers to the responsive and friendly communication between the bloggers and their readers. Indeed, bloggers build social relations with their readers and other bloggers. Moreover, connectivity is essential in forming a virtual community among blogs. A blog is connected to other related blogs, and there are numerous associated links found in blogs. The rich links of blogs contribute to forming a close virtual community.
There are studies exploring emotional factors underlying successful web sites or blogs. De Wulf et al. [15] identified the role of pleasure as a mediating variable between web site evaluations (of content, organization, and technology) and the success (involving satisfaction, commitment, and trust) of a web site. Keng and Ting [17] examined emotional experiences that Internet users gain while reading blogs and found a positive correlation exists between user attitudes toward reading blogs and their experiential value in aesthetics, playfulness, and service excellence. In the blog success model, this study proposes six success factors from the content, technology, and social perspectives. Without considering the mediating factors such as pleasure or emotional experiences, this study primarily focuses on the direct relationships between the six factors and blog success in prediction.
3. METHOD
3.1. Evolutionary Computation
Evolutionary computation (EC) is a family of population-based algorithms for optimization inspired by biological evolution [18]. EC techniques include PSO, genetic algorithm (GA), ant colony optimization (ACO), and so on. Initially proposed by Dorigo [19], ACO was inspired by the biological behavior of ants seeking a path between the colony and a food source. Aiming to search for an optimal path in a graph, ACO has been applied to many combinatorial optimization problems, for example, the traveling salesman problem, scheduling problem, vehicle routing problem, and so on. Dorigo and Di Caro [20] suggest ACO algorithms are mainly suitable for solving NP (nondeterministic polynomial time) problems, combinatorial optimization problems, and distributed problems.
Introduced by John Holland, GA was inspired by natural evolutionary, such as selection, crossover, and mutation [21]. In GA, a population of candidate solutions to an optimization problem is evolved with possible improvement toward better solutions. PSO has similar computational effectiveness as GA for finding the optimal global solution. However, the advantage of PSO is its computational efficiency due to less effort in its function evaluations. Hassan et al. [22] show the computational efficiency superiority of PSO over GA by implementing statistical analysis and formal hypothesis testing. Therefore, this study adopts PSO for its computational efficiency and proposes a hybrid PSO and SOM approach for the classification problem.
3.2. Particle Swarm Optimization (PSO)
PSO is an evolutionary computing technology that employs an optimized population-based graphical method for simulating social behavior[15,16]. A number of animal swarms exhibit a particular movement or foraging mode, which is termed “swarm intelligence.” PSO is similar to this phenomenon because this algorithm describes the members of a swarm as particles, thereby simulating, for example, the swarm intelligence of birds when foraging.
PSO moves particles in a swarm to suitable areas based on an environmental fitness value. Each particle represents a point without volume in the D-dimension searching space, and its flying speed is adjusted based on its flying experience, dynamic status, and those of its fellow particles. The principle behind PSO is as follows: The formula for particle i is
The formula shows that w is the inertia weight, c1 and c2 are acceleration constants, and rand() and Rand() are two random values that vary in the range [0, 1]. Furthermore, the velocity vi of the particle is limited by a maximum speed vmax. If the current acceleration of the particle causes its velocity vid in a certain dimension to exceed the maximum velocity vmax,d of the dimension, the velocity vid is limited to the maximum velocity vmax,d of the dimension.
Let the fitness value of a particle be the objective function value of the given candidate solution. Standard PSO processes are as follows: (1) The process is started. (2) A swarm with size m is initialized based on a random position and speed. (3) The fitness value of each particle is calculated. (4) The fitness value of each particle is compared with the best position it has experienced, or pbest. If the fitness value is larger, then the pbest is updated. The fitness value of each particle is compared with the best position experienced by the whole swarm, or gbest. If the fitness value is larger, then the gbest is updated. (5) The process is stopped once a satisfactory fitness value is reached or at a preset maximum value of generation, Gmax. (6) If the stopping conditions are not reached, then the speed and position of a particle are changed according to Formulae (1) and (2), and the fitness value of each particle is recalculated. These steps are repeated until the ideal conditions for stopping are satisfied. (7) The calculations are completed.
To enhance the performance of standard PSO, some variants of PSO such as adaptive PSO and chaotic PSO are proposed to adjust parameters. A fuzzy system is implemented to dynamically adapt the inertia weight in PSO [24]. Based on Bayesian techniques, an adaptive PSO approach is proposed with adaptive inertia weight [25]. Besides, chaos-embedded PSO methods are introduced which use chaotic maps to generate chaotic series for parameter adaptation in the optimization process [26].
Mimicking the schools of sardines and pods of killer whales, Zhang et al. [27] proposed a novel predator–prey model which embeds the behavior of predator chasing and prey escaping into PSO. The adaptive inertia weight strategy and chaos map were also introduced called a predator–prey adaptive chaotic PSO (PAC–PSO) algorithm. The predator–prey PSO was applied to train the weights and biases of the NN (Neural Networks) classifier for alcoholism detection [27] and Alzheimer's disease detection [28].
This study uses standard PSO to combine with SOM as a first effort proposing a novel hybrid method and providing a baseline for a comparison between the results of the hybrid PSO–SOM approach with the results from three classifiers: C5.0, CART, and SVM.
3.3. Self-organizing Map
Kohonen [29] developed SOM, thus it is also called Kohonen map. SOM is an artificial neural network technology that functions efficiently with clustering, and that belongs to an unsupervised learning network. The principle of SOM originates from the phenomenon wherein brain cells with similar functions in the brain tend to gather in close locations, thus forming blocks for specific senses (such as vision, hearing, and taste) in the brain. When an SOM network finishes learning, its output neurons form various cluster areas on planes with sequent relations.
The most significant difference between SOM and a typical artificial neural network is that the former can map properties with high dimensionality into lower dimensions. A simple network framework of SOM is illustrated in Figure 2. SOM has an input layer and an output network with a 2D lattice. When each unit in the input layer is completely connected to each output neuron in the 2D lattice, the connections of each output neuron to all of the input neurons can be organized in a weight vector.
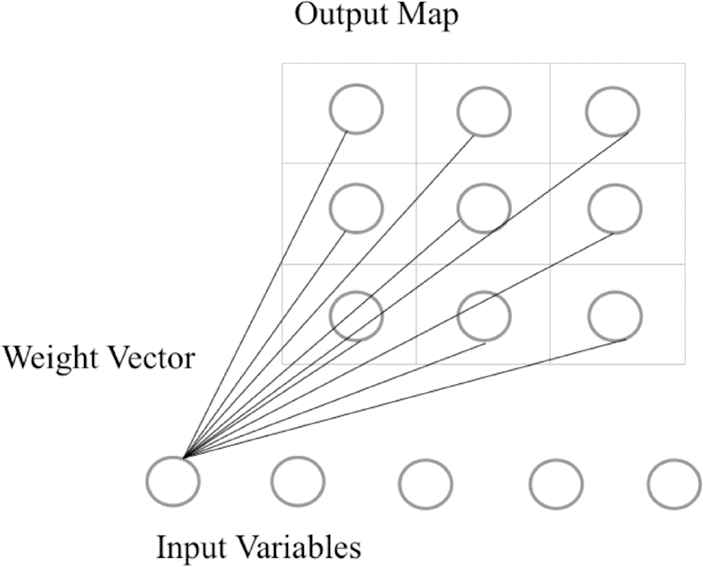
A simple self-organizing map (SOM) network framework.
The SOM algorithm consists of the following steps: (1) The weight vectors are randomly initialized. (2) The input vector of training example is retrieved. (3) The similarity between the input vector and all weight vectors are computed using the Euclidean distance formula. The best matching unit (BMU), which is the neuron with the shortest distance value, is also found.
(4) Formula (3) is used to adjust the neurons near the BMU to bring them closer to the input vector. (5) The cycle is repeated until the stopping conditions are reached (e.g., when the time limit for a cycle is reached) [30].
In Formula (3), t refers to the current learning cycle; Wv refers to the current weight vector; Θ(t) refers to a neighborhood function, which brings the adjustment degree related to the distance between the neuron and the BMU; a(t) refers to the learning limit of time; and D refers to the target input vector.
3.4. The PSO–SOM Method
SOM is an unsupervised learning technique in which unlabeled dataset are grouped into clusters that share similar properties. Unlike supervised learning methods with labeled information as training data, there is no clear way to validate the quality of the unsupervised approach [31].
This study applied the PSO algorithm to convert SOM clustering into supervised classification, called the PSO–SOM method. We attempted to adopt SOM's data segmentation feature as a classifier with the aid of PSO's advantage of the fast searching mechanism. In other words, PSO generates a set of weights that are applied to the input features set (i.e., the input data set). Thus the newly changed input feature values may affect the outcomes of SOM clustering. The evolution of PSO fitness values leads to maximize the correct classification rate by making each cluster a single collection of one class as much as possible. A class is assigned to a cluster if (1) this class is with the highest proportion of known samples in the cluster and (2) this proportion is higher than or equal to the preset threshold value.
Figure 3 depicts the system framework for the PSO–SOM method. The framework primarily consists of three parts. In the first part, PSO generates a set of weights to affect the calculation of SOM clustering. The second part is for the evaluation of classification performance. The threshold value is assigned, and the fitness values are calculated by maximizing the achieved correct classification rate. The third part involves the SOM process through which clustering results are generated for evaluation. Final outcomes are generated once the stop conditions are met.
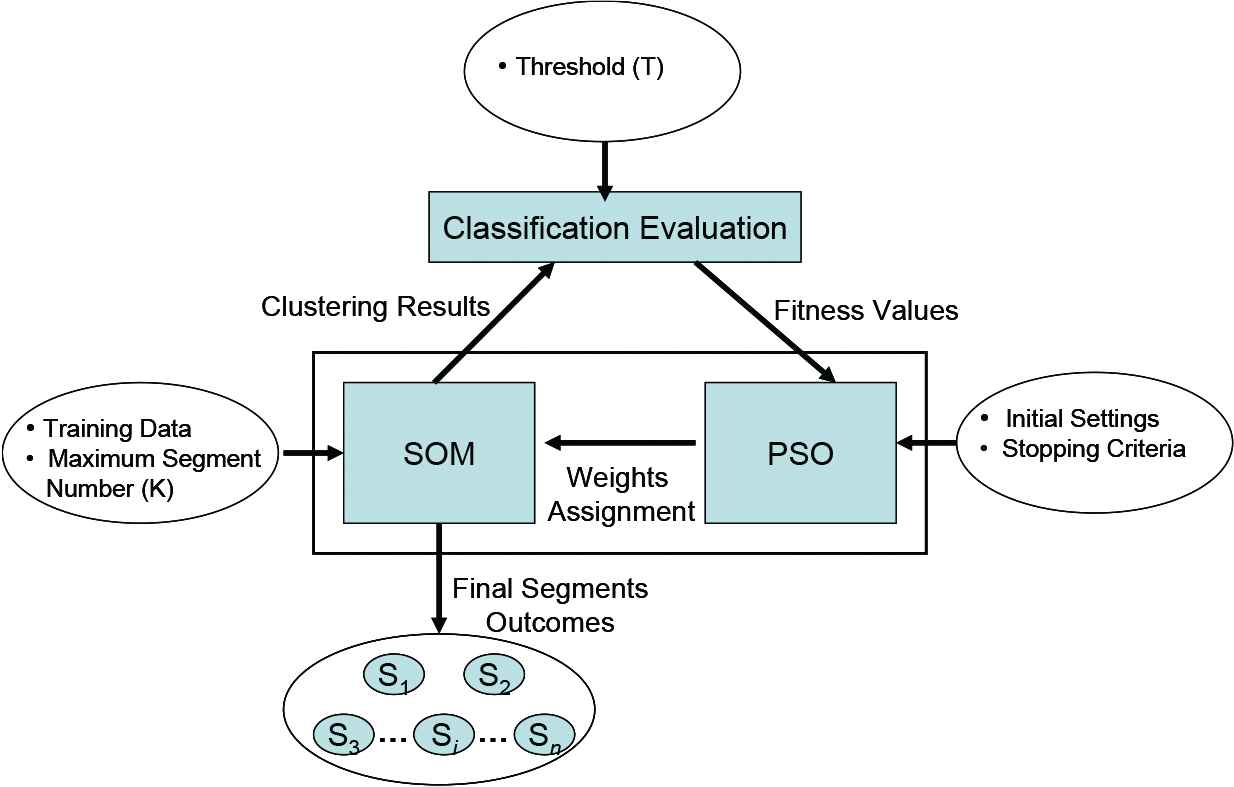
The particle swarm optimization–self-organizing map (PSO–SOM) framework.
The detailed procedure of PSO–SOM method is presented as follows:
Initial values are set such as the population size m of PSO, the maximum speed limit Vmax for a particle, the threshold T, the biggest evolution generation Gmax, the execution time or the acceptable fitness value for the stop conditions, and so on.
The execution of PSO–SOM begins. A population in size m is initialized with random speeds and locations.
PSO is used to generate a set of weights that are applied to the input features set.
SOM calculations with weights are made.
To evaluate the classification results, the fitness value is calculated according to Formulae (4a)–(4c).
Formula (4a) is to calculate the ratio Ri of which class j is with the highest proportion of known samples in the cluster i. In the formula, n refers to the total cluster amount, i = 1 to n; m refers to the total class amount, j = 1 to m; Ci is the total data number of cluster i; Oij refers to the total number of data being correctly categorized as class j in cluster i. Formula (4b) is to check if the ratio Ri is higher than or equal to the preset threshold value T. If Ri is smaller than T, Ri is set to 0. Formula (4c) is the fitness function.
If the stop conditions are not met, then the speed and location of a particle are changed according to Formulae (1) and (2).
The fitness value is recalculated until the cycle achieves one of the stop conditions.
4. THE EXPERIMENTS
4.1. Data Set
A questionnaire was designed based on the blog success model. The questions have been developed according to the description of each factor. To ensure that the participants could fully understand the questionnaire, a trial survey was conducted where several blog users were invited to answer the questions. The questionnaire was then reviewed and revised accordingly. A five-point Likert scale [32] was used in the study. A total of 30 questionnaire items for the six success factors and six questionnaire items for blog success are shown in Appendix A.
The data was collected through questionnaires. The questionnaires were mainly sent to Internet users comprising undergraduates and office workers who had used blogs. A total of 350 questionnaires were distributed. Questionnaires whose respondents had never used a blog or had not used a blog for more than half a year were excluded. Questionnaires in which more than two questions were left blank were also excluded. A total of 210 valid questionnaires were collected. The effective response rate was 60%. Table 2 shows the demographic characteristics of the collected samples, including gender, age, educational level, profession, an average amount of time spent surfing the Internet per day, the experience of using blogs, and whether the respondent owns a personal blog. Notably, 169 respondents, who accounted for 80.5% of the total, had created their blogs.
| Characteristics | Range | Frequency | Percentage | Cumulative Percentage |
|---|---|---|---|---|
| Age | ≤18 | 35 | 16.7 | 16.7 |
| 19 to 25 | 74 | 35.2 | 51.9 | |
| 26 to 30 | 43 | 20.5 | 72.4 | |
| 31 to 35 | 28 | 13.3 | 85.7 | |
| 36 to 40 | 17 | 8.1 | 93.8 | |
| 41 to 45 | 9 | 4.3 | 98.1 | |
| 46 to 50 | 3 | 1.4 | 99.5 | |
| >50 | 1 | 0.5 | 100 | |
| Education | Junior college | 41 | 19.5 | 19.5 |
| College | 134 | 63.8 | 83.3 | |
| Graduate school | 35 | 16.7 | 100 | |
| Time Spend on | <1 hour | 19 | 9.0 | 9.0 |
| Internet per Day | 1 to 3 | 90 | 42.9 | 51.9 |
| 3 to 5 | 56 | 26.7 | 78.6 | |
| 5 to 7 | 22 | 10.5 | 89.0 | |
| >7 | 23 | 11.0 | 100 | |
| Blog Use Experience | 0.5 to 1 year | 54 | 25.7 | 25.7 |
| 1.0 to 1.5 | 41 | 19.5 | 45.2 | |
| 1.5 to 2.0 | 31 | 14.8 | 60.0 | |
| >2.0 | 84 | 40.0 | 100 |
Demographic characteristics of the samples.
The reliability values for blog success and all factors are shown in Table 3. The results show that the values of Cronbach's alpha are all above the acceptable value of 0.7 level [33]. Cronbach's alpha [34] is well known as a estimate of the reliability. However, it may underestimate the true reliability to some extent. A popular alternative to coefficient alpha is composite reliability (CR) to measure the internal consistency of latent variable [35]. The results show that the values of CR are all greater than the 0.6 level as suggested by Fornell and Larcker [36]. The developed measurement items satisfy the reliability requirement.
| Cronbach's alpha | CR | |
|---|---|---|
| Blog success | 0.91 | 0.91 |
| Currentness | 0.86 | 0.86 |
| Design | 0.86 | 0.87 |
| Reliability | 0.89 | 0.89 |
| Security | 0.88 | 0.88 |
| Interaction | 0.83 | 0.85 |
| Connectivity | 0.84 | 0.84 |
The reliability analysis results.
4.2. Experimental Results
The experiment was designed to compare the accuracy of the proposed approach with the results of three classifiers: C5.0 [37], CART [38], and SVM [39].
The value of a factor is the average of corresponding items described in Appendix A as questions under a given factor. The value set of the outcome variable, blog success, is {1, 2, 3, 4, 5} which is considered as the average of corresponding items but rounded to an integer. A higher value indicates a higher degree of success.
The parameter settings were as follows: In PSO–SOM, particle size was 50 and cycle was 100. In C5.0, the expected noise (%) was 0. In CART, the maximum surrogate was 5, the minimum change in impurity was 0.0001, and the impurity measure for categorical targets was Gini. In SVM, the stopping criterion was 1.0E-3, the regularization parameter was 10, the regression precision (epsilon) was 0.1, the kernel type was radial basis function (RBF), RBF gamma was 0.1, bias was 0, gamma was 1, and the degree was 3.
10-fold cross-validation was applied. This study divided the total number of samples into 10 (accounting for 10% each). One-tenth of the samples were used as testing data, whereas the remaining nine-tenths were used as training data.
The accuracy results of PSO–SOM are shown as K = 9, 16, and 25 in Table 4. The best testing accuracy is 77.14% (PSO–SOM K = 16), and the average accuracy of testing is 76.67% for PSO–SOM. The accuracy results of methods C5.0, CART, and SVM are shown in Table 5, indicating that PSO–SOM outperforms C5.0 (69.05%), CART (73.81%), and SVM (73.81%) in the testing results based on 10-fold cross-validation.
| Methods | PSO–SOMa (K=9) | PSO–SOM (K=16) | PSO–SOM (K=25) | |||
|---|---|---|---|---|---|---|
| Training | Testing | Training | Testing | Training | Testing | |
| 1 | 77.25% | 76.19% | 76.72% | 76.19% | 77.25% | 76.19% |
| 2 | 77.25% | 76.19% | 77.25% | 76.19% | 76.25% | 76.19% |
| 3 | 77.25% | 76.19% | 72.48% | 76.19% | 76.72% | 76.19% |
| 4 | 77.25% | 76.19% | 77.25% | 76.19% | 76.72% | 76.19% |
| 5 | 76.72% | 71.43% | 76.72% | 76.19% | 77.25% | 76.19% |
| 6 | 77.25% | 76.19% | 77.25% | 76.19% | 77.25% | 76.19% |
| 7 | 77.25% | 76.19% | 77.25% | 76.19% | 77.25% | 76.19% |
| 8 | 76.19% | 76.19% | 75.66% | 76.19% | 77.25% | 76.19% |
| 9 | 76.72% | 80.96% | 76.72% | 80.95% | 76.72% | 80.95% |
| 10 | 75.13% | 76.19% | 76.72% | 80.95% | 75.13% | 76.19% |
| Avg | 76.83% | 76.19% | 76.40% | 77.14% | 76.78% | 76.67% |
PSO–SOM, particle swarm optimization–self-organizing map.
The accuracy results of PSO–SOM.
| Methods | C5.0 | CART | SVM | |||
|---|---|---|---|---|---|---|
| Training | Testing | Training | Testing | Training | Testing | |
| 1 | 87.30% | 52.38% | 86.24% | 52.38% | 80.42% | 61.90% |
| 2 | 85.71% | 76.19% | 84.66% | 80.95% | 78.31% | 66.67% |
| 3 | 87.30% | 71.43% | 85.19% | 80.95% | 77.25% | 71.43% |
| 4 | 86.24% | 66.67% | 86.24% | 76.19% | 77.78% | 76.19% |
| 5 | 84.66% | 80.95% | 84.66% | 90.48% | 78.84% | 80.95% |
| 6 | 86.24% | 71.43% | 87.30% | 71.43% | 77.25% | 85.71% |
| 7 | 86.77% | 71.43% | 85.71% | 66.67% | 78.31% | 71.43% |
| 8 | 91.01% | 71.43% | 86.24% | 71.43% | 79.37% | 71.43% |
| 9 | 88.36% | 66.67% | 87.30% | 76.19% | 77.78% | 76.19% |
| 10 | 87.30% | 61.90% | 85.19% | 71.43% | 77.25% | 76.19% |
| Avg | 87.09% | 69.05% | 85.87% | 73.81% | 78.26% | 73.81% |
The accuracy results of C5.0, CART, and SVM.
5. DISCUSSION AND CONCLUSION
This study discusses blog success and the factors contributing to successful blogs. In our blog success model, six factors are identified to predict the success of a blog from content, technology, and social dimensions.
In content dimension, currentness refers to the frequency in updating and providing new information and knowledge on the latest trends and issues; design considers the overall design of a blog, that is, whether it is original, pleasing to the eyes, and easy to use.
In technology dimension, reliability is measured by the stability of the browsing speed, web page display, and functions of a blog; in measuring security, attention is focused on webpage safety issues such as the threat of viruses and the loss of data privacy.
In social dimension, interaction indicates whether the blog provides a good communication venue, whether users are willing to publish their opinions, and whether users receive replies; connectivity pertains to the hyperlinks in a blog and their associated reference value.
Regarding the prediction method adoption, PSO is a computational method that optimizes a problem by simulating the social behavior of multi-agents in a population. It has been combined with SOM for solving clustering problems [3–5]. However, few studies have investigated combining PSO and SOM for classification problems. This study, therefore, proposed a supervised PSO–SOM approach for predicting blog success. Although other techniques, such as simulated annealing and GA, can perform optimized searches, PSO possesses a relatively more efficient searching ability for continuous weight values.
The performance of the proposed prediction approach has been compared with those of C5.0, CART, and SVM. The testing results indicate the PSO–SOM approach yields better accuracy in 10-fold cross-validation. This study is an application for the hybrid approach of PSO and SOM for supervised classification. In the future, various clustering and fast searching methods may be potentially viable to be combined for other prediction applications.
ACKNOWLEDGMENTS
This study was supported by the Ministry of Science and Technology, Taiwan, Republic of China, under contract no. MOST 102-2410-H-424-013 and MOST 104-2410-H-155-029-MY2. Special thanks to New W. and M. Yang for their assistance in modeling, data collection, and experiment.
APPENDIX A. QUESTIONNAIRE ITEMS
Currentness
| The content of this blog is frequently updated. |
| New information is always available on this blog. |
| I can learn new knowledge from this blog. |
| I can discover the latest trends by browsing this blog. |
| This blog discusses hot issues. |
Design
| The blog interface is easy to use. |
| This blog has an impressive design. |
| The color scheme of this blog is pleasing to the eyes. |
| This blog has unique features. |
| The design of this blog is original. |
Reliability
| Pictures in this blog appear normally. |
| The display speed of this blog page is steady. |
| The contents or documents of this blog can be downloaded normally. |
| The Web page functions of this blog can operate normally. |
| This blog uses a stable server. |
Security
| I am not worried about being infected by viruses while browsing this blog. |
| This blog addresses network security issues. |
| The network safety of this blog can be trusted. |
| I do not need to worry about my personal information being revealed to |
| others while browsing this blog. |
| In general, I find this blog safe to use. |
Interaction
| This blog promotes friendly interaction for readers. |
| The posts in this blog often receive readers' replies. |
| I will leave my comments on this blog. |
| This blog provides a good communication space. |
| I am satisfied with the interaction between the moderator and |
| the blog visitors. |
Connectivity
| This blog is connected to other related blogs. |
| This blog is frequently invited to join the association lists of other blogs. |
| I always click the associated links in this blog. |
| This blog has numerous associated links. |
| Most of the associated links in this blog have reference values. |
Blog Success
| I believe that many people will browse this blog. |
| I think this blog has high popularity ratings. |
| This blog can attract visitors for repeat visits. |
| I think this blog has loyal reader groups. |
| I will recommend this blog to relatives and friends. |
| I find the operation of this blog to be successful. |
REFERENCES
Cite this article
TY  - JOUR
AU  - Chi-I Hsu
AU  - Shelly P. J. Wu
AU  - Chaochang Chiu
PY  - 2019
DA  - 2019/04/29
TI  - A Hybrid Swarm Intelligence Approach for Blog Success Prediction
JO  - International Journal of Computational Intelligence Systems
SP  - 571
EP  - 579
VL  - 12
IS  - 2
SN  - 1875-6883
UR  - https://doi.org/10.2991/ijcis.d.190423.001
DO  - 10.2991/ijcis.d.190423.001
ID  - Hsu2019
ER  -