
A Novel Approach to Fuzzy Cognitive Map Based on Hesitant Fuzzy Sets for Modeling Risk Impact on Electric Power System
- DOI
- 10.2991/ijcis.d.190722.001How to use a DOI?
- Keywords
- Fuzzy cognitive map; Hesitant fuzzy set; Risk factors; Electric power system; Simulation
- Abstract
Electric power industry has been undergoing enormous transformations. Therefore, it is necessary to improve the security of electric power system and the decision capacity in the emergency process. As a complicated system, electric power system is affected by many factors, the reasoning of which can be regarded as a process that combines intuition and cognition. Uncertainty characterizes human cognitive and reasoning processes. Several extensions of fuzzy cognitive map (FCM) model have been suggested to handle multifarious sources of uncertainty. Nevertheless, the uncertainty from human doubt may arise in the assignment of membership degrees, which is neglected in current FCMs. To deal with this problem, a novel approach based on hesitant fuzzy sets (HFSs) and FCMs, called hesitant fuzzy cognitive maps (HFCMs), is presented in this paper. The proposed method, which possesses the features of tackling hesitancy explicitly during the experts' assessments, is demonstrated by an example on the analysis of risk factors affecting electric power system. It can provide a better simulation of the inherent uncertainty in real problems through the hesitancy represented in experts' knowledge, and a what-if analysis for describing hesitant fuzzy scenario is well developed with the HFCM model.
- Copyright
- © 2019 The Authors. Published by Atlantis Press SARL.
- Open Access
- This is an open access article distributed under the CC BY-NC 4.0 license (http://creativecommons.org/licenses/by-nc/4.0/).
1. INTRODUCTION
The security of electric power is an important business that is directly related to the stability of the whole society and the safety of people's lives and property. In a sense, the electric power has become an indispensable pillar for human development, social stability, and people's happiness (Ohnishi [1]; Wada et al. [2]). The process of modernization is accompanied with risks and crises. This is especially true for electric power industry. Under the circumstances of information networking, economic globalization, and the deterioration of the ecosystem, the electric power crises occur frequently (Imran and Amir [3]; Li et al. [4]; Choi and Lee [5]). Since 2003, the large-scale blackouts have taken place in the world. Several countries, including the United States, the United Kingdom, Sweden, Italy, Denmark, and Malaysia, have suffered large-scale power outages. The unique trait of modern power grid will make the accidental and local happenings spread to the whole network in a short time, which could result in substantial damage to life and property (Kessides [6]; Hosoe [7]; Wada et al. [2]). The cascading effect will lead to the spread of deeper crisis and bring about serious negative effect on economic development, social production, and living. Therefore, the management of electric power crisis has become an inevitable issue for the world, and exploring the factors that lead to the electric power crisis has already become the core content of the research on the management of electric power crisis.
With the unceasing innovation of methods, the research on risk factors affecting electric power system presents a trend from “experience type” to “early warning” (Liu et al. [8]; Yu et al. [9]; Imran and Amir [3]). Most of the available researches focus on the intrinsic physical fault of power grid, and some methods have been proposed, such as fault tree analytical method, the condition monitoring of electric power system, remote monitor technology, diagnosis technology for high-speed system, and so on (Yang et al. [10]; Lazic and Kaigo [11]). Considering exterior influence factors, some scholars have shown solicitude for security warning and decision support system for power grid (Liu et al. [8]; Choi and Lee [5]). Moreover, new information management tools have been imported to aid decision-making. There are some studies on risk factors affecting electric power system from certain way and the comprehensive evaluation is seldom provided. However, to explore the risk factors we must not be just from the start, but be sure of the whole. Therefore, based on the inheritance and development of the existing analysis methods, it is necessary to establish a comprehensive index system from a systematic perspective, which can reflect the real situation of the sudden events in electric power system.
As an effective modeling method for complex systems, FCMs integrate fuzzy logic and neural networks (Kosko [12]). Since its appearance, it has attracted a lot of attention from researchers and has been applied to many areas, such as decision-making (Iakovidis and Papageorgiou [13]; Baykasoğlu and Gölcük [14]), prediction of time series (Song et al. [15]; Stach et al. [16]), risk management (Papageorgiou et al. [17]; Subramanian et al. [18]), and so on. Furthermore, several extensions of FCMs have been presented for modeling complex systems. Miao et al. [19] put forward dynamic causal networks to quantify the concepts and the strength of causality between concepts in FCMs. Zhou et al. [20] presented fuzzy causal networks on the basis of the convergent features of FCMs. Nevertheless, practical constraints of the real world hamper the widespread use of crisp values (Baykasoğlu and Gölcük [14]). FCMs often require decision-makers to deliver evaluations on the relationships between factors, which is time-consuming and involves dealing with many uncertainties from a number of different sources. Thus, it is usually unrealistic to obtain exact evaluations in FCMs when the available data for the evaluations is ambiguous, insufficient, hesitant, and so on. To deal with the uncertainties, some kinds of extensions of FCMs have been presented. Salmeron [21] proposed fuzzy grey cognitive maps (FGCMs) based on grey systems theory. Iakovidis and Papageorgiou [13,22] proposed intuitionistic fuzzy cognitive maps (IFCMs), which combine intuitionistic fuzzy sets (IFSs) and FCMs. Çoban and Onar [23] presented an approach to FCMs within the context of hesitant fuzzy linguistic environment (i.e., hesitant fuzzy linguistic cognitive maps (HFLCMs)). Through reviewing the literature, we can find that most of the above extensions are utilized to model the uncertainties inherent in the evaluation process. Although these extensions provide a better modeling of uncertainty in knowledge representation, a certain source of uncertainty is ignored. Specifically, except the FGCMs, none of them can deal with the uncertainties incurred by human doubt that may appear in the initial concept values and experts' judgments for casual influences between concepts. It is essential for modeling this kind of uncertainty when a group of experts are invited to take part in the assessment process, which is typically the case in FCM. Therefore, this paper presents a novel approach to FCM based on HFSs for dealing with these issues. It is clearly that the hesitant fuzzy set (HFS) theory is combined with FCM to address a certain kind of uncertainty, that is, hesitancy. It means that the hesitant fuzzy influence of the relationships between factors can be quantified by the proposed techniques. Unlike the FGCMs, the proposed method allows to tackle uncertainty and hesitancy both in one expert's assessments (i.e., intrapersonal hesitancy) and the assessments among experts (i.e., interpersonal hesitancy). It allows a better way to represent the evaluations of decision-makers by adopting HFSs, especially when people are difficult to express their opinions on the relationships between factors with a precise value. The IFCMs, which integrate IFSs and FCMs, also allow us to handle hesitancy (Papageorgiou and Iakovidis [22]). However, the concern of this paper is that when defining the membership of an element, the difficulty of establishing the membership degree is not because we have a margin of error (as in IFSs), but because we have a set of possible values (Torra [24]). The HFS theory is a useful tool and people are free to express their opinions on membership degrees. It makes people to hesitate on which value could be the right one (Rodríguez et al. [25]; Asan et al. [26]). The relationship between IFSs and HFSs has been discussed (Torra [24]; Rodríguez et al. [25]).
Therefore, in this paper, a novel approach to FCM that aims to exploit the advantages of HFS and FCM is proposed and applied to the analysis of influence factors in sudden electric events, which will be helpful for risk managers to take targeted measures and minimize the losses. The novelties of this paper can be summarized as follows:
The HFSs and FCMs are integrated to handle hesitancy and uncertainty involved in the evaluation process, where human reasoning in the proposed method is better represented than FCMs. Moreover, the proposed method has the ability to capture the intrapersonal hesitancy and the interpersonal hesitancy simultaneously.
The proposed method can overcome the limitation of current FCMs. It allows us to deal with the inherent hesitancy in the initial concept values, the experts' assessments for causality between concepts, and the output hesitancy values, which are typically the cases in group decision environment.
We amend the FCM method with a new perspective on the causal relationships between concepts and the algorithm of information aggregation. It is also the first time that the HFCMs and correlation coefficient of hesitant fuzzy elements (HFEs) are combined to analyze the risk factors influencing electric power system.
The remainder of this paper is organized as follows: In section 2, some basic concepts related to HFSs and FCMs are introduced. Section 3 puts forward HFCMs. In Section 4, a new algorithm based on HFCMs for modeling uncertainty is proposed. A case study on the analysis of risk factors affecting electric power system and the comparative analysis are conducted in Section 5. Section 6 ends the paper with some conclusions.
2. HFS AND FCMS
In this section, some basic concepts related to HFSs and FCMs are introduced.
2.1. Hesitant Fuzzy Set
Definition 1.
(Torra [24]). Let
Xia and Xu [27] adopted the following mathematical symbol to express HFS:
Here,
Some operations of HFEs are defined as below (Xia and Xu [27]).
Definition 2.
Let
In many cases, the numbers of values in different HFEs are usually different (Liu et al. [28]; Liu et al. [29]). Xu and Xia [30] put forward an extending principle for HFEs as follows: Given two HFEs
Moreover, from Definition 2, we can find that the dimensions of the obtained HFE will increase and the calculation results are more complex after doing the addition or multiplication operations. To overcome the shortcomings, Liao et al. [35] presented novel operational laws for HFEs as follows.
Definition 3.
Let
Here,
Correlation implies how well two variables move together in a linear fashion. Xu and Xia [30] proposed a correlation coefficient for HFEs as follows:
2.2. Fuzzy Cognitive Maps
As a hybrid knowledge representation method (Xirogiannis and Glykas [36]), FCMs combine the synergistic fuzzy logic and theories of neural networks, and are based on the exploitation of the integrated experience of experts (Dickerson and Kosko [37]). FCMs, which provide a powerful tool for the complex system modeling, are composed of nodes and weighted arcs. Nodes of the graph represent the concepts describing behavioral characteristics of the system (Stylios and Groumpos [38]). Each concept stands for a variable, an entity, a state, and so on. The weighted arcs denote the causal relationships, which exist among concepts and interconnect them. This graph with feedback clearly shows the affecting relations and the degree of influence among concepts. A simple FCM is illustrated in Figure 1.
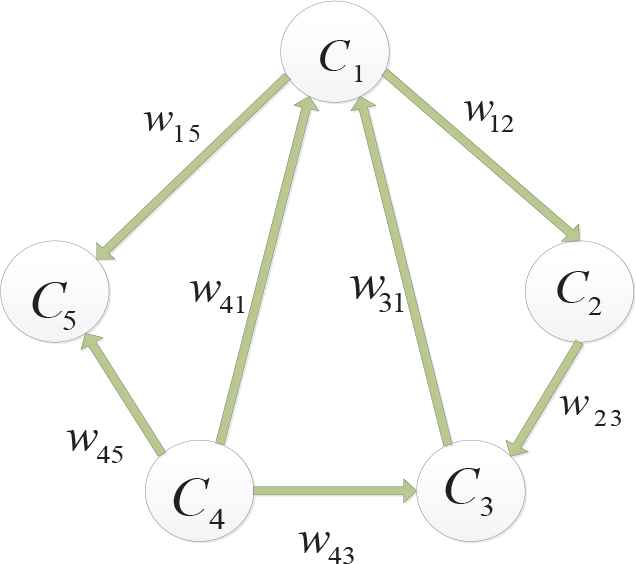
A simple fuzzy cognitive map (FCM).
A simple FCM consisting of five concepts is illustrated in Figure 1. Generally, concepts represent states, variables, key factors, and conceptual characteristics of the system. The weighted arcs, which connect different nodes, stand for the causal relationships between concepts and weight
When
When
When
The connection weights can be obtained from experts' knowledge (Stylios and Groumpos [38]; John and Innocent [39]; Papageorgiou et al. [40]; Iakovidis and Papageorgiou [13]; Papageorgiou and Iakovidis [22]). Therefore, a transition matrix
The concept value
Here,
The hyperbolic tangent function can be utilized when the concept values are negative and remain in the interval [−1, 1]:
Here, the parameter
It settles down to a fixed pattern of concept values; output value has been stabilized at a fixed value.
The state continues cycling between several fixed states, which indicates that a limit cycle appears.
There is the possibility that chaotic state has appeared. In this case, the output concept value is uncertain and a useful outcome cannot be obtained.
In the short period since its appearance, FCMs have been widely used as a decision-making and simulation tool in many areas (Papageorgiou [46]; Baykasoğlu and Gölcük [14]; Martinez and Garcia [47]; Hajek and Froelich [48]). It is effective in modeling relationships between risk factors and has been proposed to incorporate a high level of uncertainty (Papageorgiou and Salmeron [49]). As a powerful mathematical tool, the FCM method can be used to address the equilibrium that is reached by certain cross-influenced indicators (Mourhir et al. [50]). This method collects knowledge and experience from a group of experts, and the model configuration will depend on the interaction rules given by the experts. Therefore, how to construct the FCMs when the judgment information of different experts are considered is a challenge problem, which is also one of the focuses of this paper.
3. HESITANT FUZZY COGNITIVE MAPS
As a generalization of FCMs, HFCMs are a novel kind of soft computing technique for modeling human knowledge in the decision-making process. HFCMs represent unstructured knowledge through causalities expressed in HFEs. The nodes in HFCMs, which represent concepts, are variables. The edges stand for the relationships between nodes. An edge that links two nodes can model the causal influence of the causal variable on the effect variable. HFCMs, which combine HFSs and neural networks, are hybrid methods. A simple HFCM consisted of four nodes is illustrated in Figure 2.
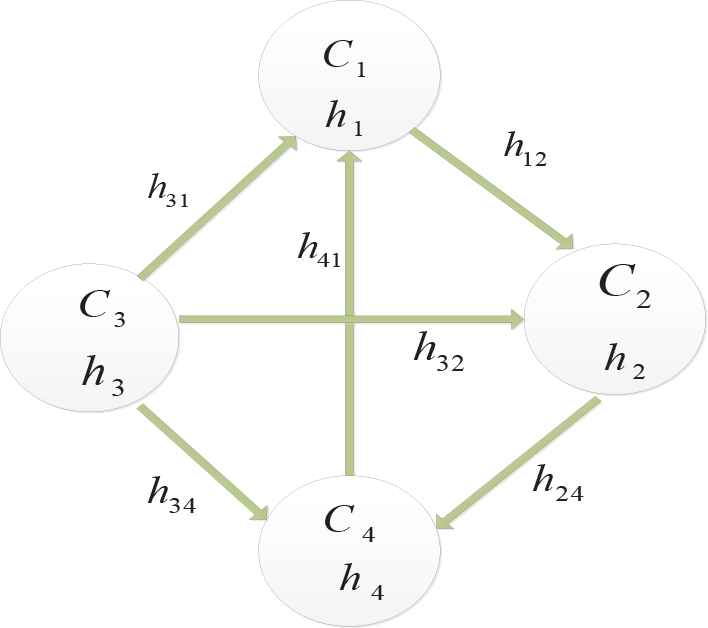
A simple hesitant fuzzy cognitive map (HFCM).
In HFCMs, each node
Having in mind that both the concept values and the influence degree between concepts are expressed in the form of HFEs, we reformulate the equation of FCM described by Equation (4) as below:
Here, the summation and multiplication operations over HFEs defined by Definition 3 have replaced the respective operations in Equation (4).
Proposition 1.
In HFCMs, assume that
Proof.
By Definition 3, we obtain
Therefore, a vector
Since
The reasoning process of HFCMs finishes if the stability is reached. The final hesitant fuzzy vector shows the effect of the change in the hesitant fuzzy value of each concept. After several iterations, the HFCMs reach one of the following states: (1) It settles down to a fixed pattern of concept values, which is described as the hesitant fuzzy fixed-point attractor. (2) The state continues cycling between several fixed states, which is known as a hesitant fuzzy limit cycle. (3) A chaotic state may occur, which will be uninformative.
Generally, many decisions are made with strong uncertainty and it is difficult to determine the precise values of concepts and causal relationships (Hajek and Froelich [48]). Therefore, several extensions of FCMs have been proposed to incorporate a high level of uncertainty (Papageorgiou and Salmeron [49]). In many cases, the FCM method requires to collect knowledge and experience from a group of experts when determining the states of the system and quantifying causalities. Therefore, such method needs to address uncertainties and subjectivities inherent in the evaluation process. However, in the existing researches on FCMs, the uncertainty from the human doubt is partly or entirely neglected. To solve this problem, this paper proposes a novel approach to FCM based on HFSs that can effectively handle the hesitancy in experts' evaluations and provide a better representation of uncertainty.
4. THE DECISION STEPS OF THE PROPOSED METHOD
Generally, there are two main ways to construct FCMs (Salmeron and Papageorgiou [51]). One is to use the domain experts' knowledge, and another is to use learning algorithms. The method proposed in this paper belongs to the former. The domain experts are invited to determine the number and kind of nodes, which form the HFCMs. Moreover, the influence of one node on another is determined as positive or negative in the light of experts' experience, and the degree of influence is modeled as a HFE
Here,
Here,
In this section, we extend FCMs to accommodate hesitant fuzzy environment, and integrate HFCMs and hesitant fuzzy correlation coefficient to analyze the impact of risk factors on electric power system. Based on above analysis, a new algorithm based on HFCMs for modeling uncertainty of the system is presented as follows and the flowchart of the proposed method is shown in Figure 3.
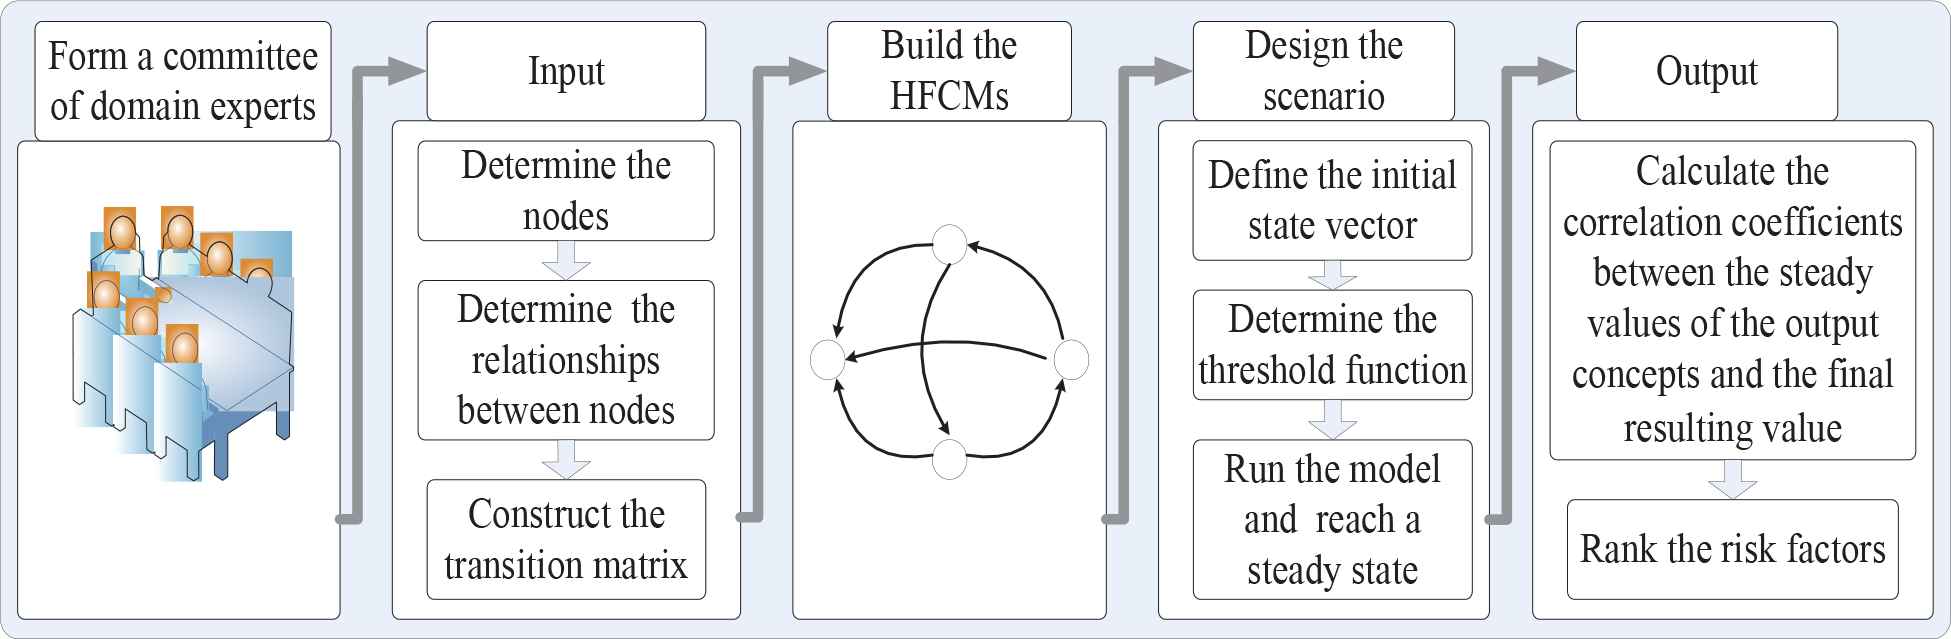
The flowchart of the proposed method.
Step 1. A committee of domain experts is formed and the number and kind of nodes are determined through literature research and consulting experts.
Step 2. The relationships between nodes are identified based on the domain experts' knowledge and experience. Then, a transition matrix is obtained.
Step 3. Graph-based HFCM model is constructed.
Step 4. Simulation scenario is designed to study how risk factors influence the electric power system.
Step 5. According to Equation (2), the correlation coefficients between the steady values of the output concepts and the final resulting value are calculated, and the risk factors are ranked.
Step 6. End.
By dealing with hesitancy and uncertainty in the initial experts' assessments for causal relationships between concepts and the initial concepts states, HFCMs can be utilized to compute the system's steady states. Based on HFS theory, HFCMs are dynamic systems involving feedback, whose nodes represent the concepts with hesitant fuzzy variables and the effect of change in a node will influence other nodes. Compared with FCM, HFCM shows several advantages in the following: Firstly, it is an extension of FCM. If all the relationships and concept values are represented by crisp values, the HFCM is reduced to a FCM. In this sense, HFCM shows people's knowledge better than FCM, since it tackles the uncertainty better and has a much broader meaning than FCM. Secondly, it is a more flexible tool. The HFCM can be used to model the uncertainty and experts' hesitancy. The nodes and causal relationships are modeled as HFEs, which incorporate experts' knowledge. Last but not least, it can be adapted to a wide variety of problems, especially in hesitant fuzzy environments. With the HFCM model, a what-if analysis is developed, whose aim is to depict possible hesitant fuzzy scenarios about hesitant fuzzy decisions.
5. NUMERICAL EXAMPLE AND COMPARATIVE ANALYSIS
In this section, an illustrative example about the risk analysis of influence factors in sudden electric events is presented to demonstrate the application of the proposed method. And the comparative analysis is conducted to illustrate the feasibility and superiority of the proposed method.
5.1. An Illustrative Example
As an indispensable form of energy in human life, electric power is economical, clean, and convenient. It is easy to be converted and transferred. As a kind of special products, electric power is offered to the power customers by the power divisions. Nowadays, the electric power industry is undergoing radical transformations (Voropai et al. [52]), and the sudden events in electric power system occur momentarily and have bad effects on society. They can result from a variety of reasons, such as failure of equipment, short circuits, errors of personnel, and so on (Voropai et al. [53]). Assume that the maintenance department of a power company tries to explore the causes of sudden events in power system. The risk factors influencing electric power system are analyzed by domain experts. Through expert interview and literature review, the risk factors are derived, which are shown in Table 1.
| Factors | Sub-Factors (Nodes) | Sources |
|---|---|---|
| Human factor | Quality factors of personnel C1 | Ye and Zhang [54], Wada et al. [2] |
| Limitations on the cognitive capacity of natural Persons C2 | Wada et al. [2], Ohnishi [1] | |
| Negligence C3 | Choi and Lee [5], Ohnishi [1], Voropai et al. [53] | |
| Environment | Uncertain factors in the natural world C4 | Ye and Zhang [54] |
| Natural disasters C5 | Ye and Zhang [54], Lazic and Kaigo [11], Ohnishi [1] | |
| Technology | Backward in power generation technology C6 Backward in transmission system technology C7 |
Neudorf et al. [55], Lazic and Kaigo [11], Voropai et al. [53] |
| Power grid | Lack of effective coordination mechanisms for grid management C8 | Ye and Zhang [54], Voropaiet al. [53], Ohnishi [1] |
| Lack of unified planning for power grid construction C9 | Choi and Lee [5], Voropai et al. [56] | |
| Lack of emergency preparedness for power grid C10 | Choi and Lee [5], Lazic and Kaigo [11] | |
| Unreasonable structure of grid frame C11 Sudden electric events R (i.e., the end result) |
Choi and Lee [5], Voropai et al. [56] |
The risk factors influencing electric power system.
Based on above analysis, we apply the proposed method to make an analysis on influence factors in sudden electric events. The specific process is as follows:
Step 1. Form a committee of domain experts and identify the risk factors which represent the nodes in HFCMs and are shown in Table 1.
Step 2. The relationships between nodes are identified based on the domain experts' knowledge and experience, and a transition matrix
Step 3. Graph-based HFCM model is constructed as below (see Figure 4).
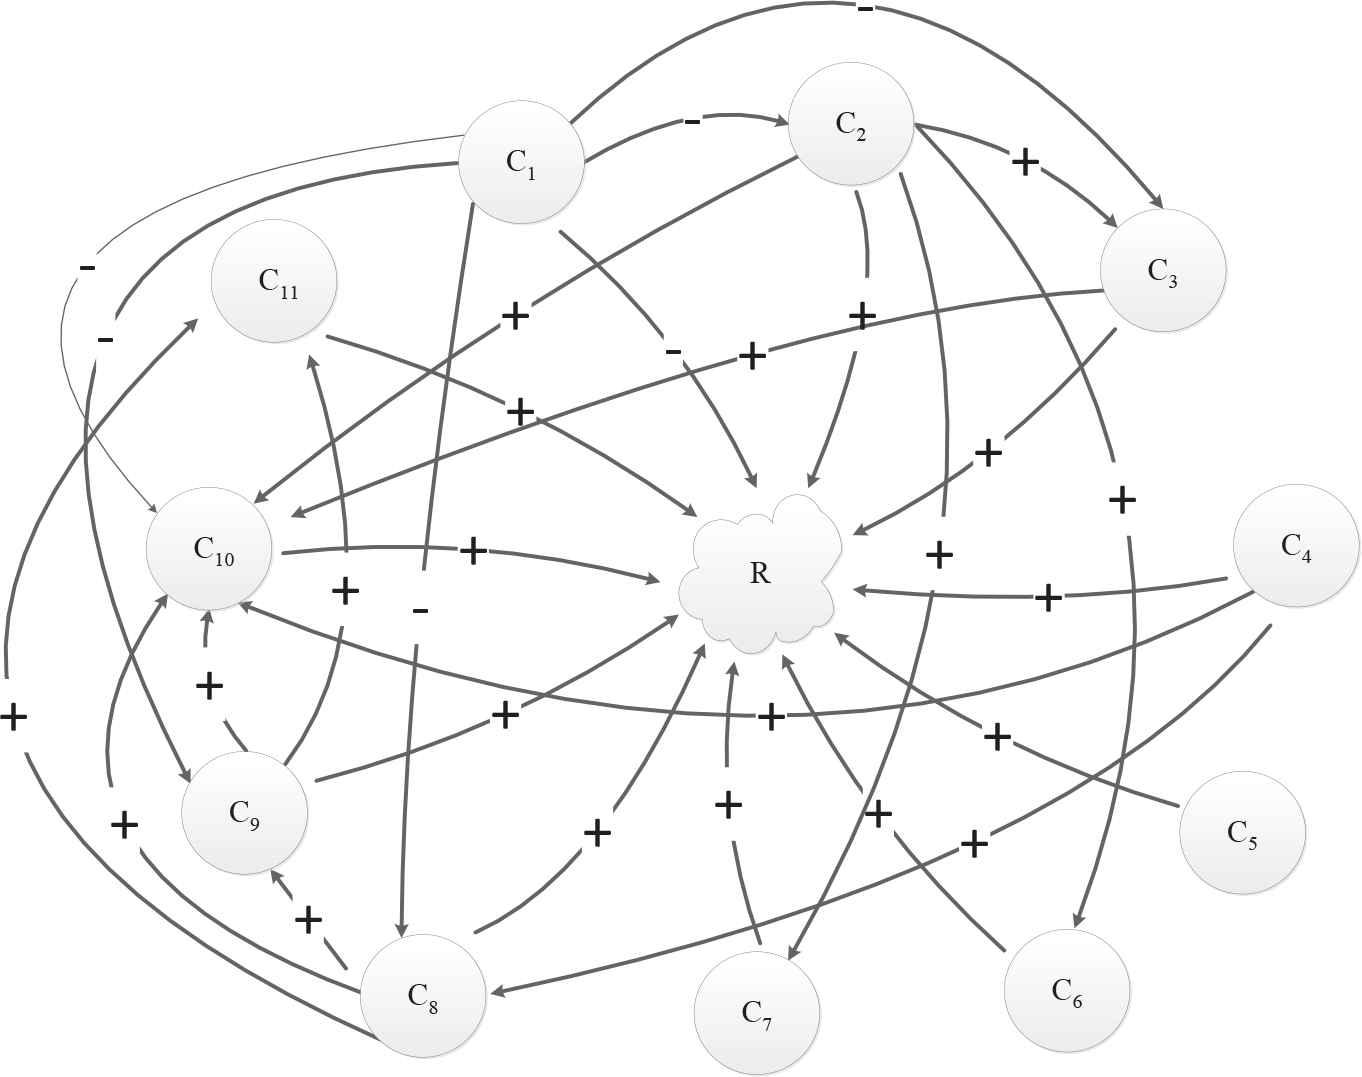
Hesitant fuzzy cognitive map (HFCMs) for modeling of risk factors in sudden electric events.
Step 4. Simulation scenario is designed. The initial state vector with 12 nodes is defined as below.
Here,
| Nodes | Initial State | Steady State |
|---|---|---|
Simulation results.
Step 5. According to Equation (2), the correlation coefficients between the steady values of the output concepts and the final resulting value are calculated as follows:
Therefore,
5.2. Discussions Regarding the Parameter λ
In the proposed method, we first set the parameter
| Nodes | Initial State | Steady State |
|||
|---|---|---|---|---|---|
Simulation results with different parameters.
On the other hand, the correlation coefficients between the steady values and the final resulting value can be calculated. With the change of parameters, the correlation coefficients are changed, which are shown in Figure 5. The results shown in Figure 5 reveal that the rankings are unchanged and
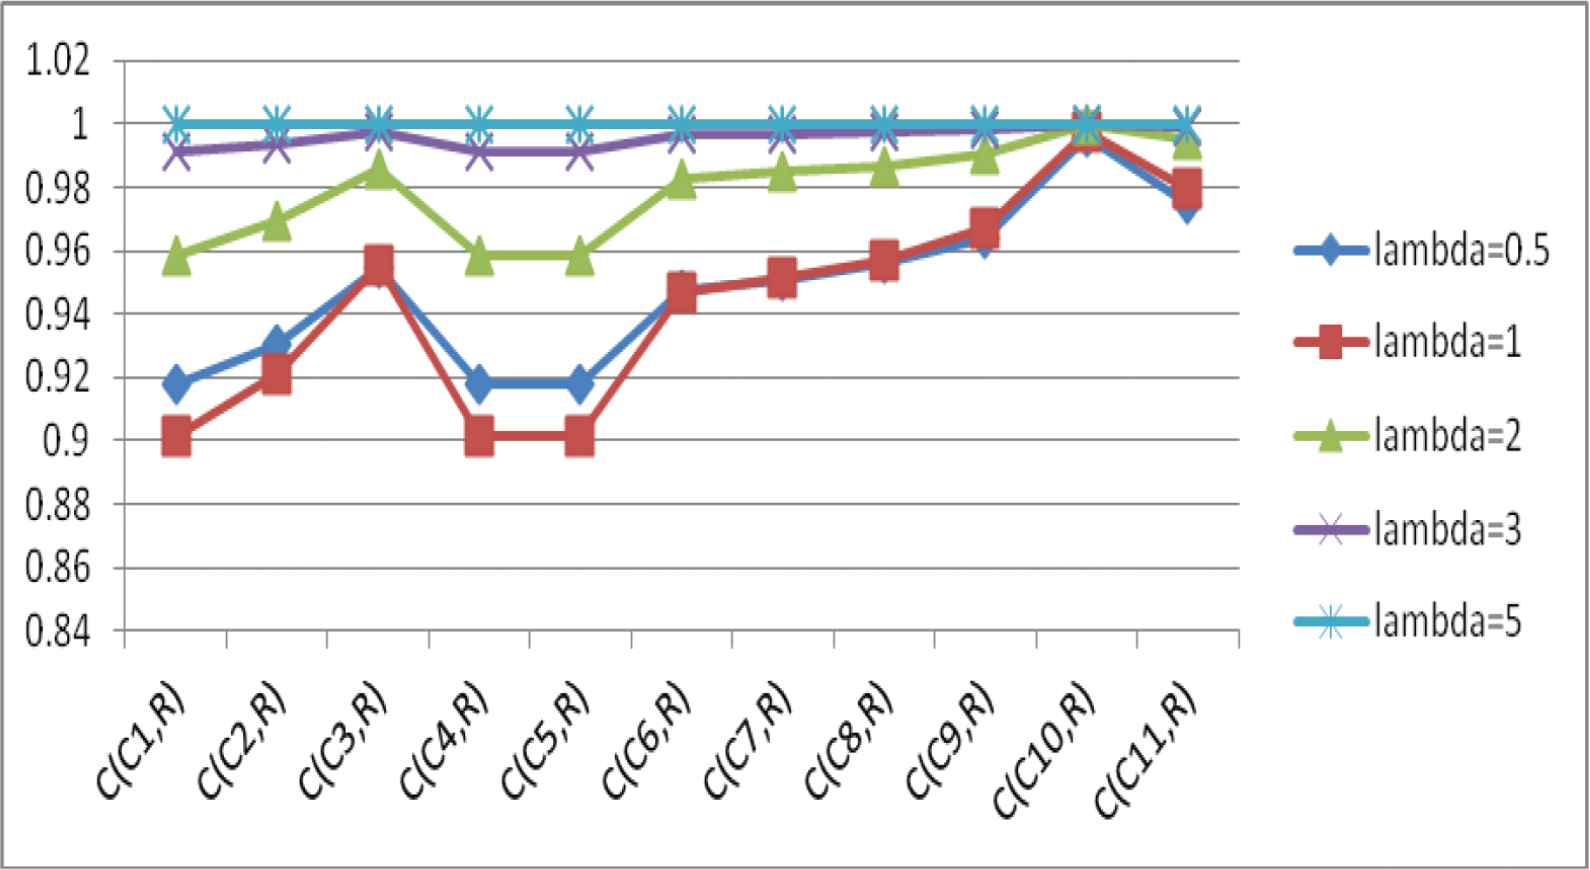
Correlation coefficients between the steady values and the final resulting value by hesitant fuzzy cognitive map (HFCM).
5.3. Comparative Analysis
To demonstrate the feasibility and effectiveness of the proposed method, a comparative analysis has been conducted in this section. Iakovidis and Papageorgiou [13] presented a model called IFCM-I, which extends the FCM by considering the expert's hesitancy in the determination of the causal relations between risk factors. Then, a novel FCM, called IFCM-II, is proposed to overcome the limitation of IFCM-I (Papageorgiou and Iakovidis [22]). Since the HFEs' envelopes are the intuitionistic fuzzy values (Torra [24]), and there has investigation similar to the proposed method, we have conducted a comparison analysis with the IFCM-II in this section, and the specific process is in the following:
Step 1'. It is processed in the same way as Step 1.
Step 2'. Based on the relationships between HFEs and the intuitionistic fuzzy values (Torra [24]), the hesitant fuzzy transition matrix
Step 3'. See Step 3.
Step 4'. Simulation scenario is designed. The initial state vector with 12 nodes is defined as below:
Here, 0.5 indicates that experts are irresolute, and 0 denotes that the risk is not activated. According to Equation (4) (Here,
| Nodes | Initial State | Steady State |
|||
|---|---|---|---|---|---|
| 0.5 | |||||
| 0.5 | |||||
| 0.5 | |||||
| 0.5 | |||||
| 0.5 | |||||
| 0.5 | |||||
| 0.5 | |||||
| 0.5 | |||||
| 0.5 | |||||
| 0.5 | |||||
| 0.5 | |||||
| 0 | |||||
Simulation results.
Step 5'. According to Xu [57], the correlation coefficients between the steady values of the output concepts and the final resulting value are calculated as follows:
Therefore,
By integrating the FCMs and HFSs, the proposed method is quite suitable for dealing with the hesitancy and ambiguity inherent in decision problems and does not have to transform HFEs into intuitionistic fuzzy values. Especially when we face the situation that the decision information takes the form of several different possible values, the proposed method shows its superiority in such decision problems with hesitant fuzzy information.
The HFCM presented in this paper is adopted to analyze the risk factors affecting electric power system. Actually, at first experts may be irresolute and could not determine whether or not the risk is activated. The hesitancy observed at the input originates from uncertainty of experts' judgments. The proposed method can represent the inherent hesitancy both at the input and output, while in Papageorgiou and Iakovidis's method, the inherent hesitancy at the input is ignored.
In addition, if we change the parameter value to
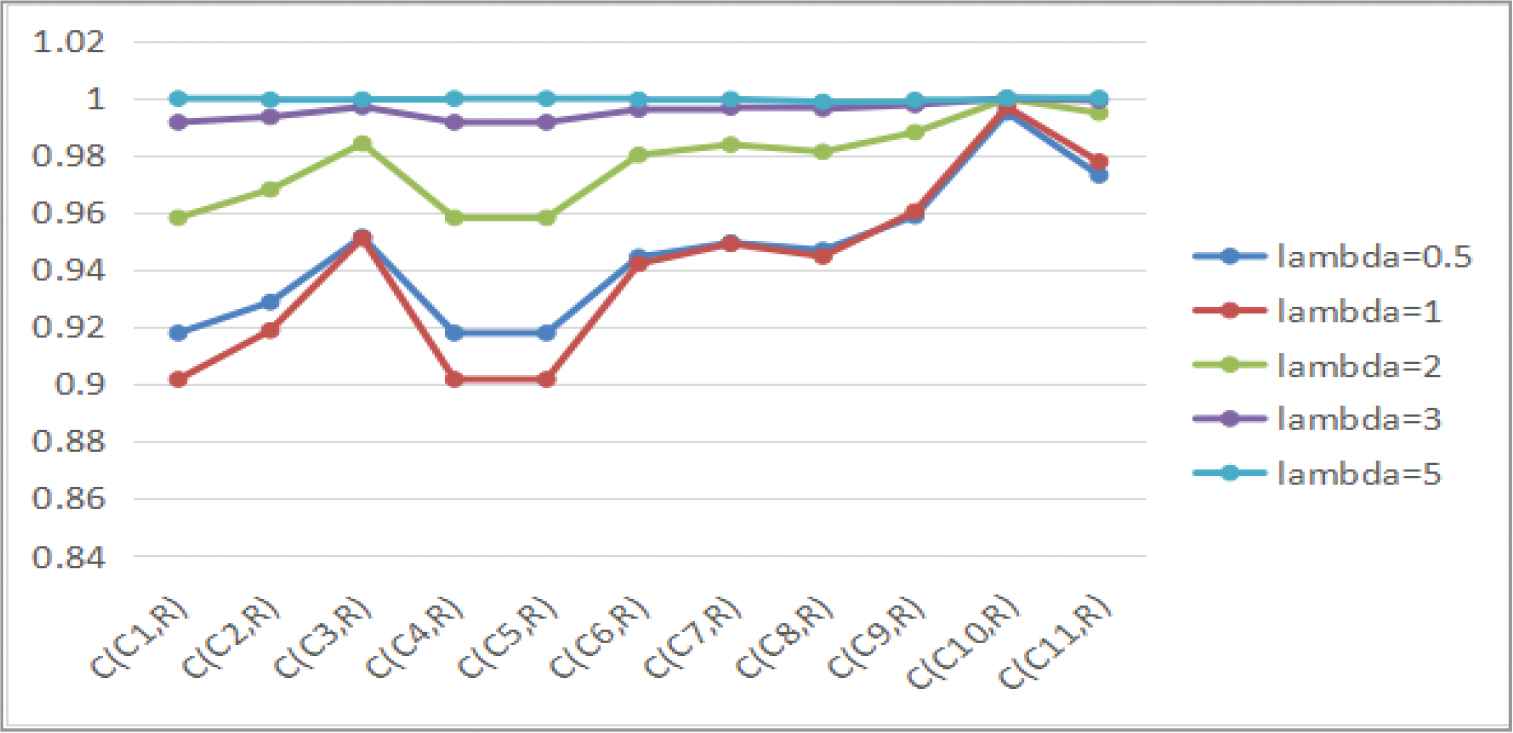
Correlation coefficients between the steady values and the final resulting value by intuitionistic fuzzy cognitive map (IFCM)-II.
5.4. Discussions and Implications
By reviewing the existing research on FCM method, several extensions of the method have been developed to deal with the uncertainty of complex systems (Iakovidis and Papageorgiou [13]; Papageorgiou and Iakovidis [22]; Çoban and Onar [23]; Salmeron [21]). However, the majority of these approaches neglect the hesitancy in the expression of the concept values and the influence between the concepts. As pointed by Papageorgiou and Iakovidis [22], in human cognitive tasks hesitancy may also be introduced in the determination of concept values, and it may also be propagated through the reasoning process to the final decision. As a more general and novel formulation of the FCM, the proposed method incorporates such a consideration into a concise cognitive map and naturally expresses the inherent hesitancy both at the input and the output. Comparisons of different FCM methods have been conducted, which are shown in Table 5.
| FCM | IFCM-I | IFCM-II | HFLCM | FGCM | The Proposed Method | |
|---|---|---|---|---|---|---|
| Hesitancy at the input | × | × | × | × | √ | √ |
| Hesitancy at the output | × | × | √ | × | √ | √ |
| Intrapersonal hesitancy | × | × | × | √ | × | √ |
| Interpersonal hesitancy | × | √ | √ | √ | √ | √ |
FCM, fuzzy cognitive map; FGCM, fuzzy grey cognitive map; IFCM, intuitionistic fuzzy cognitive map; HFLCM, hesitant fuzzy linguistic cognitive map.
Comparisons of different FCM methods.
Compared with the existing methods, the proposed method has the advantages as below.
As a generalization, the proposed method is able to represent more kinds of relationships than FCM. It can better model the uncertainty and expert(s) hesitancy related to the expression of the concept values and causal relationships between the concepts.
Unlike the IFCM-I and IFCM-II, the proposed method can represent the inherent hesitancy both at the input and output. The hesitancy observed at the input originates from uncertainty of expert(s) judgments. Then the hesitancy may be propagated through the reasoning process to the final decision.
Unlike the FGCM, the proposed method is capable of modeling the hesitancy both in one expert's judgments (intrapersonal hesitancy) and the judgments among experts (interpersonal hesitancy). It allows an easier representation of expert(s) judgments for the concept values and casual influences between the concepts, and can provide a better simulation of the inherent uncertainty and hesitancy.
The HFLCM, which integrates hesitant fuzzy linguistic term set and FCM, considers only the hesitancy in the expression of the influence between the concepts. The inherent hesitancy both at the input and output is neglected in the HFLCM. The comparative advantage of the proposed method over the HFLCM is that it is capable of tackling the inherent uncertainty in real problems through the hesitancy represented in experts' knowledge.
6. CONCLUSIONS
As a simulation mechanism, FCM is a powerful tool for knowledge representation. In this paper, a novel approach to FCM based on HFSs is put forward and applied to analyze the influence factors in sudden electric events. The proposed method requires expert(s) to deliver subjective estimates of relationships among factors, where substantial uncertainties are involved. Although several extensions of FCM were presented to deal with various sources of uncertainty, none of them can properly handle the uncertainty originating from human doubt. This is particularly critical when expert(s) will be invited to participate in the evaluation process that is typically the case in FCM. This issue is addressed in this paper through proposing a novel approach to FCM based on HFSs, which could provide an improved representation of uncertainty. As a more general formulation of the FCM, the proposed method can express the inherent hesitancy both at the input and the output. The novel approach has been verified through an example, which involves the casual relationships among the influence factors in sudden electric events.
The limitation of the proposed method is that it depends on expert(s) knowledge to construct the HFCMs, which is a hard and tedious task for expert(s) to predetermine the causal relationships among concepts. In future research, we will focus on this topic, and pay attention to the learning algorithms for the construction of HFCMs.
CONFLICTS OF INTEREST
The authors declare no conflicts of interest.
AUTHORS' CONTRIBUTIONS
Xiaodi Liu wrote the paper. Zengwen Wang designed the framework of this researach. Shitao Zhang and Jiashu Liu contributed to the results.
ACKNOWLEDGMENTS
This work was supported by the National Natural Science Foundation of China (Nos. 71601002 and 71704001), the Humanities and Social Sciences Foundation of Ministry of Education of China (Nos.16YJC630077 and 18YJC630249), the Foundation for Young Talents in College of Anhui Province (No.gxyqZD2018033), the major project of Humanities and Social Sciences of Ministry of Education of China (No.16JJD840008), the National Social Science Foundation of China (No.18BJY225), and Anhui Provincial Natural Science Foundation (No. 1708085MG168).
REFERENCES
Cite this article
TY  - JOUR
AU  - Xiaodi Liu
AU  - Zengwen Wang
AU  - Shitao Zhang
AU  - Jiashu Liu
PY  - 2019
DA  - 2019/08/08
TI  - A Novel Approach to Fuzzy Cognitive Map Based on Hesitant Fuzzy Sets for Modeling Risk Impact on Electric Power System
JO  - International Journal of Computational Intelligence Systems
SP  - 842
EP  - 854
VL  - 12
IS  - 2
SN  - 1875-6883
UR  - https://doi.org/10.2991/ijcis.d.190722.001
DO  - 10.2991/ijcis.d.190722.001
ID  - Liu2019
ER  -