
Asphalt Pavement Roughness Prediction Based on Gray GM(1,1|sin) Model
- DOI
- 10.2991/ijcis.d.190808.002How to use a DOI?
- Keywords
- Roughness; Prediction; Gray theory; Particle swarm optimization
- Abstract
Roughness is a comprehensive assessment indicator of pavement performance. Prediction of pavement roughness exhibits great difficulties by using traditional methods such as mechanistic-empirical method and regression method. Considering the fact that the value of international roughness index (IRI) varies in a fluctuant manner, in this paper, a new gray model based method is proposed to predict the roughness of pavement. The proposed method adopts GM(1,1|sin) model as the prediction model. In GM(1,1|sin) model, a sinusoidal term is added into GM(1,1) model, making it can fit fluctuant data more precisely than GM(1,1) model. A particle swarm optimization (PSO) algorithm is used to select the optimal parameter of GM(1,1|sin) model. Experimental results demonstrate its effectiveness of the proposed method. Furthermore, the proposed method only uses the history IRI data in prediction and leads to a large savings of collecting pavement condition data.
- Copyright
- © 2019 The Authors. Published by Atlantis Press SARL.
- Open Access
- This is an open access article distributed under the CC BY-NC 4.0 license (http://creativecommons.org/licenses/by-nc/4.0/).
1. INTRODUCTION
Pavement performance refers to the serviceability provided by pavement for driving under natural environment conditions. It includes the surface structure characteristics, smoothness, damage condition and structural bearing capacity of pavement. The structural characteristics of pavement surface affect the driving safety, which can be evaluated by measuring the friction coefficient between tire and pavement. Pavement smoothness and damage condition are directly related to the speed and comfort of driving, and are the main factors affecting the quality of road driving. Systematic and long-term observation of pavement performance and establishment of pavement performance evaluation system are important components of pavement management system (PMS).
Pavement performance prediction is a primary objective for PMS. Accurate prediction can help decision makers reasonably allocate substantial manpower and capital resource to maintain the pavement and thus prolong its serviceability. Performance indicators are used to evaluate pavement condition and serviceability. There are several indicators, such as the present serviceability index (PSI), pavement condition index (PCI) and international roughness indictor (IRI), to assess pavement performance. Particularly, IRI is a key measure of pavement performance, which is adopted in the Mechanistic-Empirical Pavement Design Guide (MEPDG). IRI takes into account not only both ride quality and comfort of the pavement, but also serving as an indicator of the presence of collective distresses [1]. Prediction of IRI had received much attention from researchers. Traditionally, multiple linear regression (MLR) was used to predict IRI [2,3]. The regression model took traffic, material, geometric and climatic condition as model variable. However, the pavement performance is affected by many factors and it is difficult to select reasonable model variables to build the regression model. Due to its powerful nonlinearity approximation ability, artificial neural network (ANN) was also adopted to predict pavement performance. In Ref. [4], Attoh-Okine proposed to use ANN to predict roughness progression in flexible pavement. Latter, Robert and Attoh-Okine performed a comparative analysis of two ANNs in the prediction of pavement performance [5]. In Ref. [6], Choi et al. adopted back-propagation neural network to predict pavement roughness using long-term pavement performance (LTPP) data. In Ref. [1], a hybrid gene expression programming neural network was used to predict pavement roughness. It was found that ANN can obtain better prediction performance than MLR. Prediction model based on ANNs can be considered as nonlinear version of MLR, it also needs to select approximated model variables or factors. Another method for pavement performance prediction is the Markov probability decision process [7]. This method regards the pavement performance as a stochastic variable. Many research results show that pavement roughness prediction involves complex relationship and it is not clear to us [8]. On the other hand, build linear or nonlinear regression model need to collect large number of data about pavement characteristics. The cost of gathering pavement characteristic is very high. Therefore, predicting pavement performance using a smallest set of actual measured characteristics can save large cost for agencies responsible for the pavements [5].
Gray theory (GT) is a mathematical tool dealing with uncertain system with partial known information. It is widely used in different prediction tasks. As stated before, what factors mostly related with the pavement performance is still not clear to us. It is possible to use GT to deal with the prediction of pavement performance. In Ref. [9], Li et al. studied the feasibility of using gray model to predict pavement smoothness. Jiang and Li used gray model to estimate IRI for the Indiana Department of Transportation (INDOT) [10]. In Ref. [8], Wang and Li proposed to use fuzzy and GT to predict pavement smoothness, in which the fuzzy linear regression was used to calculate the coefficients of gray model. However, the above GT based methods still use multiple variables to predict pavement roughness. They possesses the same problem associated with the previous methods.
In this paper, a new GT based method is proposed to predict the roughness of pavement. The proposed method only needs some initial IRI data and results in large savings in gathering pavement characteristics. Considering the fact that the actual IRI data is fluctuant, and is not strict increasing or decreasing, the gray GM(1,1|sin) model is adopted. To select the optimal parameters of GM(1,1|sin) model, the particle swarm optimization (PSO) algorithm is used. The rest of this paper is organized as follows: In section 1, the gray GM(1,1|sin) model is introduced.
2. GM(1,1|sin) MODEL
Let
The sequence
Sequence
Definition 1.
Equation
Theorem 1.
Let
Proof.
Substituting the data into equation
Writing the above equations into matrix form, one has
Let
Writing the above equations into matrix form, one can get
It can be verified that
Definition 2.
Let
Theorem 2.
Let
Proof.
The homogeneous equation of Eq. (10) is
Assuming the particular solution of Eq. (10) is
Substituting it into Eq. (10), one has
From Eq. (14), it follows that
Calculating the integral Eq. (15), one can get
When
This completes the proof.
From Theorem 2, we can get the time response sequence of gray GM(1,1|sin) model is
Also, one can get the predicted value of original sequence as
3. PARAMETER OPTIMIZATION OF GM(1,1|sin) MODEL
In GM(1,1|sin) model, the parameter
Since the MAPE is not a analytic function of parameter
PSO is a population based heuristic search algorithm, which was proposed by Kennedy and Eberhart in 1995 [11]. In PSO, each individual is called a particle, which represents a candidate solution of an optimization problem. In
4. THE PROCESS OF IRI PREDICTION USING GM(1,1|sin) MODEL
In this section, the detailed process of using GM(1,1|sin) model to predict IRI is summarized as follows:
Step 1 Preparing the original sequence of IRI
Step 2 Generating the first order AGO sequence
Step 3 Randomly initializing a set of candidates parameters for
Step 4 For each
Step 5 Updating the velocity and position for each particles.
Step 6 Updating the global and local best of the particle swarm.
Step 7 Repeat Steps 4 and 6 until the best
Step 8 Using the best
5. RESULTS
To demonstrate the effectiveness of the proposed method, a prediction experiment is conducted. The data of IRI is taken from Ref. [5], which comes from PMS of Kansas Department of Transportation (KDOT). In KDOT, roughness is used as a primary indicator of a pavement's distress state and performance level. The IRI data used in this paper is listed in Table 1.
| Number | 1 | 2 | 3 | 4 | 5 | 6 | 7 | 8 | 9 | 10 |
|---|---|---|---|---|---|---|---|---|---|---|
| IRI | 191 | 147 | 85 | 107 | 108 | 74 | 77 | 50 | 77 | 97 |
IRI, international roughness indictor.
The value of IRI.
In this paper, the GM(1,1), GM(1,1|sin) and fractional GM(1,1) [12] (FGM(1,1)) model are all implemented to predict IRI and their prediction results are compared each other. The fractional order
where
Table 2 lists the prediction results of the GM(1,1), FGM(1,1) and GM(1,1|sin) model. To see the prediction results more intuitively, Fig. 1 shows the true value, predicted value of GM(1,1) and GM(1,1|sin) model. The RMSE and MAPE are shown in Fig. 2. From Table 2, it can be seen that the prediction of GM(1,1|sin) model are more accurate than that of GM(1,1) and GM(1,1|sin) model. Although the MAPE of GM(1,1|sin) is slightly higher than FGM(1,1) model, the GM(1,1|sin) model can follow the fluctuant characteristics of original data, but the GM(1,1) and FGM(1,1) model can not. The reason behind this is that GM(1,1|sin) introduces a sinusoidal term, making it has fluctuant property.
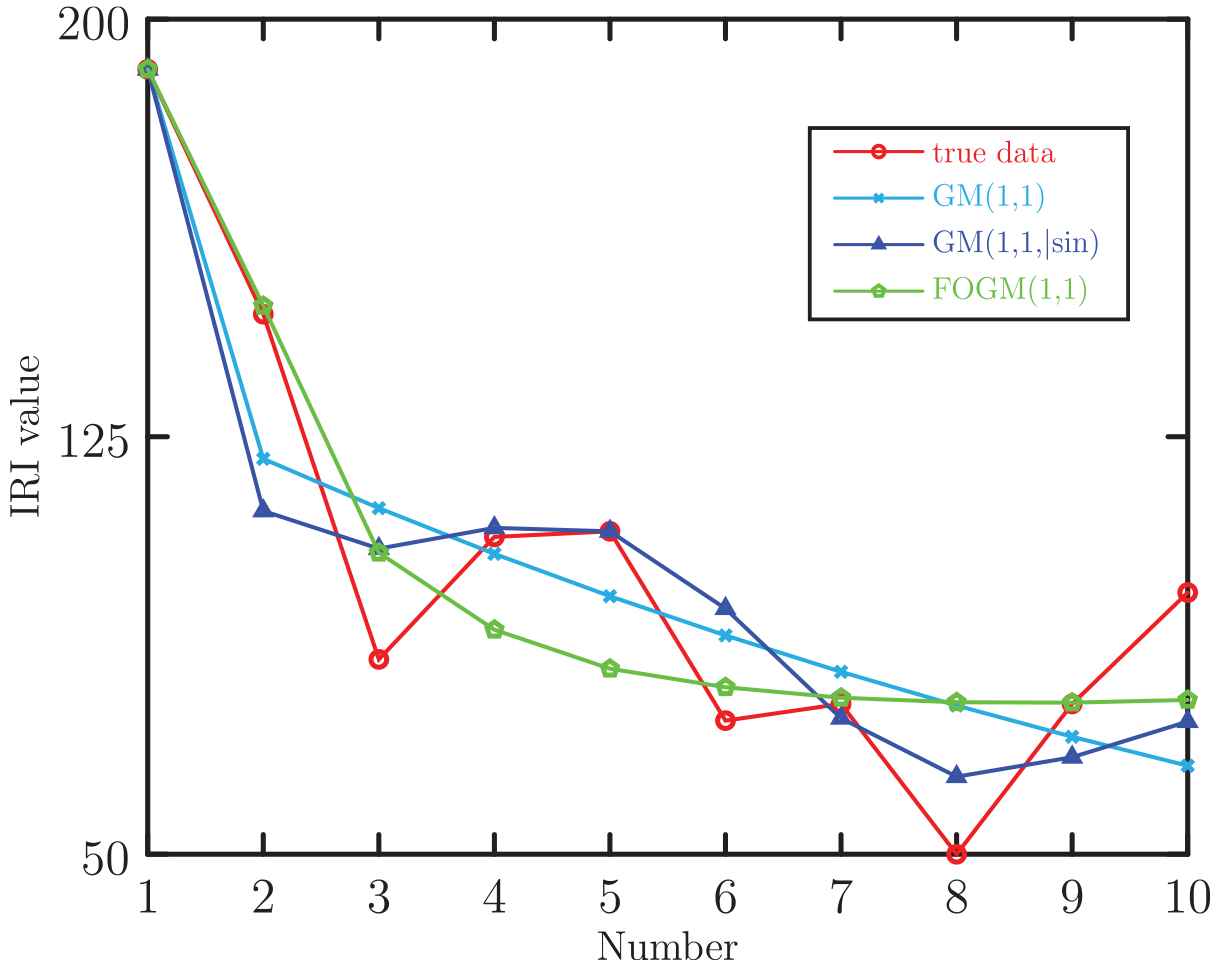
Comparison of predicted value of GM(1,1), FGM(1,1) and GM(1,1|sin) model.
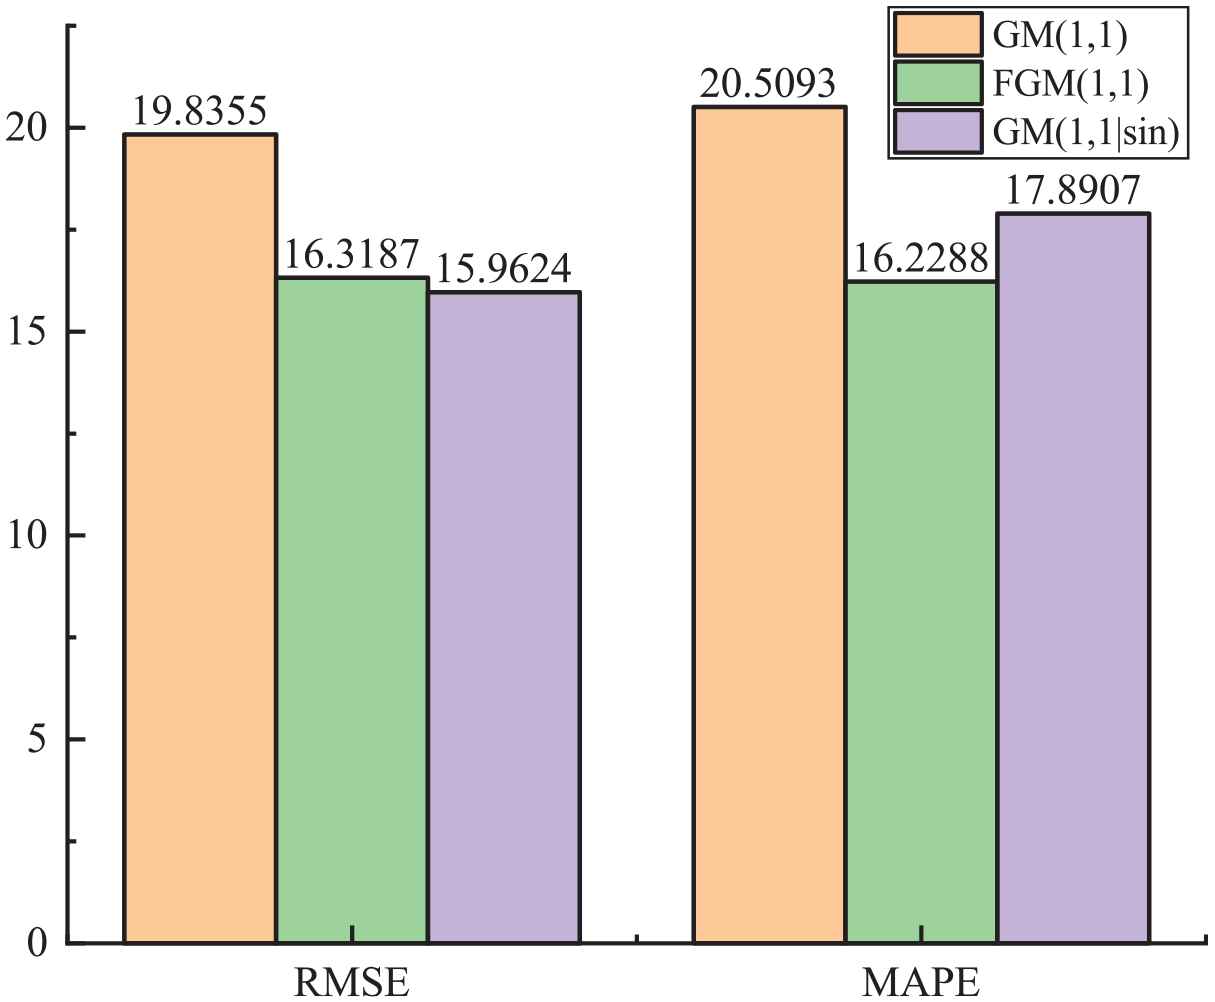
Comparison of root mean squared error (RMSE) and mean absolute percentage error (MAPE) of GM(1,1), FGM(1,1) and GM(1,1|sin) model.
| Number | Actual | GM(1,1) |
FGM(1,1) |
GM(1,1|sin) |
||||||
|---|---|---|---|---|---|---|---|---|---|---|
| Prediction | Error | APE | Prediction | Error | APE | Prediction | Error | APE | ||
| 1 | 191 | - | - | - | - | - | - | - | - | - |
| 2 | 147 | 121.0217 | 25.9783 | 17.6723 | 148.4951 | −1.4943 | 1.0165 | 111.6680 | 35.3320 | 24.0354 |
| 3 | 85 | 112.1668 | −27.1668 | 31.9609 | 104.1544 | −19.1548 | 22.5351 | 104.8937 | −19.8937 | 23.4044 |
| 4 | 107 | 103.9597 | 3.0403 | 2.8414 | 90.3297 | 16.6699 | 15.5793 | 108.6216 | −1.6216 | 1.5155 |
| 5 | 108 | 96.3532 | 11.6468 | 10.7841 | 83.607 | 24.3927 | 22.5858 | 108.0000 | 0.0000 | 0.0000 |
| 6 | 74 | 89.3032 | −15.3032 | 20.6800 | 80.0007 | −6.0009 | 8.1093 | 94.1164 | −20.1164 | 27.1844 |
| 7 | 77 | 82.7690 | −5.7690 | 7.4922 | 78.1114 | −1.1115 | 1.4435 | 74.4305 | 2.5695 | 3.3370 |
| 8 | 50 | 76.7130 | −26.7130 | 53.4259 | 7.012 | −27.3011 | 54.6022 | 63.9297 | −13.9297 | 27.8593 |
| 9 | 77 | 71.1000 | 5.9000 | 7.6623 | 77.235 | −0.2332 | 0.3028 | 67.4232 | 9.5768 | 12.4374 |
| 10 | 97 | 65.8978 | 31.1022 | 32.0642 | 77.7127 | 19.2877 | 19.8842 | 73.8282 | 23.1718 | 23.8884 |
APE, absolute percentage error.
Prediction results of GM(1,1), FGM(1,1) and GM(1,1|sin) model.
6. CONCLUSION
In this paper, a new method based on gray theory is proposed for the purpose of predicting pavement roughness. Considering the IRI data is fluctuant, a sinusoidal term is added into gray GM(1,1) model to enhance the prediction accuracy. The parameter of sinusoidal term is optimally determined using PSO algorithm. Results show that the proposed method improve the prediction accuracy.
CONFLICT OF INTEREST
The authors declare no conflict of interest.
AUTHORS' CONTRIBUTIONS
Chunming Ji conceives the idea of the paper, and Xiuli Zhang implements the algorithm. Xiuli Zhang wrote the original manuscript and Chunming Ji revised it.
ACKNOWLEDGMENTS
This work was financially supported by Hebei Science and Technology Project (No. 17273808D).
REFERENCES
Cite this article
TY  - JOUR
AU  - Xiuli Zhang
AU  - Chunming Ji
PY  - 2019
DA  - 2019/08/19
TI  - Asphalt Pavement Roughness Prediction Based on Gray GM(1,1|sin) Model
JO  - International Journal of Computational Intelligence Systems
SP  - 897
EP  - 902
VL  - 12
IS  - 2
SN  - 1875-6883
UR  - https://doi.org/10.2991/ijcis.d.190808.002
DO  - 10.2991/ijcis.d.190808.002
ID  - Zhang2019
ER  -