
Fuzzy-Based Language Grounding of Geographical References: From Writers to Readers
- DOI
- 10.2991/ijcis.d.190826.002How to use a DOI?
- Keywords
- Natural language generation; Linguistic descriptions of data; Data-to-text; Geo-referenced data; Language grounding; Fuzzy sets
- Abstract
We describe an applied methodology to build fuzzy models of geographical expressions, which are meant to be used for natural language generation purposes. Our approach encompasses a language grounding task within the development of an actual data-to-text system for the generation of textual descriptions of live weather data. For this, we gathered data from meteorologists through a survey and built consistent fuzzy models that aggregate the interpersonal variations found among the experts. A subset of the models was utilized in an illustrative use case, where we generated linguistic descriptions of weather maps for specific geographical expressions. These were used in a task-based evaluation to determine how well potential readers are able to identify the geographical expressions grounded on the models.
- Copyright
- © 2019 The Authors. Published by Atlantis Press SARL.
- Open Access
- This is an open access article distributed under the CC BY-NC 4.0 license (http://creativecommons.org/licenses/by-nc/4.0/).
1. INTRODUCTION
The abundance of data that surrounds our daily lives has allowed the emergence of several disciplines focused on researching how to better communicate to people the relevant information held within raw data. One such field is natural language generation (NLG), which studies the problem of how to generate texts from data that can be useful to human readers [1,2]. Within NLG, systems that generate texts from non-linguistic data are known as data-to-text (D2T). This kind of systems have become rather popular in recent times, thanks to their extensive application commercially [2,3] in a wide variety of domains.
Most D2T systems provide texts or reports that describe time series data, and plenty of examples can be found in the literature, e.g., in weather forecasting [4–6], health [7,8], or industry [9], among many others (see the following reviews for more references [1,10]). Alongside time series, geographical data has also been treated in D2T, although not as extensively as time series data [11].
An essential task in the conception of D2T systems is language grounding, i.e., determining how words and expressions are anchored in data [12,13]. There are several ways for solving this task, such as using heuristics or machine learning algorithms on an available parallel corpora of text and data [14] to create models of the expressions of interest anchored on the underlying data [15], getting experts to provide these mappings, or gathering data from writers or readers that can be used for the application of mapping algorithms.
For instance, D2T systems that generate texts from time series data generally include temporal expressions to refer to relevant events or patterns found in those data. Performing language grounding of temporal expressions in this kind of systems allows ensuring that generated texts include words whose meaning is aligned with what writers understand or what readers would expect [15,16]. Likewise, in systems that produce texts from geographical data, having a good geographical model is essential to generate expressions that refer properly to specific locations and regions of interest. Moreover, when outliers are present in any resource that is used to create the data-to-words mapping, building language models that remove inconsistencies can also be a challenging part of language grounding which can influence the development of a successful system [15].
Quite often, temporal and geographical expressions that need to be included in texts generated by D2T systems are vague, such as “in the evening” [4] or “southwestern areas” [17]. In situations where vagueness (and thus borderline cases and gradual concepts) is present, fuzzy sets have been proposed as a tool that allows to model linguistic expressions for NLG/D2T systems [2,18,19]. However, current existing D2T systems do not make use of such techniques, with the exception of GALiWeather [5], which provides a basic use of fuzzy sets to model temporal expressions and quantifiers.
In this context, this paper describes the methodology we have followed to perform a language grounding task of vague geographical expressions, which is part of a larger project to build a D2T system that generates descriptions of live weather data maps. Our approach involves a data gathering task, the creation of fuzzy models that aggregate the opinion of several experts, and a use case to check the appropriateness of the models for potential end-users of the D2T system to be developed.
It is common (and highly recommended) practice to perform language grounding based on expert data in order to build a D2T system. However, our proposal considers two additional, yet highly relevant, elements involved in human communication: vagueness in language and receivers of information, i.e., readers in our case. Thus, the novelty of our approach lies in the conjunction of these three elements: building i) vague geographical expressions based on ii) expert data, whose use is tested against iii) potential readers even before the actual D2T system has been developed.
The rest of this manuscript is organized as follows. Section 2 provides a critical review of the state of the art regarding the use of geographical references in D2T systems. Based on this review, Section 3 describes in detail the general context and the motivation of this work. Sections 4 and 5 explain the methodology we have followed to gather data from meteorologists and build fuzzy models for a set of geographical expressions. In Section 6 we present a practical use case and a task-based evaluation of these models with actual users. Finally, Section 7 provides some concluding remarks.
2. RELATED WORK
The field of NLG is extensive, with many different kinds of applications and systems for many different purposes like generation of textual reports from data, summarizing different textual sources, generating dialogue, narratives, or even poetry [1]. In our case, we are focusing on a very specific topic, D2T systems whose input data are geographically characterized and whose generated texts include geographical expressions that refer to the occurrence of certain events found in the data (e.g., “rain in Northern Spain” or “strong winds in Northeastern Scotland”).
Although this kind of references were introduced decades ago by the system FoG [6], RoadSafe can be considered the most recent and representative example of this kind of systems [20,21]. This system used weather forecast data to generate textual forecasts for road maintenance purposes. These reports included temporal and geographical expressions that helped identify where and when certain relevant phenomena would take place, with the purpose of helping maintenance teams to keep the affected roads in a good condition (see examples of such expressions in Figure 1). Thus, developing RoadSafe required an extensive study on how to generate good geographical expressions that referred properly to the geography underlying the relevant information extracted from the input data.
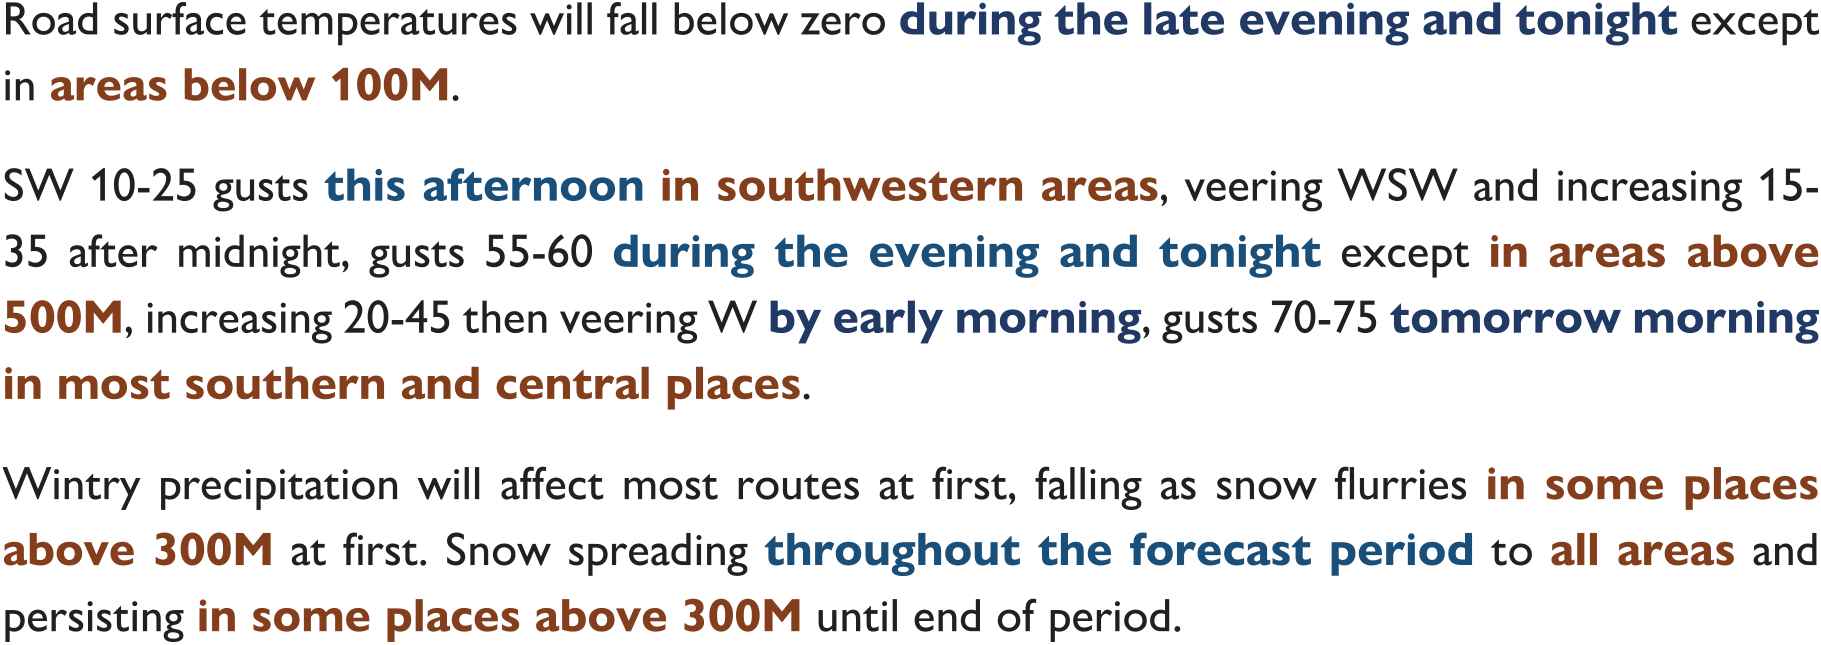
Examples of texts generated by RoadSafe [17].
Concretely, RoadSafe's approach to generating geographical referring expressions is based on standard techniques from geographic information systems (GIS), that divide the underlying geography of the events using different spatial schemas, or reference frames [22], which in turn are composed of non-overlapping partitions (known as descriptors). For instance, the reference frame Direction is composed of the descriptors “northeast,” “southwest,” etc., and the frame Coastal proximity is composed of the descriptors “coast” and “inland.”
Once the numeric limits of each descriptor are defined for each frame using plate carrée coordinates (latitude and longitude), each data point can be characterized by a set of descriptors (e.g., “southwest” and “coast”). Then, an algorithm that generates geographical referring expressions selects the best descriptor set that describes the area formed by the subset of points that represent the event.
In more recent work, the geographical model used by RoadSafe was extended to include named spatial references, which, according to an study of different corpus collections, are the ones that truly predominate [11]. Moreover, the previous reference proposed a geographical referring expression generation algorithm that integrates the “name” reference frame with the rest of RoadSafe's frames. For this, the proposal in [23] addresses the differences between absolute and relative references and a model based on mereology is proposed, where named descriptors are combined with descriptors from other reference frames (e.g., “southwestern Moray”).
The described approaches provide good models to generate proper geographical referring expressions based on a set of reference frames. However, in all cases the underlying models were developed based on a crisp partitioning of the geography of interest. Establishing exact limits between descriptors can be considered a non-intuitive assumption. For instance, according to the previous approaches, if a village is located in the border between two descriptors, depending on the spatial granularity of the data, it can be possible to assign opposing descriptors (e.g. “coast” and “inland”) to a pair of almost overlapping points. Thus, if we consider the vagueness inherent to even the simplest geographical references, such as “north,” we can not set borders of geographical references with precision [17].
Under this light, the limitations that characterize the geographical models used in previous D2T systems are an important incentive for searching other approaches that model imprecision or uncertainty when managing vague geographical references. In fact, the problem of vagueness treatment in geographical references is not limited to D2T systems, and a rather extensive discussion of this problem has existed in the GIS field since long ago [24]. In this sense, fuzzy sets theory has been applied in many cases to address vagueness in geographical concepts and spatial relations, e.g., [25–27].
Likewise, as we mentioned in Section 1, fuzzy sets have also been proposed in a more general way to be used in D2T systems to model vague terms [2,18,19]. To our knowledge, as of today the only D2T system which uses this kind of techniques and has been deployed in a real environment is GALiWeather [5]. There exist, however, an important number of use cases that apply fuzzy sets to extract linguistic descriptions of data, which in occasions are realized through template-based text generation methods [2,10].
3. MOTIVATION
Given the limitations in terms of vagueness modeling that characterize previous D2T systems that generate texts from geo-referenced data, the main motivation of this work is to improve the modeling of vague geographical references for NLG purposes. Our objective is to establish a methodology to create models of vague geographical geographical references and algorithms of geographical referring expressions based on those models, through the use of fuzzy sets.
Since D2T is an eminently applied field, where advances at a research level are often related to the development of actual systems, in our case the methodology we propose is encompassed by the development of a D2T system to generate textual descriptions of the meteorological state in a map, using data provided by MeteoGalicia [28]. The generated descriptions will include geographical referring expressions that will allow to identify relevant meteorological phenomena in maps, such as temperature, wind, and sky state.
Within the development of the aforementioned D2T system, this paper describes the language modeling task of the geographical expressions of interest, which will be used in the text generation process. Moreover, the methodology here described is based on the ideas introduced in [29] and [30], which will allow to consolidate new ways of applying fuzzy sets theory to D2T in a practical way.
4. GATHERING DATA FROM EXPERTS
While it is common to perform language grounding from a parallel set of text and data, and analyze the meaning of words and expressions to be modeled, in our case this kind of resource was not available. On the one hand, we did not have access to an extensive data set (e.g., texts of weather forecasts and prediction data) on which to perform such analysis. On the other hand, our plan is to build a new D2T system to provide textual descriptions of live weather data. Thus, the approach we followed consisted in interacting directly with the experts that manually produce written information about weather.
4.1. The Survey
Given that our aim is to model geographical expressions, we asked the head of the forecasting department to provide us with a list of the most frequently used geographical references for weather forecasts. Based on this list, we prepared a survey similar to the one described in [30], which was forwarded among the experts within the weather agency. In this survey, subjects were asked to draw on a map of the region of Galicia (displayed under a Mercator projection) a polygon representing a given geographical reference (see Figure 2).
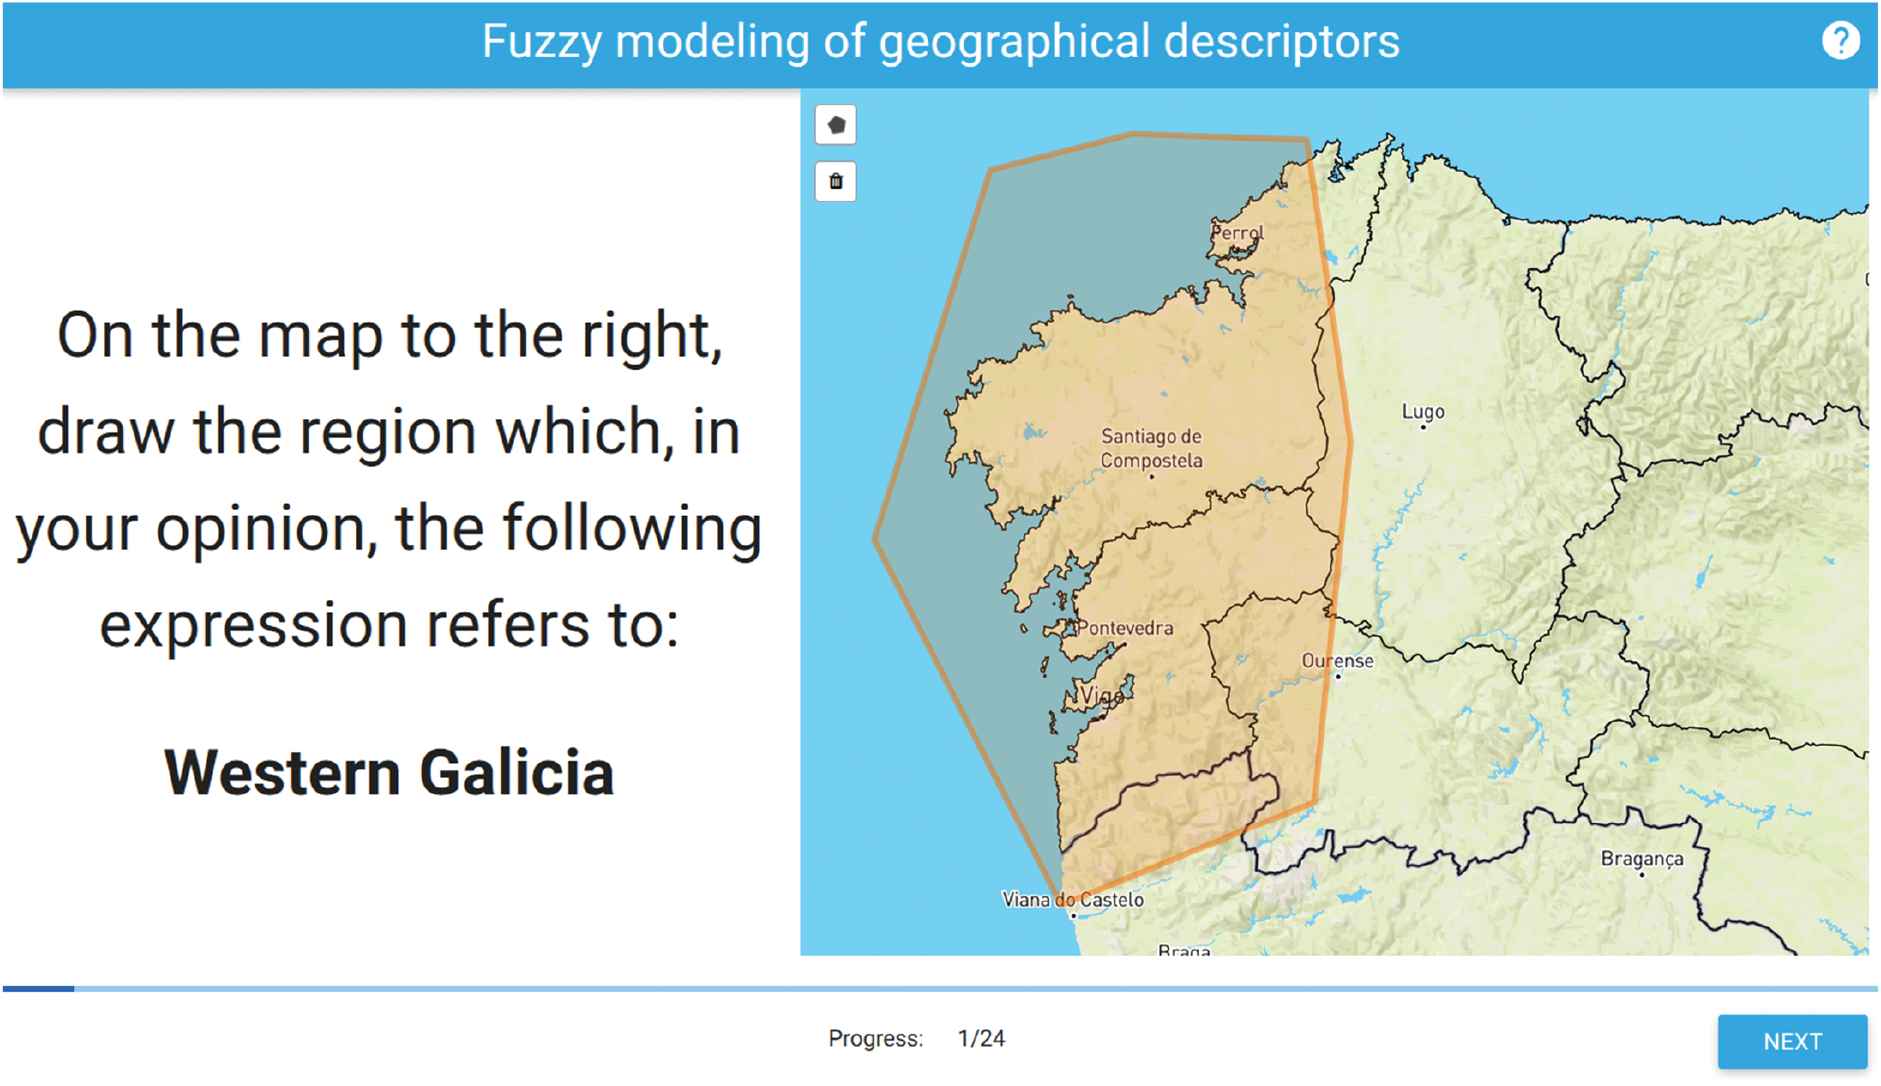
Screenshot of the survey that the meteorologists completed (translated from Spanish).
Subjects were provided with a list of 24 descriptors, which appeared in random order. In this list, 20 out of the 24 descriptors are commonly used in the writing of weather forecasts by experts and include cardinal directions, proper names, and other kinds of references such as mountainous areas, parts of provinces, etc. (see Table 1 for a complete taxonomy of the descriptors). The remaining four expressions were added to study intersecting combinations of cardinal directions (e.g., exploring ways of combining “north” and “west” for obtaining a model that is similar to “northwest”), and are out of the scope of this paper, since for our current purpose we are only interested in descriptors that are actually used by meteorologists when they write forecasts.
| Category | Spanish | English Translation |
|---|---|---|
| Cardinal Directions | Norte de Galicia, Sur de Galicia, Oeste de Galicia, Este de Galicia, Tercio norte, Extremo norte, Noroeste de Galicia, Noreste de Galicia, Suroeste de Galicia, Sureste de Galicia | Northern Galicia, Southern Galicia, Western Galicia, Eastern Galicia, Northern third, Extreme North, Northwestern Galicia, Northeastern Galicia, Southwestern Galicia, Southeastern Galicia |
| Inland/Coastal | Interior de Galicia | Inland Galicia |
| Named | Rías Baixas, Comarcas atlánticas | Rías Baixas, Atlantic Regions |
| Direction + Name | Oeste de A Coruña, Oeste de Ourense, Sur de Ourense, Sur de Lugo | Western A Coruña, Western Ourense, Southern Ourense, Southern Lugo |
| Inland/Coastal + Name | Litoral Atlántico, Litoral Cantábrico, Litoral norte, Interior de Coruña, Interior de Pontevedra | Atlantic Coast, Cantabrian Coast, Northern Coast, Inland A Coruña, Inland Pontevedra |
| Mountain Area + Name | Áreas de montaña de Lugo, Áreas de montaña de Ourense | Mountainous Areas in Lugo, Mountainous Areas in Ourense |
List of geographical descriptors in the survey.
4.2. Results and Qualitative Data Analysis
The survey was completed by eight experts,1 resulting in a total of 192 drawings (160 without the non-considered descriptors). At a general level, we had hypothesized that experts would be rather consistent, given their professional training. We also expected some variation among the different answers and the reduced number of meteorologists participating in the survey. We have observed that this is clearly the case; the polygons drawn by the experts are rather concentrated and therefore there is a high agreement among them.
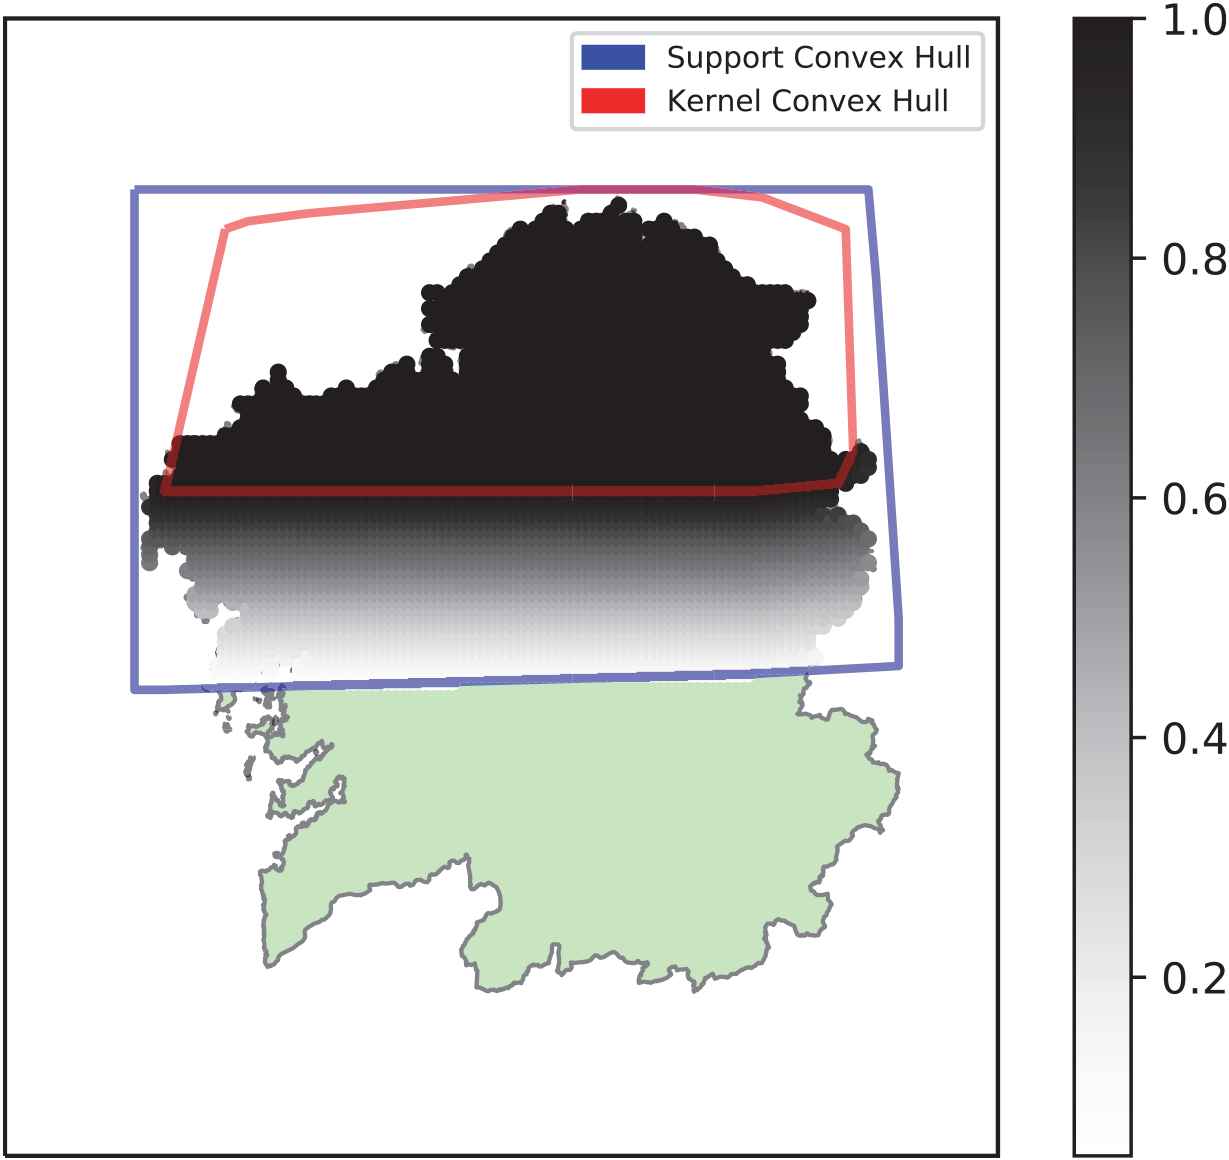
For instance, Figure 3 shows a representation of the answers given by the meteorologists for the cardinal direction “Eastern Galicia” and a contour map that illustrates the percentage of overlapping answers. Likewise, Figure 4 shows the same representations of the answers by experts for a different expression, “Atlantic regions.”
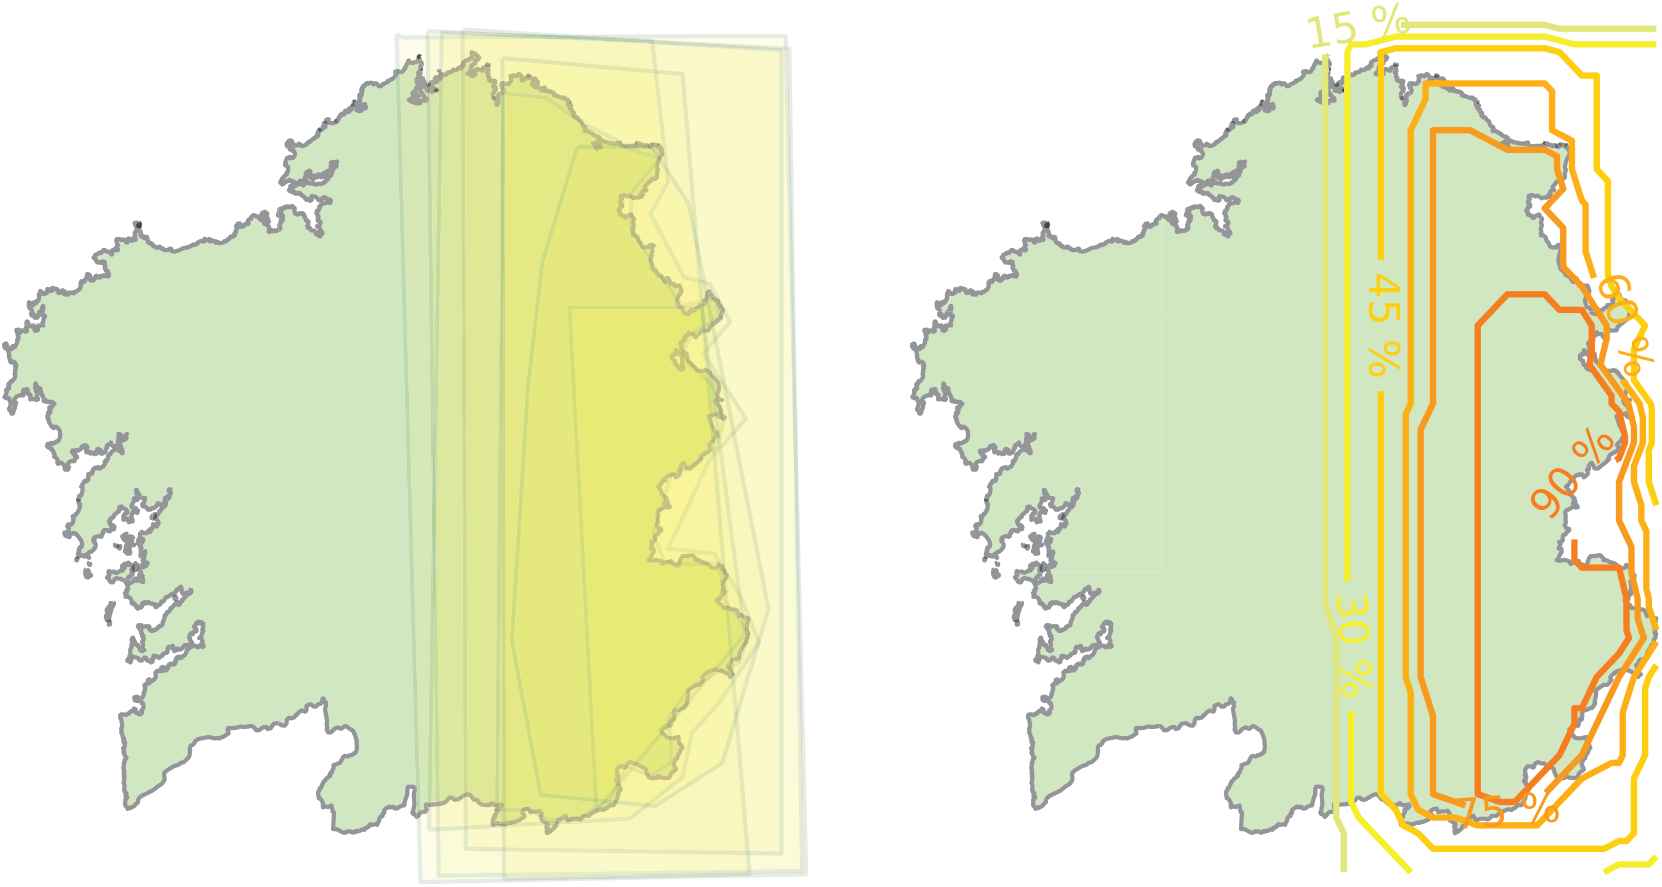
Representation of polygon drawings by experts and associated contour plot showing the percentage of overlapping answers for “Eastern Galicia.”
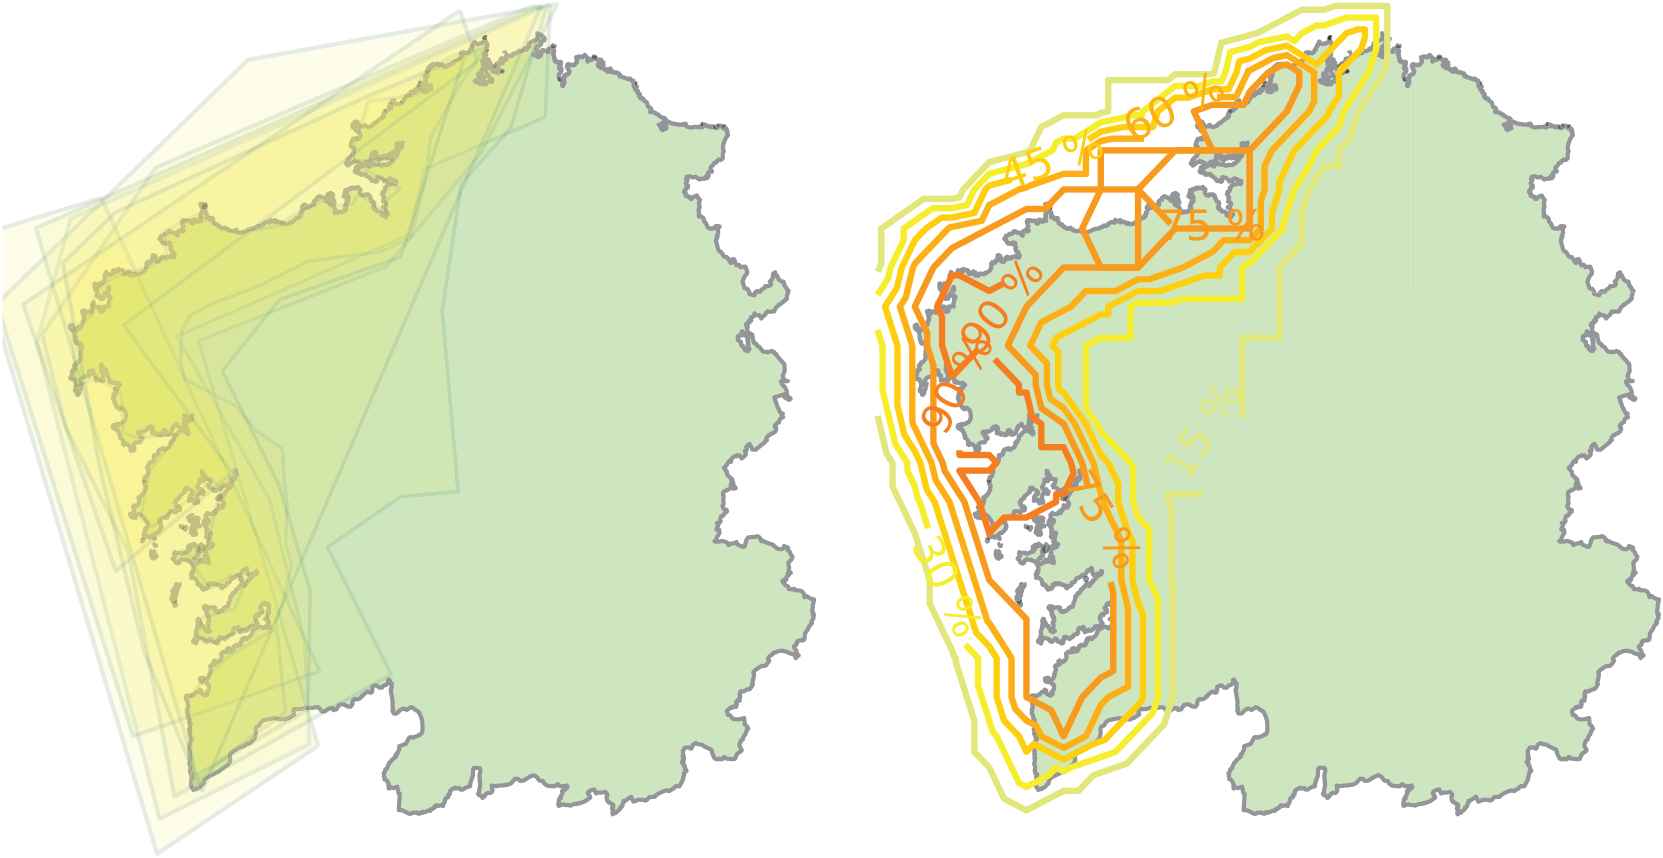
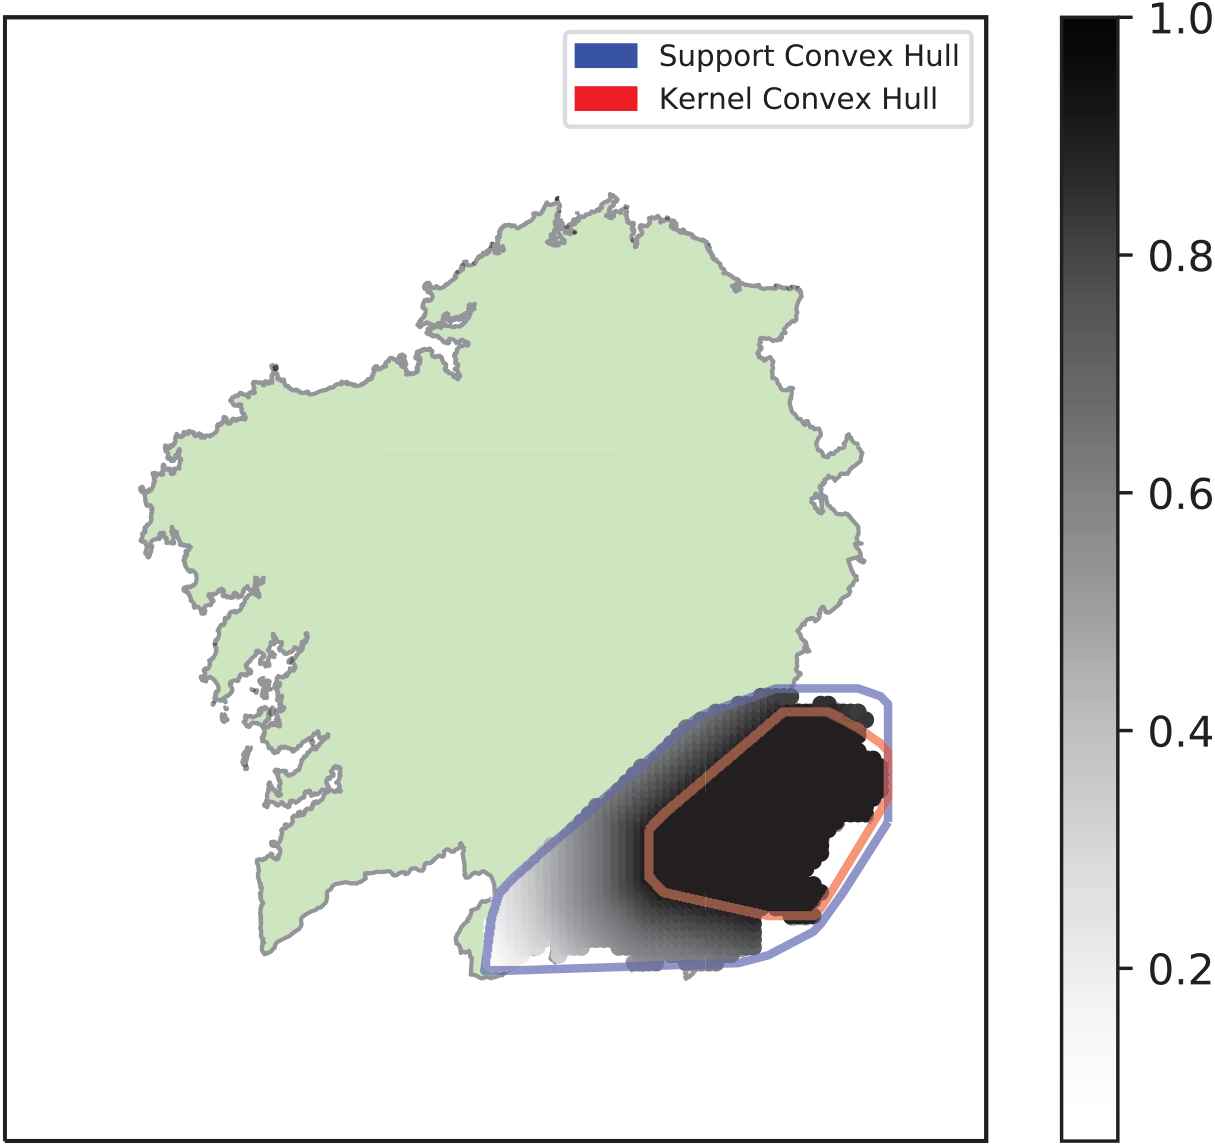
Representation of polygon drawings by experts and associated contour plot showing the percentage of overlapping answers for “Atlantic regions.”
With the exception of cardinal directions, most of the descriptors in Table 1 focus on very specific areas, such as those categorized as “Mixed.” Some exceptions to this rule are the “Inland Galicia” descriptor, or the mixed coastal + name descriptors like “Atlantic Coast.” We have also found that, in a few cases, descriptors are almost equivalent to others. This occurs to “Atlantic Coast” and “Atlantic Regions,” but also to “Northern Galicia” and “Northern Third,” which are very similar in shape and size.
5. BUILDING FUZZY GEOGRAPHICAL DESCRIPTORS
In Figures 3 and 4, the contour plots could be taken as the basis for the semantics of their corresponding expressions, with a core region that is accepted by the majority, and a gradual decay as one moves to the outer periphery of the outlined regions. Thus, in our case, fuzziness stems from the interpersonal differences among the meteorologists.
Following this notion, we have created fuzzy models that aggregate the opinions of the experts for each descriptor. The method we used for this modeling task is an improvement on the heuristic algorithm described in [30], which produced raw models based on point sampling and polygon intersection counting, without any enforced conditions. Our algorithm is preceded by a simple filtering of the drawings.
5.1. Filtering Outliers
As we discussed above, the drawings made by the meteorologists are very consistent visually, but in some cases we observed slight inconsistencies. In order to maintain the high consistency that is found in the answers for most descriptors, we applied a simple filter to the polygon drawings, which consisted in discarding answers out of the [mean
5.2. Characterization of a Fuzzy Geographical Descriptor
Using the filtered data, we aim to build fuzzy geographical descriptors which are simple and consistent.
Definition 1.
Fuzzy geographical descriptor,
Formally, we define a fuzzy geographical descriptor
Based on
Thus,
The previous conditions ensure that the fuzzy models are consistent, by avoiding the possibility of achieving disjoint
5.3. Building Descriptors from Data
A fuzzy geographical descriptor
Each
The first task in order to model a given
As it can be seen in the algorithm given below, in order to compute
Require:
Ensure:
1:
2: for all
3:
4: for all
5: if
6:
7: end if
8: end for
9:
10:
11: end for
12:
13:
14:
15:
16:
17:
18:
We chose to determine
Instead of just considering
5.4. Evaluating a Fuzzy Geographical Descriptor
Based on the three elements returned by the Algorithm described in the Section 5.3, the function
The membership function
5.5. Examples
In order to illustrate the results of the modeling algorithm and explain the result of the modeling decisions that have been included in the Algorithm described in the Section 5.3 and in the definition of
The first descriptor, shown in Figure 5, models the expression “Northern Galicia.” The kernel is slightly thicker toward the easternmost part of the region map, and does not seem to depend on the coast distance, but simply on latitude values. As a whole, the model can be considered straightforwardly regular, for both
Visualization of the fuzzy geographical descriptor “Northern Galicia.”
Other descriptors adopt different shapes, where
Visualization of the fuzzy geographical descriptor “Montainous Areas in Ourense.”
It must be noted that the models shown in Figures 5 and 6 were built using
6. USE CASE AND EVALUATION
As we explained in Section 3, the models here described are meant to be used to feed a geographical referring expression generation algorithm, as part of a D2T system to describe live weather data. Within this context, as a use case that shows the usefulness of the built models, we generated short textual weather descriptions for specific geographical descriptors. These descriptions were built based on the use of fuzzy linguistic descriptions of data [2,10,18] and the same kind of input data that will feed the D2T system.
Particularly, the input data in our setting is a collection composed of live observations for several weather variables (e.g., temperature, wind strength and direction, sky state), where each observation contains data for 314 municipalities (see Figure 7 for a visual example). The descriptions we generate focus on quantifying the sky state variable with respect to a geographical descriptor.
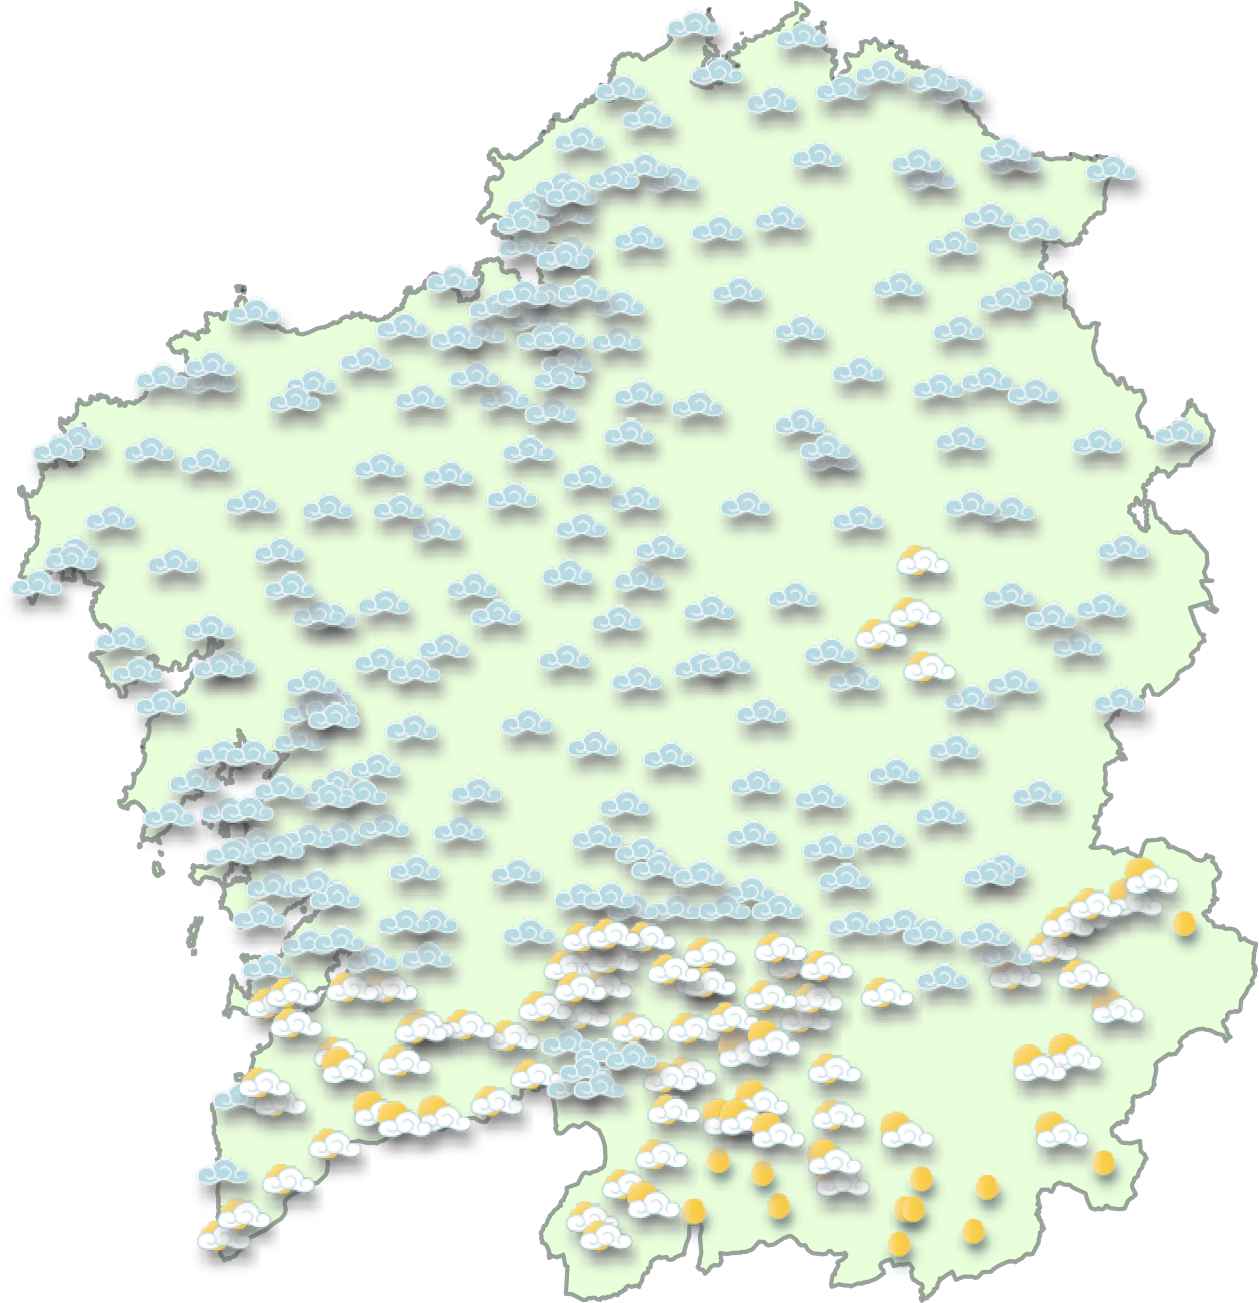
Live weather snapshot (Galicia, 2017-06-02, 12:32 pm).
Then, using a set of representative cases, we performed a task-based user evaluation. Potential end-users of the D2T system were presented with maps similar to the one shown in Figure 7 and associated textual descriptions without explicit geographical references. With these materials, they had to choose the geographical descriptor that best suited both the description and the weather map. This allowed us to verify the appropriateness of a representative set of the modeled descriptors.
6.1. Generating Geo-Referenced Linguistic Descriptions
From a D2T perspective, fuzzy linguistic descriptions (or summaries) of data can be used as a tool for performing content determination tasks [2,5,10]. The content extracted from the raw data adopts the structure of protoforms composed of linguistic terms (modeled by means of fuzzy sets) [18], that still need to be properly verbalized.
In our particular case, we generated simple descriptions based on the use of type-II fuzzy quantified sentences [31], that relate two different variables (e.g., “most wet days were cold) [10]. The specific kind of protoform we have used adopts the following structure:
In this protoform,
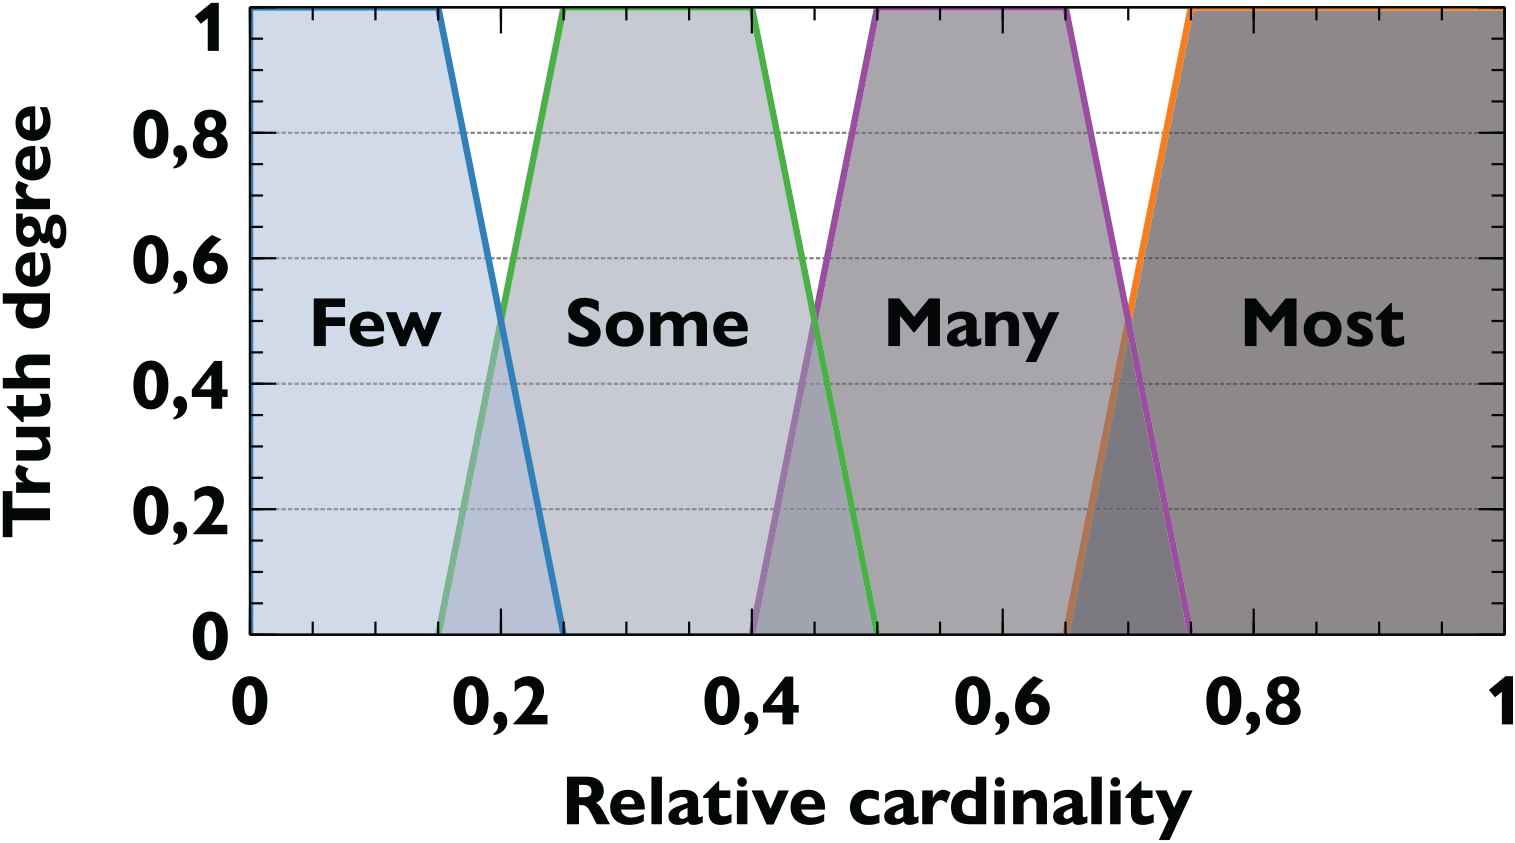
Partition of fuzzy quantifiers used to compute the geo-referenced linguistic descriptions.
In order to calculate the truth degree of sentences that follow the protoform defined in Eq. (9), a fuzzy quantification model must be applied [31]. We opted to use the quantification model
Under the
For instance, in Figure 9 a description is given for the fuzzy descriptor “Extreme North” based on the weather map. The description is composed of several quantified sentences, which are characterized and ordered by the specificity of their quantifier (less specific ones are considered better in this case), their truth degree, and their relative cardinality. The sentences are individually realized using a template, which holds the textual structure of the protoforms, the actual linguistic expressions of the quantifiers and the sky state symbols.
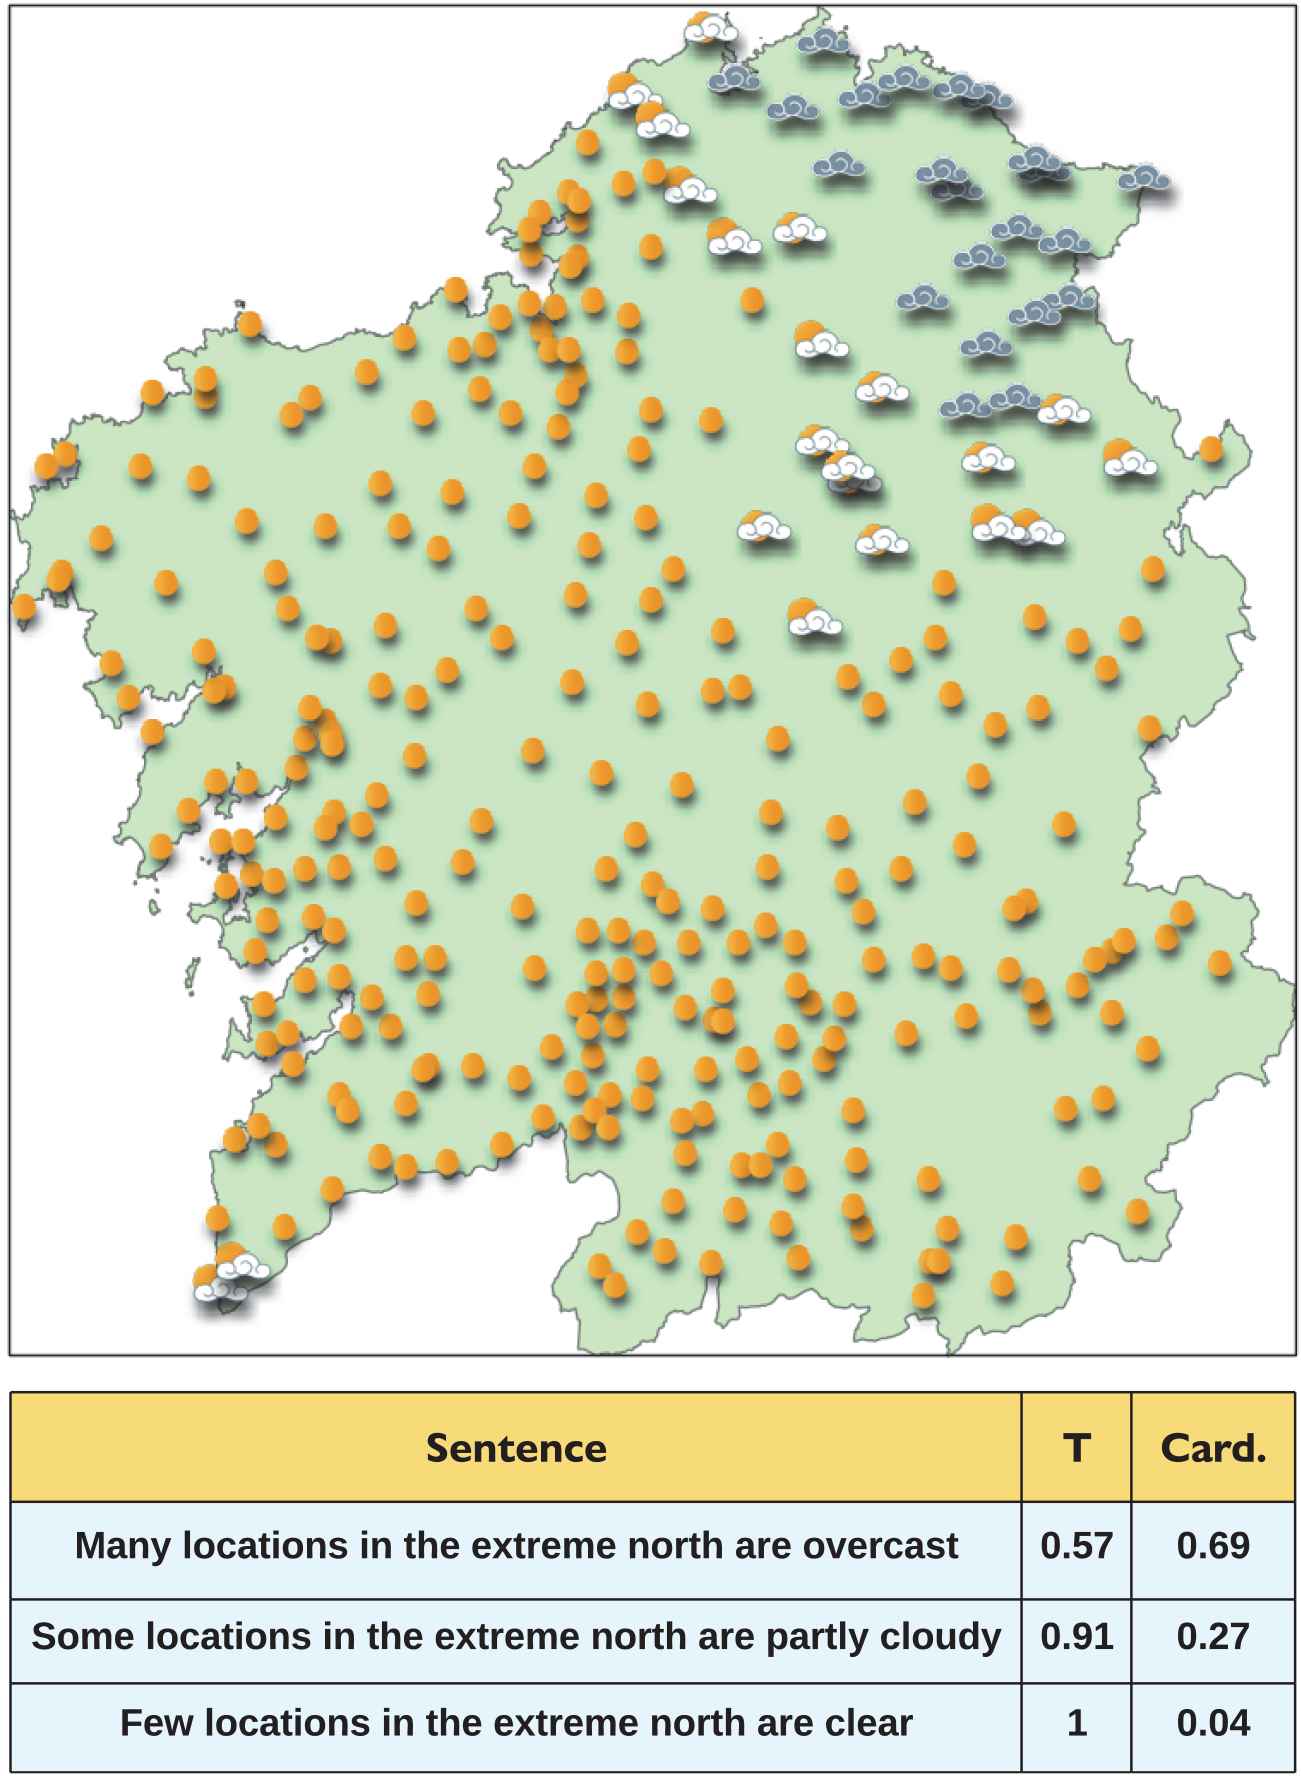
Map example and associated linguistic description composed of several quantified sentences for the fuzzy descriptor “Extreme North” filtered and ordered by their truth degree (T) and cardinality (Card).
6.2. A Task-Based Evaluation of the Fuzzy Descriptors
We evaluated the appropriateness of the fuzzy geographical descriptors by performing a task-based evaluation with potential users of the D2T system we are developing. The main purpose of this evaluation was to check how well subjects were able to relate linguistic descriptions to the actual geographical references modeled by the descriptors, allowing us to see how they performed in clear and more ambiguous cases. Furthermore, this evaluation also provided a way to indirectly assess how well the geographical understanding of potential readers matches the models created from the experts' opinions.
6.2.1. Materials
We selected a list of 5 geographical descriptors, making sure that they covered most of the whole region of interest and were representative of the different kinds of categories shown in Table 1. Specifically, we chose two cardinal directions (“Southern and Eastern Galicia”), one proper name (“Rías Baixas”), and two mixed descriptors (“Western A Coruña” and “Cantabrian Coast”). We also ensured that different degrees of overlapping existed among the descriptors with respect to the support of their fuzzy models, from none (e.g., between “Rías Baixas” and “Eastern Galicia”) to a full containment (e.g. “Cantabrian Coast”
For each descriptor we generated linguistic descriptions from a data set composed of more than 300 real live weather snapshots, which were collected between June and August 2017. We also generated maps for each snapshot, similar to the ones shown in Figures 7 and 9. The linguistic descriptions were generated following the approach described in Section 6.1, with some additional restrictions:
Quantified sentences (
Within a linguistic description, sentences were ranked by the specificity of their quantifier (as described in Section 6.1), and then by
Geographical references were replaced with generic expressions when we textually realized the quantified sentences (e.g., in Figure 9,
Based on this collection of parallel maps and linguistic descriptions, for each of the 5 descriptors we carefully selected one case where the matching between the description and the geographical descriptor could be clearly done according to the weather data shown on the map, and another case where this matching was ambiguous. For instance, in the latter case we looked for situations where the linguistic description could apply to other descriptors (e.g., with slight differences with respect to the quantifiers or the weather symbols that were mentioned). Thus, after this selection, the final set of evaluation cases for the survey comprised 10 maps and their associated descriptions (5 clear and 5 ambiguous cases).
6.2.2. Subjects
Our target was the group of potential users of the texts of the D2T system to be developed, namely Galician adults or anyone familiar with the geography of Galicia. These were recruited through university mailing lists and through family and relatives, ensuring that people from different gender, education backgrounds, and age ranges participated.
6.2.3. Procedure
Using the collection of weather cases and associated descriptions for specific descriptors, we created a web survey under a within-subjects design, where participants were given in random order a weather map and a linguistic description, and were asked to select in a drop-down list the geographical descriptor that best suited the provided description, in accordance to the weather data shown on the map (see Figure 10). Given that the participants were native Spanish speakers, both the linguistic descriptions and the survey were created in Spanish.
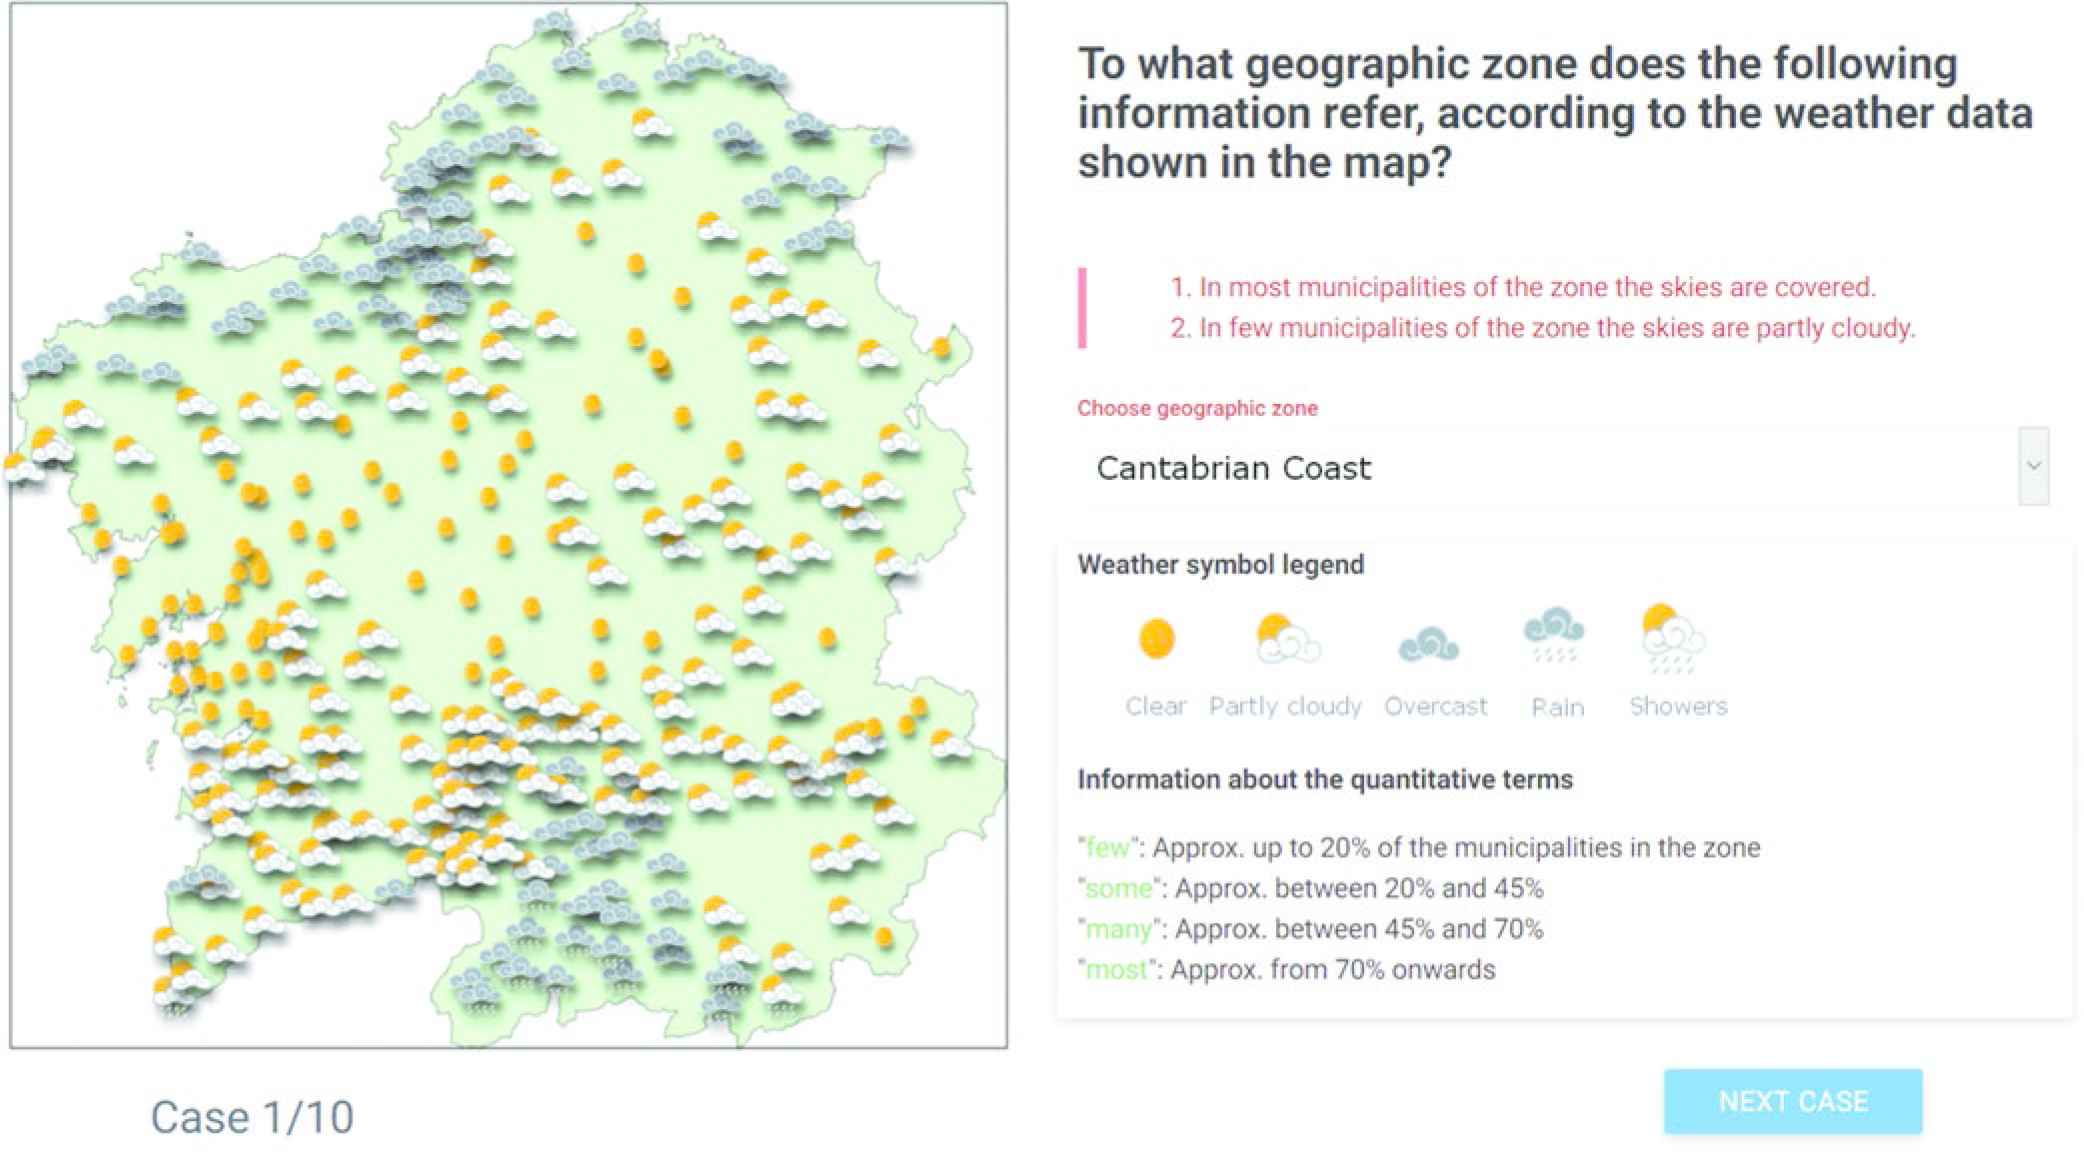
Screenshot of the web survey (translated from Spanish).
As Figure 10 shows as well, we provided information about the weather symbols that appeared on the map, and a simplified textual definition of the quantifiers that were included in the sentences of the description, so that participants could focus just on the task of identifying the geographical descriptor the description referred to.
At the end of the survey, participants were asked to provide information about their gender, level of education, and age range. They could also write free-text comments about any aspect of the survey. Then, they were shown the percentage of cases they had guessed correctly, categorized into clear and ambiguous cases (they were not aware of this distinction).
6.2.4. Rationale, threats, and hypotheses
At first we had considered preparing a survey where we would provide maps and descriptions that explicitly referred to the geographical descriptors they were based on, asking users to rate how accurate the description reflected what was being showed on the map. However, this would have resulted in an important bias, as most users, knowing the geographical zone of interest in advance, would certainly have adapted their own mental models and agreed with the description.
Thus, instead we chose to have users make the effort of guessing the geographical references. While this is a more complicated task from the participants' perspective, it avoids having them focus on a specific zone before they can compare how well the description matches the geographical reference. Also, our aim is not to get a rating of the descriptions themselves, since the final texts that the full D2T system will generate will be more elaborate in terms of both content and style. In this case, the descriptions are a tool to illustrate how the fuzzy geographical descriptors can be used to extract linguistic content and, in our evaluation, they allow users to identify the descriptors on a map.
Since we are focusing on specific content and the definitions of the geographical expressions rather than on full texts describing the weather state of the map (which will be the output of our D2T system), we expected some participants to find difficulties when interpreting the protoform-like sentences in the description. Also, the task of matching sky state labels and quantifiers with the data shown on the map was not trivial in several of the cases we chose, especially when a description was composed of several sentences. On top of this, we had assumed that participants would be familiar with the geographical references we chose, but their expertise might vary as well.
Considering these threats, we had hypothesized that i) subjects would perform well in clear cases, but not necessarily close to a proportion of 100% of correct answers; and ii) participants would perform better in clear cases than in ambiguous ones.
6.2.5. Results and discussion
The survey was completed by 40 subjects (400 answers in total, 200 for clear cases, and 200 for ambiguous ones). Participants guessed the geographical descriptors correctly in 155 out of the 200 clear cases, resulting in a proportion of 77.5%. As for the ambiguous cases, 83 out of the 200 answers matched the actual descriptor behind the description, resulting in a proportion of 41.5%.
We tested our first hypothesis (users perform well in clear cases) under a 1-sample proportions test. With a percentage of 77.5% correct answers, for values up to a 70% the null hypothesis was rejected, with a 95% confidence interval [0.71, 0.83] and a p-value of
Although we verified our two hypotheses, a more detailed analysis of the proportions for both situations is in order. In the case of the clear setting, for the total amount of clear cases that were answered, we can observe in Table 2 the ratio of descriptors answered by participants with respect to the correct answers. The most noticeable case where subjects failed to guess the correct descriptor was for “Eastern Galicia” (E.G., second column). Excluding the row which shows the correct guesses, all rows show for this case a proportion
| Actual |
S.G. | E.G. | R.B. | C.C. | W.C. |
|---|---|---|---|---|---|
| Answer | |||||
| S.G. | 0.18 | 0.02 | 0 | 0.01 | 0 |
| E.G. | 0.01 | 0.08 | 0 | 0 | 0.01 |
| R.B. | 0.01 | 0.07 | 0.18 | 0.02 | 0 |
| C.C. | 0 | 0.01 | 0.01 | 0.16 | 0.02 |
| W.C. | 0 | 0.02 | 0 | 0 | 0.16 |
C.C., Cantabrian Coast; E.G., Eastern Galicia; R.B., Rías Baixas; S.G., Southern Galicia; W.C., Western A Coruña.
Confusion matrix for clear cases, categorized by descriptors.
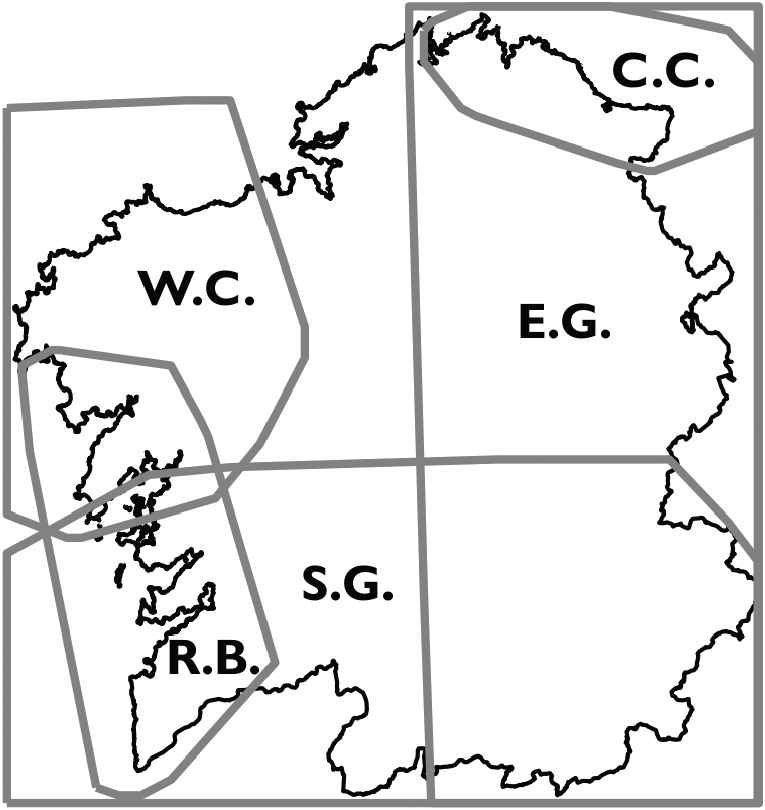
Plot of the support areas for the geographical descriptors considered in the survey (S.G., Southern Galicia; E.G., Eastern Galicia; R.B., Rías Baixas; C.C., Cantabrian Coast; W.C., Western A Coruña).
Regarding the ambiguous cases, the lower rate of correct answers was to be expected, given that in these cases different descriptors (which in some cases overlapped and in others did not) shared the same weather symbols in more or less similar proportions. If we observe Table 3, in the case with the highest proportion of incorrect answers subjects confused “Western A Coruña” and “Eastern Galicia” (W.C., E.G.: 0.14). Although these descriptors do not overlap, the weather events reflected on the map were the same for both in rather similar proportions. Other interesting cases include subjects answering “Southern Galicia” for “Rías Baixas” (where R.B. is mostly contained in S.G.) or “Rías Baixas” for “Western A Coruña” (where R.B. and W.C. partly overlap).
| Actual |
S.G. | E.G. | R.B. | C.C. | W.C. |
|---|---|---|---|---|---|
| Answer | |||||
| S.G. | 0.09 | 0.01 | 0.11 | 0.02 | 0.02 |
| E.G. | 0.01 | 0.02 | 0 | 0 | 0 |
| R.B. | 0.1 | 0 | 0.07 | 0 | 0.08 |
| C.C. | 0 | 0.04 | 0.02 | 0.14 | 0 |
| W.C. | 0 | 0.14 | 0 | 0.04 | 0.1 |
C.C., Cantabrian Coast; E.G., Eastern Galicia; R.B., Rías Baixas; S.G., Southern Galicia; W.C., Western A Coruña.
Confusion matrix for ambiguous cases, categorized by descriptors.
Based on the obtained results, we believe the semantics of the geographical references we have modeled are appropriate for the D2T system we are currently developing. The difficulty of the task we proposed in our evaluation and the proportion of correct guesses in clear cases, which is close to 80% (and is statistically significant at 70%), are good indicators in this direction. Moreover, we expect that users will be able to easily identify weather events in the map in automatically generated texts, considering these will include the actual geographical references derived from the fuzzy geographical descriptors we created.
7. CONCLUSIONS
We have described in this paper an application of fuzzy sets to perform a language grounding task. Specifically, in the context of the development of a D2T system meant to generate geo-referenced weather descriptions, our work establishes a solid methodology for integrating fuzzy set-based techniques into the task of language grounding for D2T purposes.
Based on how expert writers understand certain expressions (geographical references in this case), we created simple and consistent fuzzy models that aggregate their perceptions. We have provided an illustrative use case where these models are used to generate linguistic descriptions. Based on this use case, we checked the models against potential readers of weather descriptions, evaluating how well readers relate to the references modeled on the experts' preferences under different settings [16].
As future work, we plan to develop a geographical referring expression generation algorithm that is able to use the models here described. Based on the same kind of weather data shown in the example figures in Section 6, such algorithm will generate expressions that combine different geographical descriptors to refer to different weather event areas distributed across a map. This algorithm will be the core of the new D2T system to describe live weather data.
CONFLICT OF INTEREST
There is no conflicts of interest.
Funding Statement
This research was also funded by the Spanish Ministry of Science, Innovation and Universities (grants RTI2018-099646-B-I00, TIN2017-84796-C2-1-R and TIN2017-90773-REDT) and the Galician Ministry of Education, University and Professional Training (grants ED431F 2018/02, ED431C 2018/29 and “accreditation 2016-2019, ED431G/08”). All grants were co-funded by the European Regional Development Fund (ERDF/FEDER program).
ACKNOWLEDGMENTS
Jose M. Alonso is Ramón y Cajal Researcher (RYC-2016-19802) and member of the European Society for Fuzzy Logic and Technology (EUSFLAT). He is the corresponding author. He contributed jointly with the rest of co-authors to the conceptualization of the proposal, implementation, and evaluation.
Footnotes
These results were compiled into a data set resource, which has been thoroughly described [38] and can be retrieved online [39].
For simplicity, we will refer to
REFERENCES
Cite this article
TY  - JOUR
AU  - Alejandro Ramos
AU  - Jose M. Alonso
AU  - Ehud Reiter
AU  - Kees van Deemter
AU  - Albert Gatt
PY  - 2019
DA  - 2019/09/12
TI  - Fuzzy-Based Language Grounding of Geographical References: From Writers to Readers
JO  - International Journal of Computational Intelligence Systems
SP  - 970
EP  - 983
VL  - 12
IS  - 2
SN  - 1875-6883
UR  - https://doi.org/10.2991/ijcis.d.190826.002
DO  - 10.2991/ijcis.d.190826.002
ID  - Ramos2019
ER  -