
Multi-Class Skin Lesions Classification System Using Probability Map Based Region Growing and DCNN
- DOI
- 10.2991/ijcis.d.200117.002How to use a DOI?
- Keywords
- Black frame removal; Gaussian filtering; Region growing; Optimal thresholding; Geometric features; SVM classification
- Abstract
Background:
Melanoma is a type of threatening pigmented skin lesion, and as of now is among the most hazardous existing diseases. Suitable automated diagnosis of skin lesions and Melanoma classification can extraordinarily enhance early identification of melanomas.
Methods:
However, classification models based on deterministic skin lesion can influence multi-dimensional nonlinear problem which leads to inaccurate and inefficient classification. This paper presents a Deep Convolutional Neural Network (DCNN) classification approach for segmented skin lesions in dermoscopy images. As an initial step, the skin lesion is preprocessed by an automatic preprocessing algorithm together with a fusion hair detection and removal strategy. Also a new probability map based region growing and optimal thresholding algorithm is integrated in our system which yields tremendous accuracy.
Results:
For obtaining more prominent results a set of features containing ABCD features as well as geometric features are calculated in the feature extraction step to describe the malignancy of the lesion.
Conclusions:
The experimental result shows that the system is efficient and works well on dermoscopy images, achieving considerable accuracy.
- Copyright
- © 2020 The Authors. Published by Atlantis Press SARL.
- Open Access
- This is an open access article distributed under the CC BY-NC 4.0 license (http://creativecommons.org/licenses/by-nc/4.0/).
1. INTRODUCTION
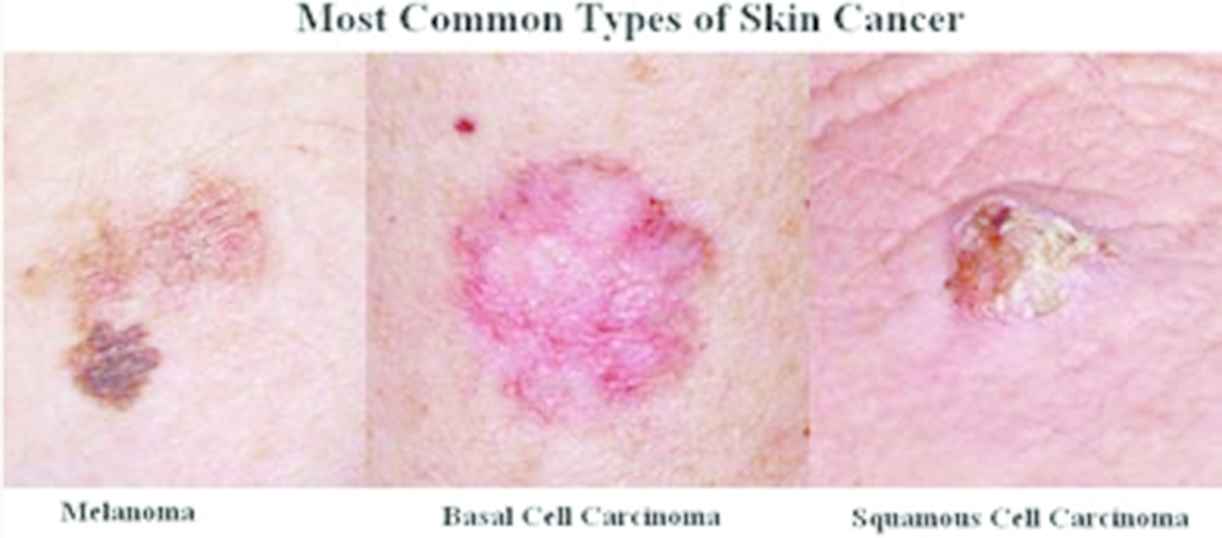
Skin lesions are recurrent and can show severe infections, for example, Melanoma and by and large the early finding of those lesions is acquired from image processing [1]. Skin lesions can be arranged into either melanoma or non-melenoma in which melenomas are irregular cells, they represent most mortality from skin malignancy. Discovery of threatening melanoma in its initial stages significantly lessens horribleness and mortality [2]. The squamous cell carcinoma and basal cell carcinoma are the most widely recognized types of Melanoma and still the most fatal type of Melanoma is malignant melanoma, it shows up in dark shading and in the sporadic shapes [3]. The utilization of automatic computerized image processing strategies for skin lesion classification is a dynamic examination zone that can give a legitimate benefit in initial diagnosing Melanoma [4]. With this non-intrusive strategy, generally called dermatoscopy or epiluminescence microscopy, we can examine skin sores, for instance, melanomas and other pigmented sores. The consistent approaches to manage skin sore ID fuse various methods of Preprocessing, Segmentation, Feature extraction, and Classification [5].
The Gaussian, mean and middle channels and dot commotion channels are as the most unmistakable pre-preparing procedures [6]. Division is the most crucial post process in exactly choosing a skin injury. Thusly, it ought to be done with most extraordinary care and is also a troublesome activity to execute as in some injury pictures the injuries have a for all intents and purposes practically identical power as that of the skin besides it fuses dull hairs around the sore [7]. In any case, it is basic that the skin sore division procedure ought to be precise, as outcome of the division is to be used as a commitment to melanoma order. Various calculations for dermoscopy pictures have been proposed which utilize division strategies [8]. The sectioned segment is additionally used for the system of isolating diverse highlights. Highlight extraction is the strategy for getting specific components from the pre-handled pictures of different unpredictable characterizations in a way that the inside—class similarity is increased and between—class comparative it is limited [9].
A perfect rundown of highlights should have efficient and sharp highlights, since the element vectors significantly impacts the execution of the arrangement. Subsequently, how to isolate profitable highlights and settle on a more beneficial decision of the highlights is a huge activity for Computer Assisted Diagnosis (CAD) systems [10]. Division methodologies can be requested into grouping, histogram thresholding, edge based recognition, morphological location, region based identification, dynamic forms, and so on [11]. The diverse calculations for this strategies join locale blending, LOG edge identifier [12], surface peculiarity [13]. Free histogram pursuit (IHP) [14]. There is a common course of action of highlights used for arrangement of skin sore called ABCD scale: Asymmetry, Border inconsistency, Color variety, and Diameter (Differential Structures) [15]. Despite the typical highlights there are distinctive highlights are open, for instance, surface highlights, geometrical highlights, RGB histogram highlights, and so on. The Gray Level Co-event Matrix (GLCM) technique, Computer Vision and Image Processing Algorithm (CVIP) instruments programming, CVIP apparatuses, a PC vision, and picture preparing programming, was used to isolate the relative components from the separated skin sore pictures [16].
An assortment of measurable and machine learning strategies to grouping of pictures to melanoma, kindhearted, and dysplastic nevi are currently accessible. Highlight extraction, in blend with PC helped classifier techniques, are later connected to the information keeping in mind the end goal to give a determination to danger [17]. Such arrangement techniques might be joined with fluffy based rationale, and are for the most part in light of machine-learning calculations, which can be directed (e.g., k-Neatest Networks (KNN), Artificial Neural Networks (ANN), Support Vector Machine (SVM) and outfit learning) or unsupervised (e.g., K-implies bunching and Principle Component Analysis (PCA)) [18]. The complexity of these calculations has been finished by contrasting the parameters, that is, Affectability, Specificity and Accuracy, and the consequences of these parameters are looked at [19]. The KNN classifier is one of the standard neighborhood classifier in design acknowledgment and still it has impediments, for example, incredible computation many-sided quality, completely reliant on preparing set, and no weight contrast between each class [20].
To combat this, a novel hybrid method to improve the classification performance of KNN using bat algorithm is proposed in this paper. And also to improve the segmentation, a probability map based region growing and optimal thresholding algorithm is proposed in this work. The remainder of this paper is organized as follows. Our proposed method is explained in Section 2. In Section 3 the results and discussion is given and followed by conclusion in Section 4.
2. METHODOLOGY
Pigmented skin sores incorporate both, favorable and harmful structures in which melanoma is a kind of threatening pigmented skin sore, and as of now is among the most perilous existing malignancies. It has been a testing errand to separate and wipe out favorable skin injuries from harmful skin sores to analyze a patient at a beginning time. In existing method the common features along with other texture features are extracted, but geometric features are not extracted. For the Melanoma Skin Lesion, the Geometric Features are the main features for early stage diagnosis with high accuracy. For the above existing issues, we propose a novel segmentation method and hybrid classification method to overcome this various previous problems. The proposed methodology for Melanoma Detection using Deep Convolutional Neural Network (DCNN) classification is as shown in Figure 1.
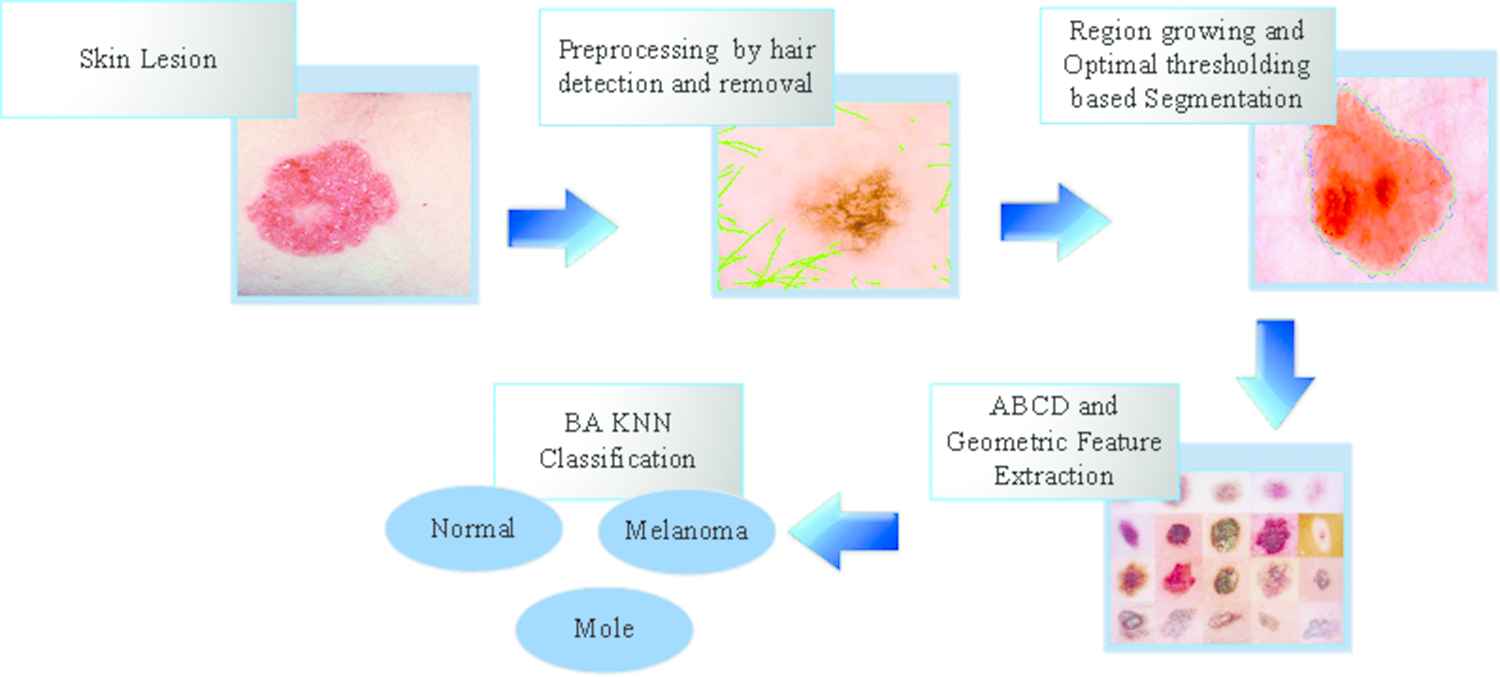
Our proposed skin lesion classification system.
In this paper we propose a novel segmentation method using region growing and optimal thresholding for four dimension probability map and new DCNN method for exact detection of skin lesion from dermoscopic images. The skin injury location is performed in four phases, for example, preprocessing, division, include extraction and order by utilizing distinctive techniques. The contribution for the framework is the picture of the skin sore which is questioned to be a melanoma injury and this picture is then pre-prepared to upgrade the picture quality. The district developing and ideal thresholding division process is utilized for the Red-Yellow-Black-White (RYKW) Probability Map. The fragmented picture is given to the component extraction square which comprises of sore district investigation for its geometrical highlights and ABCD highlights. The geometrical features are proposed since they are the most noticeable highlights of the skin growth injury. The separated element are additionally given to the component order organize which arranges the skin injury as harmful or typical by contrasting its element parameters and the pre-characterized edges.
2.1. Preprocessing by Hair Detection and Removal Algorithm
At start with the preprocessing stage, where we present an algorithm for hair detection and removal of hairs in color dermoscopic images. The main aim of the algorithm is to repair the texture of the skin lesion, which becomes consistent, and prepare the image for further processing stage, for that an automatic pre-processing system have been developed. The dermoscopic images
Initially the black frame is removed from the input dermoscopy image, then the small hairs are removed in the filtering process, whereas the thick hairs are removed with the described hair removal algorithm. The reason for the filtering is to lessen noise such as skin lines, air pockets, and light, little hairs around the injury. To smooth these ancient rarities we utilize Gaussian smoothing, which is a low-pass filter. In hair removal algorithm eliminate unwanted pixels in behalf of top-hat transformation, followed by in-painting is used for the detecting the hair lines. The above process flow for the preprocessing is discussed in the upcoming section.
2.1.1. Black frame removal in dermoscopy image
In this stage the input image
A pixel in the picture is thought to be dark, when the gentility esteem is under 15 (the range of the lightness value [0 : 255]). We examine pushes in four ways (top, base, right, and left) and compute the measure of dark pixels. On the off chance that a specific line is contains half of dark pixels then it is marked as the piece of the dark frame, and is being evacuated. Also, we evacuate 10 more columns that speak to the light-shaded piece of the casing and creates dark casing expelled picture.
2.1.2. Gaussian smoothing for removing artifacts
The Bn image from the past stage is given for Gaussian filtering to decrease the noise. A Gaussian channel is a low pass channel that suppresses high recurrence detail while safeguarding the low recurrence parts of the picture. The Gaussian smoothing administrator is a spatial low pass linear filter that is utilized to obscure pictures and expel detail and clamor. The Gaussian function in two dimensions is given as follows,
2.1.3. Top-hat transform for hair removal of dermoscopy images
A recent approach for hair evacuation is the utilization of best cap change is given to the ensuing procedures lastly produce a total pre-processed image. The procedure comprises of the accompanying four stages.
Step 1: Convert the picture into gray scale image.
Step 2: A generalization of high pass filter (un-sharp masking), based on the negative of the Laplacian filter is used. Un-sharp masking yields increased local contrast image
Step 3: black top-hat transform is used for the detection of dark and thick hairs and expressed as the following equation.
Step 4: We refine the broken lines in and evacuate undesirable pixels by computing the zone, circularity, major, and minor pivot which yields an entire hair expelled picture is next given for inpainting whose point is to inpaint the recognized hair lines. Hair line pixels are supplanted with the qualities ascertained based on the area pixels (normal esteem). This segment yields an entire preprocessed picture which is sustained to the progressive stages.
2.2. Region Growing and Optimal Thresholding Segmentation in Probability Map
In this process, we are segmenting the image
2.2.1. Probability map calculation
Given a skin lesion
2.2.2. Segmentation
While there are numerous conceivable division strategies for use in medicinal applications, in our proposed strategy segmentation is based on two understood procedures, specifically region growing division, and ideal thresholding. We will demonstrate that even with these two division algorithms, when combined with our proposed likelihood outline, is able to give solid division of lesions. The two methods are talked about in the up and coming area.
Region growing
Region growing is a pixel-based picture division computation that takes a gander at neighboring pixels of starting seed points and makes sense of if neighbors of the pixel should be incorporated to the district or not [22–23]. The districts are created from the hidden seed point's likelihood vector of coterminous concentrations in light of the 4D likelihood outline. A neighbor is added to the region, if the division between that pixel's likelihood vector and the mean likelihood vector of the area (i.e., The mean likelihood of each R, Y, K, W channel over the current separated region) isn't precisely a certain limit esteem t. The technique continues until the point that all the neighbor's division having the regard is higher than the limit esteem. To ensure the zone creating methodology does not stop prematurely, a part is fused to chase down pixels with a similar probability portray a particular range r, from the locale boundary, and the strategy continues. From examinations, sensible characteristics for the threshold and clear are and pixels, independently. While locale creating is generally considered as a computationally expensive activity, the likelihood plot quickens the system by giving available shading discriminator between the four shades of intrigue.
Optimal thresholding
Our “ideal thresholding approach” sections the picture by thresholding the distinction lattice of the likelihood delineate, while taking into tally the pixel's tissue compose and quality of its probability. The key thought behind our approach is to distinguish all pixels whose shading attributes are like those of the seed pixel, before iteratively refining the division limit. The refinement is by basic thresholding of the distinction lattice, Q, which is a grid of the contrast between the two most noteworthy probabilities for every pixel, and gives a moment level of tissue membership probability and this can be communicated as
The region of interest (ROI) point is defined as the region in Q and the next step is to iteratively threshold the ROI. At each step the mean of the segmented ROI, where the seed point is located is calculated. Theoretically if the mean value will decrease, the threshold value also decrease. The optimal threshold is defined as the threshold value where the mean values become “stable” without any sudden decreases or increase. The segmented region can be obtained by thresholding the ROI with the optimal threshold value. Experimentally, the suitable values for the threshold τ and step size are 0.1 and 0.01, respectively. Algorithm for the proposed segmentation approach is as follows.
Algorithm 1: Optimal Thresholding
Input: 4D probability map, P
Output: Segmented lesion region,
Procedure:
1 Compute probability difference matrix, Q
2 Based on probability map of seed pixel, identify ROI
3 Set
4 Set
5 Set
6 Set
7 While
end
8 Identify optimal threshold,
9
10 Perform morphological operations on
Finally, the segmented dermoscopy image
2.3. Common and Geometric Feature Extraction
In this stage, extricating the basic arrangement of highlights for the characterization of portioned skin injury called ABCD scale: Asymmetry, Border anomaly, Color variety, and Diameter (Differential Structures). The principle highlights of the Melanoma Skin Lesion are its Geometric Feature, notwithstanding normal highlights we additionally propose to remove the Geometric Features of sectioned skin injury. Some standard geometry highlights territory (Area, Perimeter, Greatest Diameter, Circularity Index, and Irregularity Index).
2.3.1. Common features in dermoscopy images
The common features extracted from the image
2.3.2. Geometry-based features in dermoscopy images
Border arrangement and geometric properties of the state of the injury give critical symptomatic data in the recognition of melanoma. The fundamental essential for extracting border highlights is the division or fringe identification step, where the injury is separated from the encompassing ordinary skin. The yield of the segmentation step is the segmentation plane, which is a dark white picture. The accompanying set of geometry-based highlights are extricated from each dermoscopy picture:
Region (A): Number of pixels of the lesion.
Perimeter (P): Number of pixels along the distinguished limit.
Most prominent Diameter (GD): The length of the line which interfaces the two most remote limit focuses and goes over the lesion centroid (C), which is given by:
Circularity Index (CRC): It explains the shape uniformity
Irregularity Index A (IrA):
3. EXPERIMENTAL MATERIALS AND RESULTS
3.1. Materials
Our key contribution is to focus on three common classes of skin lesions and normal images: The sample experimental images are shown in Figure 2. Moreover, we use only high resolution color images acquired using standard camera (non-dermoscopy). Our image database comprises 451 lesions, belonging to 4 classes, it is given in Table 1. The ground truth used for the experiments is based on the agreed classifications by two dermatologists and a pathologist. Images are acquired using a Canon EOS 350D SLR camera.
Sample images data set.
| Class Type | Training Data | Testing Data | Total No. of Images |
|---|---|---|---|
| Normal | 50 | 85 | 135 |
| Melanoma | 50 | 85 | 135 |
| Basal cell carcinoma | 50 | 80 | 130 |
| Squamous cell carcinoma | 50 | 80 | 130 |
Experimental image dataset for classification.
3.2. Experimental Results
This section describes the experimental results of the proposed segmentation technique using Dermoscopy Images with different types of skin lesion. Dermoscopy images and the obtained results are evaluated through evaluation metrics namely, sensitivity, specificity and accuracy [20] it is defined in Eqn (15).
| Class 1 | Class 2 | Class 3 | Class 4 | |
|---|---|---|---|---|
| Normal | 80 | 3 | 2 | 0 |
| Melanoma | 4 | 79 | 2 | 0 |
| Basal cell carcinoma | 0 | 2 | 75 | 3 |
| Squamous cell carcinoma | 0 | 2 | 3 | 75 |
Confusion matrix of CNN.
| TP | TN | FP | FN | Sensitivity (%) | Specificity (%) | Accuracy (%) | |
|---|---|---|---|---|---|---|---|
| Normal | 80 | 241 | 4 | 5 | 94.12 | 94.88 | 97.27 |
| Melanoma | 79 | 238 | 7 | 6 | 92.94 | 97.14 | 96.06 |
| Basal cell carcinoma | 75 | 243 | 7 | 5 | 93.75 | 97.02 | 96.36 |
| Squamous cell carcinoma | 75 | 247 | 3 | 5 | 93.75 | 98.08 | 97.58 |
| Over all classification accuracy | 96.82 | ||||||
Performance measure of CNN classification.
In Table 3, the classification accuracy of CNN classification in normal image is 96.80%, Melanoma is 97.12%, Basal cell carcinoma is 96.097%, and Squamous cell carcinoma is 97.13%. The overall classification results of proposed method (DCNN) is shown in Table 4.
| TP | TN | FP | FN | Sensitivity (%) | Specificity (%) | Accuracy (%) | |
|---|---|---|---|---|---|---|---|
| Normal | 83 | 243 | 2 | 2 | 97.65 | 99.13 | 98.79 |
| Melanoma | 82 | 242 | 3 | 3 | 96.48 | 98.78 | 98.18 |
| Basal cell carcinoma | 78 | 246 | 4 | 2 | 97.50 | 98.40 | 98.18 |
| Squamous cell carcinoma | 77 | 249 | 1 | 3 | 96.25 | 99.06 | 98.79 |
| Over all classification accuracy | 98.49 | ||||||
Performance measure of DCNN classification.
3.3. Comparative Analysis
In this section, the proposed method is compared to other three bench mark deep learning methods such as ResNet50, Xception, DenseNet121. Based on the experimental results our proposed work produces better results to other methods.
ResNet50: Residual Networks (ResNet) is used as a backbone for many computer vision tasks as it comprises of 178-layer deep CNN architecture, consisting of convolutional, maxpool, batch normalization, activation, and a dense layer. It allows us to train 150+ layers deep neural networks with ease. Before ResNet, training of deep neural networks was difficult due to the vanishing gradients. It involves the Add layer which allows us to form a skip connection, that is, output of predecessor layer that can be communicated as the input of successor layer [24].
Xception: Xception stands for “Extreme Inception” and consists of 36 convolutional layers for feature extraction along with pooling layers like maxpool and global average pool. These layers are structured in the form of 14 modules, where each convolutional layer consists of 3 × 3 filters and strides equal to 2. The convolutional layers are preceded by batch normalization. The Rectified Linear Unit (ReLU) activation function is followed throughout the architecture to bring out the non-linearity in the output of each layer. The exit of the architecture has a global average pool layer which is followed by a dense network and logistic regression [25].
DenseNet121: DenseNet121 consist of dense blocks which makes it different from other architectures. A dense block consists of subsequent layers which take features of the preceding layers as input via concatenation. Image is passed as input to the convolution layer which is followed by dense blocks each of them separated by a combination of convolutional of filter size 1 × 1 and 2 × 2 average pooling layer with a stride of 2 units. Each dense block consists of a combination of zero padding, convolution layer, batch normalization and activation layer. The block ends with a concatenation layer which concatenates the output of preceding layers. The tail of architecture consists of a dropout layer having a dropout rate of 0.2 followed by a dense layer of 1 unit and sigmoid activation [26]. The performance results of proposed and bench mark methods are given in Table 5. The overall experimental results of existing and proposed methods are shown in Figure 3.
| Bench Mark Methods | Sensitivity (%) | Specificity (%) | Accuracy (%) |
|---|---|---|---|
| Xception | 96.79 | 98.92 | 98.40 |
| CNN | 94.18 | 97.86 | 96.80 |
| ResNet50 | 92.24 | 98.07 | 97.13 |
| DenseNet121 | 90.25 | 96.15 | 94.26 |
| Proposed Architecture (DCNN) | 97.51 | 98.78 | 98.43 |
Comparative analysis of other deep learning models and proposed method.
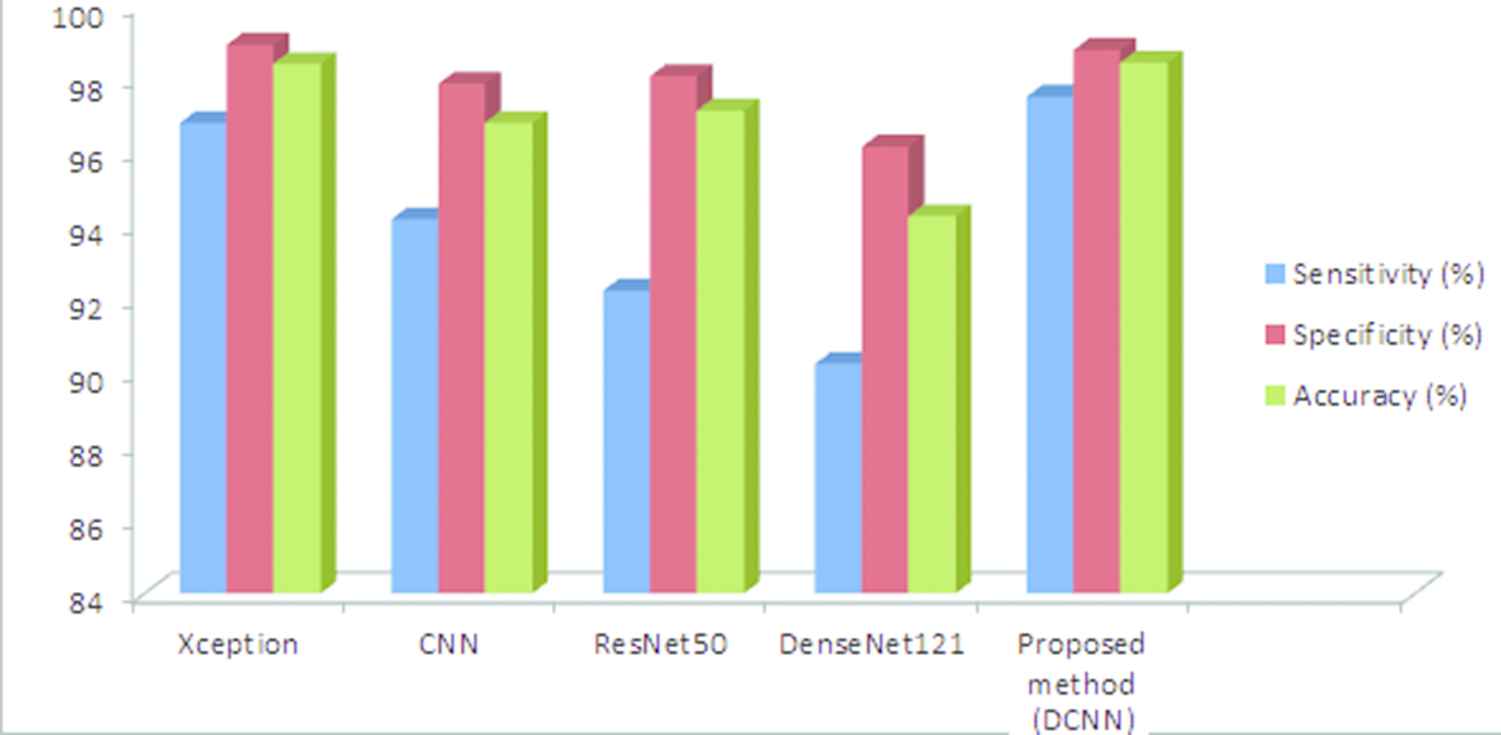
The Overall, experimental results of existing and proposed methods.
4. CONCLUSION
Due to the manual and slower approach of traditional diagnosis methods, early detection and diagnosis of the disease gets adversely delayed. Also, the accuracy of the state of the art is not up to the mark and so not clinically acceptable. Thus, the paper presents an automated approach, which is able to classify dermoscopy image into normal and abnormal. It performs better than the state of the art with accuracy of 98.43%, sensitivity of 98.78%, and specificity of 97.51% compared to other deep learning methods such as Xception, CNN, ResNet50, and DenseNet121. The approach can be tested on large scale clinical images to make it globally available for use in real time scenarios, so that can be used as a second opinion assistance for diagnosis of melanoma by the expert Radiologist. From the execution results and comparison it was shown that our proposed strategy produces exact classification among the accessible other skin lesion discovery systems.
CONFLICT OF INTEREST
The authors declare they have no conflicts of interest.
AUTHORS' CONTRIBUTIONS
In this article, we propose a novel segmentation method using region growing and optimal thresholding for four dimension probability map and new DCNN method for exact detection of skin lesion from dermoscopic images. Major contribution of this article is ROI segmentation and classification. In feature extraction, multiple features are combined to generate a single feature vector for classification. In feature classification, multiple kernels are combined to generate a single kernel for classification.
Funding Statement
This research received no specific grant from any funding agency in the public, commercial, or not-for-profit sectors.
ACKNOWLEDGMENTS
There is no acknowledgments in this article.
REFERENCES
Cite this article
TY  - JOUR
AU  - T. Sreekesh Namboodiri
AU  - A. Jayachandran
PY  - 2020
DA  - 2020/01/22
TI  - Multi-Class Skin Lesions Classification System Using Probability Map Based Region Growing and DCNN
JO  - International Journal of Computational Intelligence Systems
SP  - 77
EP  - 84
VL  - 13
IS  - 1
SN  - 1875-6883
UR  - https://doi.org/10.2991/ijcis.d.200117.002
DO  - 10.2991/ijcis.d.200117.002
ID  - Namboodiri2020
ER  -