
NNIR: N-Non-Intersecting-Routing Algorithm for Multi-Path Resilient Routing in Telecommunications Applications
- DOI
- 10.2991/ijcis.d.200313.001How to use a DOI?
- Keywords
- Resilient Routing; Multi-Path Resilient Routing; Genetic Algorithm Routing; Multi-Path Routing; Routing; Telecommunication Routing
- Abstract
In this paper, we will present a N-Non-Intersecting-Routing (NNIR) algorithm which is used to reduce the cost of resilient routing in telecommunications problems. Resilient Routing is the connections between two locations in a graph through the use of N completely independent routes. Resilient Routing is applicable in a wide variety of domains including telecommunications, logistics and embedded systems design. The proposed NNIR algorithm increase the cost of the primary route by taking a less optimal route, thus freeing a more optimal route for the resilient routes, in turn reducing the total cost of both routes. This is achieved through the use of a Genetic Algorithm, Dijkstra's Algorithm and the repair operator. The proposed NNIR shows an average improvement of 34.2% when compared to Dijkstra's Algorithm (one of the most widely used algorithm routing). Similarly, there is an average improvement of 34.2% when compared to A* (another popular shortest path algorithm). Additionally, there is an average improvement of 26.9% when compared to Simulated Annealing (a popular evolutionary technique used within routing problems). In this paper we show how NNIR performs within two different routing domains (telecommunications routing and road routing), and compares it against three other routing techniques to solve the resilient routing problem.
- Copyright
- © 2020 The Authors. Published by Atlantis Press SARL.
- Open Access
- This is an open access article distributed under the CC BY-NC 4.0 license (http://creativecommons.org/licenses/by-nc/4.0/).
1. INTRODUCTION
Routing has become very important within the modern world with graphs being able to represent a wide selection of networks, and is very useful in a wide selection of domains, such as telecoms, logistics, traffic and embedded systems design. A start and finish location on a graph can usually be connected in many different ways where there is always a shortest route to connect these locations together. Single path routing describes the situation where one route is used to connect two locations together (as shown in Figure 1), as the blue line. Resilient Routing is the use of more than one route to connect two locations together, as shown in Figure 1 as the blue line and the gray line. To qualify as a resilient route, the two routes must never intersect with the exception of the start and finish locations. The two routes shown within Figure 1 intersect within the London area so they are not actually resilient routing, although Figure 1 is a good representation of how two routes can be used to get to the same location.
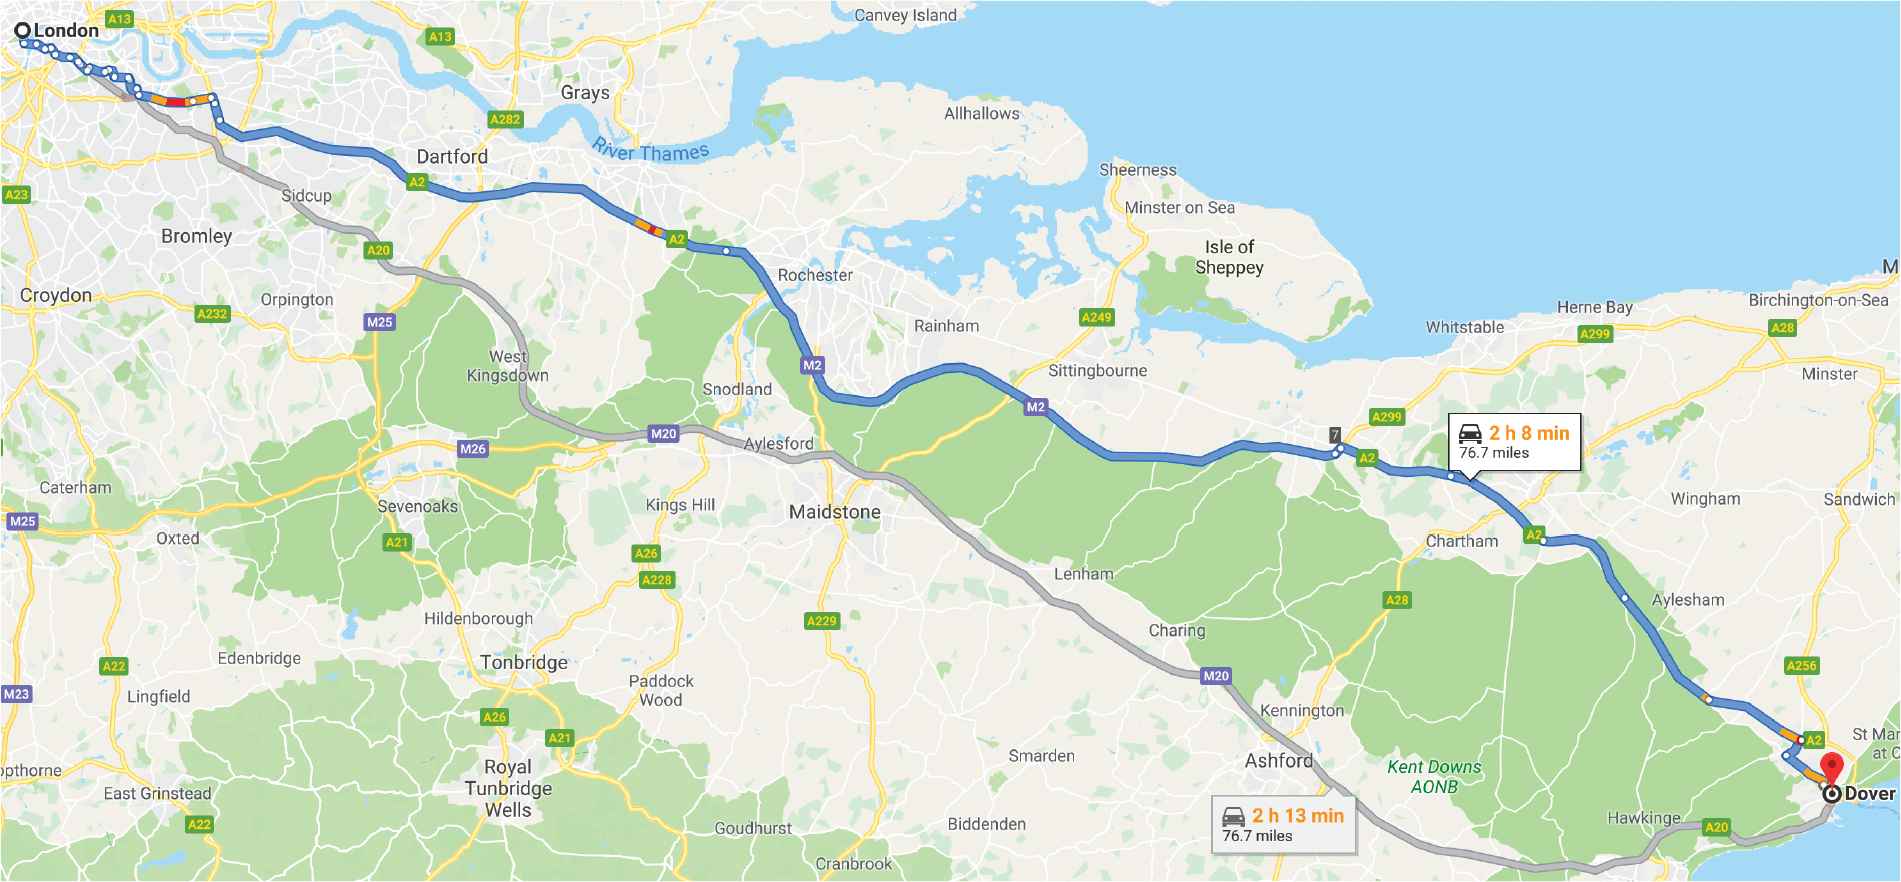
Road routing example.
Resilient Routing is not a simple problem due to the tightly constrained nature of the routing situation and the number of potential routes available across a graph which can be very large. The UK road network, for example, is a very complex graph with a very high branching factor (i.e. there are many different ways to get between London and Dover), which is complex enough to get one route through let alone several.
Dijkstra's Algorithm is known to be able to find the shortest route in a weighted graph with non-negative weights [1]. Although, Dijkstra's Algorithm struggles to find the best solution where multiple unique routes are needed through a graph. The “best” solution here considers the total cost of all routes together. The situation described (where Dijkstra doesn't find the best overall solution) is the Resilient Routing problem. Resilient Routing is a term used to describe the need for multiple distinct routes. The algorithm proposed within this paper N-Non-Intersecting-routing (NNIR) is designed to deal with just this situation. This routing situation has two key constraints: firstly, the different routes must not use any of the same edges or vertices excluding the start and end vertices and secondly, NNIR must try to get as close to the desired number of routes as possible.
There are many different techniques that can be used to find the shortest path through a network. There are traditional routing algorithms such as Dijkstra's Algorithm [1] or A* [2], both of these methods are inherently greedy approaches. If all of the cheapest infrastructure is consumed by the shortest path, they do not leave any good potential routes for the resilient routes, which can lead to a sub-optimal solution. Thus, they have the pitfall of not being able to consider the effect of one route using the cheapest infrastructure. Other approaches that can be used for this problem include methods that are considered more exhaustive in their search of the problem space. These methods include Breadth First Search [3] or Depth First Search [4] although these could be seen closer to brute force solutions to this problem. There are methods of pruning the search trees that could prove effective, such as Alpha-Beta Pruning [5]. These pruning techniques don't scale so well in large networks when compared to other techniques for solving a problem of this complexity, thus increasing the space and time complexity.
The power of the A* search comes from its heuristics as they allow it to perform a shortest path search with a much smaller time complexity than Dijkstra's Algorithm, while still returning the same result. This faster search time is dependent on the heuristic being accurate. Other methods such as Genetic Algorithms (GA) or simulated annealing use heuristics for the search of the problem space. In all these methods heuristics are used to guide the search through the universe of discourse in an attempt to find a more optimal solution to a problem. The increase in optimality could be a better solution to the problem or just a reduction in space and time complexity.
GAs [6] or Simulated Annealing [7] are evolutionary optimization techniques. These techniques are better suited to optimization problems than routing problems in general, but they have both had successes in routing problems [8,9]. Due to the nature of the constraints upon this problem it is easy to see how an evolutionary algorithm could perform well in this problem space.
This paper is organized as follows: in Section 2, we provide an overview on the problem of Resilient Routing in telecommunication networks. Section 3 provides an overview on traditional Routing Methods. Sections 4 provide an overview on GAs and Simulated Annealing. Section 5 presents the proposed NNIR algorithm while Section 6 presents the experiments and results. Section 7 presents the conclusions and future work.
2. AN OVERVIEW ON RESILIENT ROUTING IN TELECOMMUNICATION NETWORKS
Network connectivity has become an essential part of modern society, as the world continues to become more reliant on interconnectivity. Telecommunications companies provide point to point routing in complex and imperfect networks for a wide variety of customers. These customers include households, businesses and government entities. Some businesses and government entities require dedicated high-quality uninterrupted connections between multiple locations, these could be data centers, offices or warehouses. One way to help ensure an uninterrupted connection is to provide multiple routes between these locations. This is to ensure these routes don't have a Single Point of Failure [10] (sPoF). A sPoF is avoided by having a set of routes which do not share any common infrastructure (excluding the start and end locations). The first route between these locations is known as the Primary Route and all subsequent routes are known as Resilient Routes. Some previous research has been performed on data uncertainty in relation to Resilient Routing [11]. Although this uses Resilient Routing as a framework for its data uncertainty tests, it is not inherently about the Resilient Routing issue.
Dijkstra's Algorithm is known to produce the shortest path between two locations as it has a characteristically greedy approach to path finding. Due to this greedy approach all the resilient routes will take the next best available routes, without using any of the same infrastructure. Figure 2 shows Dijkstra's Algorithm between Node A and Node I. The route between A-B-C-I indicates the Primary Route and the route between A-F-G-H-I indicates one Resilient Route. In this example the cost of the Primary Route is 29 and the cost of the Resilient Route is 40, giving a total cost to both routes as 69.

Dijsktra cost reduction example.
Figure 3 shows the same network being evaluated by the proposed system. The system makes a change to the Primary Route, now indicated by the route A-B-D-E-I, with a cost of 32, the Resilient Route now denoted by the route A-F-C-I with a cost of 34. The total cost is now 66, which is an improvement of the total cost for the solution presented by Dijkstra's Algorithm.
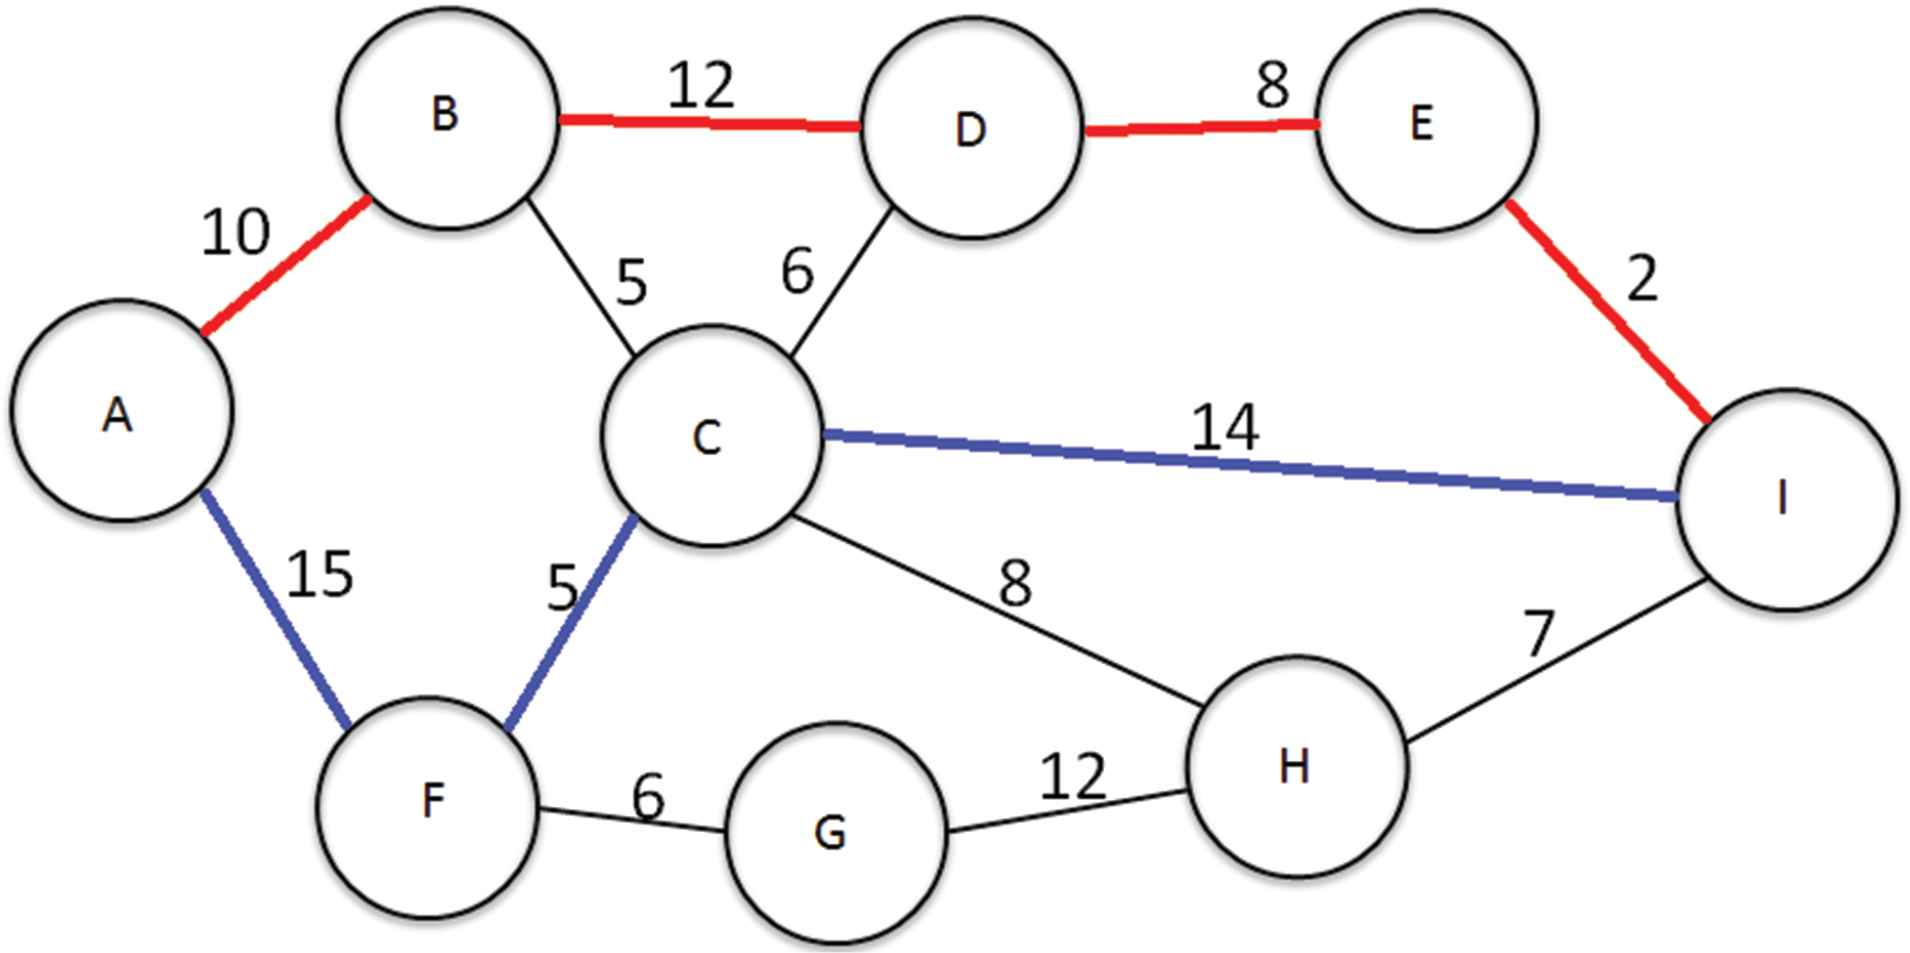
Optimized cost reduction example.
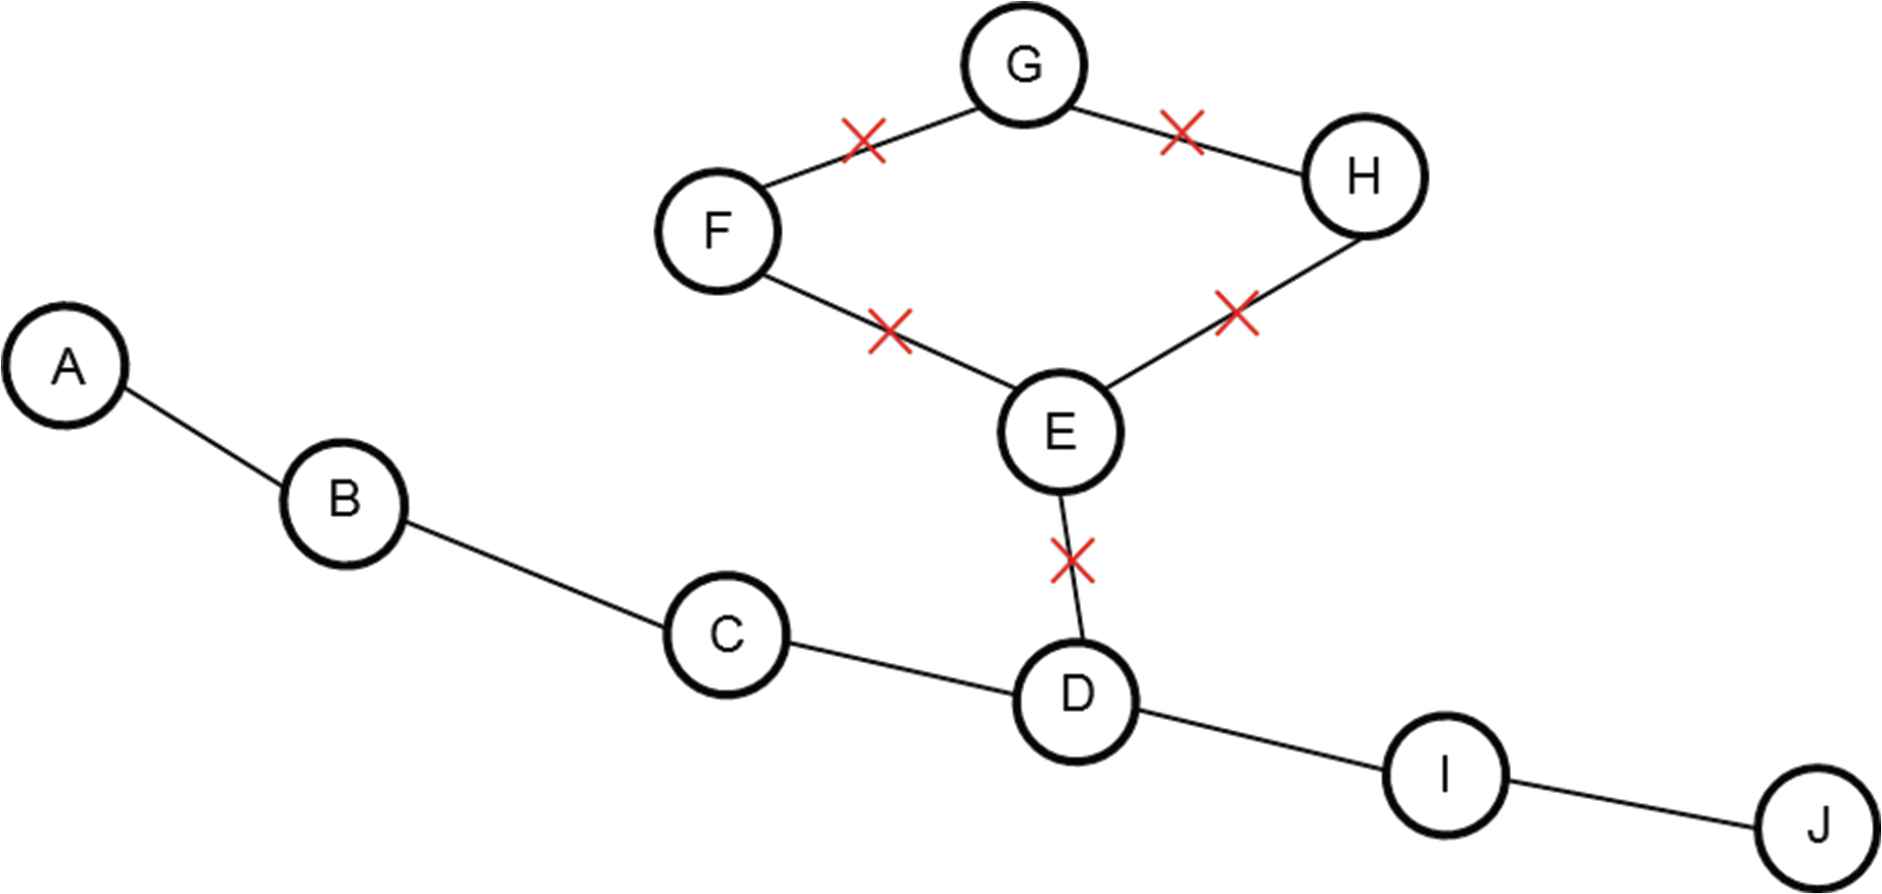
An alternative undesirable situation is where Dijkstra's Algorithm prevents any Resilient Routes from being found. This is caused by Dijkstra's naturally greedy approach to routing where it takes all the best infrastructure to acquire the shortest path. This approach is perfect for a shortest path algorithm, but when it comes to Resilient Routing it is important that key infrastructure is not shared between the two routes. This can be seen in Figure 4, for the route A-B-D-F-G, where the cost of the route is 27.
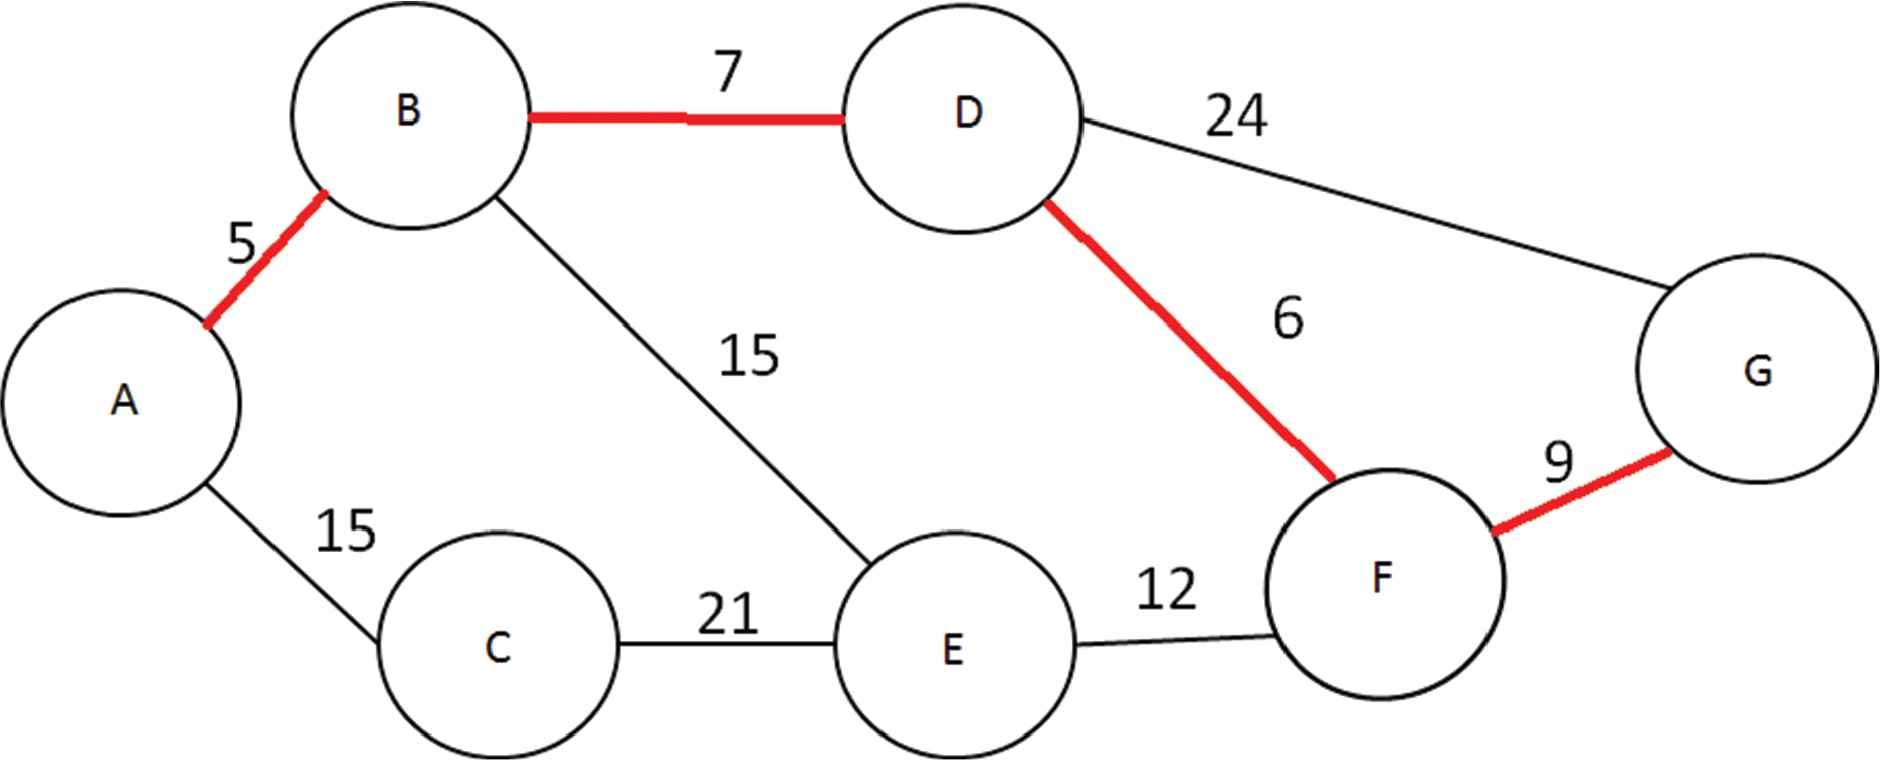
Dijkstra blocking example.
This situation would be objectionable as there is no Resilient Route. However, with one simple change to the route in Figure 4, it can become possible to acquire a Resilient Route. Figure 5 demonstrates the simple change in the Primary Route which unblocks the way for the Resilient Route. The route is now A-B-D-G as opposed to A-B-D-F-G. This change increases the cost from 27 to 36 but this allows for the Resilient Route A-C-E-F-G to exist with a cost of 57, bring the total cost of both route to 93. Although this cost increase is significant it does now satisfy the routing needs. Hence, the cost of the solution shown in Figure 4 is irrelevant.
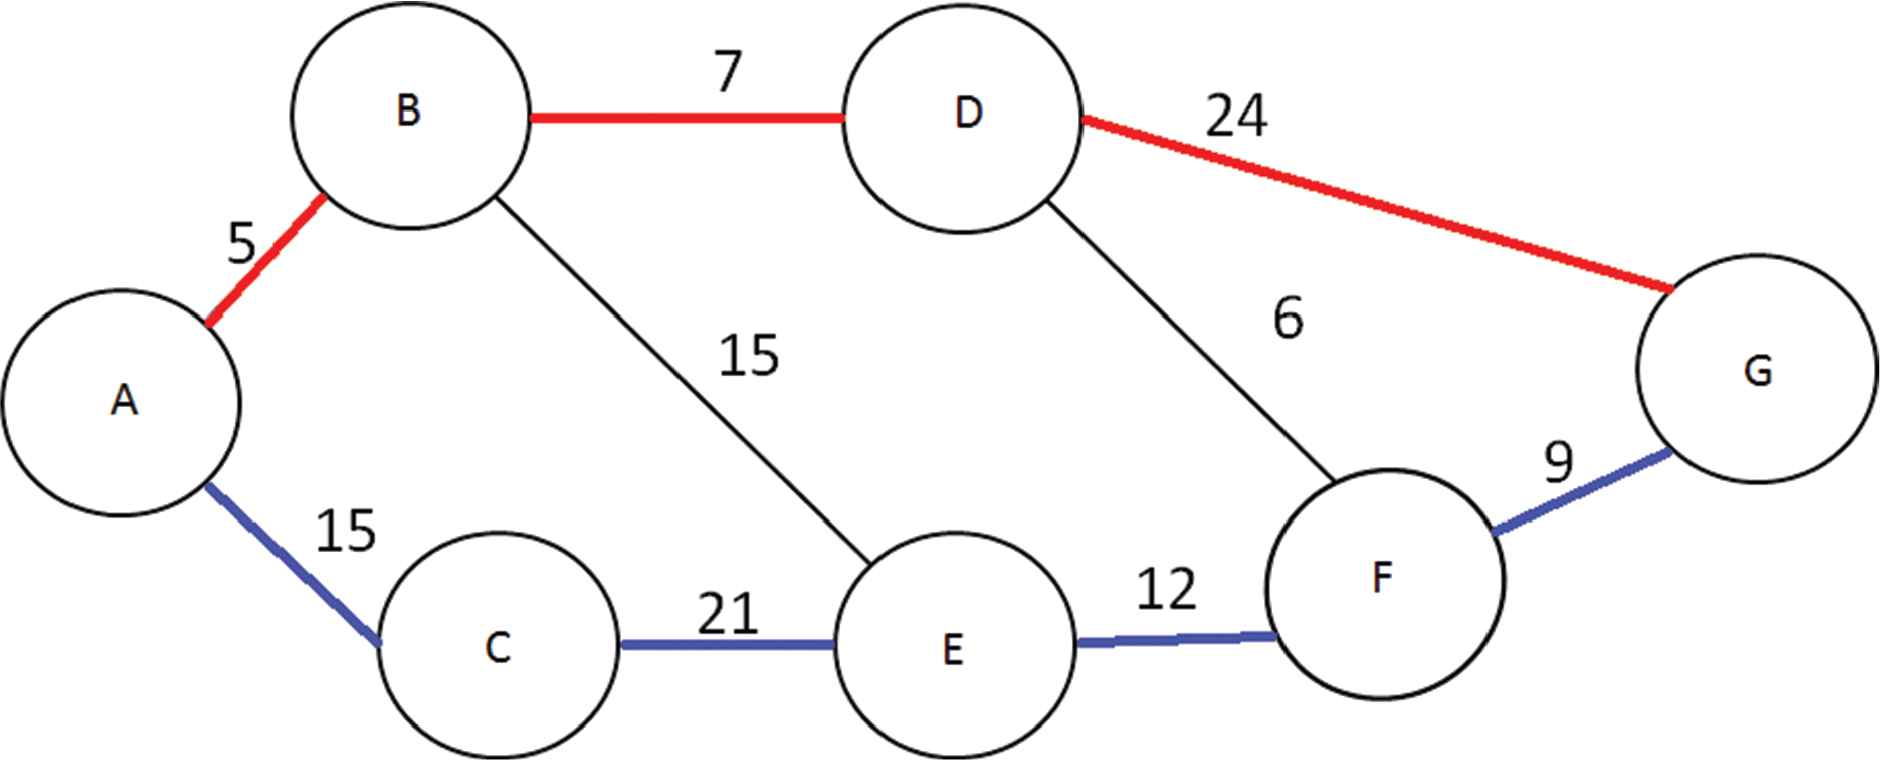
Optimized blocking example.
The Traveling Salesman Problem (TSP) is not to be confused with the Resilient Routing problem. TSP is a theoretical problem that can be applied to many different logistics situations. The basic premise is that an agent must travel throughout a graph whilst visiting every vertex at the lowest possible cost and then returning to the starting location. There are many different ways this problem can be solved including GAs [12], Simulated Annealing [13], Particle Swarm Optimization [14] to name but a few.
Another important area of routing that is also not to be confused with Resilient Routing is Quality of Service (QoS) routing [15]. QoS has become more and more important with the growth of new areas such as the Internet of things [16], voice over IP and video on demand [17]. The basic principle of QoS routing is the identification and usage of the fastest and most consistence connection available to the client at the time. There has been much success using Dijkstra to route for QoS [18] or as a part of a wider solution for the routing constraints [19]
3. AN OVERVIEW OF TRADITIONAL ROUTING METHODS
3.1. Dijkstra's Algorithm
There are many different single shortest path routing algorithms with two of the most popular ones being Dijkstra's Algorithm and A*. Dijkstra's Algorithm [1] as proposed by Edsger W. Dijkstra in 1956 is known to produce the shortest path between two locations on a directed or undirected graph with non-negative weights. The computation time of the algorithm was improved in 1984 with the addition of a priority queue. The algorithm has been used in many different forms for many different problems from robotic path planning [20] to path passenger planning through a public transport network [21].
The algorithm begins by setting the cost to all the nodes from a start location as infinity, and creates three data structures: a graph of edges, open edges list and closed edges list. The algorithm starts at a designated start location and sets its cost from the start location to 0. It puts all the connected edges into the open data structure and selects the one with the smallest cost for exploration. If the cost of the connected edge is less than its current cost back to the start, it replaces the value with the cost the current edge and makes a note of which vertices the edge is connected to. Once a vertex's cost to the start is no longer infinity all its edges are added to the open list. Once an edge has been explored it is added to the closed list, showing that it has already been explored. This process continues until all edges in the open list have been explored, at which point an end location can be passed to the algorithm. From that end location a chain of edges can be found with the cost at each stage back to that start location.
3.2. A*
The A* (A-Star) algorithm was developed as an extension of Dijkstra's Algorithm, with the goal of achieving better performance [22]. There are two major differences between A* and Dijkstra's Algorithm; A* knows its goal location from the offset, and utilizes this in A*'s other major difference, the heuristic function. This better performance is achieved through the use of a heuristic function which passes additional information to the cost function. This additional information is taken into account when choosing which node to expand next. The heuristic function guides the search toward the goal and can represent many different forms of information, this information must always be related in some way to the weight of the edges in the graph. The accuracy of the A* algorithm is heavily dependent on the heuristic function being correct, even a slight error can make the resulting path inaccurate. The A* algorithm has found popularity in two major fields: video games [23] and robotics [24,25].
4. AN OVERVIEW OPTIMIZATION FOR ROUTING
4.1. Genetic Algorithm
GAs are inspired by the concepts of survival of the fittest and evolution, using the core philosophies of selection, mating and mutation [14,26]. A GA consists of a population that adapts solutions to a specific problem over the course of several generations. The solutions are ranked through an evaluation function in which only a specific number of solutions survive from generation to generation mimicking the idea of survival of the fittest. A GA is comprised of four main parts: Evaluate, Selection, Crossover and Mutation as seen in Figure 6.
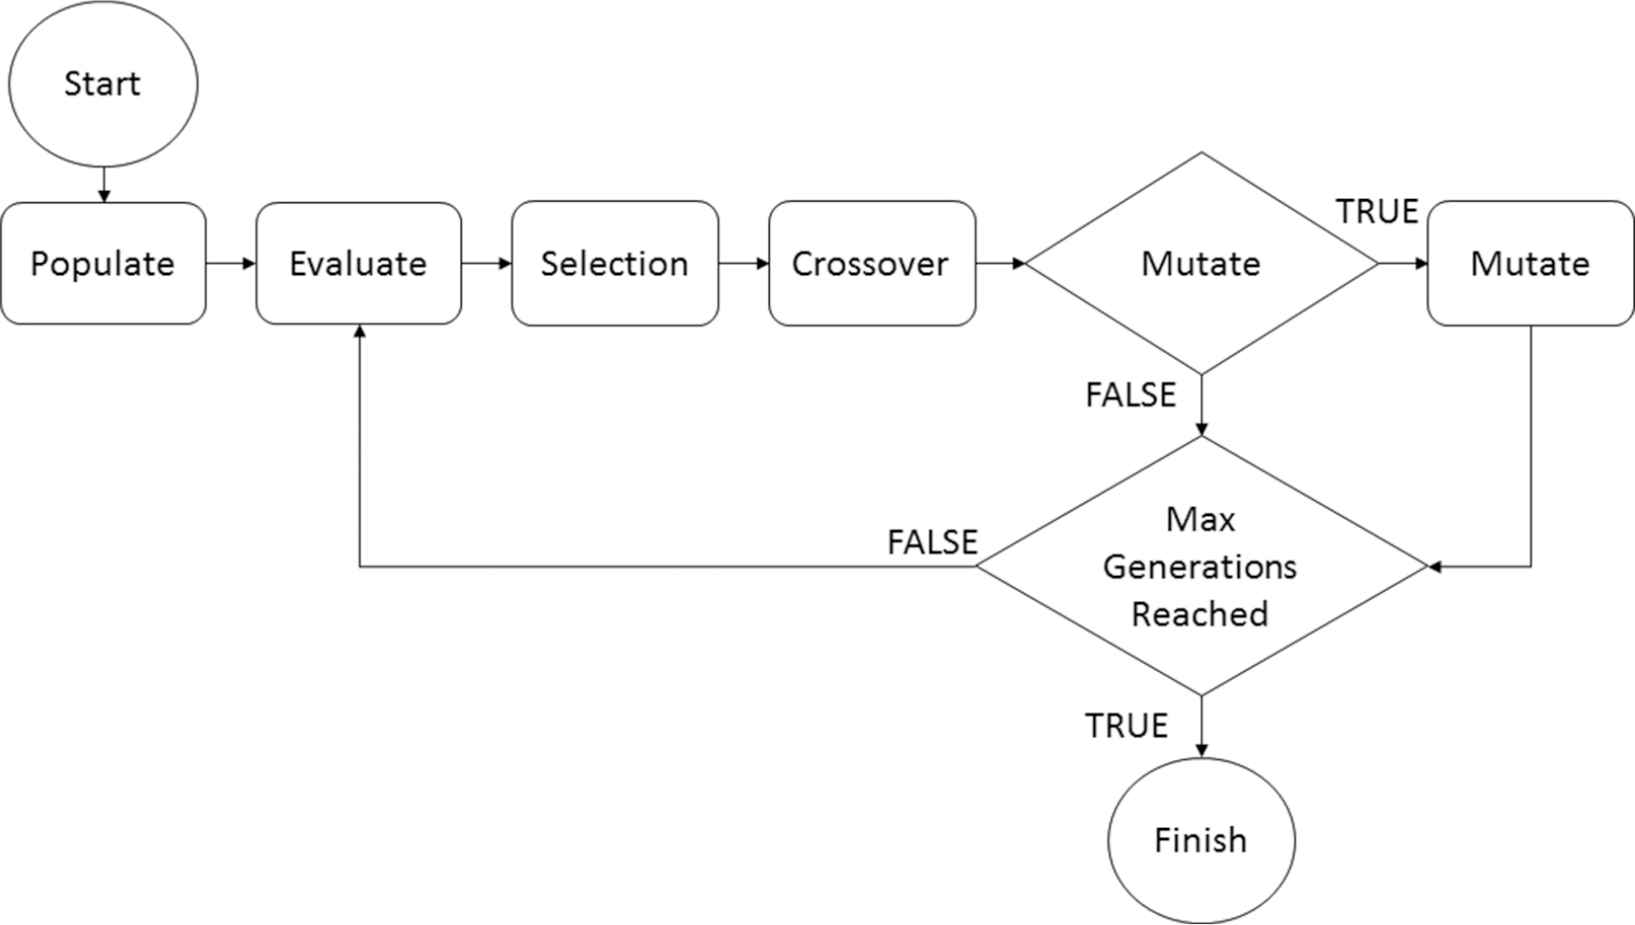
An overview on genetic algorithms.
The solutions in the population are represented by chromosomes which are in turn comprised from a set of genes. Each gene represents a specific segment of information regarding to the solution. These genes can be represented as strings, binary values or real numbers and are chosen according to the problem domain. The information stored within the genes are passed on through the process of crossover, similar to concept of mating in the animal kingdom. When two chromosomes are selected to produce offspring, they will produce two offspring which are comprised partially from each of their parent's genes. Once the crossover is completed, the offspring chromosomes now represent new solutions to the problem.
Pairs of chromosomes can be selected for crossover through several different methods including a tournament or a roulette wheel. Most selection methods take into account the fitness score of each chromosome. Fitness scores are determined by some specific metric, which is a value that needs to be minimized or maximized. Each evaluation method is created specifically for each problem. Just as in nature mutation can occur during the crossover process, mutation will randomly change some genes within a child chromosome. The purpose of mutation is to provide solution diversity and to help avoid a local minima situation.
Within GA's there are usually four tunable parameters: Max Population, Number of Generations, Crossover Point and Mutation chance. The Max Population parameter sets a limit to the number of chromosomes allowed within the general populous. The Number of Generations parameter sets a limit to the number of times the whole population will go through the selection, crossover and mutation process. The Crossover Point parameter determines how much of each parent will be passed onto the offspring. The Mutation chance sets how likely it is for an offspring chromosome to mutate.
Through multiple generations of selection, crossover and mutation the more familiar process of evolution will begin to occur. This will allow for the best solutions to a problem to rise to the top of the gene pool and become the most dominant solutions. After the predesignated number of generations, the process will stop returning the solutions with the best fitness score. GA's have had successes in many different fields including antenna design [14], routing [6] and workforce optimization [27] to name a few.
4.2. Simulated Annealing
Simulated Annealing was designed by S. Kirkpatrick in 1985 [11]. The basis of Simulated Annealing comes from the statistical modelling of annealing of solids such as iron in smiting or silicon in semiconductor manufacturing. The roots of the algorithm are based in the Metropolis Algorithm [28] using some of the same concepts. The basic principle of annealing is by heating or introducing energy to an object so it can be manipulated into a different shape. As this object cools it slowly loses its ability to be changed, with larger changes being more difficult to make over time. As the energy or heat finally reduces to a low state it becomes impossible to make changes to the object without compromising its integrity [29].
Simulated Annealing takes the cooling process of annealing and turns it into an optimizsation strategy. The solution is represented much in the same way as in GA's, with a chromosome and genes. Where the chromosome acts as the combination of genes, with the genes encoding specific information about a solution to a problem. The key point with Simulated Annealing is there is only one working solution that can be modified.
The solution changes over time through the use of two operators, the first of these operators makes a change to the solution by changing one of the genes in the chromosome. The new solution is then evaluated for fitness. The second operator chooses whether or not this change is accepted. The acceptance criteria is based on the Boltzmann probability factor [30].
The parameters set when the algorithm starts are Temperature which tends to be a very high value, Cooling Rate which is a value between but not including 0–1 and finally the Threshold is a very small number. The two operators happen in an iterative process, while the Temperature is above the Threshold, Temperature is reduced by multiplying it by the Cooling Rate at the end of each iteration.
Simulated Annealing has been used for a variety of different problems, but has had significant success in routing. With algorithms being developed for multimedia communications [31], QoS routing [32] and the more generic TSP [33,34]. They all have some operational parameters in common, by representing the route as a set of nodes in sequence with their associated costs.
5. THE PROPOSED NNIR ALGORITHM
The algorithm, as shown in Figure 7, consists of two major components: Dijkstra's Algorithm and the GA. The algorithm starts by passing a start and finish locations to Dijkstra's Algorithm. If a route cannot be found by Dijkstra's Algorithm it determines there is no possible route and the algorithm halts. If a route is found, it is then stored for later use. All nodes from the Dijkstra route, with the exception of the start and finish nodes stored for later use, are disabled from the graph. By disabling them it allows for Dijkstra's Algorithm to find a new independent route if any are applicable. This process is completed N times with N denoting the number of total required routes. At the end of this process the stored routes are passed into the GA.
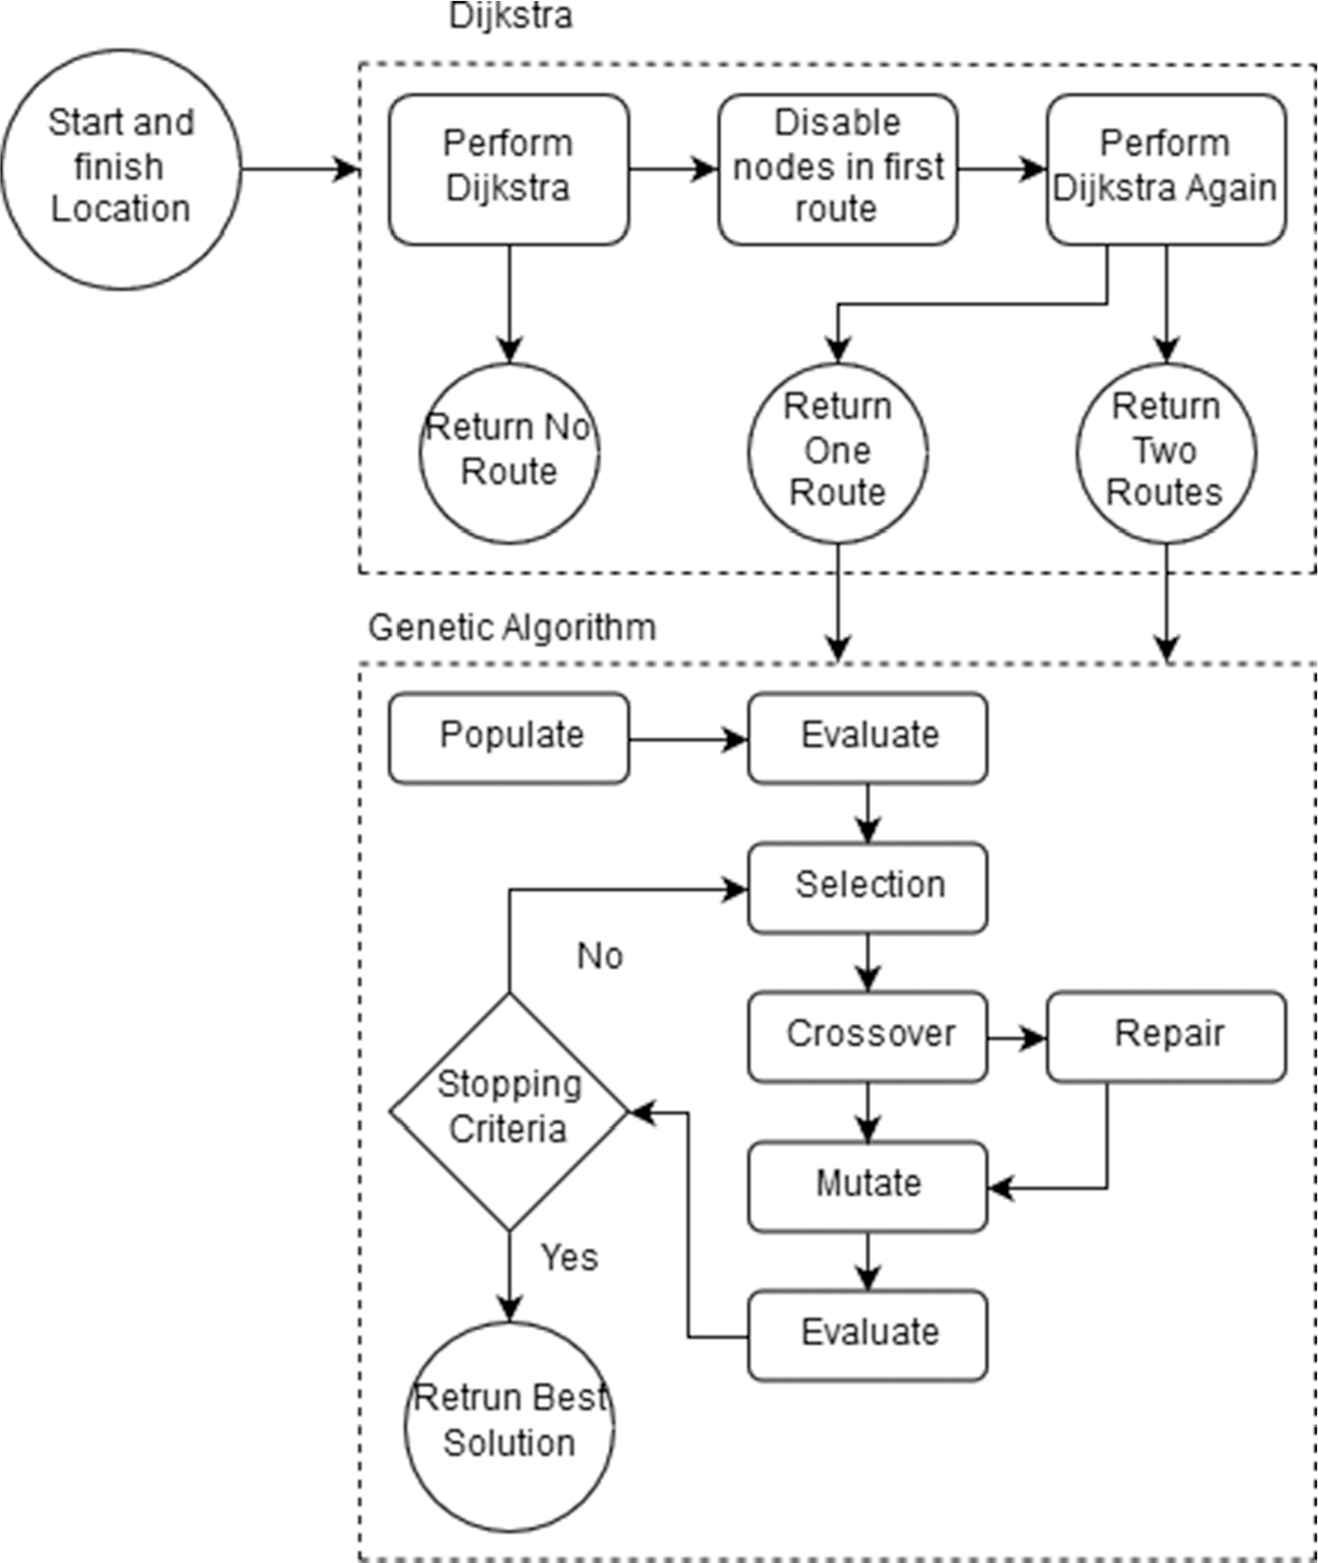
An overview on the proposed N-Non-Intersecting-Routing (NNIR).
In the proposed algorithm, the gene pool is comprised of solutions, with each solution being comprised of one or more chromosomes. The chromosomes are comprised of a set of nodes, or vertices, which represent the steps in a route. A single chromosome can be seen in Figure 8. These chromosomes are flexible and can vary in length and change dynamically as the solution demands. The chromosomes, in a single solution, represents N-1 routes as the last route for every solution is found using Dijkstra's Algorithm. Hence, we don't need to include this in the set of chromosomes.
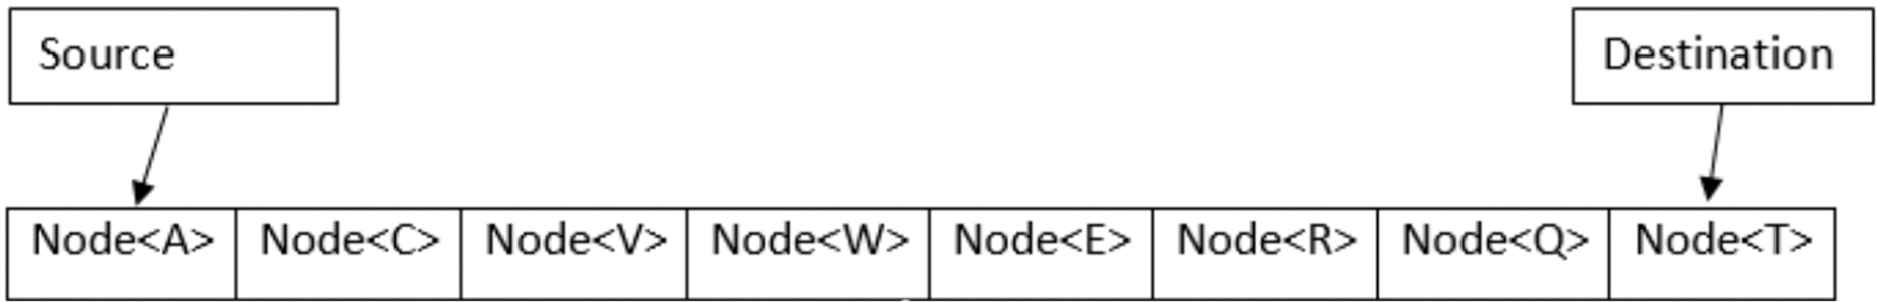
An example of chromosome.
Each route within a single solution has its own chromosome, so if there are three desired routes there will be two chromosomes per solution. The population process is vital to getting enough genetic diversity within a set of valid solutions, to sufficiently explore the solution space. The Population process uses the sorted routes as a starting point, along with the route from Dijkstra's Algorithm. A portion of the nodes are removed at random from the graph. There are three conditions to this occurring: on this removal process the start and finish nodes can't be removed. Secondly, at least 10% of the nodes in the graph must be removed. Finally at least 10% of removed nodes (1 node being a minimum) must come from the shortest path. Dijkstra's Algorithm is then used once a set of nodes have been disabled. The resulting route is set as a member of the population, if there is not an identical route already in the population. This process continues to generate solutions until the required members of the population have been generated for the initial population.
The evaluation process uses the value of each connection or edge. The evaluation equations (Equations 1 and 2) denote how the cost is calculated. The total cost of a solution is comprised of two portions which are the cumulative cost (CC) (the cost of all nodes within the solution) and the Route Discount (RD). The RD is equal the Desired Number (N) of routes minus the number of routes in that solution (SR). RD can be written as follows:
The total cost is the CC to the power of the RD. The total cost can be written as follows:
The RD is required to exponentially penalize solutions with less than the desired number of routes. Finally, as most routing situations are inherently minimization problems, the total cost equation results in a value in the interval [0, 1]. The selection process that uses this evaluation method is a survival of the fittest tournament. With the best scoring solutions being the highest ranked solutions.
The crossover operator is key to exploiting the best information within the chromosomes. A Crossover Point is selected at random within each chromosome. For example, if we have a solution with two chromosomes C1 and C2, C1 in the first solution is crossed with C1 in a second solution, and C2 in the first solution is crossed with C2 in the second solution. C1 and C2 are never crossed as they are completely separate sub-solutions. Crossover of two chromosomes are shown in Figure 9 with Parent One and Parent Two creating two offspring.
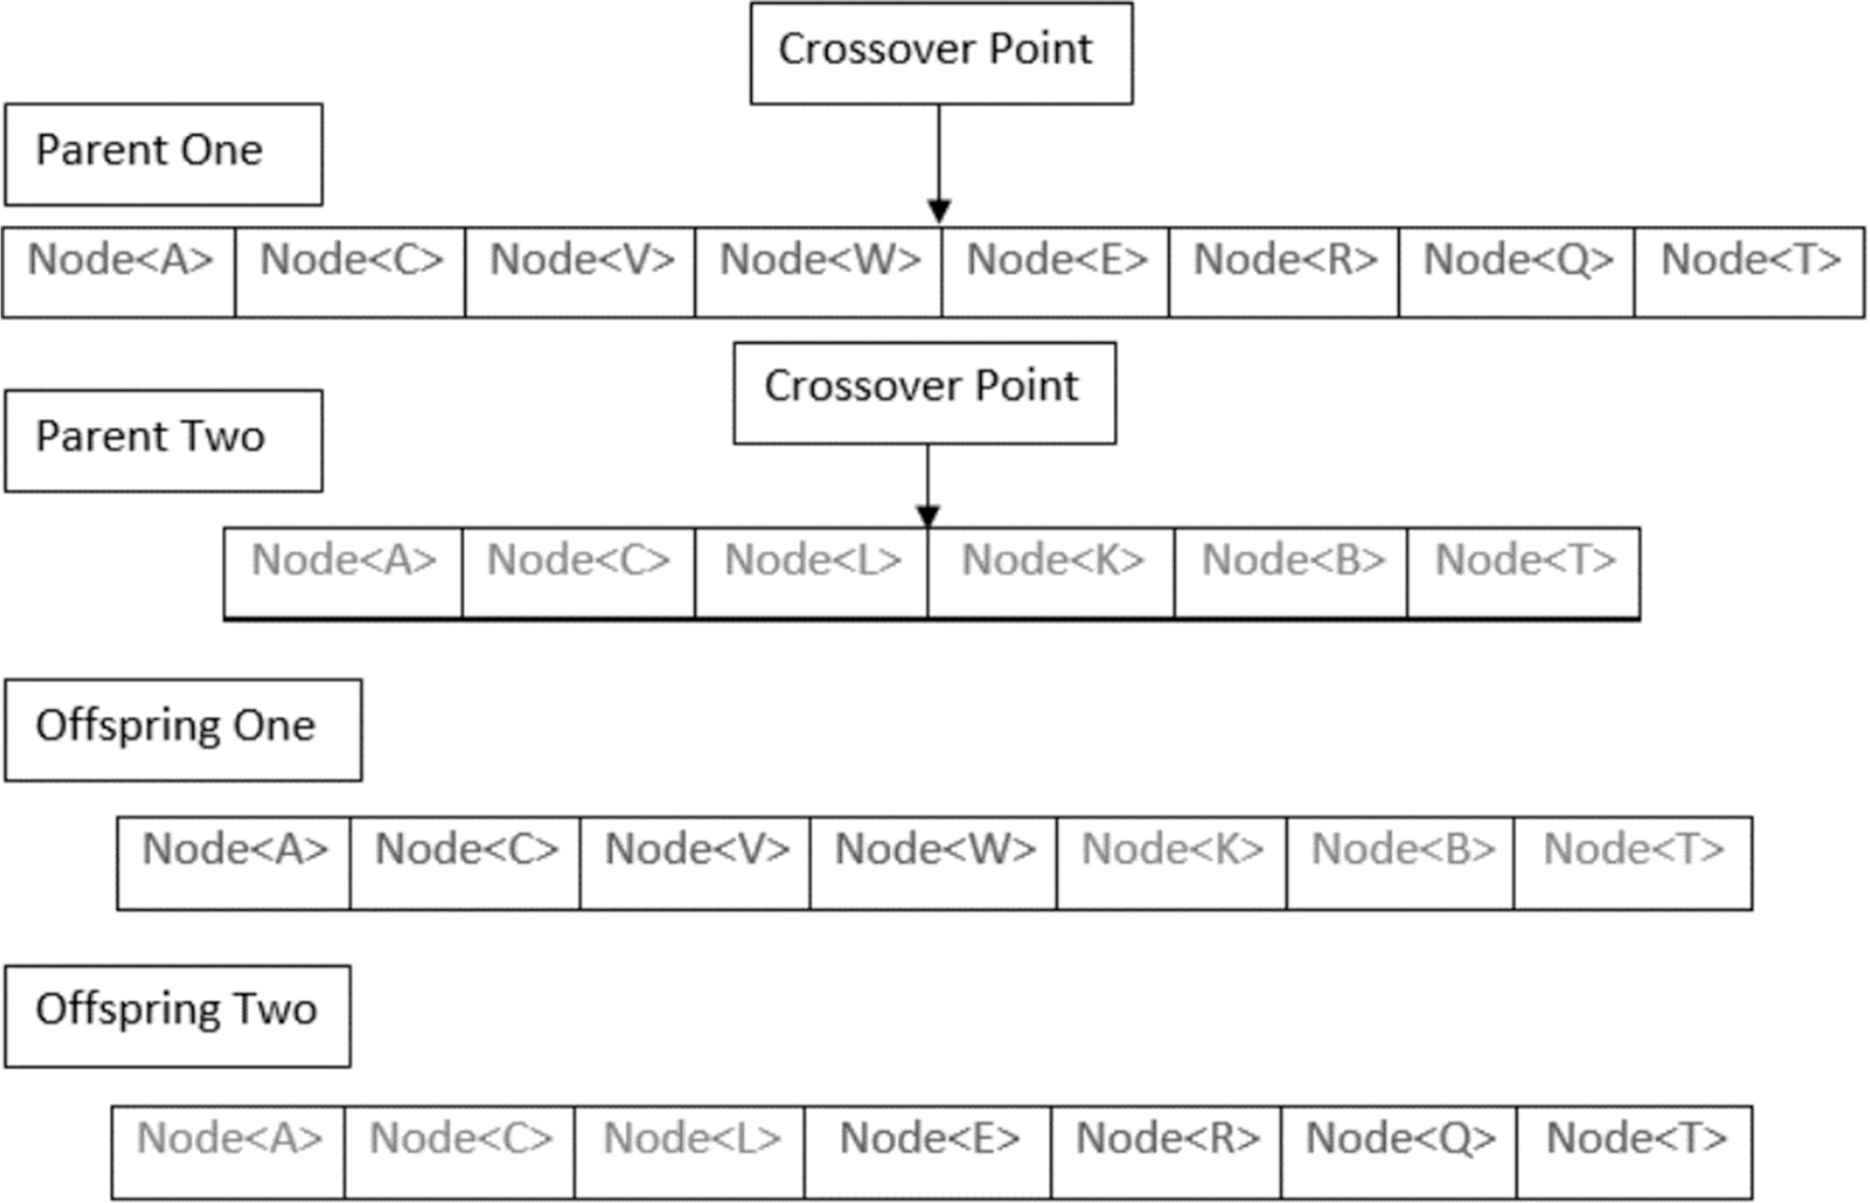
Crossover visualization.
Crossover is good for the exploitation of the current information within the solution space. But there is a need for Mutation allowing for the algorithm to explore new areas of the solutions space. The Mutation operator is simple but effective. A node from a chromosome is selected at random within the range of [2, length-1] where length refers to the last gene within the chromosome. The selected node is then removed from the list and replaced by a different node. This new node is selected by looking at all the nodes connected to the selected-1 node, or the node prior to the selected node within the chromosome. If there are no nodes available to replace the selected node, then a new node is picked to be the selected node. This new node is again selected at random in the same way as the method as the previous selected node, although any previously select nodes are excluded from the selection process. If none of the nodes within the chromosome can be replaced then no mutation is possible and the operator exits.
5.1. Repair Operator
The repair operator is an integral part of the proposed algorithm. Without it, the search times required are much larger. The primary purpose of the repair algorithm is to reduce incorrect chromosomes throughout the population. This is achieved in two ways which we shall name loop removal and reconnection.
Loop removal is a very simple but effective way of reducing invalid chromosomes or solutions. Figure 10 shows the loop removal repair method. One of the key constraints upon the problem of Resilient Routing is that no vertex or edge within a graph can be used more than once. Due to the nature of crossover and mutation within the system it is common for loops or cycles to occur within the graph, thus violating this constraint. The genes that make up the cycles are removed from the chromosome, therefore potentially creating a valid solution, but ultimately adhering to the constraint.
Loop removal visualization.
Reconnection is the more powerful of the two repair methods. The method iterates through the genes within the chromosomes to find if any gene is not connected to the next gene. If such a gene is found then Dijkstra's Algorithm is run between the disconnected genes, in an attempt to reconnect them. These new genes are then inserted into the chromosome in between the disconnected genes. The key constraints of Resilient Routing still apply, and if a chromosome uses the same edge or vertex more than once then the loop removal method is run again.
Due to the constrained nature of the graphs the chromosomes are extremely fragile and are prone to inaccurate solutions. The primary reason for the repair operator is to reduce search times and increase the number of valid chromosomes within the gene pool.
6. EXPERIMENTS AND RESULTS
NNIR has been compared to three other methods for two reasons, the first is to have a baseline to compare NNIR against. This is to help comprehend the possible improvements that NNIR can have over traditional routing methods for Resilient Routing. Secondly, to see how the GA within NNIR compares against another evolutionary strategies.
The experiments consist of two core comparisons: firstly, a total cost comparison and secondly the emergence of a Resilience Route where one was not previously available. The baseline routing is shown by two traditional routing algorithms: Dijkstra's Algorithm and the A* algorithm. Then the evolutionary methods are NNIR and Simulated Annealing.
Simulated Annealing has had success in the other routing problems such as the Traveling Salesmen Problem [33,34] so it is a sensible choice for comparison. Simulated Annealing has been given the same repair operator that is present within the NNIR GA. This gives Simulated Annealing the same chance as NNIR to make changes to its solution whilst also remaining valid. Simulated Annealing uses the same process as the Mutation process from the GA to change the genes within its solution. This is so that the changes are, again, similar to the way they are committed within NNIR, alongside helping keep it as close to a valid solution as possible. Just as with NNIR the final resilient route is found using Dijkstra's Algorithm.
The experiments undertaken are for a two-route scenario (i.e. N is 2) so there is a Primary Route and Resilient Route. During the experiments three metrics are recorded: the cost of the Primary Route, the cost of a single resilient route and the total cost. One extra metric is recorded for Simulated Annealing where it counts the number of discrete valid solutions.
The experiments are completed with the use of two data sets: a Telecoms Data set, provided by British Telecom (BT). The other data set is an open source data set provided by Ordinate Survey of the road network from the town of Exeter, UK. The Telecoms Data set are the origins of the Resilient Routing problem and illuminated the need for this type of routing algorithm. The Ordinate Survey data set is used for two reasons: firstly, it shows that the algorithm is applicable to many different domains, secondly the Ordinate Survey data is available online for free, so anyone is capable of recreating these experiments [35].
The routes have been picked at random and no route is duplicated, giving us independent testing scenarios. There are a total of 250 discrete routing scenarios for the Telecoms Data set, and 500 discrete routing scenarios for the Ordinate Survey data set. This section is broken down into several sub areas, the first regard the situation where no resilience can be established using Dijkstra, this is known as the blocking example. The second is concerning the situation where Dijkstra finds a sub-optimal solution, this is known as the cost reduction example. The third is concerning the combined results of both subsections and gives a total over view of the results. The final area is a visualization of the problem and solution on the Telecoms data set.
Table 1 shows that the NNIR algorithm has the largest number of solutions with a Resilient Route in both data sets. NNIR has a 20% improvement over Dijkstra's Algorithm on the telecoms data set, and a 12.6% improvement on the road data set. Simulated Annealing is capable of solving this problem on the telecoms data set, but is unable to present any new solutions for the road data set. It seems reasonable to hypothesize that Simulated Annealing doesn't perform as well on this problem when the chromosome becomes much larger. Both Dijkstra's Algorithm and the A* algorithm have the same results on both data sets, this is due to similarity's in the algorithms. Due to the particular nature of the Road data set, many roads within the UK are dead ends (dead ends are roads with the same entrance and exit), therefore all algorithms perform worse than on the telecoms data set, as they can't find a Resilient Route on these roads.
| Percentage of Cases Where Resilience Was Found |
||
|---|---|---|
| Telecoms | Road | |
| Dijkstra | 50% (125/250) | 24.2% (121/500) |
| N-Non-Intersecting-Routing (NNIR) | 70% (175/250) | 36.8% (184/500) |
| A* | 50% (125/250) | 24.2% (121/500) |
| Simulated Annealing | 64% (160/250) | 24.2% (121/500) |
The number of solutions where the given algorithm finds a resilient route across both data set.
The blocking example is defined as the situation where Dijkstra's Algorithm can only find one route between two locations although more than one is available. This is due to Dijkstra's Algorithm using all of the cheapest infrastructure between two points and blocking the creation of any additional routes.
The blocking example is resolved by increasing the cost of the primary line, thus allowing a resilient line to be formed where applicable. Figure 11 shows the distribution of primary route cost increases in percentages. Both data sets are represented within the graph, the first one (Blue) is the Telecoms dataset, the second (Orange) is the Road dataset. The majority of cases in the Road data set are within the 0–1% range, therefore in most cases by increasing the cost of the primary line by a very small percentage it allows for a resilient line to be found. In contrast the Telecoms data set is nowhere near as clustered where most cases being distributed between the 2–3% and the 10–11% range.
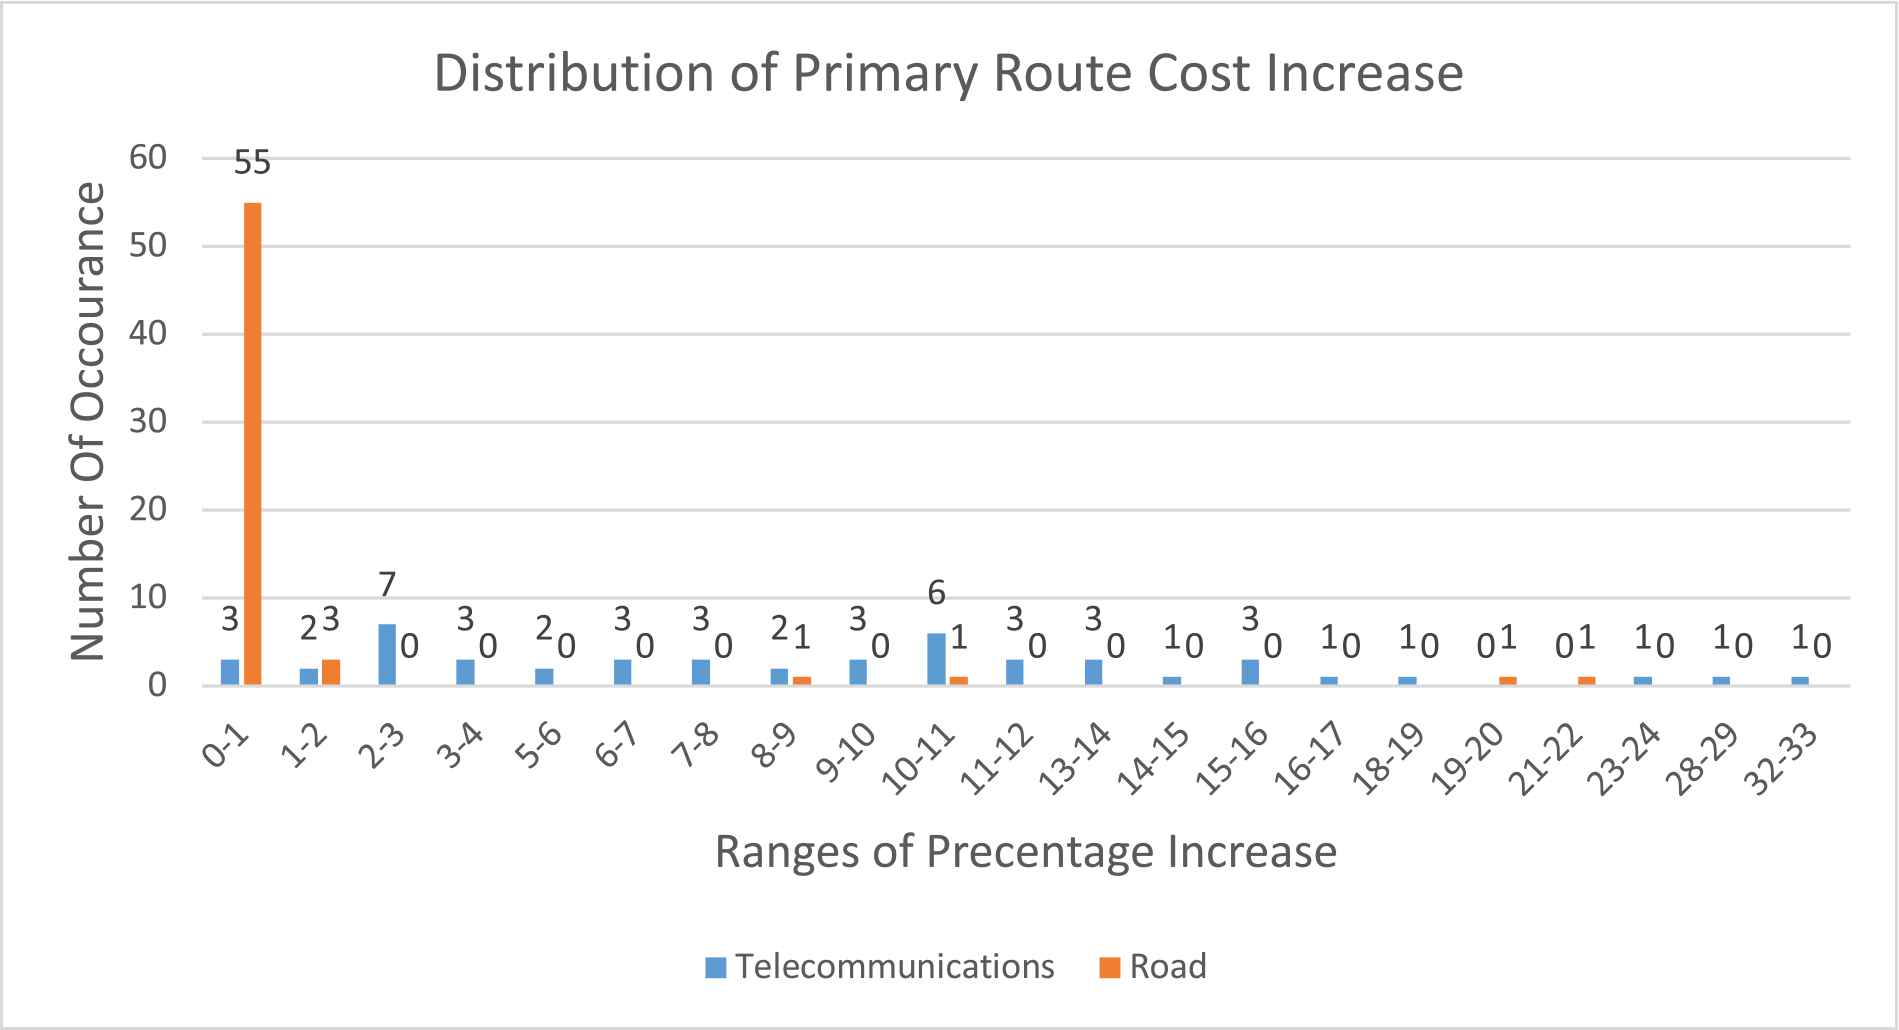
Distribution of primary route cost increase as part of the blocking example solution (a scenario where Dijkstra can only find one route between two locations).
The Cost Reduction example is a scenario where the desired number of routes can be found by Dijkstra's Algorithm although due to the greedy nature of Dijkstra it is not the cheapest solution when all routes are considered together. The following experiments compare NNIR, A* and Simulated Annealing to a bassline result from Dijkstra's Algorithm.
Table 2 shows the total number of cases where the cost of each algorithm is less then Dijkstra. NNIR has the best reduction in total cost on both data sets, with 18.0% on the telecom dataset and 17.8% on the road dataset. There is no improvement upon Dijkstra's Algorithm in regard to the A* algorithm on either data set. Simulated Annealing on the other hand has an improvement on 0.6% of cases on the Road dataset, although it didn't find any improvements on the Telecoms dataset.
| Percentage of Cases with a Reduction in Total Cost vs Dijkstra |
||
|---|---|---|
| Data Set | Telecoms | Road |
| NNIR | 18.0% (45/250) | 17.8% (89/500) |
| A* | 0.0% (0/250) | 0.0% (0/500) |
| Simulated Annealing | 0.0% (0/250) | 0.6% (3/500) |
Percentage of cases with a reduction in the total cost when compared to Dijkstra's Algorithm in the cost reduction example [a scenario where more than one route can be found by Dijkstra although N-Non-Intersecting-Routing (NNIR) can reduce the total cost].
Figure 12 shows the distribution of cases in which NNIR had a reduction in cost when compared to Dijkstra, therefore showing the total decrease in cost across both the Primary and Resilient Routes. The majority of cases for the Telecoms data set are a small reduction of cost, reducing the total cost by 0–1%. Whereas the Road data set is spread across the range, with some routes having a smaller total cost reduction, and other having a much larger total cost reduction.
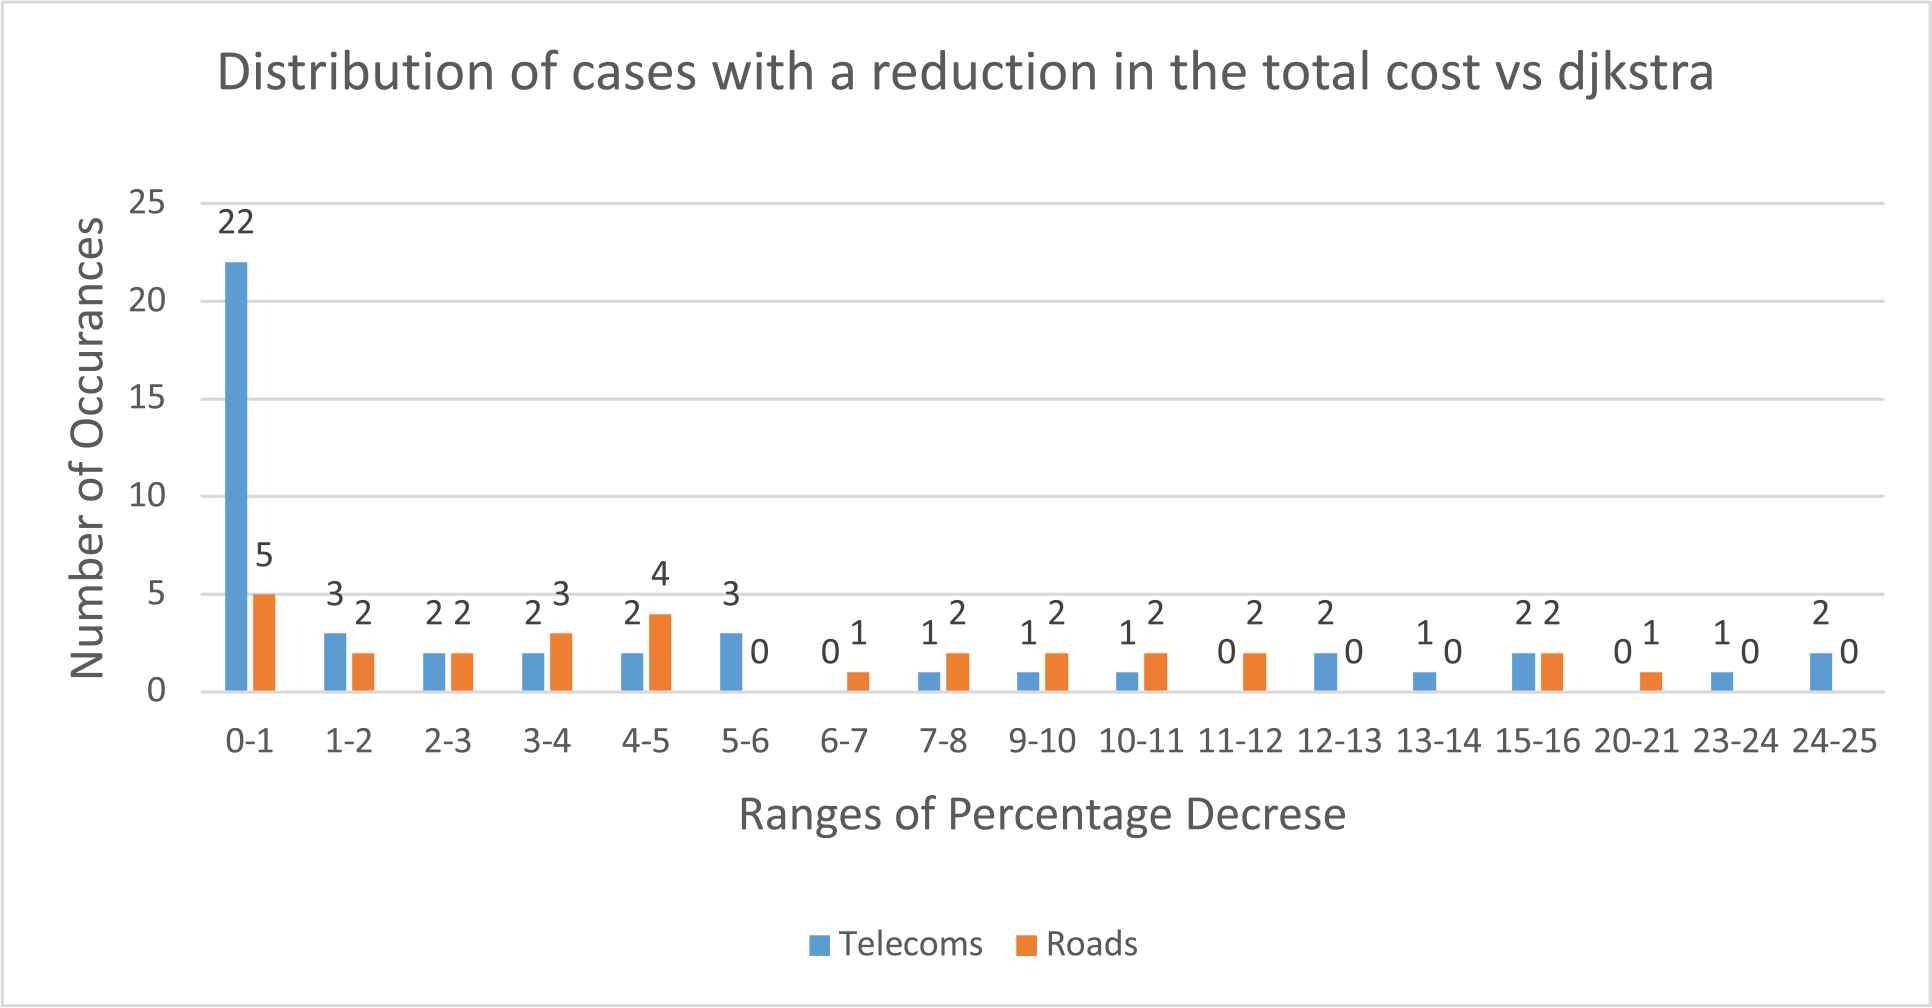
Distribution of cases with a Reduction in Total Cost N-Non-Intersecting-Routing (NNIR) vs Dijkstra's Algorithm for the cost reduction example (a scenario where more than one route can be found by Dijkstra although NNIR can reduce the total cost).
To reduce the total cost of a route the Primary Routes cost must be increased to allow for other the Resilient Route to use cheaper routes. Figure 13 shows the distribution of the percentage increases of the Primary Route. The majority of the Road data increases the cost of the Primary Route between 0% and 1% and it is mostly clustered toward the lower end of the scale. Whereas the Telecoms data set is spread across the scale with one case having an increase of 80–81%.
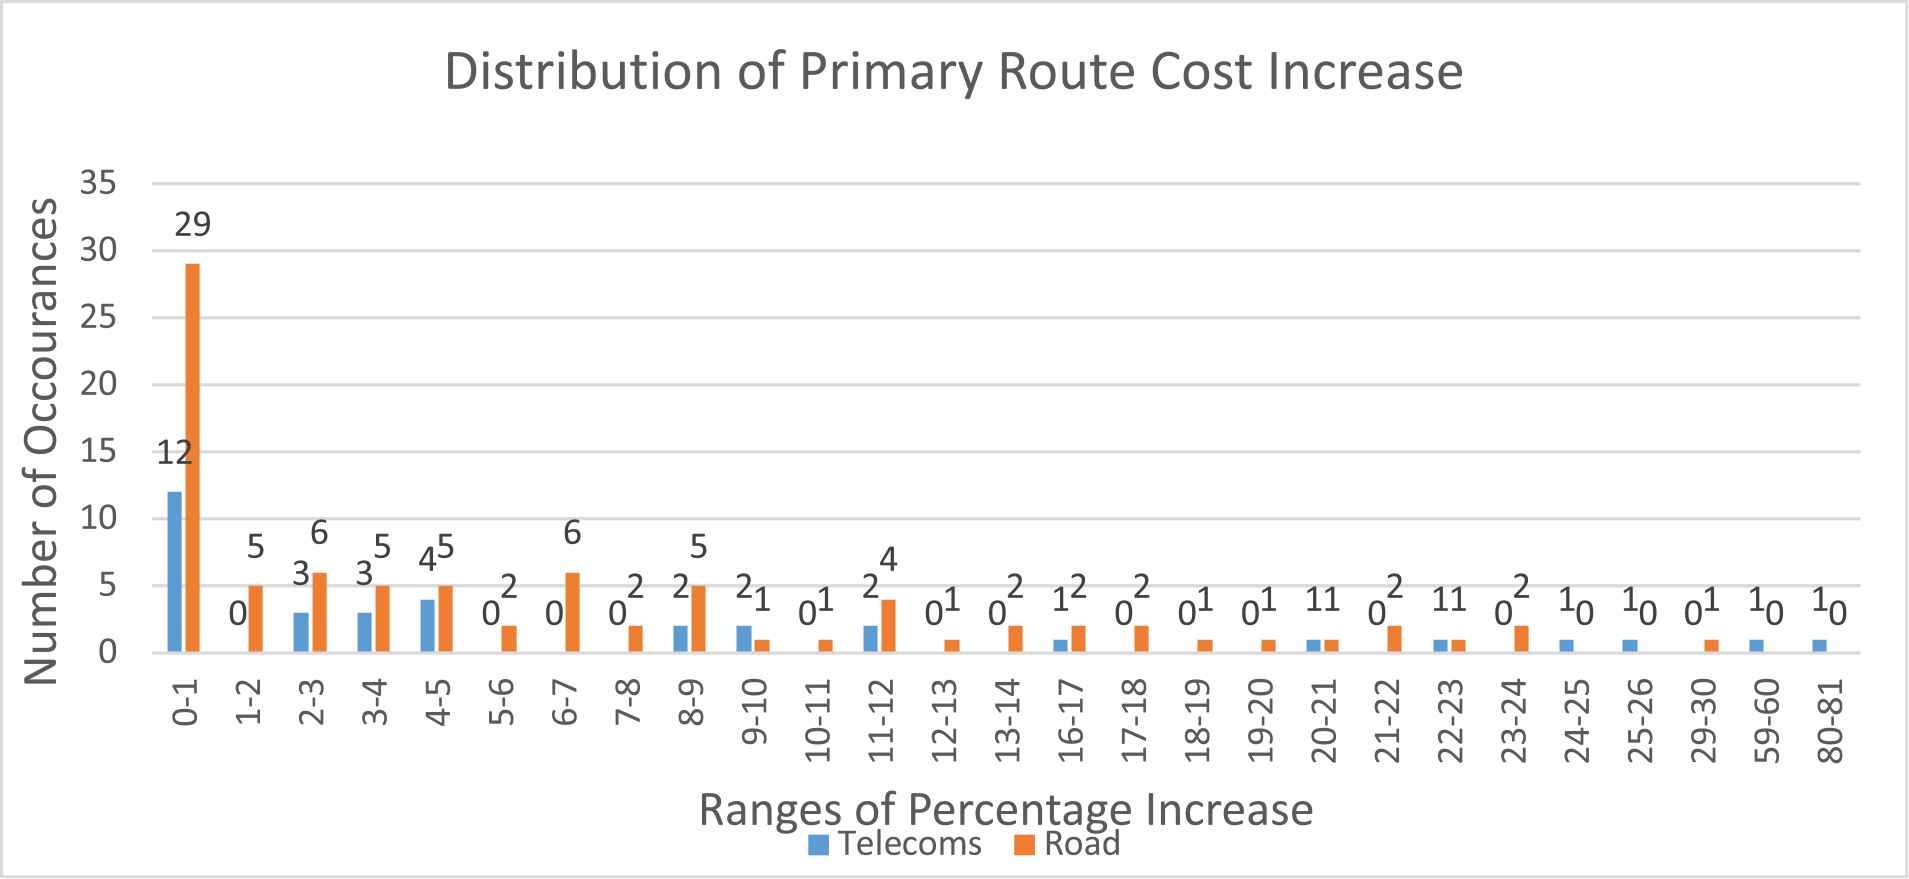
Distribution of primary route cost increase as part of the solution to the cost reduction example [a scenario where more than one route can be found by Dijkstra although N-Non-Intersecting-Routing (NNIR) can reduce the total cost].
Table 3 demonstrates the improvement made by the combination of both the blocking and cost reduction examples. By combining both situations where NNIR outperforms Dijkstra the total output of 38% on the Telecoms data set, and 30.4% on the Road data set. NNIR was designed with the intention of being used on the Telecoms data set which shows in the results, although the Road data set indicates that it is applicable in other domains that can be represented as a graph. Additionally, due to the highly constrained nature of this problem, it seems reasonable to suggest that population base evolutionary algorithms perform much better. The primary purpose of the NNIR algorithm was to reduce costs, but these experiments show that it is also very capable at finding new Resilient Routes where Dijkstra couldn't (Blocking Example).
| Telecom | Road | |
|---|---|---|
| Total Improvement | 38% (95/250) | 30.4% (152/500) |
Total improvement of N-Non-Intersecting-Routing (NNIR) over Dijkstra on resilient routing problem when a total improvement is defined as a combination of the blocking example and the cost reduction example.
Figures 14a through 15b are all screenshots from a visualization of the telecoms data set, they show the two examples where NNIR excels and Dijkstra's Algorithm struggles.
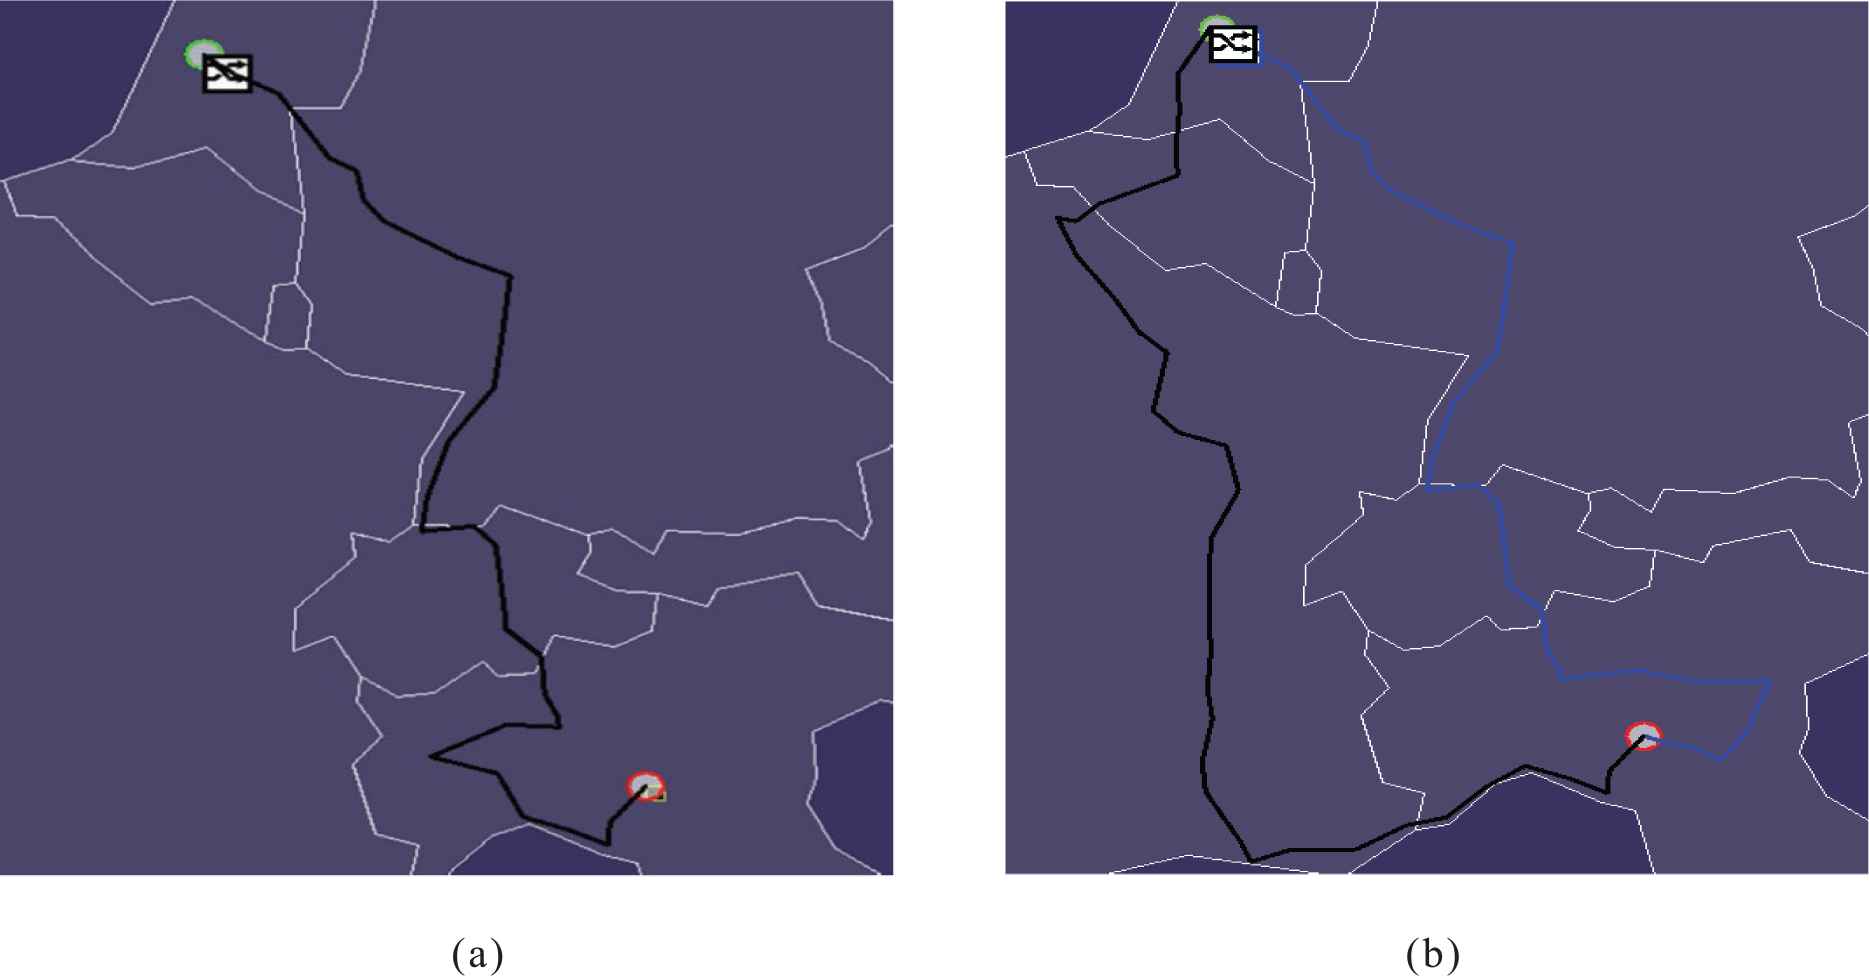
Shortest path available when using (a) Dijkstra's algorithm (the blocking example) and (b) N-Non-Intersecting-Routing (NNIR) (the blocking example).
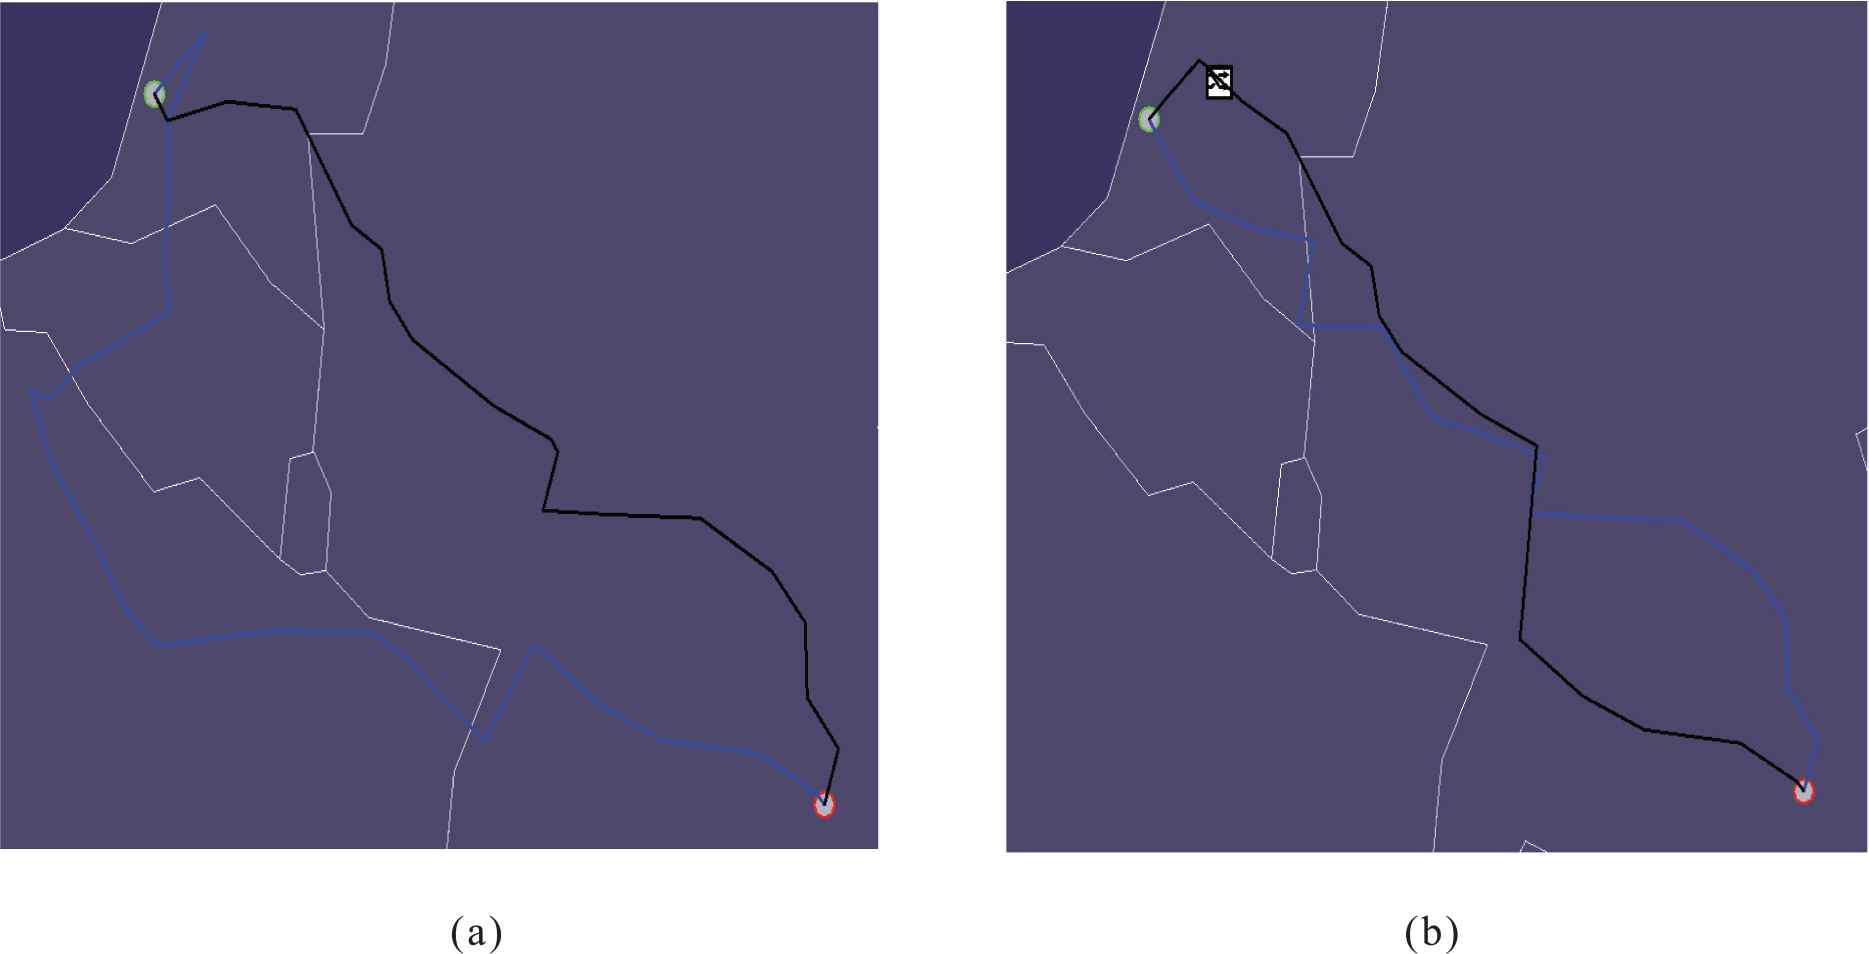
Shortest path available when using (a) Dijkstra's algorithm (the cost reduction example) and (b) N-Non-Intersecting-Routing (NNIR) (the cost reduction example).
Figure 14a and 14b show the blocking example a scenario where Dijkstra's Algorithm can only find one route between the two locations. Figure 14a indicates that Dijkstra's Algorithm is unable to find more than one route between the start and finish locations. Figure 14b is a visualization of the solution by the proposed NNIR algorithm. NNIR is supplied the same start and finish locations as Dijkstra's Algorithm and finds two routes.
Figure 15a and 15b show the scenario where more than one route can be found by Dijkstra allowing for cost reduction to occur (the cost reduction example). Figure 15a supplies two routes this time, but the shortest route is by far the primary route (indicated by the color Black). Figure 15b shows the solution by the proposed NNIR algorithm routes a longer Primary Route, and a much shorter Resilient Route, giving a total reduced cost.
7. CONCLUSIONS AND FUTURE WORK
Network connectivity is an important part of everyday life. Within a modern society people use a network connection for a wide variety of tasks including work, leisure and financial transactions. Corporate entities use network connections throughout their business, these can be for connections between data centers, offices and logistic centers. These corporate customers expect these connections to be of a high quality and uninterrupted. Although this system can be used in many different domains not just networks, the core of resilience can be applied to any system which can be represented as a graph. These other systems can include logistics, transport and even embedded systems.
In this paper we have proposed a novel system to help prevent down time and increase network resilience. This system is based upon the combination of Dijkstra's Algorithm and GAs, with the addition of a new operator “The repair operator.” The core idea of NNIR is to reduce the cost of multiple routing through a graph, by evaluating all routes as a single solution.
In this paper we have presented a number of experiments comparing the proposed NNIR Algorithm to Dijkstra's Algorithm, the A* algorithm and Simulated Annealing. NNIR outperforms each of these algorithms in the Resilient Routing problem. NNIR out performs Dijkstra's Algorithm by 38.0% on the Telecoms data set and 30.4% on the Road data set giving an average improvement of 34.2%. Additionally, NNIR outperforms the A* algorithm by 38.0% on the Telecoms data set and 30.4% on the Road data set giving an average improvement of 34.2%. Finally, NNIR outperforms Simulated Annealing by 34% on the Telecoms data set and by 19.8% on the Road data set giving an average improvement of 26.9%.
The proposed system can in the future be expanded by using Multi-Objective GAs such as NSGA-II. In addition, the system could be expanded to look at data uncertainty using type 2 Fuzzy Logic.
CONFLICT OF INTEREST
The author declares no Conflicts of Interest.
AUTHORS' CONTRIBUTIONS
Lewis Veryard—main author and creator of the proposed algorithm. Hani Hagras—PhD Supervisor and without is guidance, this couldn't have been done. Andrew Starke—workflow supervisor at British Telecom until he left. Anthony Conway—new Workflow supervior at BT. Gilbert Owusu—BT PhD Supervisor.
Funding Statement
This work is funded by BT.
REFERENCES
Cite this article
TY  - JOUR
AU  - Lewis Veryard
AU  - Hani Hagras
AU  - Andrew Starkey
AU  - Anthony Conway
AU  - Gilbert Owusu
PY  - 2020
DA  - 2020/03/17
TI  - NNIR: N-Non-Intersecting-Routing Algorithm for Multi-Path Resilient Routing in Telecommunications Applications
JO  - International Journal of Computational Intelligence Systems
SP  - 352
EP  - 365
VL  - 13
IS  - 1
SN  - 1875-6883
UR  - https://doi.org/10.2991/ijcis.d.200313.001
DO  - 10.2991/ijcis.d.200313.001
ID  - Veryard2020
ER  -