
Solution to Resolve Cognitive Ambiguity in Interactive Customization of Product Shape
- DOI
- 10.2991/ijcis.d.200511.001How to use a DOI?
- Keywords
- User customization; Decision-making; Product shape design; Cognitive ambiguity; Interactive genetic algorithm
- Abstract
Interactive genetic algorithms have been used in a wide variety of applications and extensively developed to facilitate the personalization and customization of products for users. However, the ambiguity effect or cognitive ambiguity of users during the product customization process will affect the effects of the final customized product. Here, we first deconstructed the ambiguity effect into cognitive ambiguity during early decision-making and that during the decision-making process. A spatial mapping strategy that involves “text-image-symbol” and a clustering strategy were then proposed to mitigate cognitive ambiguity in the two different stages, respectively. Then, a specific application example—“Chinese vase design” was studied. Based on the proposed strategy and interactive genetic algorithm, a prototype of computer-aided design system for product modeling was developed by MATLAB software. Then, 10 users were invited to experiment at three different cases (not using the proposed strategy, using spatial mapping strategy, using spatial mapping strategy and scheme clustering strategy). The experiment results have verified that the spatial mapping strategy was efficient to solve cognitive ambiguity during early decision-making, and clustering strategy was efficient to solve cognitive ambiguity during the decision-making process.
- Copyright
- © 2020 The Authors. Published by Atlantis Press SARL.
- Open Access
- This is an open access article distributed under the CC BY-NC 4.0 license (http://creativecommons.org/licenses/by-nc/4.0/).
1. INTRODUCTION
The modern consumer market is witnessing an increasing demand for products that are user-tailored. Personalization and customization have become the mainstream business model in the “Industry 4.0 era” [1,2]. This business model is one of the leading strategies used in production industries in today's competitive markets [3]. Allowing users to realize their preferences is one of the most important factors in carrying out personalization and customization, but quantifying and structuring the process are difficult tasks. Designers may find that it is challenging to identify the preferences and needs of users due to the difficulties that users experience in expressing their preferences, which can easily cause inconsistency between the intentions of the users and design setup scheme. At present, interactive genetic algorithms (IGAs) are used to address and formalize the design goals for identifying the preferences and needs of users. IGAs are an evolutionary optimization algorithm that considers subjective evaluation. Compared to other genetic algorithms, the main characteristic of IGAs is based on human intelligence and subjective evaluation, which can reflect the preferences and routines of users [4]. It has been widely used in many fields, such as image retrieval [5], partner robot [6], layout optimization [7], group decision-making [8] et al. In the operation of the customization design system, users can engage in cooperative optimization and carry out interactive tasks via a customization scheme of individual products. At the same time, users can manipulate the design process and customize a scheme that would meet their own needs [9]. Therefore, IGAs are an effective tool for the customization of product designs and allow the needs of users to be realized through design optimization.
At present, the application of IGA in user customization has achieved positive results. In related research, Hsiao et al. [10] used an IGA to propose a consultation and simulation system that facilitates the color planning of products which would allow designers to determine the best color plan for their product components and decorative patterns for their products. Dou et al. [11] combined a Kano model and an IGA to identify different customization attributes and sorted them based on their impact on customer satisfaction. They found that the process increases the rate at which customers are able to find a satisfying design, and the efficiency of customization is enhanced. Mok et al. [12] proposed a system that uses an IGA and fuzzy set theory to allow customers to co-customize fashion products from sketch to pattern design. Moreover, the application of an IGA in customization processes is often used to inspire design innovation. For instance, Cluzel et al. [13] used an IGA to design car profiles from the side view. Therefore, the creativity of car designers can be stimulated to explore new car silhouettes with a specific friendly and sportive personality based on coding of the silhouette genes with a Fourier method of decomposition of the shape contours. Kowaliw et al. [14] focused on ways to utilize an IGA to stimulate the creativity of users and design novel and personalized products. In summary, IGAs have tremendous advantages in product customization design. This is exactly how the IGA brings out the various benefits of human subjective factors. However, we still need to pay attention to some shortcomings brought about by the limited cognition of human during their participation, which makes evaluation more complicated.
In terms of customizing the design background based on IGAs, users are prone to providing inconsistent fitness evaluations. This issue originates from the difference in their detection of hidden targets before and after the fitness evaluation, which results in evaluation noise in the adaptation value and therefore harmful to the algorithm performance. Some scholars have proposed solutions to reduce the user's cognitive ambiguity. They mainly focus on improving the human–computer interface and the input method.
In terms of improving the human–computer interface, Takagi [15] proposed that users can not only enter adaptive values, but also specify that certain satisfactory attributes of individuals remain unchanged, and only optimized unsatisfactory attributes. This method is helpful for users to observe individuals better and to give individual adaptive values, but it has high requirements of user's operation. During the experiment, Watanabe [16] proposed that the target solution was placed in the center of the screen, and other solutions were placed around the target solution, so that users can easily compare the target solution with others, thereby causing the cognitive ambiguity a certain extent. However, this requires a known optimal solution. In the case of no optimization goal in the early stage of design, the kind of stimulus source is worth of further exploration.
In addition, in terms of improving the input method of fitness value, Denis [17] believed that the longer the user looked at the evolutionary individual, the more interested he was in it. Therefore, the gaze time was calculated by the eye tracker to calculate the evaluation value. This method reduces the user's burden yet with two questions, i.e., is there a positive correlation between gaze time and score, and is this prediction score really accurate? Both of them remain to be explored. Takagi [18] believed that letting users choose a natural number from 0 to 100 as the score increased the user's burden, so the evaluation range was reduced to 0–10, which makes the evaluation more humane. This type of method reduced the user's burden by improving the human–computer interaction method. However, in the entire operating scenario, the scope of evaluation is only one part of the human–computer interaction. Considering the user's awareness of the product itself before the evaluation is also what the human–computer interaction concerned.
In other methods, Dou and Chao [19] applied an IGA to the process of product customization to compensate for the evaluative noise caused by the cognitive ambiguity of the user by basing the IGA on the degree of hesitance in the decision-making process. As a result, they proposed a strategy based on the hesitancy degree that would eliminate the ambiguity. Dou et al. [20] also proposed a multi-stage interactive genetic algorithm (MS-IGA) to alleviate the fatigue of IGA users and reduce the noise in the evolution process. The algorithm divides a large number of groups of traditional IGAs (TIGAs) into several stages based on the different functional requirements. Yang [21] proposed that the user's cognition was gradual, and the user's early goals were not clear, so the evaluation noise was relatively large, and a large degree of ambiguity was used. With the clearness of cognition in the medium term, there was no noise, and the evaluation value was accurate at this time. While in the later period, the ambiguity used should be large again. This type of method fully considered the changes in the user's cognition during the evolution process, so it was obviously feasible to adjust the system's ambiguity, however, it ignores how to mitigate and avoid the user's uncertainty and ambiguity. For instance, in user-defined scenarios, users may be more concerned about the experience.
Apparently, eliminating cognitive ambiguity and relieving user fatigue are the key research directions of current studies on IGAs. The above studies have paid attention to the user's cognitive ambiguity in IGAs, and alleviated the cognitive ambiguity from different perspectives, all of which reflected the human-centered thinking. However, there are relatively few studies that unravel and deconstruct cognitive ambiguity in the different stages of the design process. The cognition and psychology of the users also differ in the period between the pre-design stage and design evaluation process. In addition, there are also differences in their needs at each stage. In the beginning, users need to quickly participate in the customization stage by determining their preferences and interests, while in the intermediate and later stages, they tend to find solutions that meet their needs in a shorter period of time because they have gradually expressed their preferences.
Compared with previous research, this paper mainly has the following three contributions: (1) this paper deconstructs cognitive ambiguity and gives detailed description of cognitive ambiguity during early decision-making and cognitive ambiguity during the decision-making process; (2) the “text-image-symbol” strategy and the clustering strategy are proposed to alleviate the two types of cognitive ambiguity; (3) s vase contour evolutionary design system is introduced, which provides users with the opportunity of “self-design.” And it has been proved through experiments that the computer-aided system with the strategy proposed in this paper has a better effect on alleviating user's cognitive ambiguity.
The remainder of the paper is organized as follows: In the second part, based on the cognitive fuzziness of the users in the different stages, two different stages of decision-making are analyzed, and strategies to reduce the two causes of cognitive fuzziness are also proposed. In the third part, a strategy proposed in this paper is applied to the outline of a vase based on a personalized and customized scheme, and an interactive evolution design system for product modeling is facilitated. In the fourth part, we invited participants for experimental verification. Our method is proven effective in mitigating cognitive ambiguity, reducing the evaluation time and relieving user fatigue which contribute to providing a solution for hidden problems with IGAs.
2. COGNITIVE AMBIGUITY
In the field of industrial design, it is not only important to have explicit knowledge of the product itself such as its function, performance, appearance, structure and color, but also implicit knowledge (also known as tacit knowledge) such as the emotions, purpose, expectations and perceptions of the user. Explicit knowledge is often structured, easily described, can be communicated, stored or accessed, while implicit knowledge is difficult to describe and express, and therefore cannot be easily shared. Implicit knowledge is also based on experience and the application of explicit knowledge; therefore, it is an indispensable aspect of product design [22]. However, the uncertainty and fuzziness of implicit knowledge itself cause fuzzy thinking when presented with implicit knowledge.
The fitness value in IGAs is user-determined. However, even with the best of human intelligence, there will inevitably be cognitive limitations and other problems. In the process of using IGAs, the user is also in a fuzzy state of thinking. The fuzzy cognition of the users means that the decision-making process is divided into two stages with the use of IGAs. In the initial stage of design decision-making, it is often difficult to describe the hidden goal itself and the definition of the design problem is not clear, which lead to the fuzzy cognition of the user in the initial steps of making a decision. The second stage is that in the entire process of evolution iteration, users often seek optimal solution that accords with their preferences through comparisons and making judgments when evaluating computer-generated schemes. This stage is the design decision-making process, and when repeatedly stimulated by a large number of schemes, the evaluator will experience cognitive overload which will result in cognitive ambiguity.
2.1. Cognitive Ambiguity in Early Decision-Making and Its Solution Strategies
In the management field, Smith et al. [23] were the first to describe the initial stage of a project in which the time between when work could begin on the implementation of an idea and the actual start of the work itself as the “fuzzy front end,” which is often used broadly to refer to both the exogenous reasons for fuzziness and the endogenous implications of fuzziness [24]. Internal fuzziness is dominant in a user-driven personalization and customization scenario. Specifically, design activities need to be explored when entering relatively unknown fields, during which the user undergoes a process that is uncertain and complex to one in which there is uncertainty [25]. In the initial stage of designing the product shape, it is necessary to complete a search for information, and define the initial state and problem, which mean that users form their interpretation of the target based on their own personal understanding. Text is used in the first step to objectify the anticipated form of the product, such as “stability” and “traditional definition” of the product. That is, personal cognitive experience is used, which causes the activation of temporary neural connections due to associative thinking. This is essentially a process in which a concept elicits the memory of other related concepts. If cognitive experience is insufficient to activate the related concepts to interpret the object of concern, or the concept is too difficult to be visually expressed with a visual example, this will lead to a vague understanding of the hidden targets. Therefore, it is particularly important to provide target definitions that are easy-to-understand and allow visual representation to be quickly established.
The examples can be visually represented in different forms, such as text [26], scenery, symbols, silhouettes, and different and partial shapes [27]. When it is difficult for a user to activate a visual example that conforms to his/her own interpretation of the target through association, visual stimulation through a starting point based on external information is an effective method. Moreover, compared with design projects that have clear rules, visual stimulation plays a more obvious role in design projects with few constraints. Therefore, when the user is in the initial fuzzy state of decision-making, various stimuli can guide the user and reduce the cognitive fuzziness. In related research, Watanabe et al. [16] placed the previous generation of optimal samples in the center of the new generation of samples as stimulus information to guide users to make the next selection in the scheme of evolution displayed in their system, thus reducing the burden on users compared with the traditional way. On this basis, a mapping process of “text-image-symbols” includes a mapping sub-stage in the form of a “image” conforming that conforms to the text that is based on a cognitive process that exploits morphological knowledge. An example is shown in Figure 1. The “text-image-symbol” will stimulate creativity as text and symbols are used to artificially process objective information. They include the personal cognitive understanding and preferences of those who provide the symbols and text. Their interpretation will also eliminate any irrelevant information from the real information. Situational information is the most real and comprehensive type of visual information, which can be transmitted through photos and other images. By constructing the information basis of a image during the cooperative optimization between the user and machine, step-by-step mapping of text-image and image-symbol is established to stimulate the associative process of the user. This strategy helps users to eliminate the ambiguity of interpreting a target.
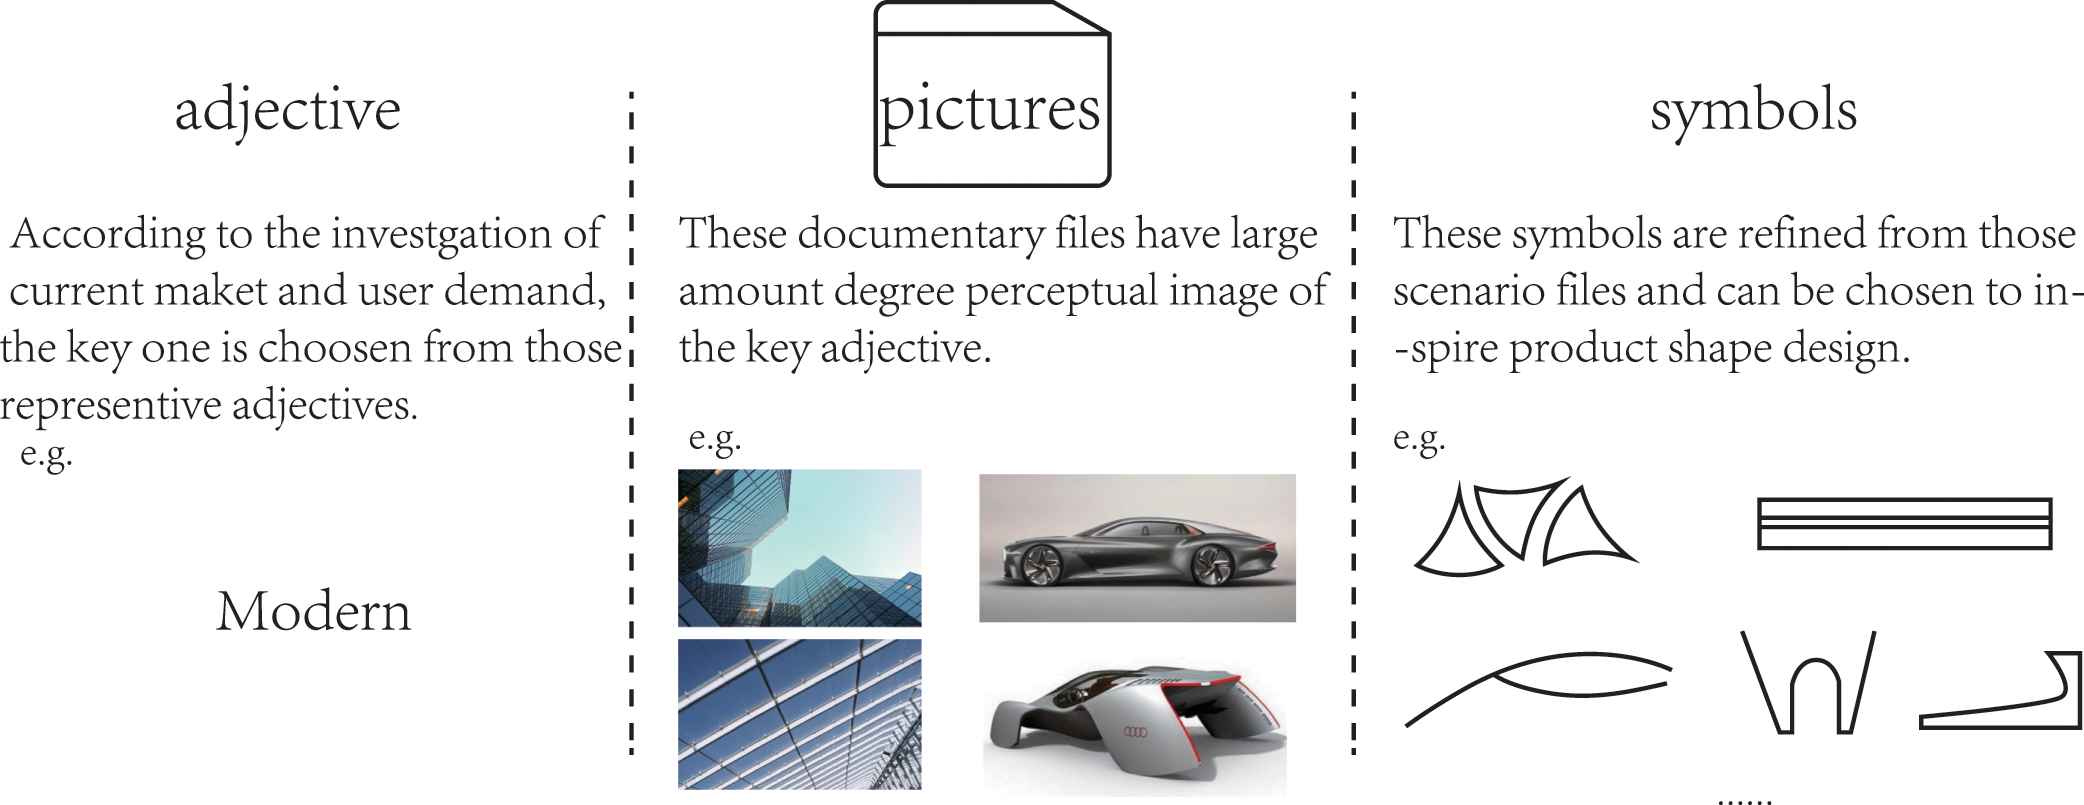
Schematic diagram of spatial mapping strategy that uses “text-image-symbol.”
The information mapping in each space should follow the three following principles: first, text should be expressed by using several descriptions for the images, and these should summarize the characteristics of the design objects. Secondly, the depiction of a image with a symbol is the process of “symbolization,” which are very generalizable and personalized. Third, as the starting point based on external information, the refined morphological symbols are used to motivate users to conduct evolutionary design.
From the perspective of system operations based on IGAs, the specific operation steps of “text-image-symbol” are as follows:
Step 1: Select descriptions of the images that are based on user preference.
Step 2: Provide situational images that conform to the descriptions of the images.
Step 3: Select a image which is congruent with his/her preference.
Step 4: The key feature symbols in the image are compared.
2.2. Cognitive Ambiguity in Decision-Making Process and Strategies to Reduce Cognitive Ambiguity
The decision-making process is complicated. Compared with the different options that have multi-dimensional attributes (such as decision-making for complex systems), a single preference function for each alternative is much easier. However, due to the large number of generations, such a function also exhausts the cognitive resources in a decision-making process that uses IGAs, which inevitably affects performance and leads to negative emotions.
A fitness evaluation is implemented for the entire IGA. Dou et al. [19,20] stated that the user psychology during the fitness evaluation process is fuzzy and hesitant, and s/he is easily affected by the evaluation noise. The behavior of the users during the fitness evaluation process can be summarized as follows: first, after new schemes are generated, the users will quickly perform a global search in the hopes of obtaining the best schemes, during which visual attention is irrational or even illogical, which may lead to fuzzy cognition. Second, the evaluation of multiple samples means that there is an immense volume of information, and users often compare similar schemes to obtain relatively better samples. Since the existing IGA schemes are not in order, the process of finding similar schemes requires time and energy. Third, users are more increased in certainty about their decisions of the best and the worst individuals, while they find it more difficult to decide on those that are between the best and worst, thus resulting in repeated changes in the fitness score, which easily causes user stress, and then leads to user fatigue. These behaviors and the fact that there is still cognitive ambiguity in the early stages of decision-making, mean that the cognitive ambiguity of designers is affected during the decision-making process.
With the aim to mitigate cognitive ambiguity during the decision-making process, this study proposes a clustering method in displaying individuals to the users based on information visualization that groups similar individuals together to reduce the cognitive load of users when they are viewing the display. In research work that focuses on the effects of clustering on visual attention, Ikehara and Crosby [28] pointed out that clustering objects can reduce the number of gazes and thus reduce cognitive load. In a study on visual visualization, Anderson et al. [29] proposed that an efficient visual display is helpful for understanding data sets and recording the electroencephalography (EEG) signals of users can be used as an evaluation method for cognitive load. Huang et al. [30] also reached a similar conclusion. Ohsaki and Takagi [31] stated that compared with random ranking, the ranking of schemes based on the degree of user preference can more reduce their fatigue. This method makes the sample displayed in a much more regular way, However, a large volume of historical data is required to infer the degree of user preference, so this method is not applicable for the initial stages of evolution. Therefore, the strategy proposed in this article is to perform clustering with the differences based on the samples at the beginning of evolution. This clustering is based on the objective shape of the samples, so there is no need to rely on the ranking based on user historical data proposed in reference [31].
The clustering strategy proposed in this study will compensate for the deficiency in existing IGAs which neglect the arrangement of schemes without rules. The technique of this strategy is as follows: First, based on the clustering results, similar schemes are grouped into a cluster. When users look at the schemes, each cluster shows a set of similar patterns, which would reduce their time and energy in repeatedly performing comparisons to evaluate the fitness. Second, the user first has an overall understanding of the sample categories in the evaluation process, and then selects them again in their preferred categories. Compared with the traditional evaluation method, this method will overcome the hesitation of the user when comparing two items. Third, the number of judgments will be reduced compared to the previous use of the standard case-by-case evaluation method.
The K-means++ clustering algorithm proposed in Arthur and Vassilvitskii [32] is used in this study. However, since the focus here is on the optimization of the product shape, their K-means++ clustering algorithm is modified. In standard clustering strategies, classification is usually based on the Euclidean square distance between numerical values and it is not suitable for clustering models, images, morphologies, etc. So, the Hausdorff distance is used to determine similarity by calculating the distance between two sets of points, and in recent years, used to determine the differences between representations of the same object, and thus widely used in target tracking, image recognition, etc. Sarathi and Ansari [33] stated that using the Hausdorff distance is a more natural way of detecting image similarities. Prakash et al. [34] presented a new technique that can efficiently carry out automatic localization of the ear from side face images based on a similarity measure of a template with edge maps of the ear and skin regions of the side face based on a modified Hausdorff distance. Moreover, the clustering method based on the Hausdorff distance has been applied to wireless sensor networks as in Zhu et al. [35], financial time series as in Basalto et al. [36] and other areas. Therefore, these literature has proven the efficiency of Hausdorff distance on measuring the differences between images or shapes. In this study, the Hausdorff distance is applied to a scheme display based on an IGA to aggregate similar schemes, which will allow users to select and compare objects with convenience.
The Hausdorff distance algorithm is as follows:
If the two sets of points are A and B respectively, the Hausdorff distance between A and B is
The modified K-means++ clustering algorithm based on the Hausdorff distance proposed in this paper is as follows:
Assume that the input sample set
Step 1: One cluster center c1 is chosen and taken uniformly at random from C.
Step 2: Let
Step 3: Step 2 is repeated, until k cluster centers are taken in total.
Step 4: For each sample si in the sample set S, its Hausdorff distance to the cluster centers is calculated and each sample is assigned into classes that correspond to the cluster center with the smallest Hausdorff distance.
Step 5: The cluster center of each category cj is recalculated by using
Step 6: Steps 4 and 5 are repeated until the location of the cluster center does not change.
2.3. Model Construction
As found in previous studies, there is the presence of cognitive ambiguity in decision-making with IGAs. Therefore, we propose a model based on the vertical and horizontal dimensions, as shown in Figure 2. In terms of the vertical dimensions of the design process, the fuzziness of the user around the task objectives is found not only at the front end of the interactive evolutionary design process, but also at the front end of the design sub-stages, which affects the decisions of each sub-stage. In terms of the horizontal dimensions, cognitive ambiguity in the decision-making process at each stage of the interactive evolutionary design process of product modeling is due to user fatigue caused by user stress when conducting evaluation under pressure. Combined with cognitive processing in general, a vertical mapping model of “text-image-symbol” for product shape design is established with focus on the vertical dimensions. For the horizontal dimensions, the sporadic lapses and selectivity of visual attention during fitness evaluation are reduced due to the clustering arrangement of schemes that are generated through iteration schemes.
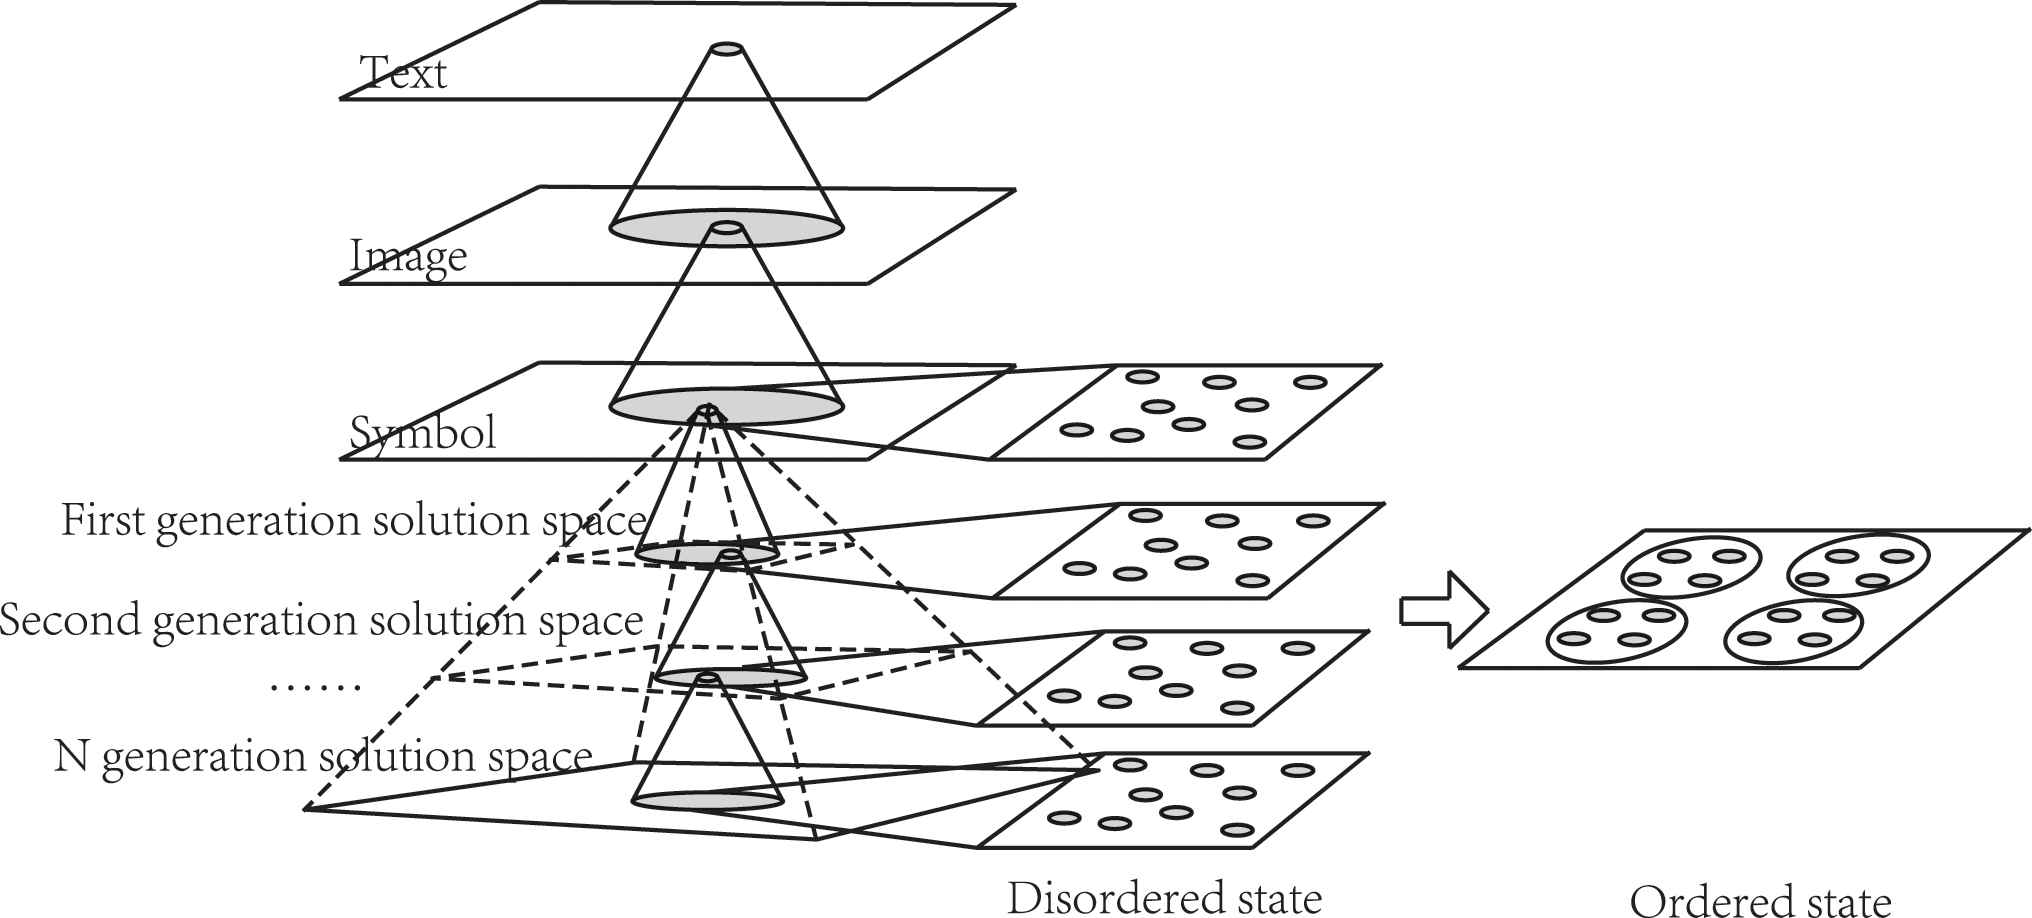
Model for solving cognitive ambiguity with interactive evolutionary design.
3. SYSTEM CONSTRUCTION
Taking the outline of a Chinese vase as an example, an interactive evolutionary design system is constructed by incorporating the clustering strategy proposed in this paper.
3.1. Construction of “Text-Image-Symbol” Mapping
Text-image mapping
The text used to describe and evaluate a product shape is generally rich and varies from person to person. In order to enable system users to effectively carry out associative thinking from text to image, first of all, the typical adjectives used to describe the product here should be refined [37]. Due to different levels of the product complexity, people's perception toward them is thus various. Different types of products should determine different adjectives based on their characteristics. The selection of these typical adjectives are generally determined by the experienced design experts through focus group discussions [37,38]. In this study, a group of 5 industrial design experts were recruited by to provide 16 words that would adequately describe Chinese vases, as listed in Table 1. These design experts are teachers of the industrial design department of the author's institution. They all have master's degree or above and more than 10 years work experience in product design. Then, similar semantic words were placed together, and deliberately paired with opposite semantic words, so that a two-dimensional image space of “classical-modern” and “elegant-inelegant” was finally constructed. Furthermore, the semantic space [−3, +3] of two groups of adjective pairs is defined by the semantic differences (SDs). Next, we collected samples of images of vases (see Figure 3 for examples). In order to make different vases have corresponding scores in two dimensions, and these scores be in line with public perception. We invited 20 users who were recruited by and consisted of 10 males and 10 females. They ranged in age from 21 to 30 years old (Mage = 23.9, SDage = 2.5). These people are all undergraduate or graduate students in industrial design who have some knowledge of Chinese-style vases, and have the ability to appraise the aesthetic perception of vases, so their evaluation can represent the judgment of public. They are require to score the samples based on the two dimensions of “classical-modern” and “elegant-inelegant.” The score of all of the samples was averaged, and the samples were then positioned in the two-dimensional image space, as shown in Figure 3. The purpose for doing so is that users can use the preference scale of the two groups of adjectives in the system during the early stages of designing, and the system will advance the corresponding images based on their coordinate position.
Image-symbol mapping
After users determined the relevant images through the abovementioned methods, they will have a preliminary understanding of an image, i.e., they will complete the transition from text to image to information, thus easing their own uncertainty about the target. Furthermore, due to personal preferences and differences in visually captured information, there is diversity and randomness during the “image-symbol” transition, and the same visual stimulus will also have different effects on different users.
| Adjective |
|---|
| Modern, classical, elegant, small, very simple, elegant, heavy, heavy, lovely, simple, slender, smart, strong, delicate, delicate and round |
Typical adjectives used to describe outline of Chinese vase.
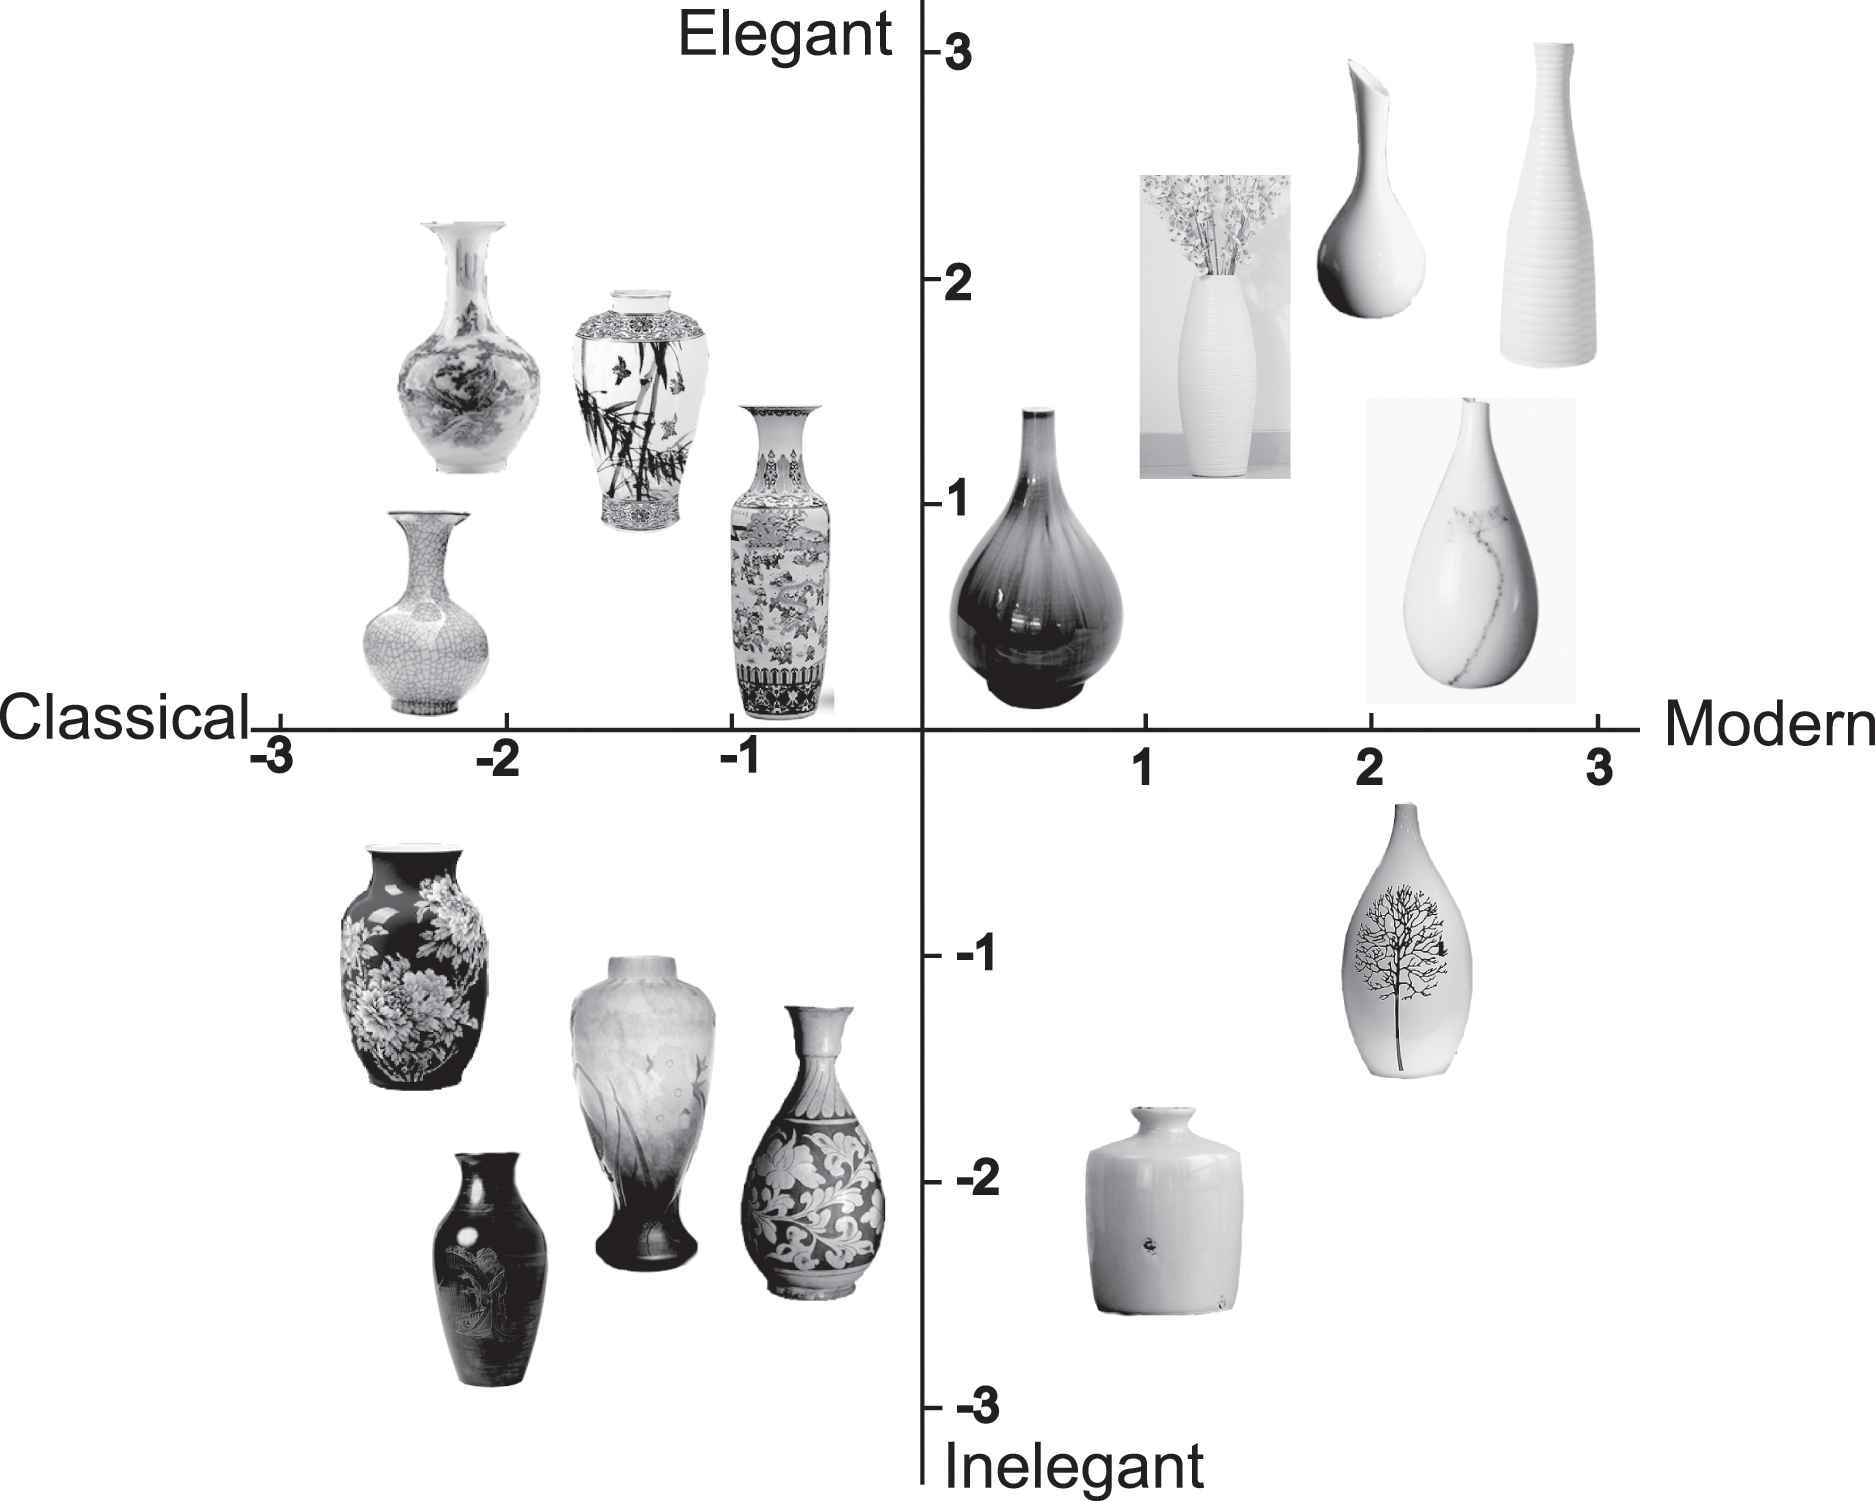
Vase image clustering.
3.2. Chromosome Coding
At present, most vases in the market are mainly composed of four parts: mouth, neck, body and foot or base. As shown in Figure 4, a set of points P are formed by five anchor points (P1, P3, P5, P7, P9) and four curvature control points (P2, P4, P6, P8). Then the contour lines of the vase can be obtained by drawing quadratic Bessel curves, which represent the four parts of the vase, as shown in Figure 4. Taking the middle point of the vase bottom as the origin, the straight line of the vase bottom as the X axis, the axis in the bottle as the Y axis to establish the coordinate system, y1 ~ y9 is the vertical coordinate of P1 ~ P9, x1 ~ x9 is the transverse coordinate of P1 ~ P9. The curve E1 is formed by anchor points P1,P3 and curvature control points P2 through a quadratic Bezier curve, and the curve E2, E3, E4 are formed in the same way. Here, the modeling of the vases found in the market is analyzed, and constraint conditions are imposed. The constraint conditions are mainly determined by the shape of the vases themselves, e.g.
The neck of the vase is basically vertically symmetrical. P3 and P5 control the shape of the neck of the vase, so x3 = x5.
The size of the mouth of the vase is basically the same for all of the vases, so y3 is used as the fixed value.
In order to ensure that the aesthetics of the vase are displayed by the system, the vertical coordinates y1 and y9 are set as fixed values to ensure the same height of all the individuals.
In order to ensure that the generated vase meets the basic functions and human-machine relationship, e.g., the vase mouth is wider than the vase neck, so P1 is on the left side of P3. The bottle mouth is facing outward, so P2 is on the right side of the straight line connected by P1 and P3, P4 is on the right side of the straight line connected by P3 and P5. The vase body is convex outward, so P6 is on the left of the straight line connected by P5 and P7.
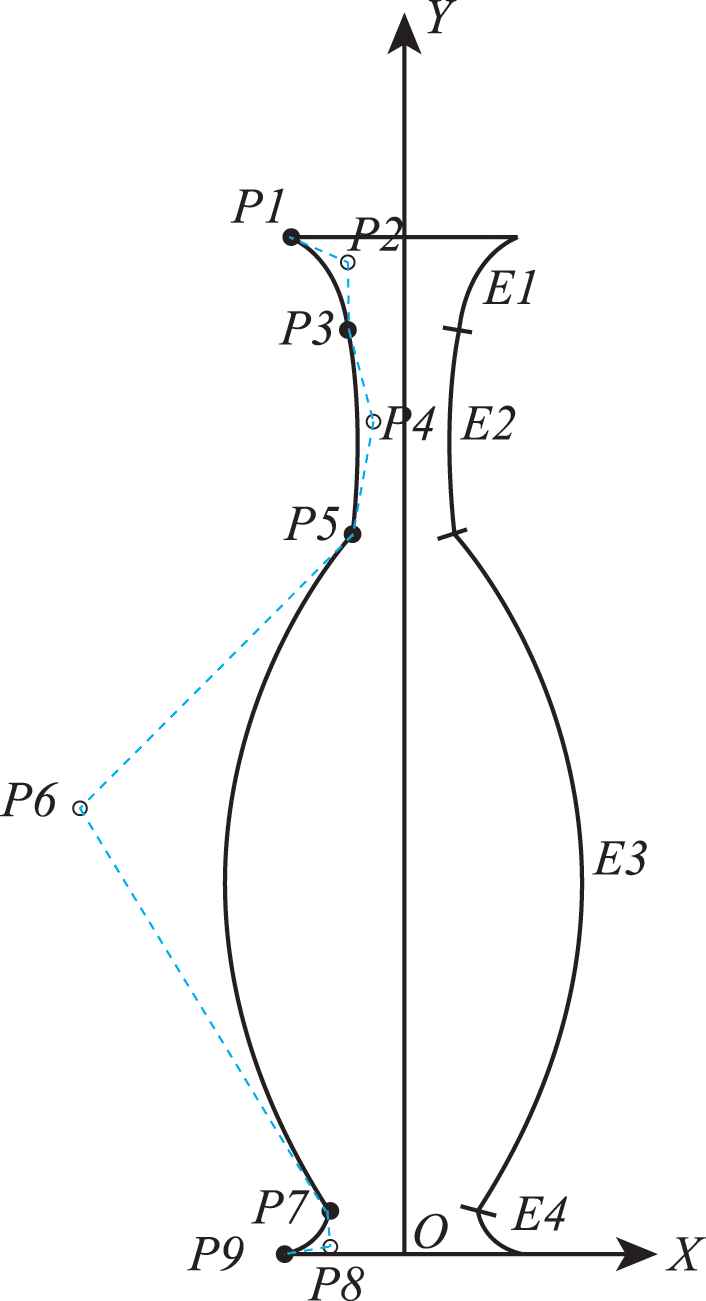
Vase characteristic points and lines.
The above are some constraints on the vase before the encoding process took place. Through these analyses, the graphics generated by the system can basically conform to the shape of a normal vase. On the one hand, because the abscissas or ordinates of some points are fixed value (e.g., y1, y3, y9, etc.), they do not need to be coded. On the other hand, the coordinates to be encoded depend on the amplitude of variation of each feature of the vase, e.g., the mouth of each vase is quite different, so abscissa x1 of the control point P1 of the mouth is set as a 3-bit binary number (i.e., eight possible abscissas), while the fluctuation amplitude of abscissa x4 of the control point P4 of the neck of the vase is not very large, so it is set as a 2-bit binary number (i.e., four possible abscissas).
Based on the above analysis, x1, x3, x6, x9, y2, y4, y5, y6 are set as a 3-bit binary number and x4, x8, y7, y8 as a 2-bit binary number, and the rest of the coordinates are determined by the above coordinates. Moreover, the individual chromosome is composed of a 32-bit binary number, with a sample space of 232 = 4,294,967,296.
3.3. Interactive Interface
The system was implemented by using MATLAB R2017-b. The user interface includes parameter setting, interactive, output, optimal individual parent and image stimulation interfaces. The system module was divided into IGA, processing and loading modules. In order to ensure the operation of the system, the designer clicked on a button to control the execution of the algorithm. The system interaction interface is shown in Figure 5 including 5 parts. The following describes each functional area of the interface:
Sample generation area: This area has two main functions as shown in Figure 5A. First, when the user click the “initial” button in “E” part, all generated individuals (population n = 24) are displayed by the area. Second, the user evaluates the fitness of the sliding bar under the generating scheme and the evaluation value ranges from 0 to 10. A higher score denotes higher satisfaction of the user. In addition, after each sample is generated, it is classified by using the Hausdorff distance between each individual due to the adoption of the clustering strategy, and the clusters to which the individual belongs are marked with different colors on the display.
Image stimulation area: This area is the concrete embodiment of the “text-image-symbol” spatial mapping strategy as shown in Figure 5B. Users can choose different adjectives to describe the images as targets, “classical-modern” and “elegant-inelegant” as the text targets, and the image presented is labeled in accordance with the text targets provided by the user, which can help the user to form a unique personalized mental understanding of the design symbols. Moreover, The data here comes from the prior evaluation in Section 3.1.
Optimal sample area from the previous generation: There are two main purposes as shown in Figure 5C. First, users can identify the sample with the highest evaluation value from the previous generation in the evaluation process, which is convenient for comparison purposes. Because of this comparison, users can have a clearer understanding of the current sample. Secondly, if the user confirms that the sample meets his preferences, the user can click on the “Enter” button, and the scheme can be stored in the “Pool of Schemes” below. If not, it is ignored.
Pool of Schemes: It is used to store the schemes that is considered acceptable by the user, as shown in Figure 5D. In designing the shape evolution of products, IGAs pursue a satisfactory solution instead of the optimal solution, and the satisfactory solution is not unique. Therefore, when the number of satisfactory solutions meets the expectations of the user, the genetic operation will be stopped, and here, it is stipulated that when the number of satisfactory solutions reaches 4, the operation will be stopped.
Parameter setting and data recording area: The genetic parameters are set (crossover and mutation rates), in which the crossover probability (Pc) = 0.7, mutation probability (Pm) = 0.1, and the system records the duration of the current generation, and total duration and evolution algebra of the operating system of the user, as shown in Figure 5E.
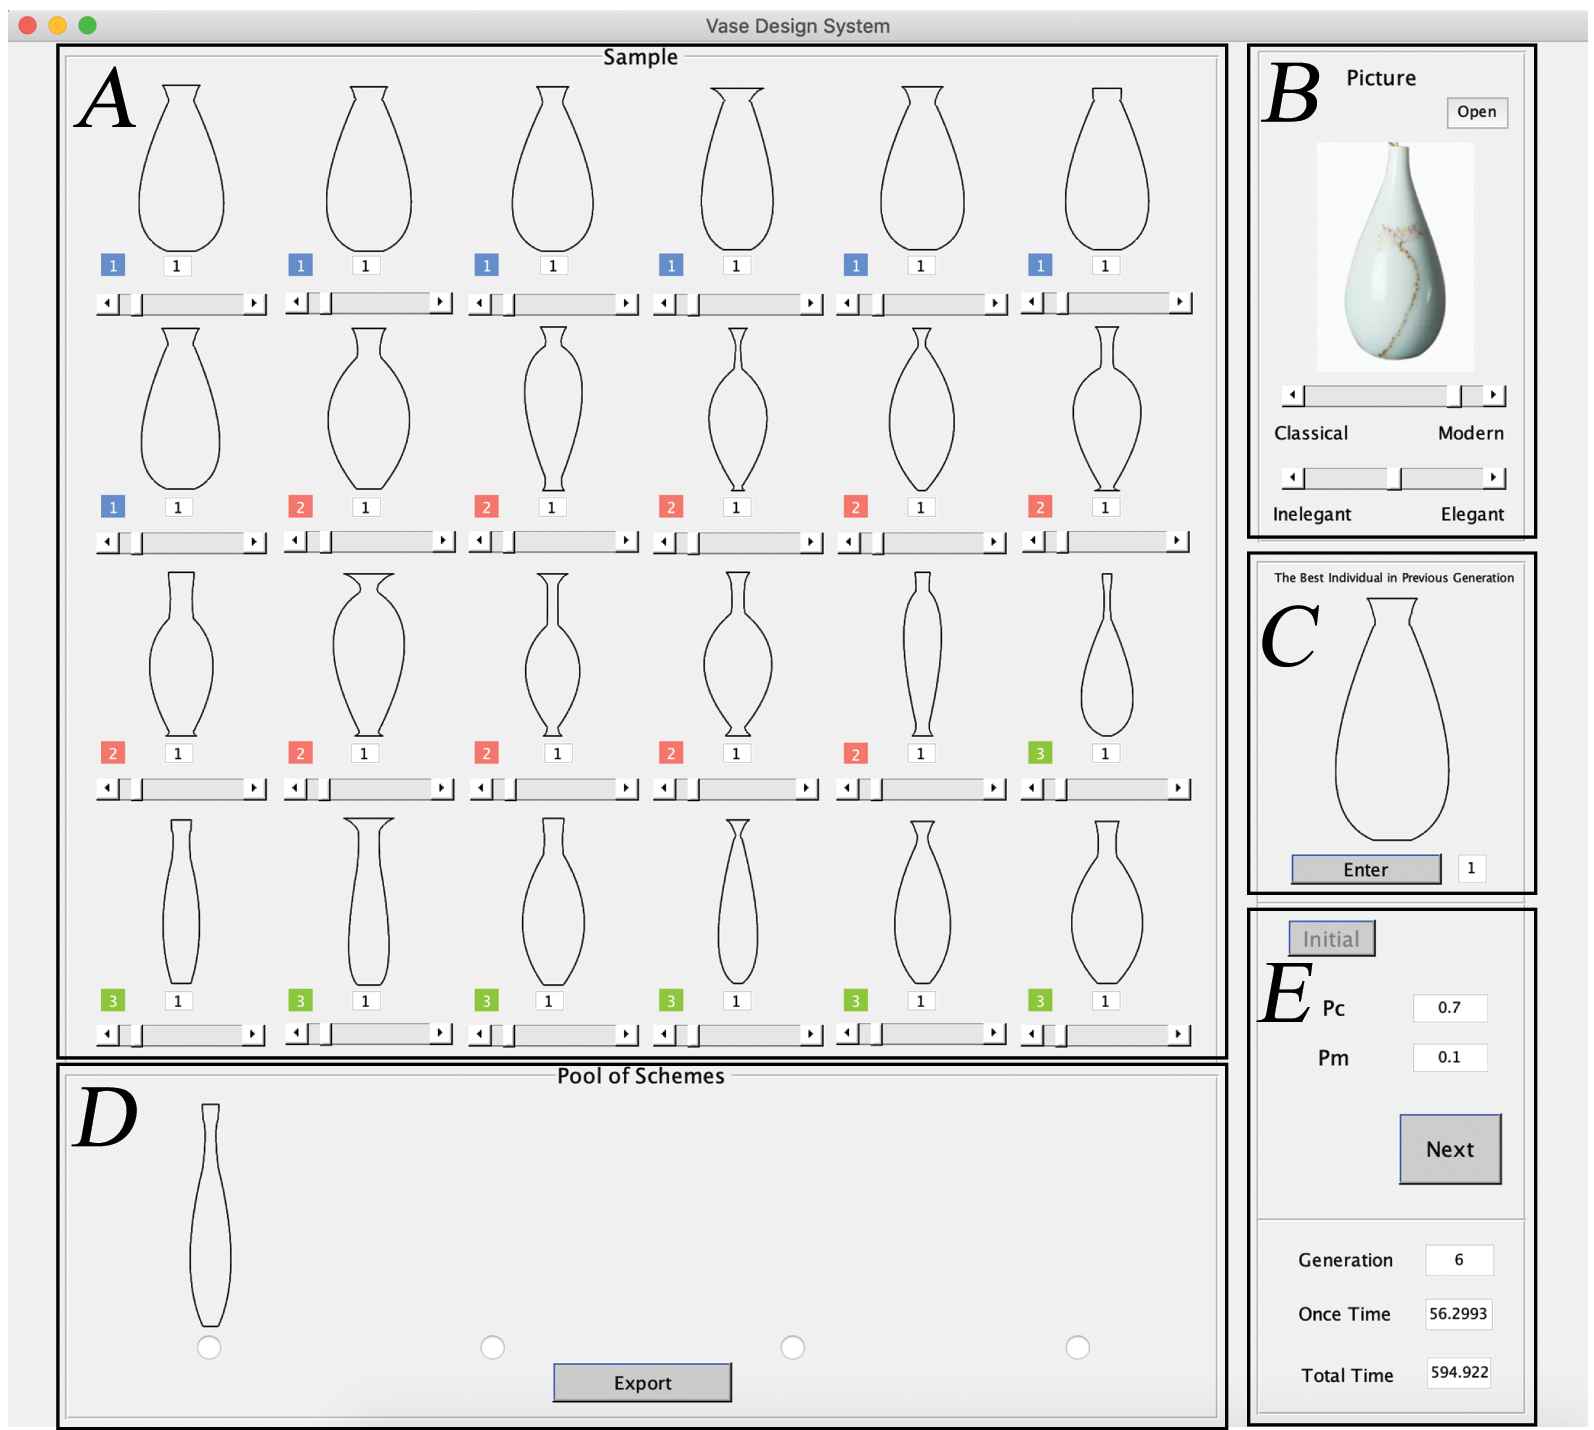
System interaction interface.
4. EXPERIMENTS AND RESULTS
The purpose of the experiment in this study is to validate the effectiveness of the proposed “text-image-symbol” spatial mapping strategy and clustering strategy in mitigating the cognitive fuzziness of the designer.
4.1. Experimental Design
Ten (10) users which consisted of 5 men and 5 women between 20 and 28 years were recruited for the experiment (Mage = 23.6, SDage = 2.2), and no color blindness or color vision deficiency and all of them volunteered for this study. In order to ensure that the experience of all users keeps the same level, none of them have user-customized experience. The experiment was approved by the University Ethics Committee, and all participants received written consent before participating in the study. The 10 users explored the three interactive evolutionary design systems in three separate occasions that were spaced three days apart; namely, not using the proposed strategy (A), using the strategy of “text-image-symbol” (B), and using the strategies of “text-image-symbol” and scheme clustering (C). The results of A and B were compared to validate the effect of the spatial mapping strategy of “text-image-symbol” on cognitive ambiguity in the early decision-making stages, and B and C were compared to validate the effect of the clustering strategy of the evolutionary scheme on cognitive ambiguity in the decision-making process.
The system recorded the data generated during the experiment. During the experiment, the following requirements and conditions were imposed on the 10 users:
The users were required to use the system in a trial for a cumulative duration of 20 minutes prior to undergoing the first experiment to gain a general understanding of the system itself.
The experimental site offered a quiet environment at a comfortable temperature.
4.2. Experimental Results
The evaluation criteria of the algorithm in previous related studies for examining user cognitive performance such as hesitation and uncertainty in decision-making [19,20] are duration, evaluation value, evolution algebra, etc. This study uses the total amount of time used and time used to generate the first generation by the users in the three experiments. The values are shown in Table 2. The data were analyzed by using SPSS software and an analysis of variance (ANOVA) to determine the significance of the differences in each experiment. First, to validate the differences when the “text-image-symbol” strategy is used, two types of observations were carried out; namely, when the “text-image-symbol” strategy is not used (A) and when the “text-image-symbol” strategy (B) is used. As shown in Table 3, “Time used to generate first generation” and “Total amount of time used” are dependent variables, with F values of 14.53 (sig < 0.05) and 2.23 (sig > 0.05), respectively. Therefore, the difference between A and B is considered to be insignificant for the “Total amount of time used.” As for the “Time used to generate first generation,” the difference between A and B is significant. By using the least significant difference (LSD), it was found that the duration required with B is significantly less than with A. Therefore, the use of the strategy can guide designers in the early stages of design, reduce cognitive ambiguity in the early stages of design, and thus reduce the initial evaluation time.
| Algorithm | Strategy not Used (A) |
“Text-Image-Symbol” Strategy (B) |
Both B and Clustering Strategy are Used (C) |
|||
|---|---|---|---|---|---|---|
| Variable | Time 1 | Time 2 | Time 1 | Time 2 | Time 1 | Time 2 |
| User 1 | 33.9 | 295.4 | 22.7 | 314.5 | 21.0 | 268.6 |
| User 2 | 39.9 | 206.1 | 30.5 | 345.2 | 28.0 | 266.3 |
| User 3 | 40.3 | 309.8 | 32.8 | 298.1 | 30.8 | 253.5 |
| User 4 | 43.2 | 298.6 | 18.8 | 300.4 | 18.5 | 270.1 |
| User 5 | 35.8 | 299.6 | 33.7 | 366.0 | 31.2 | 266.0 |
| User 6 | 29.9 | 240.3 | 24.6 | 245.6 | 28.7 | 249.1 |
| User 7 | 45.1 | 267.7 | 23.9 | 290.3 | 27.3 | 230.4 |
| User 8 | 29.7 | 230.6 | 35.5 | 227.3 | 36.0 | 201.6 |
| User 9 | 49.1 | 188.3 | 32.1 | 198.9 | 19.5 | 175.4 |
| User 10 | 39.8 | 179.3 | 30.2 | 267.4 | 29.0 | 211.7 |
| Average | 38.7 | 251.6 | 28.5 | 285.4 | 27.0 | 239.3 |
*Time 1 means Time used to generate first generation. Time 2 means Total amount of time used.
Experimental data.
| Test Variable | Sum of Squares | Degree Freedom | Mean Square | F Test | Sig. | Back Testing with LSD | |
|---|---|---|---|---|---|---|---|
| Time used to generate first generation/s | Between groups | 519 | 1 | 519 | 14.53 | 0.001 | A > B |
| Within group | 643 | 18 | 35 | ||||
| Total | 1 162 | 19 | |||||
| Total amount of time used/s | Between groups | 5 712 | 1 | 5 712 | 2.23 | 0.152 | No significant difference |
| Within group | 46 046 | 18 | 2 558 | ||||
| Total | 51 758 | 19 |
LSD, least significant difference.
Summary of variance analysis for comparison of different validation indexes by using “text-image-symbol” strategy.
Then, whether the schemes cluster differently was examined. Both experiments were completed in a stimulating environment. The two types of observations are on the nonclustering scheme (B) and clustering scheme (C). This experiment mainly determined whether the cognitive ambiguity in the decision-making process can be mitigated. As shown in Table 4, F = 0.350 (sig. > 0.05) for the “Time used to generate first generation,” and the difference between B and C is not significant. In terms of “Total amount of time used,” F = 5.628 (sig. < 0.05), which has a significant difference. By using the LSD, it was found that the duration of time spent on the “display with clustering” is significantly less than that for the “display with no clustering.” Therefore, it can be concluded that the users can directly observe the scheme based on the categories after clustering. Since there are few categories, it is easy to make a judgement in a short period of time, and then focus on the better categories while ignoring the poor categories, thus reducing the number of evaluations. Therefore, the evaluation time is reduced. It can be said that the clustering strategy plays a certain role in reducing ambiguity in the decision-making process.
| Test Variable | Sum of Squares | Degree Freedom | Mean Square | F Test | Sig. | Back Testing with LSD | |
|---|---|---|---|---|---|---|---|
| Time used to generate first generation/s | Between groups | 11 | 1 | 11 | 0.350 | 0.561 | No significant difference |
| Within group | 562 | 18 | 31 | ||||
| Total | 573 | 19 | |||||
| Total amount of time used/s | Between groups | 10 626 | 1 | 10626 | 5.628 | 0.029 | B > C |
| Within group | 33 987 | 18 | 1888 | ||||
| Total | 44 613 | 19 |
LSD, least significant difference.
Summary of variance analysis for comparison of different validation indexes by using clustering strategy for evolutionary scheme.
5. CONCLUSION
This paper aims to address the cognitive fuzziness of users during an interactive evolutionary design process based on user-customized scenarios, and deconstructs the process as cognitive ambiguity in the early stages of decision-making and cognitive ambiguity during the decision-making process. Then, according to the characteristics of the two stages, a “text-image-symbol” spatial mapping strategy and a clustering strategy for evolutionary schemes are proposed to solve the problem respectively. Based on the above strategies, an interactive evolutionary design system is constructed, a comparative experiment is carried out, and the experimental results are subsequently analyzed. It is found that the “text-image-symbol” strategy reduces the time to generate the first generation, and the clustering strategy reduces the overall evaluation time. It is concluded that the proposed strategy can effectively mitigate cognitive ambiguity in the evaluation process.
In follow-up research, we will continue to examine the characteristics of the thought process in interactive evolutionary design environments and apply the innovative concept to specific practices in interactive evolutionary design environments.
CONFLICT OF INTEREST
The authors declare there are no conflict of interest.
AUTHORS' CONTRIBUTIONS
Dong Zeng: Conceptualization,Writing - Review & Editing, Supervision; Zhuan Zhou: Methodology, Data analysis, Writing - Original Draft, Visualization; Maoen He: Software, Validation; Chaogang Tang: Funding acquisition, Writing - Review & Editing.
ACKNOWLEDGMENTS
This work was partly supported by the Fundamental Research Funds for the Central Universities under Grant 2019XKQYMS46.
REFERENCES
Cite this article
TY  - JOUR
AU  - Dong Zeng
AU  - Zhuan Zhou
AU  - Maoen He
AU  - Chaogang Tang
PY  - 2020
DA  - 2020/05/22
TI  - Solution to Resolve Cognitive Ambiguity in Interactive Customization of Product Shape
JO  - International Journal of Computational Intelligence Systems
SP  - 565
EP  - 575
VL  - 13
IS  - 1
SN  - 1875-6883
UR  - https://doi.org/10.2991/ijcis.d.200511.001
DO  - 10.2991/ijcis.d.200511.001
ID  - Zeng2020
ER  -