
Technology State Control Based on Multi-source Heterogeneous Data Fusion in Manufacturing
- DOI
- 10.2991/ijcis.d.200518.001How to use a DOI?
- Keywords
- Decision-making; Data fusion; Rough set; D-S evidence
- Abstract
The technology state is determined not by a single data, but by multiple data sources that has a certain degree of uncertainty and ambiguity, and even be contradictory which is difficult to support decision-making effectively. In this paper, an efficient intelligent decision-making method based on multi-source heterogeneous data fusion is proposed. Firstly, under the rough set theory, the attribute reduction method based on the improved particle swarm optimization is proposed to efficiently obtain decision-related attributes. Secondly, using the improved Dempster-Shafer (D-S) evidence theory to fuse and calculate the reduced information sources to obtain the final decision results. Finally, the production process of satellite separation station was taken as the application object to verify the feasibility of proposed technology.
- Copyright
- © 2020 The Authors. Published by Atlantis Press SARL.
- Open Access
- This is an open access article distributed under the CC BY-NC 4.0 license (http://creativecommons.org/licenses/by-nc/4.0/).
1. INTRODUCTION
Determination of technology state is a complex multi-source heterogeneous information collection and integration process. It is necessary to constantly record the technical state of the product according to the information fusion in the production process of physical products, and compare and evaluate the requirements of physical state and technical state, so as to effectively grasp the deviation of technical state [1–3].
In the complex manufacturing environment, the types and number of sensors used in the system are increasing, and the measurement data generated are increasing. The information provided by various information sources is often uncertain and fuzzy to some extent, even contradictory. The data of a single sensor reflects the situation of the object or system under test from a certain side, which has some limitations. Faced with a large amount of data, it is an urgent problem to be solved how to deal with and overcome its uncertainty, comprehensively, fully and more effectively utilize such a large amount of information, so as to obtain the information of technical status more quickly and accurately.
Aiming at the above problems, this paper adopts the data fusion method based on rough set D-S evidence theory to obtain the technical status evaluation. The observation data from various information sources are integrated, correlated and synthesized to generate consistent interpretation and description of the manufacturing system. This method can not only assist the manufacturing process in decision making, planning, verification and diagnosis, but also improve the reliability of the entire manufacturing system.
2. FUSION MODEL
Rough set theory is a kind of classification rule which is widely applied to analyze and process the concept without providing any prior information other than basic data [4,5]. Dempster-Shafer (D-S) evidence theory plays an important role in comprehensively considering multi-source uncertain information fusion such as information from multiple sensors or opinions of multiple experts [6,7]. The method proposed in this paper is based on the complementary relation between rough set and evidence theory, as shown in the Figure 1.
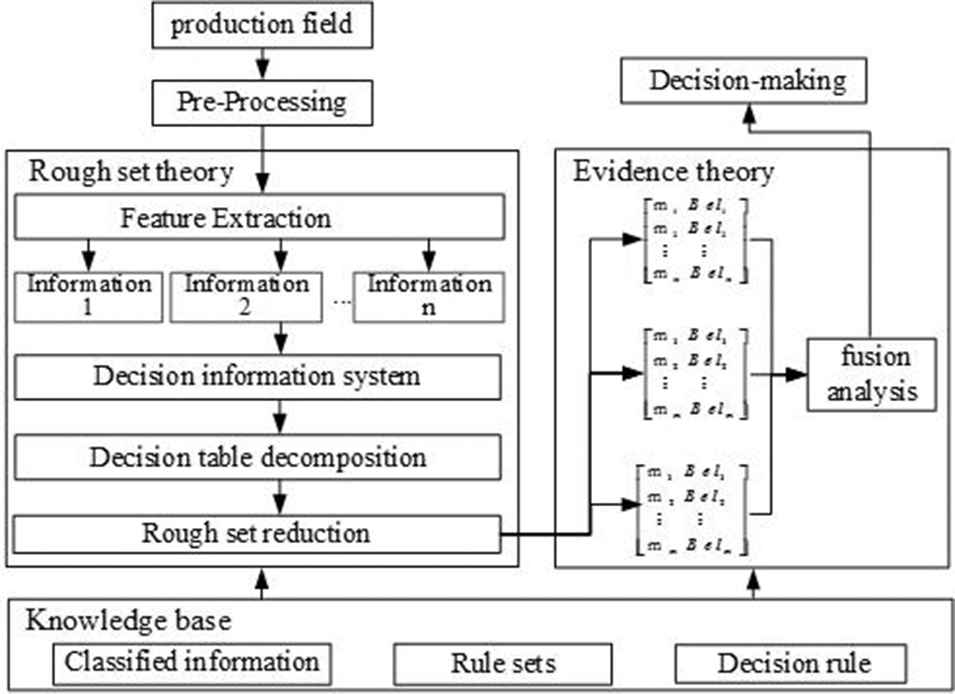
The model of data fusion.
Firstly, the method uses rough set theory to eliminate the irrelevant, redundant and unimportant attributes of technical state evaluation on the premise of keeping the existing database classification and decision unchanged, which greatly reducing the data amount of technical state evaluation. Secondly, the conditional attributes that support the evaluation of technical state in the minimal decision table obtained by attribute reduction of rough set are taken as the information source of D-S evidence theory to infer the current technical state of the system. These multi-source heterogeneous information often has a certain degree of mutual exclusion. According to D-S evidence theory combination rules, the orthogonality of information trust of different sources is calculated and fused. Finally, according to certain decision rules, the trust function after combination optimization is judged, and the final fusion and decision results are obtained.
3. ATTRIBUTE REDUCTION
The purpose of attribute reduction is to find out the related attributes that support the decision quickly among a large number of related attributes [8]. Attribute reduction usually adopts heuristic algorithm to solve nondeterministic polynomial-time hard problem. The heuristic algorithm gets the local maximum value, which is one-sided and limited. Therefore, this paper uses rough set theory to measure the importance of each data attribute, and then uses the improved particle swarm optimization algorithm to solve the optimal attribute set to realize the global optimal attribute reduction.
3.1. Attribute Importance Measure
Due to the rough set theory is a tool for export concise decision or classification rules, the processing of data are discrete attribute values, and content in the union collected attribute values are continuous, using the theory of rough sets data reduction properties important measure should be first to collect data for discretization of continuous processing [9,10].
The information system is expressed as
In this paper, equidistance method is used to discretize attributes. The specific steps of the method are as follows:
Step 1: The interval length of each data attribute is calculated
Step 2: The scope of the interval is determined. The interval range of the
Step 3: The quantized value of the attribute according to formulas (1) and (2) is determined. Each attribute has
In order to measure the importance of condition attribute
3.2. Attribute Reduction
In this paper, an improved particle swarm optimization algorithm is used for attribute reduction [11]. The improvement mainly includes the following two aspects. Firstly, the attributes contained in the relative kernel obtained from rough set were put into the initial population and kept unchanged during the whole iteration to improve the convergence speed of the algorithm. Secondly, by introducing penalty function into adaptive value function, the characteristics of attribute reduction problem can be integrated into the optimization process of particle swarm optimization.
3.2.1. Coding method
Using binary encoding based on (0,1), attribute values are represented as binary structure data of particle swarm space. If an attribute subset of the attribute space is
3.2.2. Selection of fitness function
In order to evaluate the fitness of each chromosome string and the quality of chromosome genes, appropriate fitness functions should be selected according to the actual requirements of attribute reduction. Objective function
3.2.3. Attribute reduction algorithm
The steps of relative attribute reduction algorithm based on particle swarm optimization are as Figure 2.
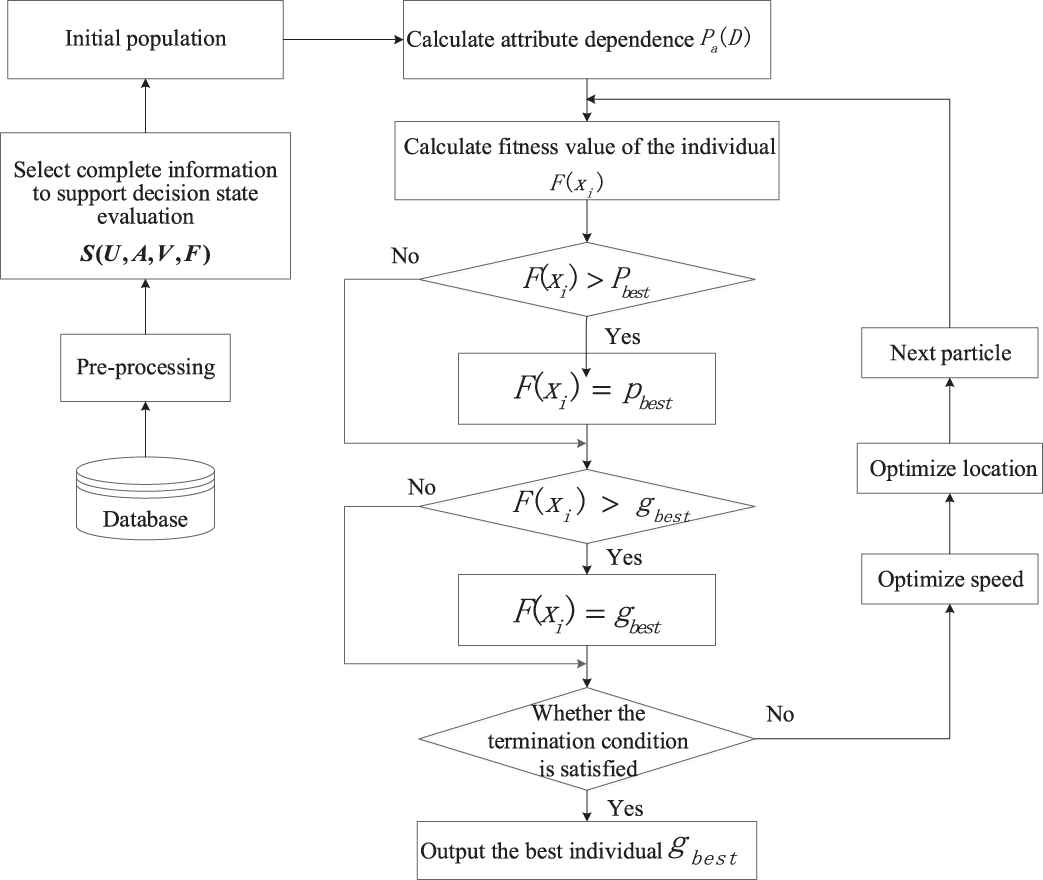
Attribute reduction process.
Step 1: Create a decision table by reading in raw data. The dependence
Step 2: Figure out the importance
Step 3: The control parameters of the particle swarm are initialized. the population size
Step 4: For individual x of each population, the dependence value
Step 5: Update the position information of each particle, and then calculate the updated particle fitness value. If the new particle fitness value is better than the individual extreme value, the individual extreme value is updated with the current fitness value. Then the global extremum is found according to the individual extremum of each particle.
Step 6: Judge whether the fitness value of the optimal individual satisfies the termination condition of the algorithm after iterative optimization of the continuous t generation. If so, the optimal individual terminated and output is the minimum relative reduction; otherwise, go back to step 2.
4. FUSION CALCULATION
The reduced knowledge base is taken as the information source of D-S evidence theory. The current state of the system can be inferred from the conditional attributes that support system state evaluation in the shortest decision table obtained by attribute reduction based on particle swarm. Through D-S evidence theory combination rules, the orthogonality of information trust degree from different sources is calculated and fused [12]. The trust function after combination optimization is judged according to certain decision rules, and the final fusion and decision results are obtained.
4.1. Reliability Function Acquisition Based on Relevance
In practical application, D-S evidence theory requires that the synthesized evidence is independent of each other, which is difficult to be satisfied in most applications. However, most applications directly assume its approximate independence and use D-S evidence theory, which often makes the fusion effect unsatisfactory. Therefore, based on the traditional evidence synthesis, this paper introduces the correlation coefficient between evidences to eliminate the influence caused by the nonindependence of evidences.
If
In D-S evidence theory, the focus element contained in evidence determines the amount of information it can provide, so the information capacity
The correlation between evidence
The correlation coefficient of evidence
The correlation coefficient of evidence
Assuming that the basic credibility of evidence
The size of
4.2. Decisions Based on Trust Allocation
By taking the data set after attribute reduction as evidence, each data source can provide a set of propositions and establish appropriate reliability functions accordingly, so that multi-source data fusion is conducted under the same framework to synthesize different evidence bodies into a new evidence body [13]. Different application scenarios determine different ways to make decisions after evidence combination. This paper introduces the concept of minimum risk to make final decisions on the basis of evidence combination.
Set
If
5. EXPERIMENT AND RESULT ANALYSIS
In the previous project, the intelligent workshop product real-time tracking and monitoring system based on the Internet of things has been developed and implemented in a workshop of aerospace plant. The real-time data generated by the system will be used as data source to verify the effectiveness of the proposed method.
The technical state control in the manufacturing process of the satellite separation station was selected as the application scenario to verify the feasibility and high reliability of this method. The technical status of the satellite separation station is very strict in the manufacturing process that includes material preparation, forging, heat treatment, sand blasting, plane shape, milling processing line, milling cavity shape, outside the car cone arc surface, cutting processing line and drilling holes. The determination of the technical status needs to integrate the information collected in each process step. In this paper, the process data of the satellite separation station forming is selected as the data source to verify the effectiveness and feasibility of the algorithm.
5.1. Data Discretization
The process data collected in the field are converted into discrete data representation by discretization of continuous attributes with equal distance method, as shown in Table 1. The quality judgment decision-making was established as shown in Table 2. The condition attributes represent the temperature of air blast hood, air blast bellow, air draft hood, air draft bellow, preheat hood I, preheat bellow I, preheat hood II, preheat bellow II, feed layer thickness. d stands for decision attribute, and 1, 2, 3 represent good, qualified and unqualified of the three decision levels.
| Data Source | Discrete Value |
||||||
|---|---|---|---|---|---|---|---|
| 0 | 1 | 2 | 3 | 4 | 5 | 6 | |
| Air blast hood | <50 | [50, 60] | [60, 70] | [70, 80] | [80, 90] | [90, 100] | >100 |
| Air blast bellow | <100 | [100, 120] | [120, 140] | [140, 160] | [160, 170] | [170, 180] | >180 |
| Air draft hood | <250 | [250, 260] | [260, 270] | [270, 280] | [280, 290] | [290, 300] | >300 |
| Air draft bellow | <100 | [100, 120] | [120, 140] | [140, 160] | [160, 170] | [170, 180] | >180 |
| Preheat hood I | <500 | [550, 560] | [560, 570] | [570, 580] | [580, 590] | [590, 600] | >600 |
| Preheat bellow I | <160 | [160, 200] | [240, 280] | [280, 320] | [320, 360] | [360, 400] | >400 |
| Preheat hood II | <950 | [950, 960] | [960, 970] | [970, 980] | [980, 990] | [990, 1000] | >1000 |
| Preheat bellow II | <300 | [300, 340] | [340, 380] | [380, 420] | [420, 460] | [460, 500] | >500 |
| Feed layer thickness | <120 | [120, 150] | [150, 180] | [180, 210] | [210, 240] | [240, 270] | <270 |
Discrete table of each process parameter.
| U | Condition Attribute |
Decision Attributes |
|||||||
|---|---|---|---|---|---|---|---|---|---|
| 3 | 4 | 3 | 4 | 5 | 4 | 3 | 3 | 2 | |
| 2 | 4 | 4 | 3 | 3 | 4 | 3 | 4 | 2 | |
| 4 | 3 | 5 | 3 | 4 | 3 | 5 | 4 | 1 | |
| 2 | 1 | 3 | 4 | 4 | 5 | 3 | 5 | 2 | |
| 3 | 2 | 3 | 4 | 3 | 5 | 4 | 4 | 3 | |
| 4 | 3 | 3 | 5 | 4 | 4 | 5 | 5 | 1 | |
| 3 | 5 | 1 | 3 | 2 | 5 | 3 | 3 | 2 | |
| 3 | 4 | 4 | 5 | 4 | 3 | 4 | 5 | 1 | |
| 2 | 4 | 2 | 4 | 5 | 5 | 4 | 5 | 3 | |
| 4 | 3 | 3 | 5 | 4 | 4 | 5 | 3 | 2 | |
| 3 | 5 | 2 | 3 | 4 | 5 | 5 | 4 | 1 | |
| 2 | 1 | 5 | 4 | 4 | 4 | 6 | 5 | 3 | |
Decision table.
5.2. Attribute Reduction
The rough set attribute reduction method based on particle swarm optimization algorithm is applied to the collected data. The value of each parameter in the calculation is
5.3. Basic Probability Assignment
When
When
When
When
When
Assume that the collected information is
For
| 0.675 | 0.025 | 0 | 0.1 | |
| 0.18 | 0.72 | 0 | 0.1 | |
| 0.45 | 0.45 | 0 | 0.1 | |
| 0.81 | 0.09 | 0 | 0.1 |
The basic probability assignment of {a1, a2, a5, a6}.
According to the evidence synthesis formula of Equation (20), the combined results of
| 0.66 | 0.33 | 0 | 0.01 |
The combined results of
For
| 0.63 | 0.27 | 0 | 0.1 | |
| 0.45 | 0.45 | 0 | 0.1 | |
| 0.81 | 0.09 | 0 | 0.1 | |
| 0.585 | 0.315 | 0 | 0.1 |
The basic probability assignment of {a3, a5, a6, a8}.
According to the evidence synthesis formula of Equation (20), the combined results of
| 0.832 | 0.143 | 0.61 | 0.025 |
The combined results of
Combining evidence r and
| 0.832 | 0.143 | 0.61 | 0.025 |
Result of evidence synthesis.
It can be seen from Table 7, when a single evidence r or t is used for combination calculation, the credibility value of the evidence uncertainty changes from greater than or equal to 0.1 of a single evidence to 0.003 of the combined evidence. The uncertainty credibility value has been greatly reduced. On the basis of obtaining the credibility, the formula (22) is used to make the final decision. The threshold value is set as
5.4. Method Comparison
The different method were selected to compare the decision accuracy and algorithm timeliness for three kinds of query cycle data, as shown in Tables 8 and 9. The first method relies on artificial experience to make decision. The second method uses general D-S evidence theory in reference [14] without data reduction. The third methods uses the general attribute reduction method and D-S evidence theory method in reference [14,15]. The fourth methods uses the improved attribute reduction method and D-S evidence theory method in reference [16,17]. The fifth method is to use the method proposed in this paper. The validity of data fusion method is verified by fusion accuracy, which is equal to the ratio of the number of correct decisions to the total number of all decisions. The algorithm delay time is the average time to calculate the correct result.
| Methods | Query Cycle |
||
|---|---|---|---|
| 500 (%) | 1000 (%) | 1500 (%) | |
| The first methods | 68 | 60 | 53 |
| The second methods | 72 | 67 | 60 |
| The third methods | 82 | 79 | 72 |
| The fourth method | 90 | 85 | 80 |
| The fifth method | 96 | 94 | 93 |
Comparison of decision accuracy.
| Methods | Query Cycle |
||
|---|---|---|---|
| 500 (s) | 1000 (s) | 1500 (s) | |
| The second methods | 4.2 | 6.3 | 8.4 |
| The third methods | 2.1 | 3.4 | 4.3 |
| The fourth methods | 1.5 | 2.6 | 2.8 |
| The fifth methods | 1.0 | 1.8 | 2.0 |
Comparison of decision timeliness
It can be seen from Tables 8 and 9 that the data fusion method without attribute reduction is not only less accurate but also poor timeliness. Compared with the traditional method and the improved method, the method proposed in this paper is both accurate and timely.
6. CONCLUSIONS
The main research results of this paper are divided into three parts. Firstly, this paper constructs the intelligent decision-making framework based on multi-source heterogeneous data fusion in manufacturing. Secondly, on the basi+s of rough set theory, data attributes are quantified and importance is measured, and particle swarm optimization is used to solve the minimum reduction data attributes. Thirdly, considering the requirement of high accuracy of manufacturing decision-making, the D-S evidence theory is improved to make the final decision by combining the thought of minimum risk.
Mankind is in the age of information explosion, especially in the field of manufacturing. The value of these massive multi-source heterogeneous data is very great. And then we'll continue to study different methods to mine hidden value according for different enterprise requirements.
CONFLICT OF INTEREST
The authors declared that they have no conflicts of interest to this work. We declare that we do not have any commercial or associative interest that represents a conflict of interest in connection with the work submitted.
AUTHORS' CONTRIBUTIONS
Yu J., Gu S.G., and Zhang W. designed the study, performed the research, analysed data, and worte the paper.
Funding Statement
The paper was funded by the National Key Research and Development Project (No.2017YFC0804902).
ACKNOWLEDGEMENTS
Thanks are due to Wang J.W. for assistance with the experiments and to Zhou Y.K. for valuable discussion.
REFERENCES
Cite this article
TY  - JOUR
AU  - Jie Yu
AU  - Shenggao Gu
AU  - Wei Zhang
PY  - 2020
DA  - 2020/06/11
TI  - Technology State Control Based on Multi-source Heterogeneous Data Fusion in Manufacturing
JO  - International Journal of Computational Intelligence Systems
SP  - 638
EP  - 644
VL  - 13
IS  - 1
SN  - 1875-6883
UR  - https://doi.org/10.2991/ijcis.d.200518.001
DO  - 10.2991/ijcis.d.200518.001
ID  - Yu2020
ER  -