
An Intelligent and Automated Approach for Smart Minimarkets
 , Ashraf Tahat2, , Sara Hammouri1, Leen Hashem1, , Leen Da'boul1
- DOI
- 10.2991/ijcis.d.200611.001How to use a DOI?
- Keywords
- Smart cities; ANN; Smart minimarket; Smart shopping; Queueing analysis
- Abstract
This paper presents the design and implementation of a smart and safe minimarket prototype for deployment in busy smart cities to mitigate the overhead of shopping experience. The prototype allows customers to remotely access and browse the available products at the minimarket using a special smart-phone application. The system can intelligently detect the nearby location of customers and subsequently provide location-dependent services such as allowing orders to be placed using the application, predicting weekly customer expenditures based on artificial-neural-network machine-learning approach, and automatically delivering purchased products using a robotic shopping cart. This proposal is believed to support safe shopping which became a critical issue after COVID-19 pandemic. From a service provider view point, the application allows the provider to remotely manage the minimarket by adding/removing product items, keeping track of shortage in products, and getting revenue information. Empirical results show that the average service time of the minimarket is
- Copyright
- © 2020 The Authors. Published by Atlantis Press SARL.
- Open Access
- This is an open access article distributed under the CC BY-NC 4.0 license (http://creativecommons.org/licenses/by-nc/4.0/).
1. INTRODUCTION
In recent years, the concept of smart cities was introduced. This concept involves many aspects related to managing urban systems. Such systems include, e.g., managing water resources, energy, waste, transportation and other city-wide services such as supermarkets and shopping centers. City management becomes more critical with the increase of population. It is anticipated by United Nations (UN) that around 60% of the global population is expected to live in large cities [1]. In Jordan however, as for 2018, 42% of a total of around 10 million people live in the capital city of Amman, and 18% live in the next bigger city, Irbid [2]. Under circumstances with the similar growth rates, it is anticipated that the number of people living in Amman will increase by approximately 84% in 2050 [2]. This increase in city population poses many challenges on the city resources and services. One such challenge is how to make the shopping experience in supermarkets, shopping malls, and minimarkets—which are heavily scattered in the city of Amman—easier and more convenient for both, customers and suppliers. Another challenge however is safe shopping. Since the health crisis of COVID-19 pandemic at the beginning of 2020, the Jordanian government allowed citizens to shop through minimarkets (not supermarkets) and within fixed social distance.
A shopping center can offer a variety of services to assist customers in their shopping, e.g., a customer can view the available products and their prices/offers using his/her smart phone before actually arriving at the shopping center, i.e., at home or while a customer is on his/her way to the shopping center. Furthermore, the shopping center can learn customers shopping habits and use that to predict the amount of customer expenditures for the current weekly shopping based on previous data of customer expenditures. In addition, a shopping center can smartly detect the existing of a customer when he/she arrives at the shopping center and provide him/her with additional services, such as allowing the customer to shop using his smart-phone application, make an order and wait for a robotic cart to deliver the shopping to his/her car.
This paper discusses the realization of the aforementioned services using a smart minimarket prototype, which was designed and implemented for experimental purposes. The proposed minimarket supports six types of products and has a robotic cart that automatically carry purchased items to the customer nearby place when an order is placed. The minimarket is able to learn and predict customer expenditures trends using an artificial neural network (ANN) machine-learning approach and feed this information back to the customer on his/her next weekly shopping. Also, it provides customers with location-dependent services. Both customers and service providers can access the minimarket system remotely with different privileges from a smart-phone application that was developed for this purpose.
The minimarket system has an average service time of approximately 60 seconds per customer. An analytical model based on queueing theory was used to assess the performance of the minimarket system for general service-time distribution and Poisson customer arrivals under various levels of load. Simulation results show that, under heavy load of 95% (when customers arrive at the minimarket every 63 seconds on average), the average response time for each customer is approximately 10 minutes.
The specific contribution of our work consists in the following:
Design and implementation—hardware and software—of an intelligent drive-through minimarket system (i.e., novel system design and construct) that has a set of novel features which improves both customer and provider services as follows:
Remote and convenient accessibility to a minimarket through a specialized smart-phone application.
Robotic drive-through capability.
System ability to predict current customer expenditures for each type of products and its ability to link that information with any existing discounts, then feeding this information to the customer.
Real-time monitoring of product quantities and revenue using a dedicated database and a specialized smart-phone application.
The use of machine-learning approach (ANN) to predict weekly customer expenditures.
Providing an analytical model to study the scalability of the minimarket prototype and evaluate its performance before installation.
Validation of the analytical model using a simulation model created using the R Language.
The rest of the paper is organized as follows: Section 2 presents related work in the literature, Section 3 gives a general overview of the minimarket prototype. The software and hardware parts of the design are presented in Sections 4 and 5, respectively. The analytical model used to evaluate the performance of the minimarket prototype is described with its necessary background in Section 6 and the discussion of simulation results that cross-validates the analytical results along with the evaluation of the prediction capabilities of the system are elaborated upon in Section 7. Finally, Section 8 presents our conclusion and future work.
2. RELATED WORK
The decline in costs of electronics and sensors, along with the wide spread of smart phones and the popularization of machine-learning techniques can enable supermarkets and shopping centers to be smart and provide adequate services to customers. In [3], researchers presented a communication robot for use in shopping malls to provide shopping information, route guidance and build rapport with customers. Although the robot was human operated, it was able to detect the presence of customers with floor sensors to initiate interaction and was able to identify individuals with Radio-Frequency Identification (RFID) tags. An alternative approach for identification, however, is to use secure customer accounts on a database, where customer information can be stored and identified using unique user Identification (ID) number. On one hand, this allows the supply of data directly from customers and making it accessible to stakeholders, service providers and decision-makers. On the other hand, the stored customer data can be used to provide additional services to customers (e.g. learning customers' shopping habits and offering them services that fit their habits). An experimental mobile, intelligent and interactive shopping assistant for shopping centers was studied in [4]. Two main points were focused on: the first was online building of maps of the shopping center using sonar-based grid maps and vision-based graph maps. The second was detection and tracking of customers during the guide tour using a probabilistic approach; both points were proved reliable. A low-cost smart shopping facilitator was proposed in [5, 6] to aid visually impaired and blind people. The facilitator provides guidance for customers in supermarkets to identify and purchase goods, RFID tags were implemented to identify products. A case study that emphasizes this approach was discussed in [7].
A very interesting attempt was made in [8] to make customers' payments a smooth process by modeling the trade-off between usability and security as an optimization problem. Since systems that allow customers to do payments with little effort (e.g., smart cards) usually do not require explicit approval from the customer, thus making the payment experience less cumbersome. However, other systems may sacrifice the ease of payment in favor of more accurate payment. The researchers proposed a mobile payment scheme that tries to minimize the transaction cost (cost function), i.e., to find the optimal point of the trade-off.
There has been several attempts to improve the functionality of goods-handling devices (e.g., vending machines, refrigerators, coffee machines, etc.) so it can better fit human needs. An experimental Internet of Things (IoT) vending machine which has different levels of customer involvements was designed and implemented in a Future Living Lab environment [9]. The vending machine allows customers to identify themselves so they can access personalized service. However, it was mentioned that identification can be done by means of using different digital tokens, such as regional cards, travel cards and Near-Field Communication (NFC) smart phones. Through smart cards, RFID and NFC devices, the customer can receive contextualized communication and marketing strategies as well as ad hoc interactions with the vending machine. A relatively similar attempt was made in [10]. A smart coffee vending machine was presented in [11]. Similarly, the design and implementation of a smart refrigerator based on neuro fuzzy embedded agent was discussed in [12]. The intelligent refrigerator is able to learn user habits and notify the user in cases where he/she consumes an unusual number of calories.
3. SYSTEM OVERVIEW
An overview of the smart minimarket system is illustrated in Figure 1. The system supports six different types of products. Using a special smart-phone application, a user (customer or provider) can securely connect to server and access the minimarket database to check the available products and their prices. If a user is logged in into the server as a customer, and in case the customer is doing a weekly shopping, the server uses the customer ID to predict the amount of money that the customer will spend in his/her current weekly shopping, then feeds this information back to the customer through the smart-phone application. The server uses machine-learning algorithm based on ANN to predict future customer expenditures. This is based on three features: the amount of expenditures on each of the last week and for the week before, and the amount of expenditures for the week before one year. Using this information, the server predicts the amount of expenditures in the current week and sends this information to the smart-phone application.
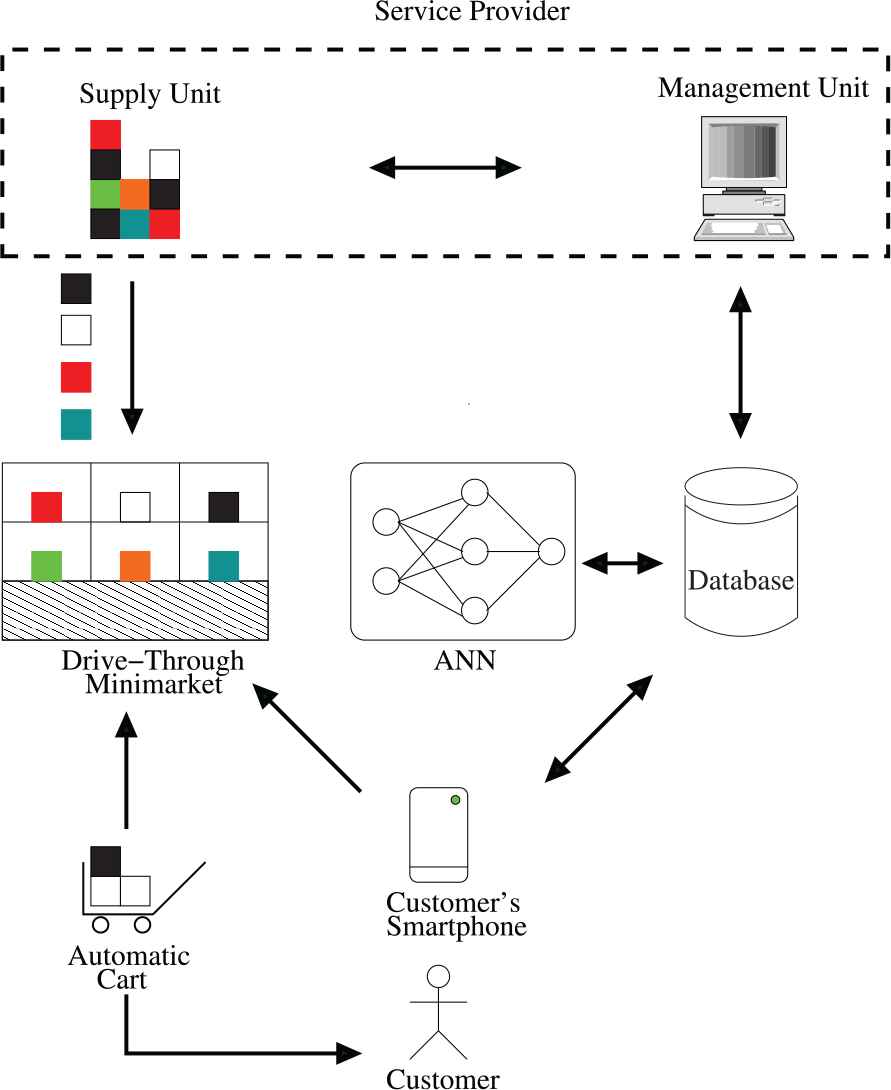
General design.
If the customer is nearby the minimarket and no other customers are being served, the smart-phone application allows the customer to place an order by tapping on a special button. This in turn initiates a sequence of automatic events, which starts by updating the database entries, then activating the relevant servo motors for the selected product items to drop the purchased quantities into an automatic shopping cart. Then, the shopping cart moves automatically to the customer's location. When the customer lifts all shopping items from the cart, the cart returns to its original position at the minimarket and waits for another customer to serve.
On the other hand, if a user is logged in into the server as a provider, he/she can view the product items and their prices, add new items, add pictures of items, specify their prices, know how much items are left in the stock and get an analysis of profit. This information can be automatically utilized by the “Service Provider” (see Figure 1), to compensate for any shortage in product items by automatically loading the necessary number of product items into the minimarket.
4. SOFTWARE DESIGN
There are three software components in the minimarket system: the software application, the database and the time-series prediction engine. We elaborate on each of these components in more detail in this section.
4.1. Software Application
In desktop software applications, when certain application needs the services of another application it invokes the whole application. In smart-phone applications, however, this behavior is more common. In order to facilitate this paradigm in an efficient way, a smart-phone application is usually broken into a set of Activities. Instead of invoking a whole application, a calling application invokes the required activity in the invoked application. In other words, the activity serves as an entry point for the calling application. Broadly speaking, one activity implements one screen in a smart-phone application.
An Android-based smart-phone application was developed to enable the user to interact with the minimarket. The application has 11 activities, we briefly discuss six essential activities of this application.
The Splash-Screen activity is the first activity. When a user opens the application, a splash screen which has the logo of the minimarket appears. The client can proceed to the next activity by tapping anywhere on the screen. The next activity is the Sign-In activity, where the screen prompts the user to fill in his/her personal information: his/her available balance, valid email address and valid password. However, a new unregistered user will be directed to the Sign-Up activity. In this activity, the user can register as a client by creating a new account and entering his/her information on the database of the system. Figure 2a depicts these activities. It is worth noting that only the system administrator can register the user as a provider.
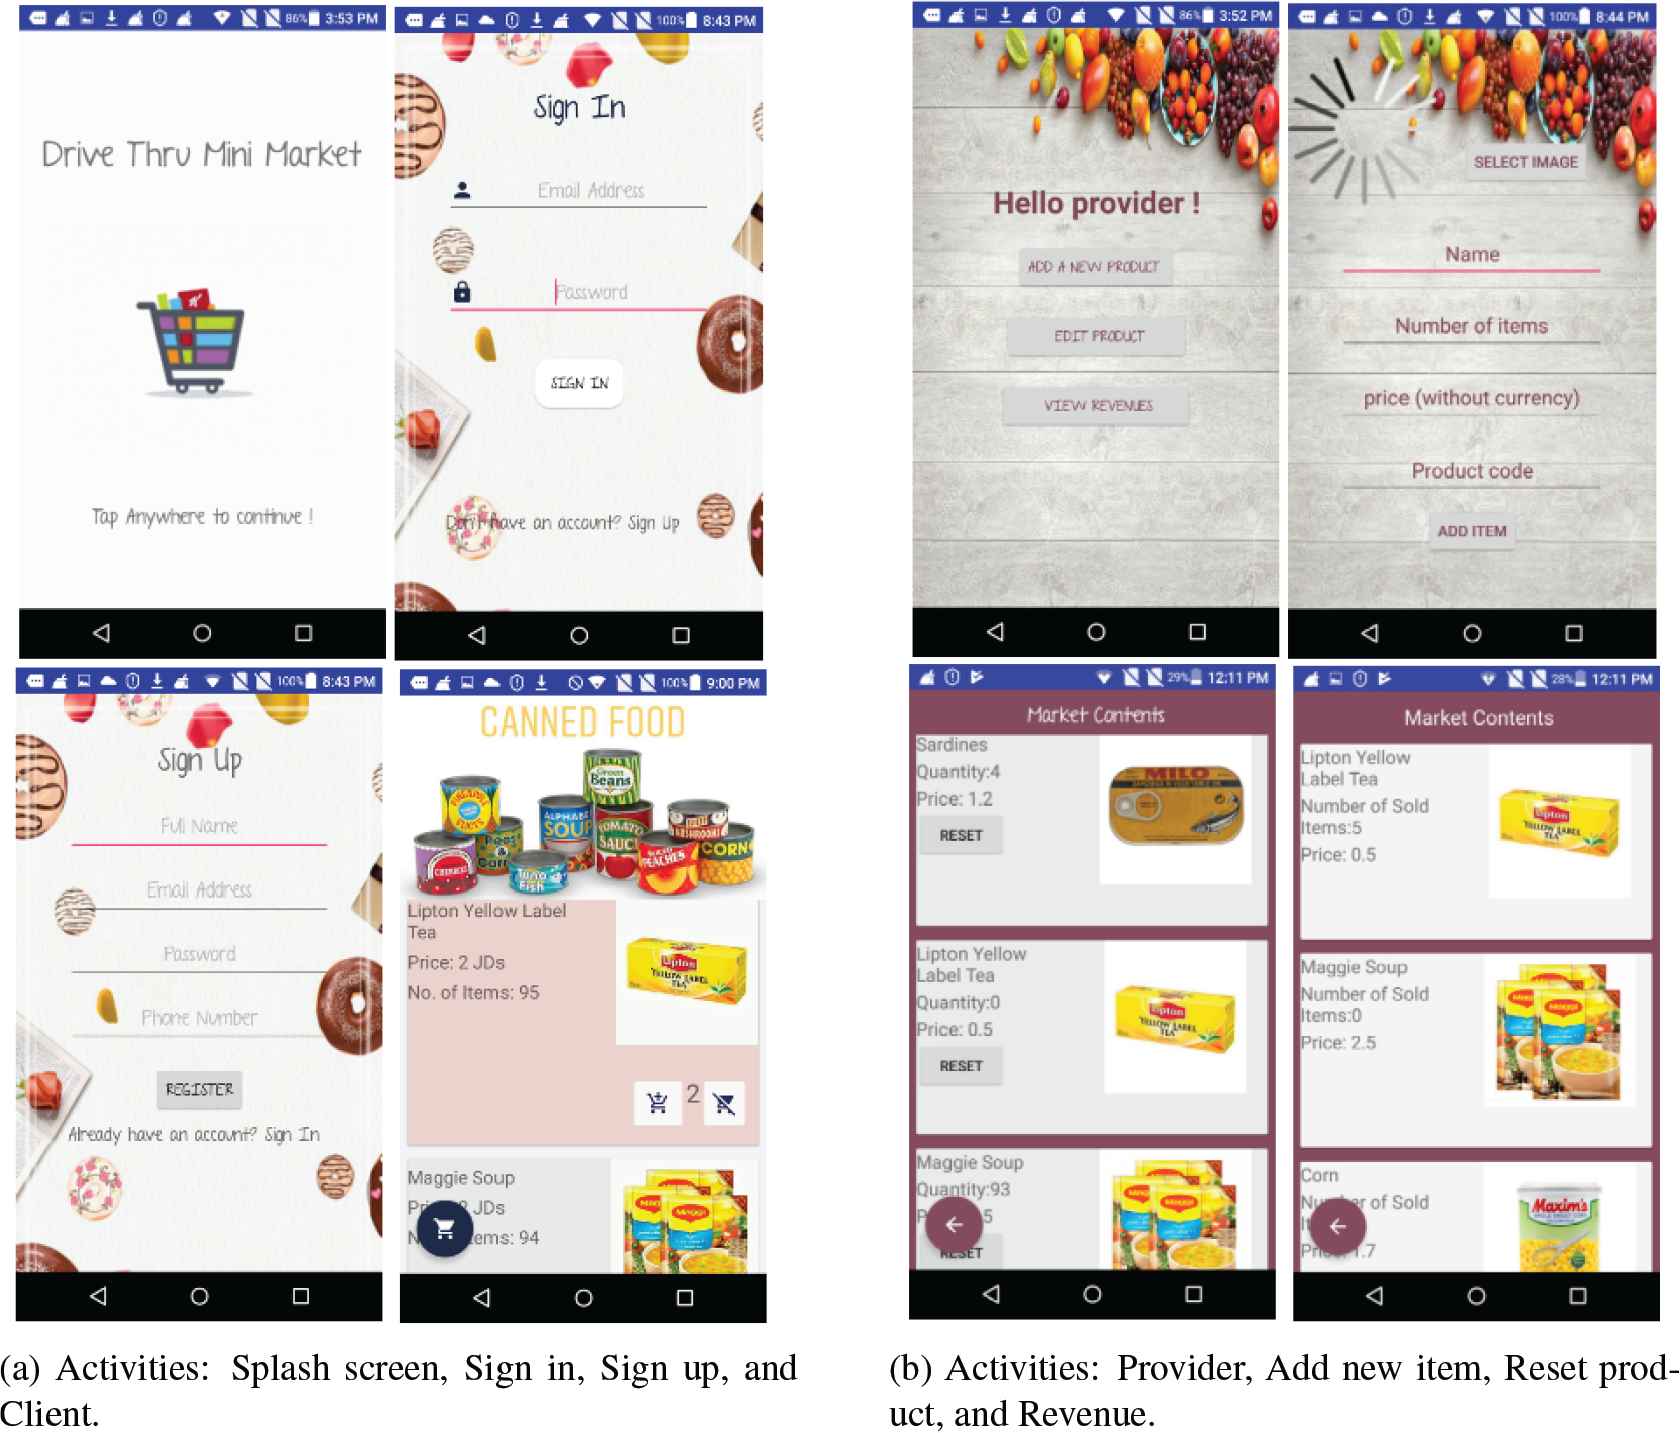
Application screens.
After a successful client authentication in the Sign-In activity, a client is directed to the Client activity (bottom-right screen in Figure 2a). This activity contains an advertisement banner of the products available at the minimarket. Below it, there is a list (card view) where each row in this list is dedicated for a single product. Each row contains the name, picture, price and number of remaining items of one type of products. In addition, that activity has two buttons that allow the user to either add or remove a product from his/her shopping cart. When one of these two buttons is pressed, a variable called ordered_quantity in the database is automatically updated. This variable is used to inform the provider about the exact number of purchased items per product.
The minimarket has six groups of products: Bread, Canned sea-food, Tea, Soup, Canned corn and Potato crisps. These can be changed to other types of products as required by the service provider. All products' information are retrieved from the database in real-time. When the client finishes selecting the items he/she wants to buy, he/she can tap on the shopping-cart button at the bottom-left corner of the screen (Client activity). This, in-turn will move the user to a new activity (shopping-cart activity).
Unlike the Client activity, which displays the information of all products available at the minimarket, the Shopping-cart activity displays a list view (card view). It shows only information about the products that the client selected for purchase. At the bottom of the Shopping-cart activity, there are two buttons: the first one is a button on the left (arrow button), if tapped on, it moves the user to the previous activity (the Client activity), before this action takes place, a warning message appears to warn the client that his/her shopping cart will be emptied. The second button is on the right of the screen, when tapping on it, an Alert Dialog appears showing the total price of the client's order. Once confirmed, the application sends a command to the microcontroller unit (MCU) at the minimarket. The command contains the name and number of each purchased product item. The purpose of this command is to activate the relevant motors, which will in-turn drop the items into the shopping cart. Finally, the application moves to the splash screen and waits for another order to be placed.
A provider must have a record in the database. If a user signs in as a provider, the application authenticates the email and password. If they match the information in the database, the user is granted access to the Provider activity. The screen of this activity consists of three buttons (see upper-left screen in Figure 2b). The first button (add a new product) allows the provider to add the name, number of items, price, product code and picture for a new product item. The second button (edit product) allows the provider to edit the information of any of the added product items. Finally, when the provider taps on the third button (view revenues) he/she can get information about the revenues of the minimarket.
The flowchart of the smart-phone application is illustrated in Figure 3a and 3b, where, P1 and P2 are off-page connectors, i.e., we start at the top of Figure 3a. When P2 is reached (at the bottom of Figure 3a), the flow is transferred to P2 at the top of Figure 3b. Similarly, when P1 is reached in Figure 3b, the flow is transferred to P1 at the top of Figure 3a. As it can be seen in Figure 3a, the application makes three decisions. The first one is to decide whether the user is a client or provider, and the second one is to decide whether the client is located nearby the minimarket or not. The application is able to determine if a user is still logged in (third decision), otherwise, it returns the first activity.
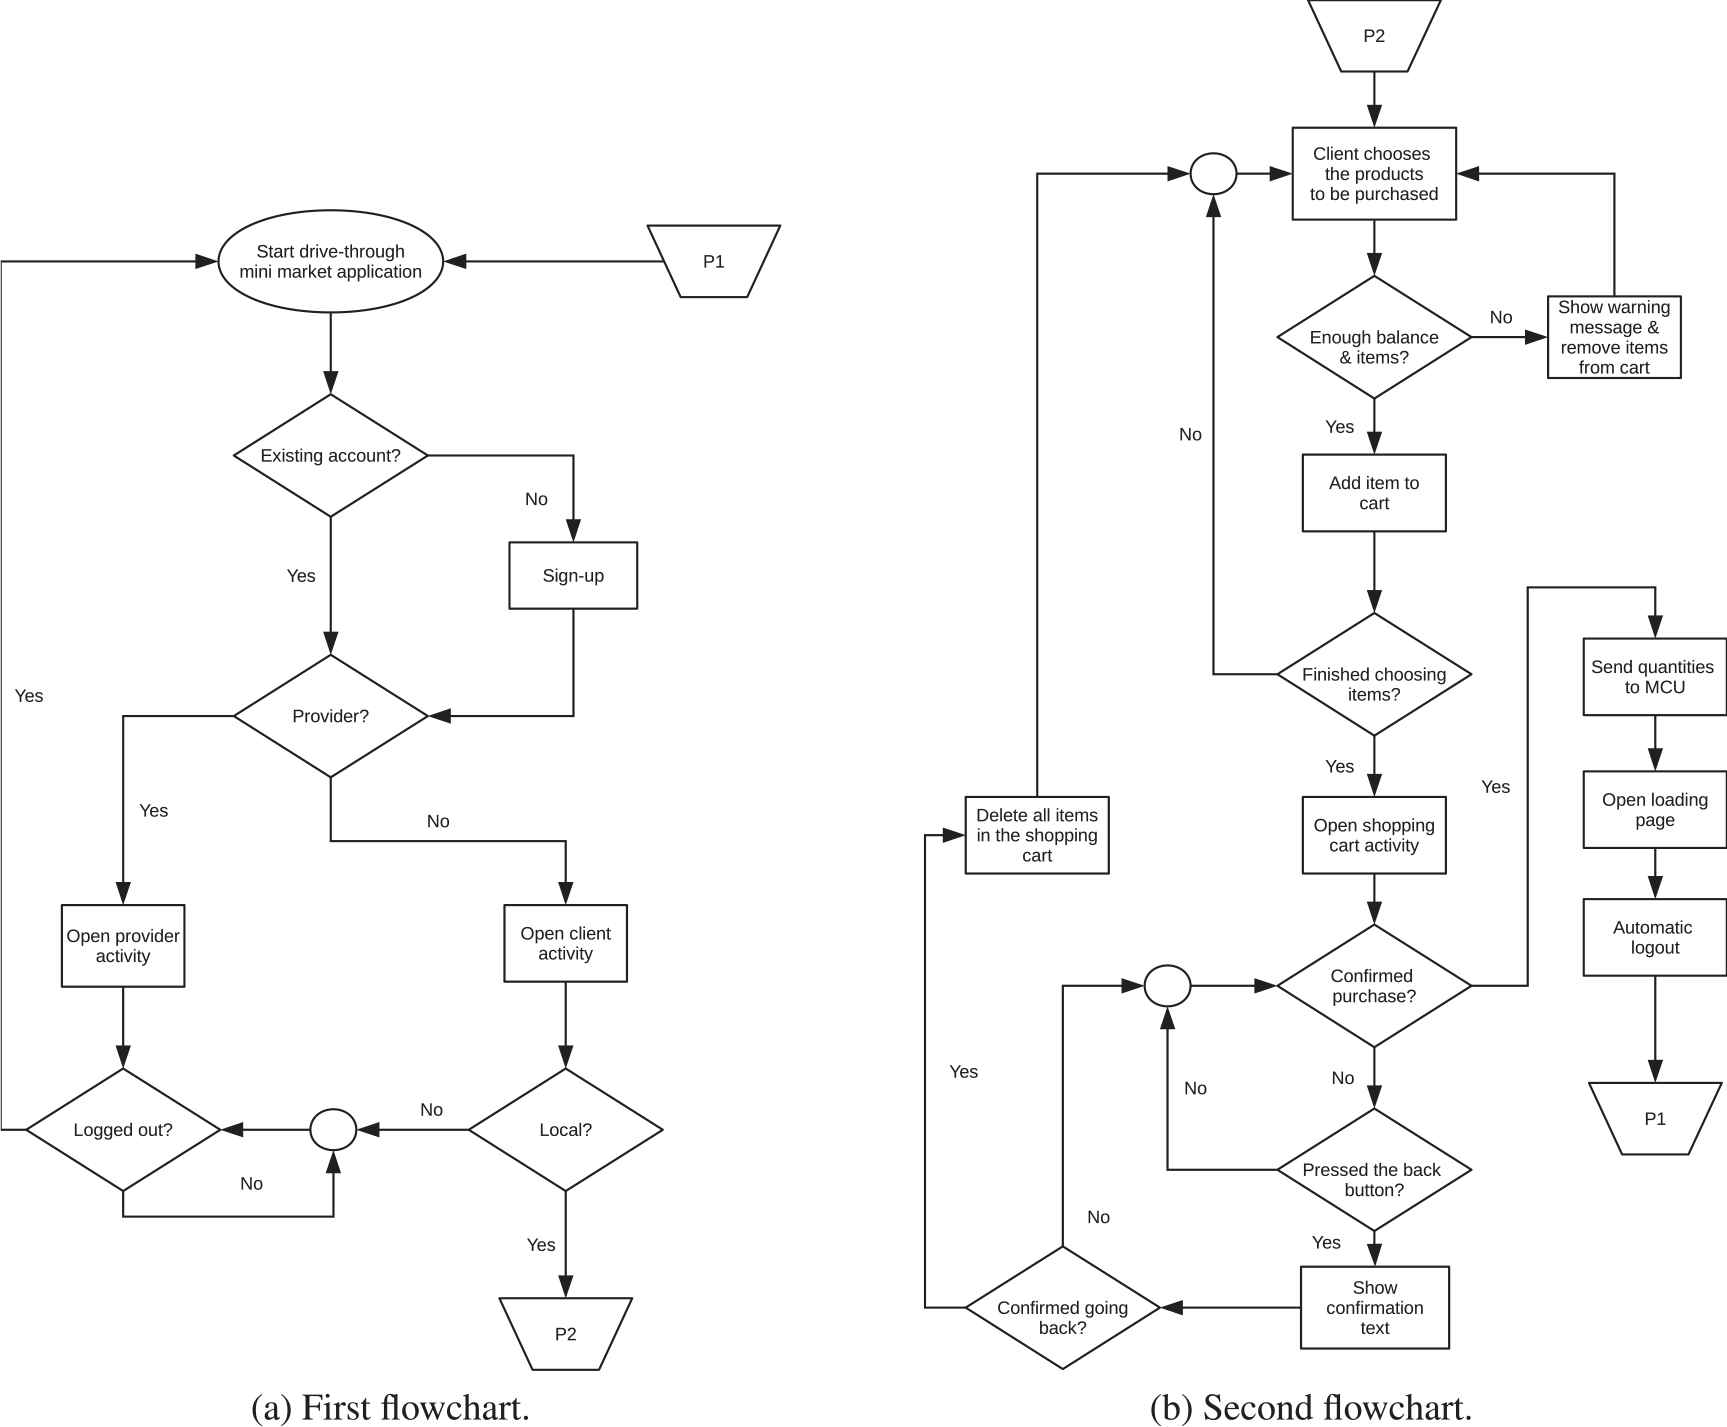
Flowcharts of the Android application.
If the client is local (see Figure 3b), has enough balance and the minimarket has non-zero items, he/she can proceed with his/her shopping. Once the purchase is confirmed, the application directs the MCU to handle the order. It is worth mentioning that if the user has zero-added items, he/she can still proceed and confirm his/her purchase, but no commands will be sent to the microcontroller and the application goes back to the first activity (P1 in Figure 3b).
4.2. Database
A database was used in this project to store users' and products' information. Each user (client or provider) has an entry which contains an ID number, balance, email address and password. A client can enter this information remotely using a secure network connection. A provider, however, has a different entry which, contains an ID, email address and password. Unlike a client's entry, a provider's entry needs to be entered by the system administrator.
Furthermore, the database holds entries for products' information, specifically, each product has an entry which contains its name, picture, price and number of items. Also, the database stores information about the number of purchased items, expenditures per client, and total revenue of the minimarket, from which, analysis and prediction of revenue and expenditures per client can be made to adapt the supply with the demand of customers, to better fit customers' needs and maximize provider's profit.
The database used in this project was implemented using a real-time database (Firebase [13]). This database implementation is based on Nonstructured Query Language (NoSQL) cloud database, which uses a different data structure (e.g., key-value, wide column, graph or document) for storage and retrieval of data in contrast to the traditional tabular approach used in relational databases. The approach adopted by this real-time database makes it scalable and allows some operations to be executed faster.
In addition, the real-time database provides an Application Program Interface (API) that allows the smart-phone application data to be stored on a cloud. The database relies on REpresentational State Transfer (REST) web service architecture. Specifically, it has REST API that uses Hyper Text Transfer Protocol (HTTP) requests to GET, PUT, POST and DELETE data. This architecture uses less bandwidth and thus is more suitable for Internet usage. From a security view point, the real-time database used in this project uses Secure Sockets Layer (SSL) to establish secure and encrypted connections between the smart-phone application and the database.
Contrary to the traditional way of storing data in tables, the data in this real-time database is stored as nodes, each of which has a number of key-value pairs. Three nodes were used: Shopping-Cart node, User node and Products node. The Products node contains the information about each product, whereas the User node contains information about each user and is updated each time a new user registers in the system. The Shopping-Cart node contains information about the products ordered by the client and is automatically deleted when the user logs out. However, for each order made by a client, the date of the order and the amount of client's expenditure per product in that order is retained in the database.
Nested nodes can be used in the database, i.e., a node can have a set of sub-nodes. For example, the Products node has a sub-node that contains automatically-generated IDs of all products in the minimarket. Each ID sub-node has 8 sub-nodes that defines the picture, name, number of items, ordered price, ordered quantity, price, product code and product ID.
4.3. Time-Series Prediction
The minimarket employs machine-learning algorithms to predict customer expenditures. An ANN was used for that purpose. The ANN was used as a prediction model due to its various advantages over other time-series prediction approaches. To illustrate, the architecture of ANN makes it non-linear, thus an ANN can predict non-linear time series. On contrary, classical time-series prediction approaches—e.g., Auto-Regressive Integrated Moving Average (ARIMA)—assume that time series is generated from linear processes, however, this might be incorrect assumption if the actual empirical time series (i.e., obtained from real system) is nonlinear, thus a prediction model based on ANN is more general. Furthermore, ANN is self-adaptive and is driven by the collected data sample which is used to train the prediction model, i.e., given a data sample (inputs and their corresponding outputs) it can be shown that ANN can approximate any continuous function to any desired accuracy, therefore ANNs are considered a universal approximators. Finally, ANN is immune to noisy data and can still provide accurate prediction of new unseen data even if the data sample that was used in training is noisy.
To illustrate the concept, we review the basic architecture of an ANN and show how time-series prediction fits into that, then provide an approach to improve the prediction capabilities. The basic information-processing element in an ANN is the artificial neuron, which can be defined as a set of connected links, each of which has a weight of its own. Say, e.g., that we have a set of inputs
The problem that ANN tries to solve is: given a set of inputs and their corresponding outputs, what are the weights and the bias values of the neurons that define the relationship between the input and the output? This can be formulated as an optimization problem with an appropriate objective function (loss function). Specifically, the mean squared error can represent an objective function. This can be expressed as
An alternative approach to time-series prediction is ARIMA model. To illustrate, a time series
One way to improve the prediction capabilities of a model is to combine both linear and nonlinear models in a hybrid model. For example, combining ARIMA and ANN [14]. Particularly, if we let
In order to achieve our time-series prediction aim, we constructed the ANN shown in Figure 4. This network has four inputs (three inputs and one bias value of “+1”) represented by small unfilled circles in the figure. The network also has three layers of neurons; the first two have 64 neurons each, and the output layer has only one neurons. Neurons are represented as big circles and weights/bias values were removed from the figure to keep it simple. The small filled circles in the figure are used to indicate that there are many neurons (i.e., up to 64 neurons). The output of the network is the output of the last neuron (layer 3) in Figure 4.
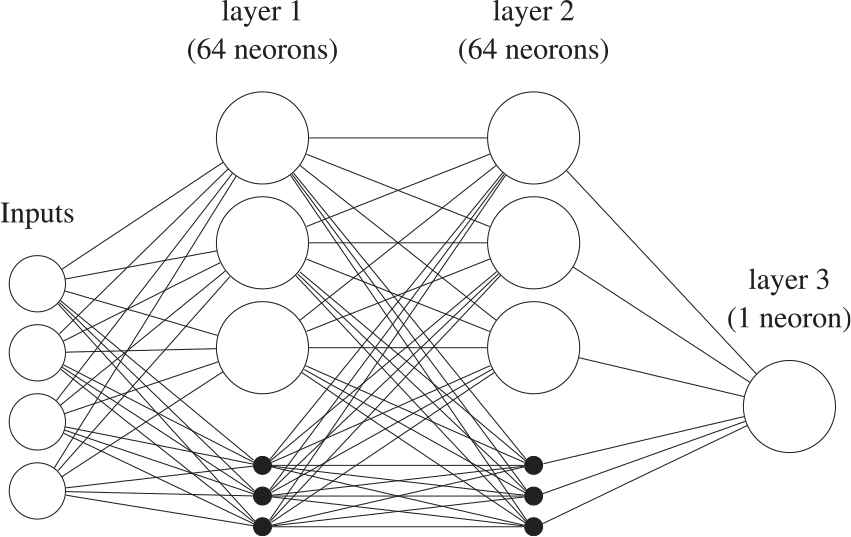
Fully-connected artificial neural network (ANN).
The ANN was trained as follows (see Figure 5):
The data set (samples) was divided into training samples (80%) and validation samples (20%).
The training samples were divided into batches of size
Each batch is then used to train the network, i.e., solving for the weights/bias values that minimize (3). Then the model parameters (weights/bias values) were updated.
For the next batch, the previous model parameters were used as initial values, and the process is repeated for all batches in the training samples; this is called one epoch.
The process was repeated for a number of epochs. For each new epoch, the training samples were shuffled and new batches were selected at random from the training samples. Model parameters' values propagated to the next epoch.
For each number of completed epochs, the mean absolute error (
Also, for each number of completed epochs, the mean absolute error (
Training stops automatically if the mean absolute error is less than a predefined threshold value, this is called, early stop.
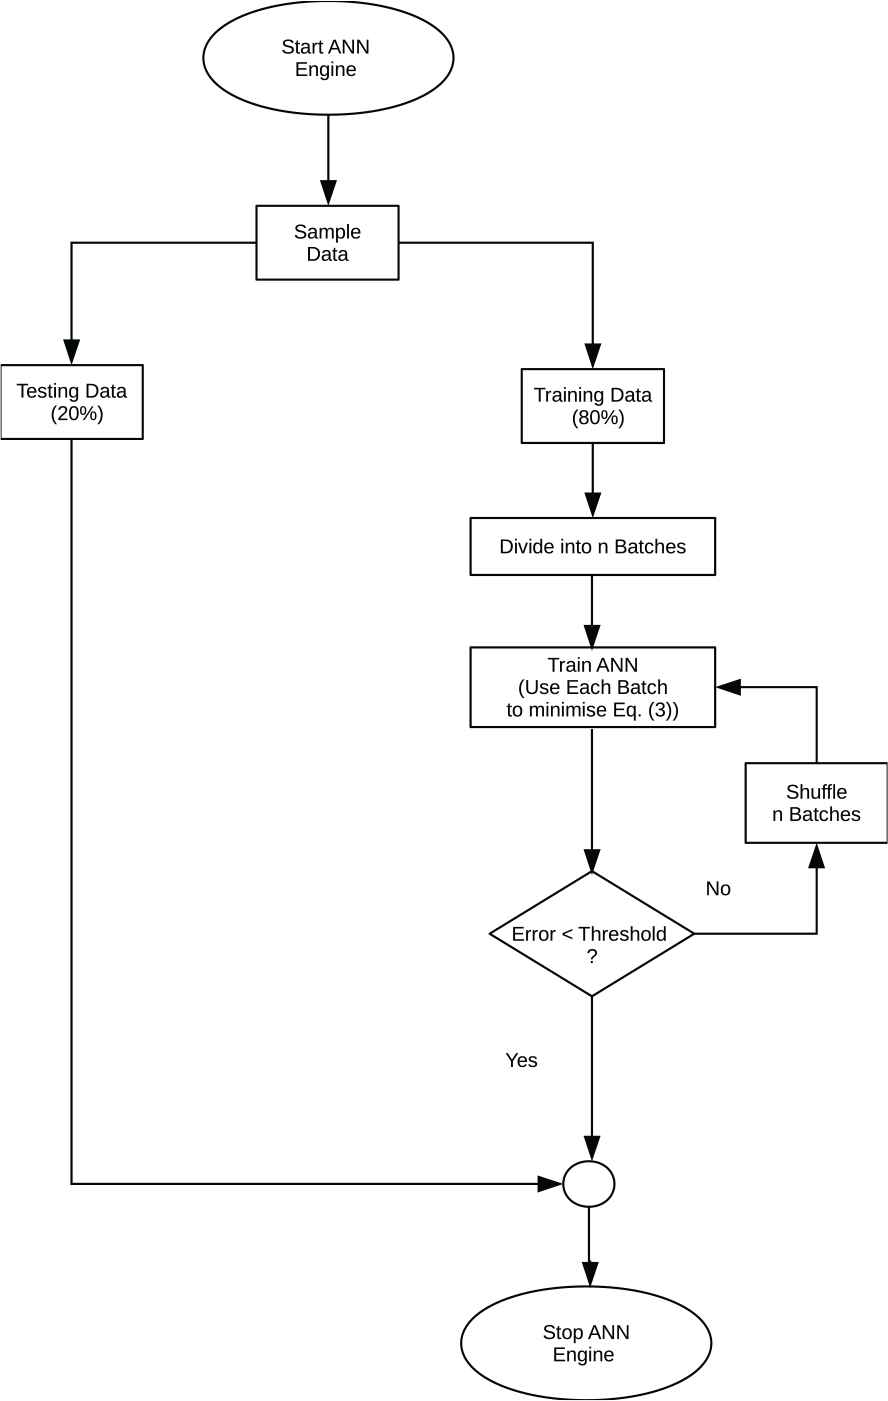
Artificial neural network (ANN) flowchart.
5. HARDWARE DESIGN
The hardware design of the minimarket is divided into two parts: the actual structure of the minimarket, where the products are placed, and the electronic circuitry associated with that structure, which controls the operations of the minimarket.
5.1. Minimarket Structure
The structure of the minimarket is similar to that of a vending machine. It is a rectangular box made from foam-core boards with six compartments organized in a
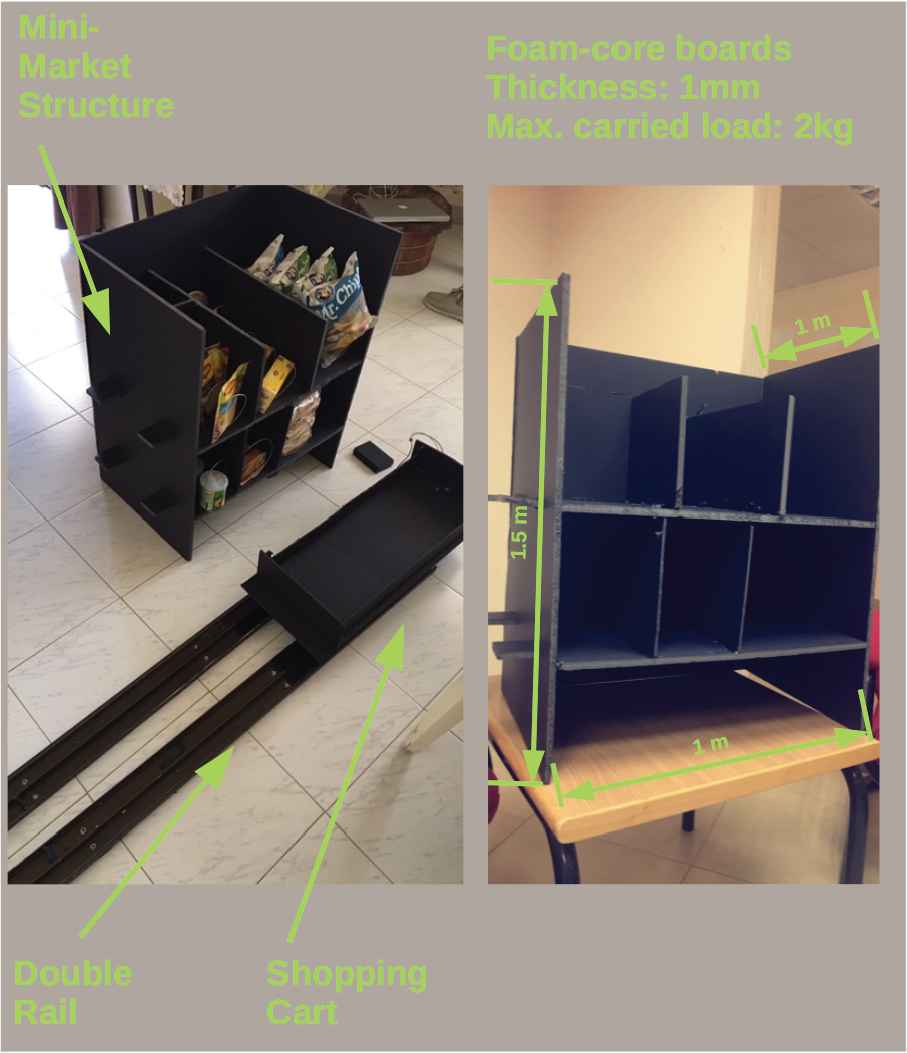
Hardware design.
Product items dropped from the aforementioned structure are placed in a robotic shopping cart which uses a dedicated rail to transport customer's purchased items to his/her location (drive-through window).
5.2. Electronic Design
The servo motors in minimarket structure is electronically controlled by a MCU (NodeMCU[19]), which is connected to the user's smart-phone via Wi-Fi (IEEE 802.11) wireless connection. When a client places his/her order, the smart-phone application identifies the product IDs and the number of purchased items of each product then maps this information into row-column pair and number of motor rotations, respectively. Subsequently, the application sends this information to the MCU through its wireless connection.
Another MCU (Arduino Uno[20]) is placed on the shopping cart to control its motors and synchronize its operation with minimarket structure's operations. Particularly, two sensors were implemented; one is an Infra Red (IR) sensor connected to the NodeMCU microcontroller, the other is a Light-Dependent Resistor (LDR) sensor connected to the Arduino Uno microcontroller. The former informs the NodeMCU about the position of the shopping cart, i.e., whether it is at position A (at the minimarket structure) or at position B (at the customer's location). If the shopping cart is at position A, a Light Emitting Diode (LED) is deactivated to indicate that the product items can be dropped into the cart. Once all purchased items are dropped, the LED is activated to indicate that the cart is ready to move to position B. This LED is strategically position in a Line of Sight (LoS) with an on-board LDR sensor. Thus, when activated; the LED triggers the shopping cart to start moving to position B.
The distance between position A and position B was measured and stored in the memory of the on-board Arduino Uno MCU. Given constant preconfigured Direct Current (DC) motor speeds, the on-board MCU computes the time to reach position B, then activates the shopping-cart motors for this period of time.
Finally, when the shopping cart arrives to position B and the client lifts his/her purchased items, he/she can return the shopping cart to position A by pressing an on-board push button, which reverses the direction of rotation of the shopping-cart motors and activate them for the period of time to reach position A.
As it can be seen from the schematic diagram of the NodeMCU microcontroller circuitry (see Figure 7), the micro controller is connected to six servo motors (shown as MG995), each of these servo motors is attached to a unique compartment in the minimarket structure and is responsible for rotating the coil in that compartment.
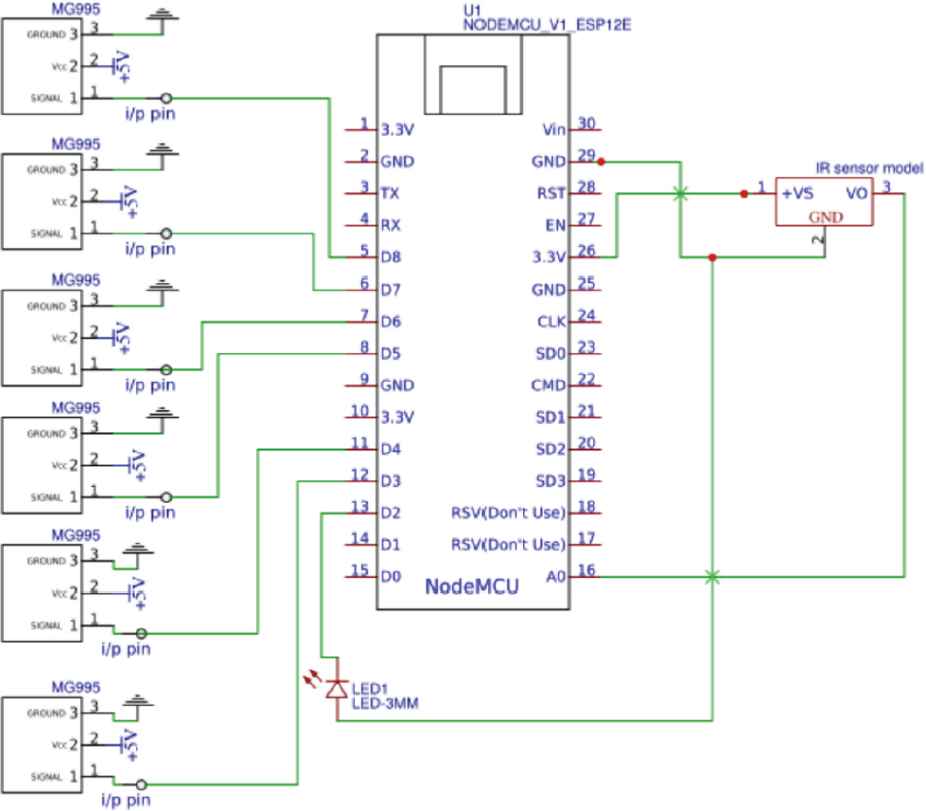
Microcontroller unit (MCU) circuit diagram.
6. ANALYTICAL MODEL
In order to analyze the performance of the drive-through minimarket system, we created a mathematical model to capture the dynamics of the system. Particularly, we modeled the drive-through minimarket system as a single-queue single-server queueing station with random customer arrivals and random service times. Figure 8 illustrates the queueing model of the system. Given a customer population, customers arrive randomly with an average arrival rate (
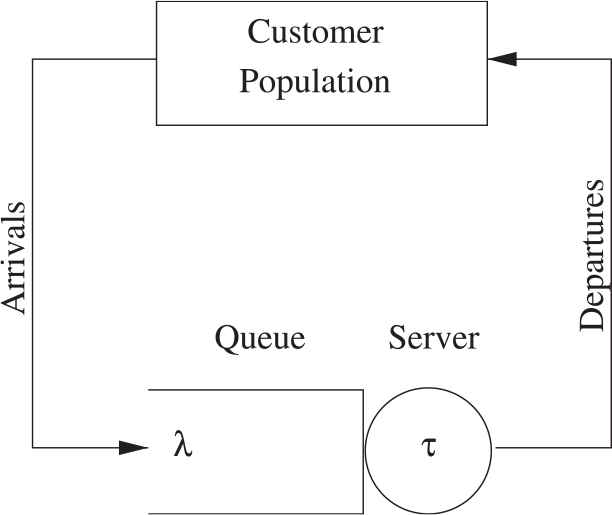
Queueing model of the minimarket prototype.
The service time is defined as the time period from the instant a customer makes an order from his/her smart-phone, to the instant he/she receives the order. The average service time was determined empirically, by first measuring the time it takes to serve a customer when he/she orders all the items of only one type of product. The experiment was repeated 30 times for each type of product and the average service time was reported, then divided by the total number items of that product.
We illustrate the process with the aid of Figure 9, where the y-axis shows the average service time of 30 experiments in the case when a customer orders all four items of one type of product. The x-axis, on the other hand, shows the weight in grams of one item of that type of product. We noticed that the values are close to each others. However, the maximum is approximately 20.5 seconds when 4 items of the maximum-weight product are ordered. Thus, we approximated the service time required to serve one item to be 5 seconds.
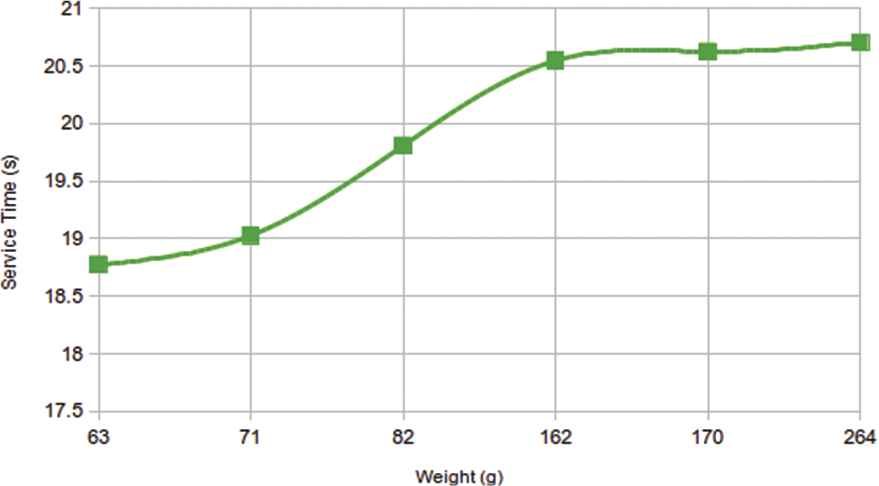
Service time for each type of product when all four items of that product is ordered.
We denote the service time by the random variable
Now, we model a single minimarket station first as simple
The response time of the system is defined as the time period from the instant a customer enters the system to the instant a customer departs from the system, i.e., the sum of the queueing time and the service time. The average system response time was used as a quantified measure to evaluate the performance of the minimarket station. This can be determined by first computing the average number of customers in the system using the Pollaczek–Khintchine mean value formula [21]:
In addition to random customer arrival, we studied the random arrivals of a random batch/bulk of customers. That is, we let
The first term of the right-hand side in (14) is a manipulation of the last term of the right-hand side in (12). The second term of the right-hand size in (14) accounts for the extra waiting time experienced by customers that are not the first in the batch. A proof of (14) is provided in [23].
7. RESULTS AND DISCUSSION
This section is divided into two parts. The first part discusses the results of the performance evaluation of the minimarket system, while the second part discusses the results of the ANN-based time-series prediction for an example data set.
7.1. Performance Evaluation
We cross-validate the performance measure obtained analytically with that obtained using a simulation model. We show in this section that both results agree and can be used to study the performance of the minimarket under various levels of traffic intensity and various levels of variations in the service time.
A simulation model was created using the R Language [24] to simulate the system presented in Figure 8. Customers arrived according to a Poisson random process (i.e., exponential inter-arrival times), and several values for the traffic intensity were used:
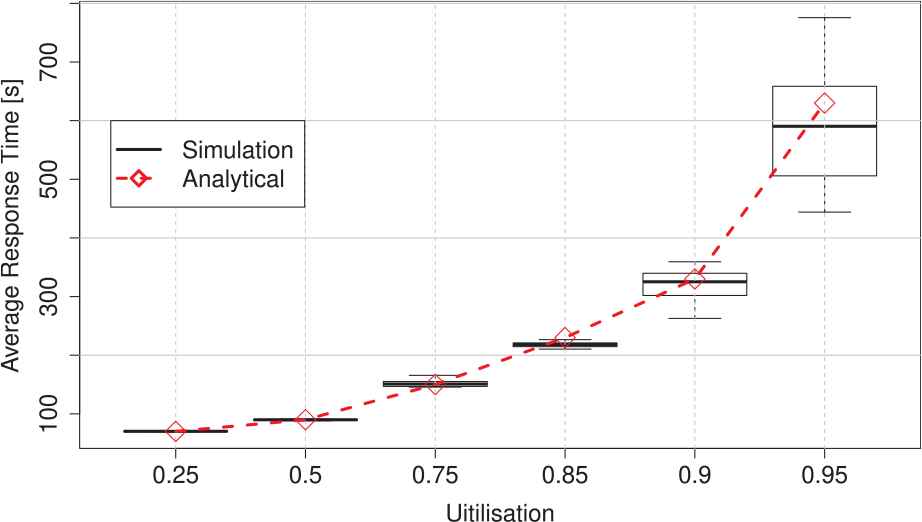
M/D/1: effect of variations in traffic intensity.
The Complementary Cumulative Distribution Function (CCDF) for the number of customers in the system (
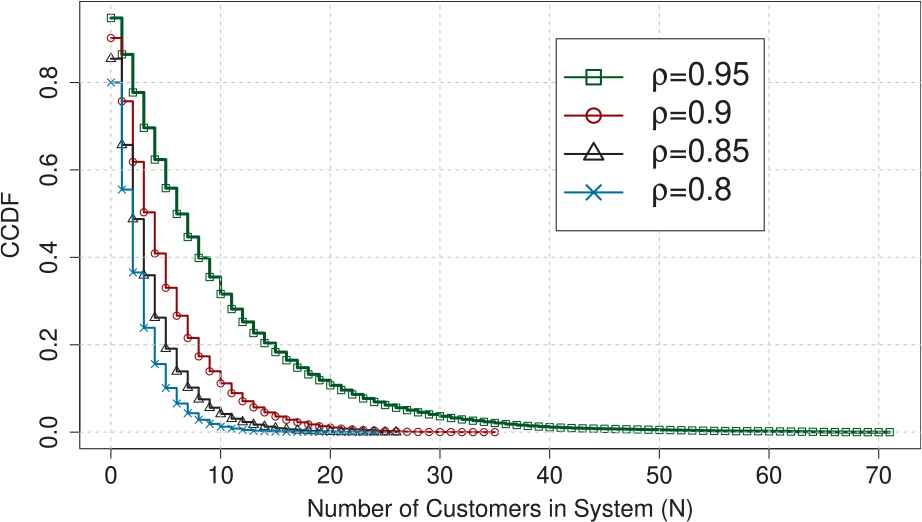
Complementary cumulative distribution function (CDF).
We also studied the effect of variations in service time on the average response time, specifically, we let the service time have a Gaussian distribution and used a set of three values for the standard deviation,
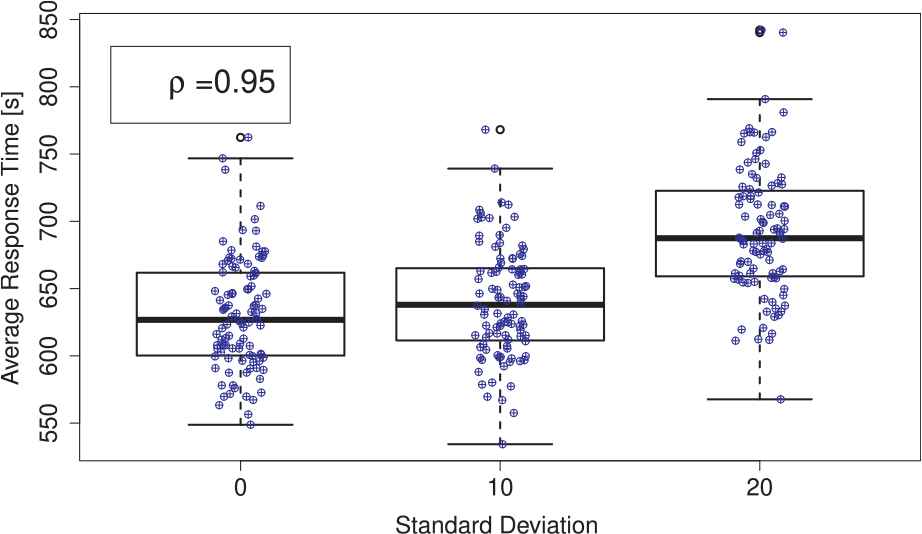
M/G/1: effect of variations in service time.
Finally, we examined the case of batch customer arrivals. Specifically, we considered a geometrically-distributed batch size with an average size
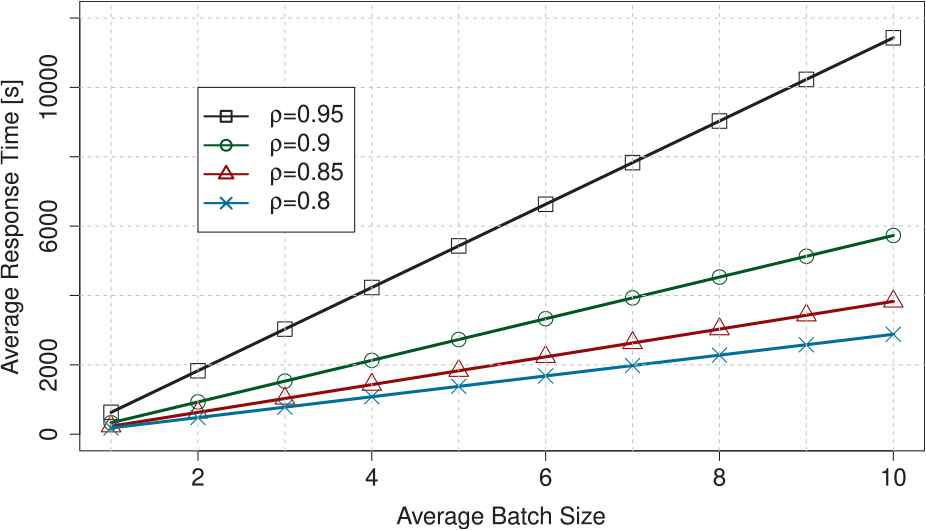
M[H]/D/1: effect of random batch arrivals.
7.2. Prediction of Customer Expenditures
To illustrate the prediction capability of the minimarket, we relied on the average annual expenditure of Jordanian households on groups of commodities and services by size of household (4-3 members) in Jordanian Dinar (JOD), as obtained from the Department of Statistics in Jordan [2] for the year of 2017. Table 1 shows the average weekly expenditure of middle-size (4-3 members) Jordanian households for a group of commodities commonly consumed by Jordanian families. From Table 1 we can estimate the average sum of expenditures for the given six types of products by approximately 26.56 JOD/week.
| Product | Expenditure (JOD/week) |
|---|---|
| Cereals and bread | 6.83 |
| Sea food | 0.9 |
| Sugar | 4.36 |
| Soft drinks | 3.38 |
| Diary and cheese | 8.32 |
Average weekly expenditure of Jordanian households of size 4-3 members on group of commodities.
We mimicked an arbitrary customer expenditures behavior by creating a time series that has an average value of 26.56 JOD/week and several periodic trends during a total period of 5 years. The minimarket system is able to extract such information for each customer from the database. This time series is fed into the ANN shown in Figure 4 to predict customer expenditures.
The ANN was implemented using the Python deep learning library, Keras [25]. An API was used to integrated the library with the R-Language programming environment. The network was trained according to the steps mentioned in Section 4.3. First, the number of epochs that produce sufficient accuracy was determined, then training samples were randomly grouped into batches. Each batch has a size of

Relationship between accuracy and number of epochs.
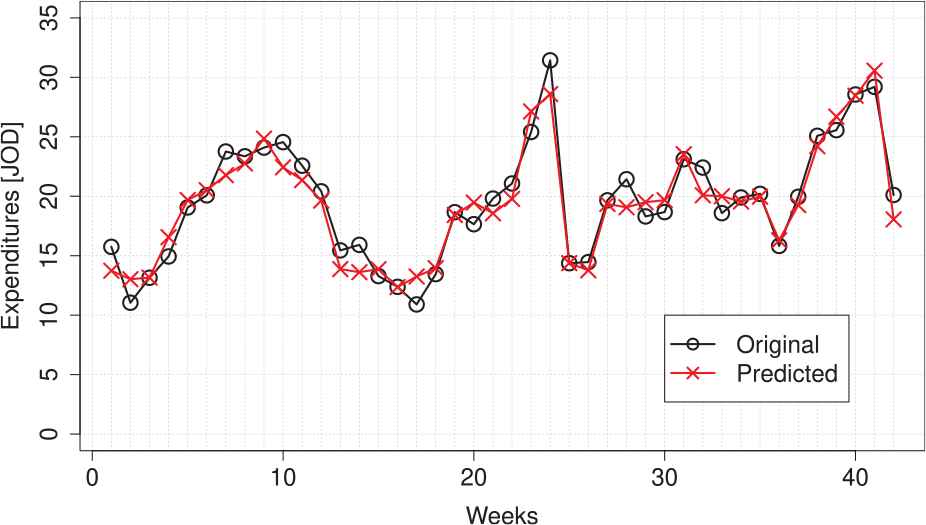
Weekly customer expenditures: predicted using validation samples.
8. CONCLUSION
One of the challenges posed by the growth of population in smart cities is managing supermarkets and shopping centers. In this paper, we discussed the design and implementation of a smart minimarket prototype, which makes the shopping experience more convenient for both, customers and providers. The minimarket provides intelligent services such as the prediction of customer weekly expenditures based on ANN, automatic nearby customer location detection, and automatic delivery of purchased products using a robotic shopping cart. Both customers and service providers can access the minimarket remotely with different privileges. The deployment of such relatively cheap smart minimarkets in smart cities will make the shopping experience more enjoyable and smooth for customers. Furthermore, it gives the service provider the chance to adapt quickly to customer needs, especially in crowded and busy cities where the life pace is fast.
As part of future work, a number of minimarket models can be implemented in a more realistic environment at the shopping malls in the capital city of Amman, where customers' data can be collected on a large scale, and service satisfaction of customers/providers can be measured and used to fine tune motor speeds to increase/decrease the service times, and thus improve the response time of the system.
REFERENCES
Cite this article
TY  - JOUR
AU  - Talal A. Edwan
AU  - Ashraf Tahat
AU  - Sara Hammouri
AU  - Leen Hashem
AU  - Leen Da'boul
PY  - 2020
DA  - 2020/06/23
TI  - An Intelligent and Automated Approach for Smart Minimarkets
JO  - International Journal of Computational Intelligence Systems
SP  - 852
EP  - 863
VL  - 13
IS  - 1
SN  - 1875-6883
UR  - https://doi.org/10.2991/ijcis.d.200611.001
DO  - 10.2991/ijcis.d.200611.001
ID  - Edwan2020
ER  -