
Whale Optimization for Wavelet-Based Unsupervised Medical Image Segmentation: Application to CT and MR Images

- DOI
- 10.2991/ijcis.d.200625.001How to use a DOI?
- Keywords
- Medical segmentation; Unsupervised machine learning; Wavelet transform; Texture features; Clustering; K-means; Fuzzy K-means; Particle swarm optimization; Genetic algorithm; Whale optimization; CT and MRI
- Abstract
Image segmentation plays crucial role in medical image analysis and forms the basis for clinical diagnosis and patient's treatment planning. But the large variation in organ shapes, inhomogeneous intensities, poor contrast, organic nature of textures and complex boundaries in medical images makes segmentation process adverse and challenging. Further, the absence of annotated ground-truth dataset in medical field limits the advantages of the trending deep learning techniques causing several setbacks. Though numerous unsupervised methods are reported in literature to combat the challenges in medical domain, achieving better segmentation quality still remains as an open issue. This work aim to address this issue integrating the strength of multiresolution analysis and the meta-heuristic optimization techniques for unsupervised medical image segmentation. The proposed approach employs undecimated wavelet frames to extract translation invariant texture and gray information at different orientations to effectively characterize the textures in medical images. Next, the approach introduces the latest meta-heuristic whale optimization algorithm (WOA), the global optimizer to enhance the performance of unsupervised clustering algorithm with optimized cluster centers to cluster the extracted wavelet texture features. Moreover, the study contributes to fill the gap in literature investigating for the first time different intelligence algorithms such as fuzzy, genetic algorithm (GA) and particle swarm optimization (PSO) for unsupervised medical image segmentation to demonstrate the efficacy of the proposed approach. Evaluation was performed on medical CT and MR images based on feature similarity (FSIM), dice (DC) and feature of merits (FOMs). Experimental results demonstrates the supremacy of the proposed approach over other intelligence algorithms. Finally, statistical study with ANOVA analysis was carried out to confirm the significance of the proposed approach in determining the optimal solution and displaying promising segmentation results toward diagnostic support for radiologist.
- Copyright
- © 2020 The Authors. Published by Atlantis Press SARL.
- Open Access
- This is an open access article distributed under the CC BY-NC 4.0 license (http://creativecommons.org/licenses/by-nc/4.0/).
1. INTRODUCTION
Medical image segmentation plays an extremely crucial role and forms the preliminary step in medical image analysis by segmenting the interested region from medical image according to clinical needs [1–4]. Unfortunately, most of the medical images exhibit poor contrast, large variation in shapes, inhomogeneous intensities and missing boundaries [5,6]. These issues makes the segmentation process in medical images are more difficult and challenging task. Though researchers has put forth extensive efforts in facing this challenge for the past few decades, there is always room for improvement and the problem still remains a paramount issue.
Recently, the supervised deep learning approaches has drawn the attention of researchers and several segmentation methods has been devised utilizing the significant features of deep learning techniques [7,8]. But the success of these methods solely relies on the quality and the amount of dataset employed for learning process. Acquiring the vast number of images along with its annotated ground-truth information especially in medical field is daunting task that comes at high cost [9]. To this end, unsupervised machine learning approaches has demonstrated lot of success as their working principles is based on the notion that all information required for image segmentation are contained in the given reference image and does not consider to learn any information in advance about the reference image. Generally, these unsupervised machine learning approaches perform segmentation in two steps, feature extraction (FE) and clustering [10,11].
FE is a very essential preliminary step in image segmentation as they empower the subsequent clustering process in improving the segmentation quality [12,13]. Keeping this in view, several FE methods has been devised in the past decades [14,15]. Most of the early work rely only on extracting gray scale information which is not suffice for medical images as it contains regions with different texture patterns [16]. Texture is a primary attribute of an image utilized to discriminate homogeneous regions with different patterns. Consequently, texture FE is a long-standing problem in medical image segmentation. To this end, multiresolution approaches has drawn considerable attraction in recent years [17]. Among them, Gabor and wavelet filters has emerged as an effective tool in providing multiscale view on texture and in enabling to extract features at different orientations [18]. Though, Gabor has demonstrated successful results, the adjustment of their center frequency and tuning of their filter parameters greatly influences their performance. Added on, Gabor filters are nonorthogonal and results in texture features that are significantly correlated. To overcome these shortcomings, the application of wavelet has been recommended in literature. This recommendation is considered and wavelet filter is adopted in the present study for texture FE at different orientations and scales.
In machine learning, Clustering is the best known and extensively used unsupervised learning technique for image segmentation [19]. Among clustering techniques, K-means (KM) algorithm stands as one of the most efficient and popular technique for the past few decades due to its simplicity and linear time complexity [20]. However, their efficiency is sensitive to the initial cluster centers. Another, long-standing drawback with KM is its convergence to global optimum is not guaranteed. In recent trends, meta-heuristic algorithms have proven their supremacy in solving any kind of optimization problems. Motivated in this direction, several researchers have attempted to introduce meta-heuristic optimization techniques into clustering framework in identifying the optimal cluster centers and improving the clustering results [21–23]. However, most of conventional optimization techniques such as genetic algorithm (GA), particle swarm optimization (PSO), etc., are confronted with the problem of converging to local optima. As reported in literature, an optimization algorithm with balanced exploration and exploitation capabilities can be used to solve this problem.
Whale optimization algorithm (WOA) is a latest and effective meta-heuristic optimization algorithm with outstanding advantages such as strong global optimization ability, a smaller number of parameter adjustments and strong tendency to dynamically balance the exploration and exploitation ability on search space [24]. Also, the application of WOA has shown incredible success in many fields over the past two years [25,26]. Moreover, encouraged by the promising results of WOA in medical field [27–29], in the present work, we are introducing for the first time WOA within texture-based clustering framework to achieve better segmentation results with optimal cluster centers.
The key contributions of this work to the literature are as follows:
A new approach that integrates the advantage of wavelet texture features and WOA into clustering framework for medical image segmentation is proposed. This is accomplished in three steps, first texture features are extracted in wavelet domain subsequently image space is transformed into feature space defining feature vector with texture, gray level and spatial information. In the second step, WOA is applied to determine the optimal cluster centers based on compactness and separation. Finally, clustering algorithm is employed to the feature vector space to accurately segment the reference medical image.
A new approach utilizes the strength of undecimated wavelet frames to extract translation invariant texture and gray scale information at different orientation to best describe the texture patterns in medical images. This attempt of defining wavelet texture feature descriptor is new and has not been investigated before for medical image segmentation.
To the best of knowledge of the authors, no previous work so far has used WOA for solving texture-based clustering problem in medical image segmentation and this work is the first attempt in this field. Further, this work aims to fill the gap in literature investigating for the first time different intelligence algorithms such as fuzzy, GA and PSO for texture-based unsupervised medical image segmentation.
Application of the proposed approach for medical image segmentation is demonstrated conducting extensive experiments on CT and benchmark MR images. Obtained results display clearly the advantage of proposed approach in finding the global optimal solution. Also, the significance of the proposed approach over other intelligence algorithms is proved with statistical ANOVA test.
2. BACKGROUND
2.1. Wavelet Transform
In the past decades, the development of FE techniques has witnessed substantial development because of their crucial role in addressing complex problems in various fields such as computer vision, image processing and pattern recognition. Despite numerous techniques are reported for FE, the challenge is still gaining momentum especially in medical image processing because of the complex tissue structure. To this end, wavelet transform (WT) has proven to be an effective tool for texture FE due to its excellent properties for multiresolution and optimal spatial-frequency localization [18]. Mathematically, the WT of 1D signal
The family of wavelet functions are generated by performing translation and scaling operation on “mother wavelet,”
Here, a and b represents scaling and translation factors, respectively. Under multiresolution decomposition, 1D signal
The extension of WT multiresolution decomposition for 2D images is given by Eq. (4) to produce four subband images, low-low (LL), high-low (HL) and high-high (HH). Here, LL represents approximation image with low frequency components of the original image. On other hand, LH, HL and HH represents feature images of the original image in three orientation such as vertical, horizontal and diagonal, respectively. Only the approximate image is utilized for the next level decomposition. The process is repeated until required level of multiresolution is reached. Figure 1 illustrates two-level decomposition process for WT.
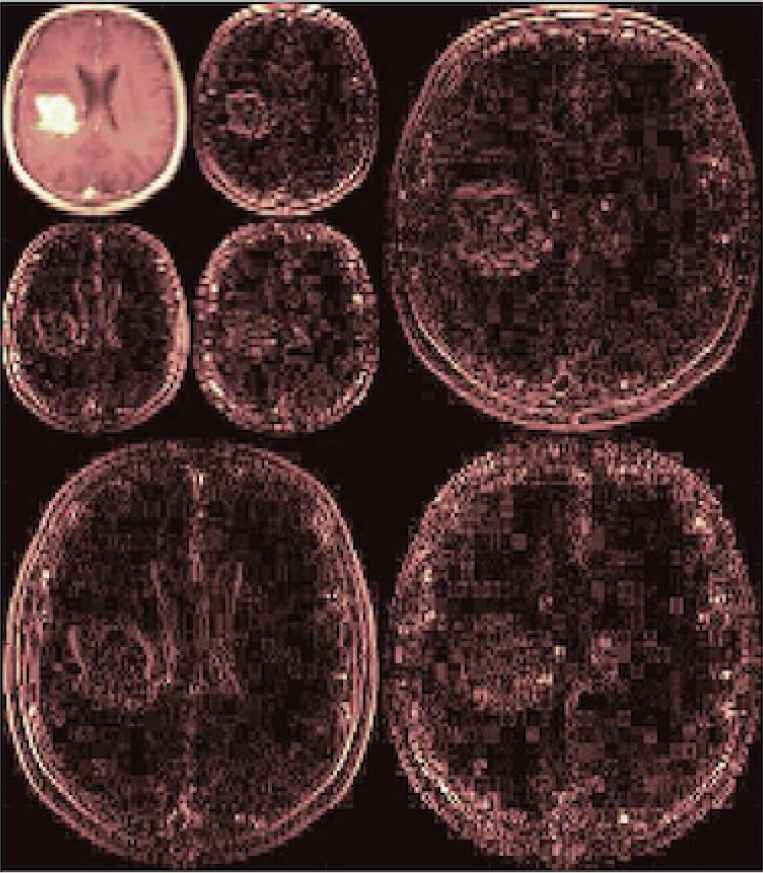
Wavelet decomposition at level 2.
2.2. Clustering Algorithm
Clustering is an unsupervised machine learning algorithm employed especially for pattern recognition [18]. It aims to group image pixels with similar pattern values into same cluster. There are two types of clustering technique namely, discriminative and generative [19]. The present work employs discriminative clustering technique. This category of clustering groups image pixels according to the pairwise similarities between the pattern values. The most widely used discriminative clustering algorithm in real-world pattern recognition application is KM [22]. It groups the given image pixels into k clusters minimizing the average squared distance of within clusters. Thus, the objective function of KM is written as follows:
In solving the above the objective function, the KM algorithm starts the clustering process by selecting randomly k initial cluster centers and then refines these centers iteratively as follows [22]:
Assigns each image pixels to the nearest cluster center according to their Euclidean distance measure
Revises each cluster center computing the mean of all image pixels in a cluster.
The KM converges when there is no further change in assignment of image pixels to clusters
2.3. Whale Optimization Algorithm
WOA is a renowned meta-heuristic algorithm proposed by Mirjalili and Lewis in 2016 for modern optimization process [25,31]. This algorithm takes the inspiration from the behavior of humpback whales in nature. In its mode of operation, the WOA is similar to GA and PSO but are more powerful in exploring the global solutions [26]. Compared to PSO, WOA stores only global optimal solution during the search process and enables to enhance the storage efficiency. On other hand, in contrast to GA, WOA explores variety of optimization paths retaining the knowledge of best solutions at same time its optimization strategy is more comprehensive. Owing to its exploration/exploitation ability, WOA is considered as a global optimizer. In general, it adopts the three main operations namely, encircling prey, constructing bubble-net attacking and searching for prey to identify its global optimal solution. The working principles of these operations are summarized below [25,26].
2.3.1. Encircling prey
During this operation, WOA algorithm presumes the current best solution as the location of the target prey and the rest individual whales tries to encircle the prey updating their positions. The mathematical representation of this behavior is as follows:
Here,
2.3.2. Bubble-net attacking method (exploitation phase)
WOA mimics this behavior of humpback whale performing two strategies: shrinking encircling and spiral updating. It adopts 50% probability in choosing between these two strategies to update the positions of whales in the process of optimization. This is mathematically modeled as follows:
2.3.3. Search for prey (exploration phase)
During this operation, the exploration (global search) ability is enhanced by updating the position of individual whales according to the position of randomly chosen whale rather than the position of the prey (best optimal solution discovered so far). This enforces the individual whales to swim away from reference whale and enables to reach global optimum rather than getting stuck to local optima.
Here, vector
3. PROPOSED METHODOLOGY
The architecture of the proposed approach consists of two key components as illustrated in the Figure 2. The detail description of these components are as that follows.
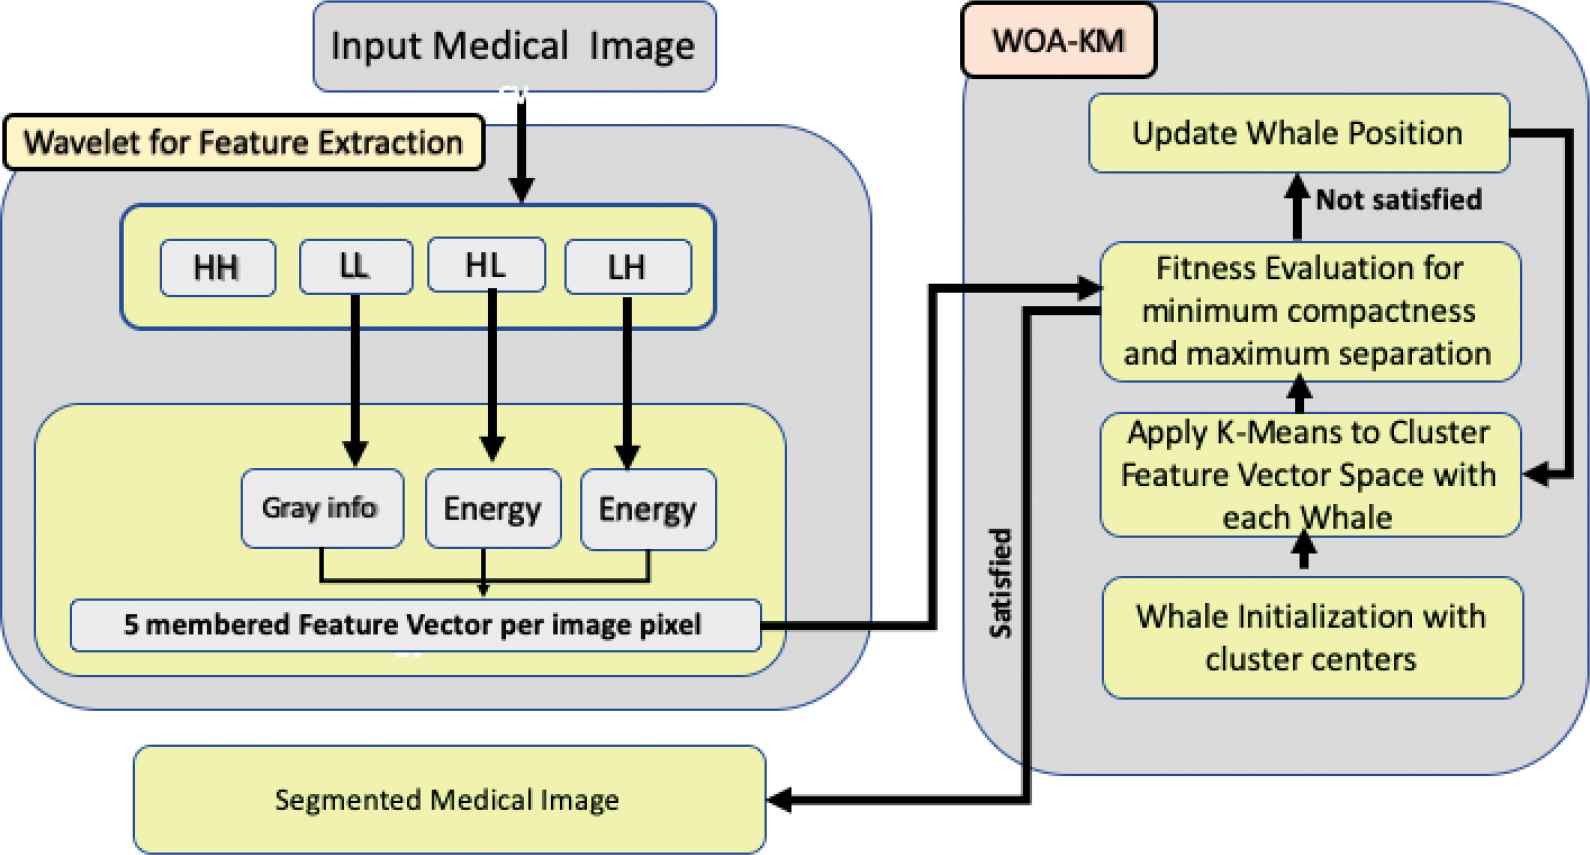
Architecture of the proposed approach.
3.1. Wavelet for Texture FE
The present work employs an overcomplete wavelet representation called discrete wavelet frame (DWF), a variation of WT, for texture characterization [32]. In contrast to WT, no down-sampling is performed in DWF decomposition along the levels of hierarchy. This provides translation invariance and anti-aliasing that are highly desirable for texture description of input image. Also, DWF does not imposes any restrictions on filter design and selection. The present work avails these inherent characteristics of DWF to estimate the texture statistics more effectively and detail the characterization at region boundaries more precisely.
In this process of texture feature characterization, the reference image is first decomposed with DWF to one-level and then the wavelet energy features are computed using Eq. (11) on the resulting LH and HL detail images due to fact that the most of the texture information are contained only in these subimages [33,34]. For this purpose, the present work employs Daubechies wavelet function considering its low complexity and high texture characterization capability. Thus, feature vector is generated for every pixel in the image with spatial, gray scale and energy information that are required for image segmentation.
Here,
3.2. WAO-Based KM for Image Segmentation
The present work addresses the drawbacks of KM clustering for texture-based image segmentation system in two stages: Optimization and Segmentation. In optimization phase, a meta-heuristic algorithm called WOA is applied to identify the optimal or the near optimal cluster centers for KM clustering. Subsequently, the identified optimal cluster centers are utilized in KM clustering for image segmentation to achieve fast convergence and avoid being trapped in a local optimal solution. The encoding scheme, fitness function and the convergence criteria of the proposed WOA are detailed in Section 3.2.1.
3.2.1. Population generation
In the present work, each whale represents a clustering solution and contains the centers for the given number of K clusters. The dimensional size of the whale depends on the number of texture attributes computed for segmentation process and the predetermined number of clusters. If K and
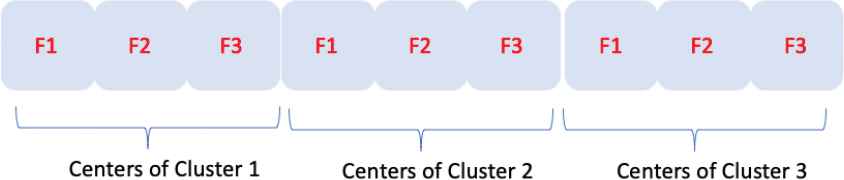
Whale encoding for the proposed approach.
3.2.2. Fitness function
The fitness function plays crucial role in determining the fitness of the clustering solution encoded in the whale population and enables to identify the optimal clustering solution that can lead to achieve accurate image segmentation. To this end, the fitness function utilized in the present work is formulated considering the two most widely used criteria in clustering [35]:
Compactness: evaluates how closely related are the image pixels within the same cluster. It is measured by computing the average of distances between the image pixels within same cluster as follows:
Thus, compactness is variance that should be minimized to obtain good clustering.
Separation: evaluates how widely the clusters are separated. It is measured by computing average of distances between different clusters as given below and this variance should be maximized to obtain well-separated clusters.
Now, the fitness function is designed as a regularization function combining these two criteria as given in Eq. (14). Here, the separation criteria that has to be maximized is represented as
3.2.3. Termination condition
The optimization process requires indeed an adequate termination criteria to limit the computational expenses and obtain a reasonable fitness. The present study as suggested in [36] terminates the hunting process of WOA, when any one of the following criteria is met: (i) the global optimal solution is discovered, (ii) the maximum iteration is reached, (iii) the fitness of all whales are same. After the reach of termination condition, the whale with minimum fitness value is recommended as the optimal cluster centers. The algorithm of WOA for KM clustering in the proposed approach is given in Algorithm 1. Also, the flow of input image through the two key components of the proposed architecture to obtain segmentation results with WOA optimized cluster centers is shown in Figure 4.
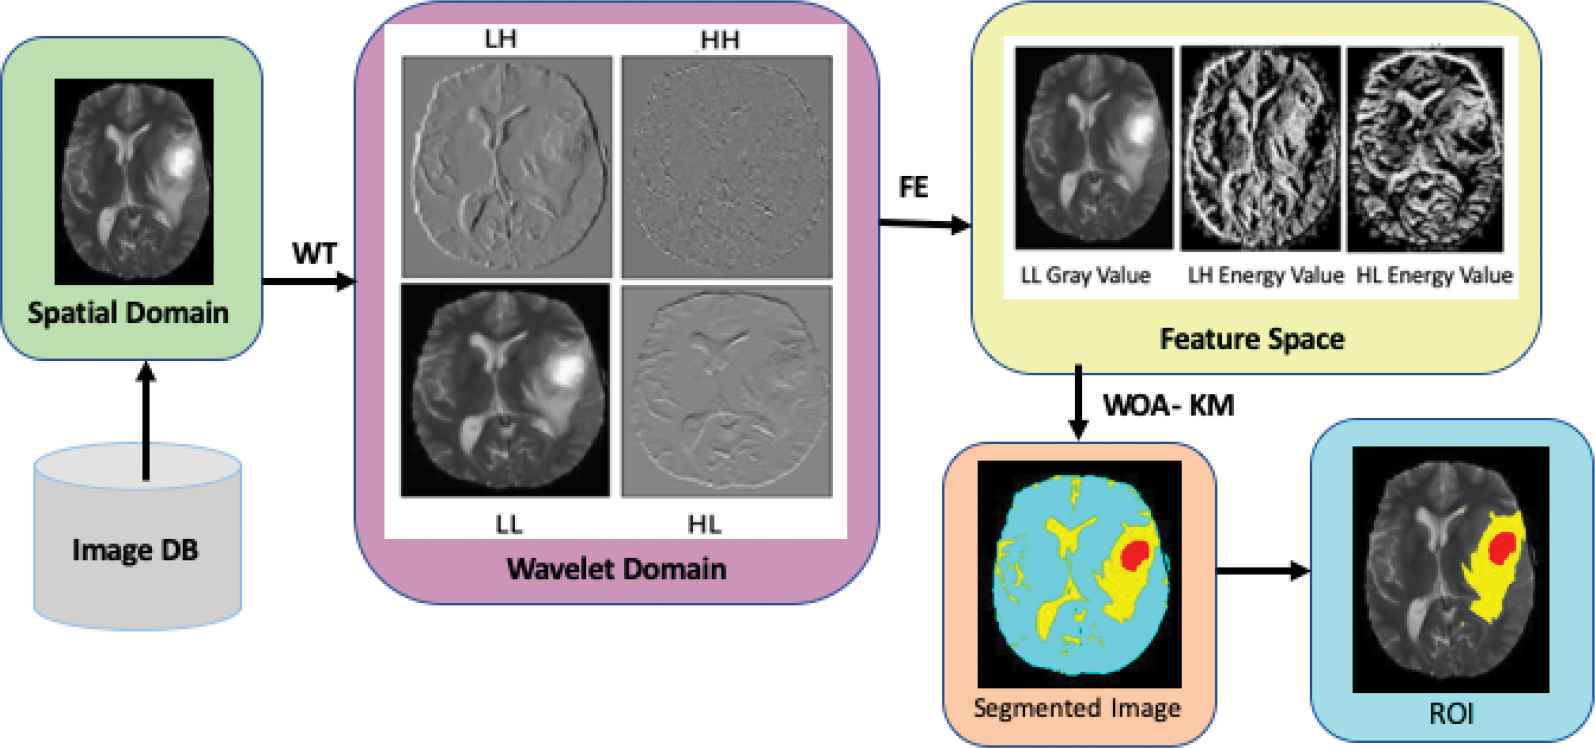
Flow of image in the proposed approach.

4. EXPERIMENTAL SETUP
This section describes the environment employed for conducting experiments to evaluate the performance of the proposed methodology. First, it introduces the description of the dataset utilized in this study. Subsequently, it illustrates briefly the parameters settings and different evaluation metrics chosen to compare the performance of different algorithms.
4.1. Dataset Description
The proposed method is validated on real patient data provided by MICCAI BRATS [37] and Medpix [38]. Both these databases are publicly available and thus do not require ethical committee approval. Medpix is a radiology archive integrating images from various types of imaging modalities. The archive contains teaching cases and case reports with 59,000 indexed and curated images, from over 12,000 patients. The MICCAI BRATS dataset is a benchmark dataset for MRI brain tumor segmentation with 220 high-grade and 53 low-grade patient images. Each patient's brain scan is included with four MR sequences T1, T1c, T2 and FLAIR. The present study evaluates the performance of the proposed method establishing two different set of experiments. The first set of experiments are conducted selecting randomly five CT images and second set on five T1c brain scan MR images.
4.2. Parameter Setting
To ensure the capability of the proposed method, comparison was carried out with other most commonly used intelligence algorithms such as adaptive KM, fuzzy, PSO and GA. For a fair comparison, all algorithms used in this paper were experimented under same platform and standard condition. For example, after several runs on trial and error basis, it was noted that the behavior of all these algorithms approached the best solution when the maximum number of iterations and population size was set as 150 and 100, respectively. Similarly, other parameters were selected to maintain both the stability of the algorithm and obtaining high-quality solutions. The cognitive, social and neighborhood acceleration coefficient of PSO was set to 2, 2 and 1, respectively. The crossover and mutation rate of GA was set to 0.8 and 0.06, respectively. Other parameter values used in the present study to adjust the performance of WOA is presented in Table 1. For all these experiments, the number of clusters was determined based on the number of coherent regions in the reference image.
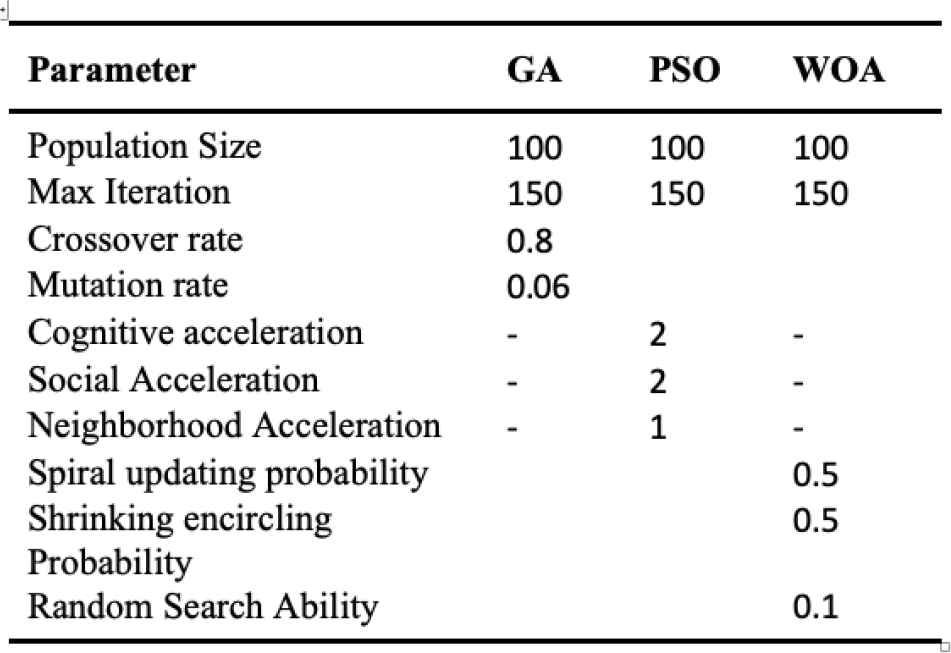 |
GA, genetic algorithm; PSO, particle swarm optimization; WOA, whale optimization algorithm.
Parameter settings for optimization algorithms.
4.3. Performance Metrics
The quantitative metrics used in the present study to assess the quality of segmentation results of different algorithms are described briefly as follows: this section presents the performance metrics used to compare the performance of the proposed method for medical image segmentation.
4.3.1. Feature similarity
This index measures is used to assess the interdependencies between the ground-truth image and the segmented image based on two key criteria: phase congruency and gradient magnitude. The phase congruency is invariant to contrast and is capable of detecting important features in frequency domain. The similarity of phase congruency between two images are computed as follows [39]:
In the same way, the similarity of gradient magnitude of two images are obtained as follows:
4.3.2. Dice
It is another popular index that measure the amount of overlap between the ground-truth image and the segmented results. It is computed as follows [40]:
4.3.3. Feature of merits
Feature of merit (FOM) is another performance measure proposed by Pratt to measure image segmentation performance. It is determined using the formula given below [41]:
5. RESULTS AND DISCUSSION
This section presents and compares the segmentation results of the proposed method with other competing intelligence algorithm both qualitatively and quantitatively. Finally, the statistical analysis of the results is presented.
5.1. Qualitative Analysis
The reference medical input images used for qualitative analysis are shown in Figure 5. The segmentation results on these images are presented along with the edge map and ROI mask in row 1, row 2 and row 3, respectively. Similarly, the images segmented by adaptive KM, Fuzzy KM, PSO-KM, GA-KM and proposed method (WOA-KM) are presented in column A, B, C, D and E, respectively.
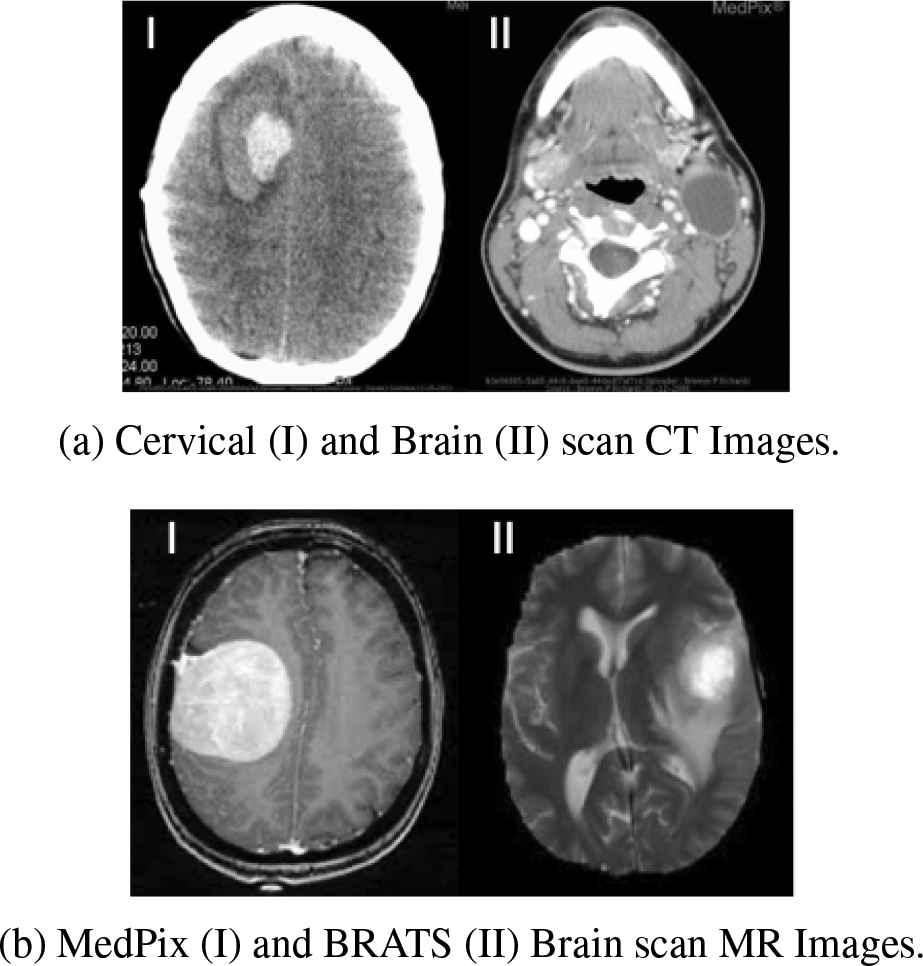
Reference medical images used for qualitative analysis.
5.1.1. Application to CT images
The performance of proposed method was first evaluated on CT brain scan image shown in Figure 5(a-I). This CT shows a hyper attenuating (white) mass lesion with two different densities, and a thin peripheral margin of lucency. Subsequently, it was evaluated on an axial CT image with branchial cleft cyst as shown in Figure 5(a-II). A low-density well-circumscribed lateral neck cystic mass can be seen in this CT at the peri-mandibular region of the left neck lateral to common carotid artery.
The results obtained on these two CT images are shown in Figure 6(a). Observing the results on CT brain scan image in Figure 6(a), it can be seen that adaptive KM, Fuzzy KM and GA-KM fails to delineate lesion that is present with two different densities. This demonstrates the inability of these traditional algorithms to cluster accurately the extracted wavelet features. On other hand, the segmentation offered by PSO-KM delineates the high-density mass lesion but fails to display accurately the low-density region of lesion. Thus, it is evident that the segmentation result of the proposed algorithm emphasizes clearly the two different stages of blood clot retraction and display the lesion delineation vividly. This could guide the radiologist to accurately diagnosis the position and commence the therapeutic procedure.
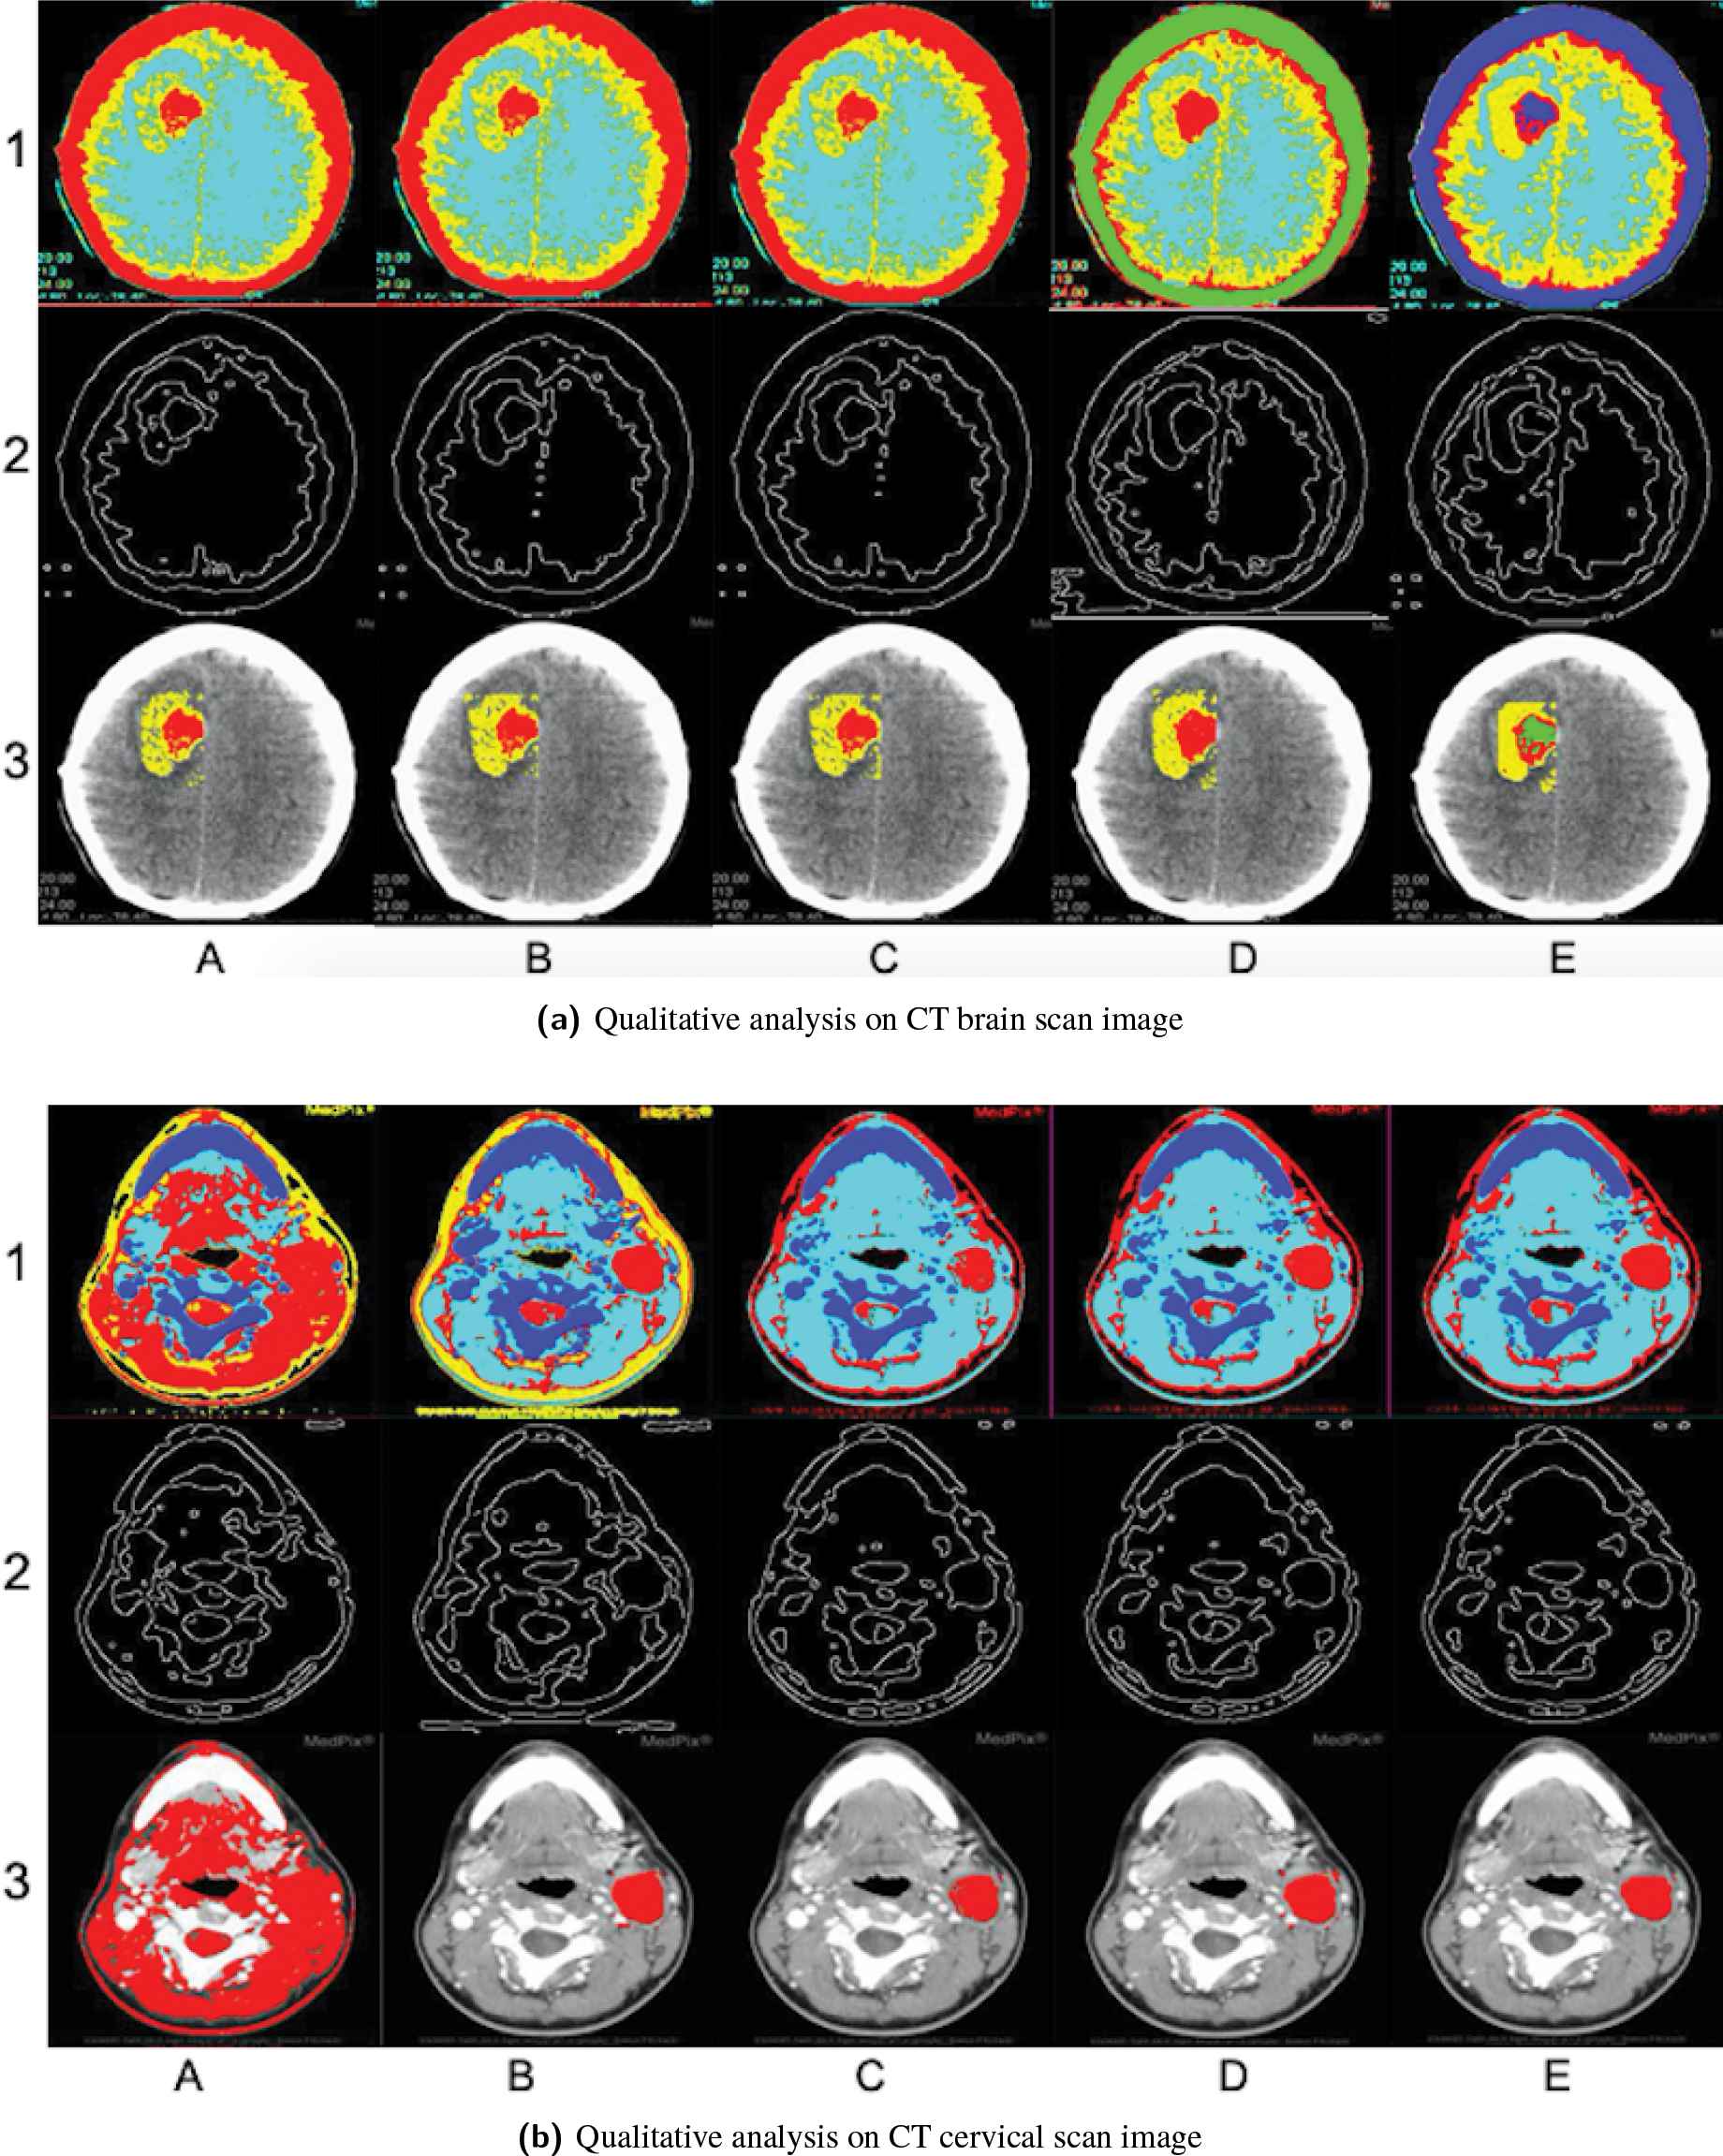
Comparison of segmentation results on CT images.
The visual inspection of CT cervical scan results in Figure 6(b) clearly demonstrate that adaptive KM and GA-KM suffers from under segmentation and requires improvement in clustering the wavelet features correctly for better delineation of the tumor region. On other hand, fuzzy KM and PSO-KM shows better segmentation results in displaying the tumor region but fails to accurately delineate the boundary region of the tumor. The segmentation results delivered by the proposed algorithm in tumor identification and delineating its region accurately is remarkable compared to other competing intelligence algorithms. This might be attributed to the fact that the proposed algorithm employs WAO to control the tradeoff between exploitative and exploratory behaviors during optimization process and obtain the global optimal centers for effective clustering of wavelet features.
5.1.2. Application to MR images
The reference MR brain scan images used to evaluate the performance of the proposed approach are shown in Figure 5(b-I) and (b-II). The results obtained on these two MR images are shown in Figure 7(a) and (b), respectively. According to the results of Figure 7(a), it can be seen that all competing intelligence algorithms and proposed approach delivers satisfactory results. But with careful observation of the results, the inability of fuzzy KM and PSO-KM can be noted with under segmentation of tumor region. This could mislead the radiologist during clinical examination. On other hand, the effective segmentation of the proposed algorithm is remarkable in identifying the tumor region despite of intensity inhomogeneity. This demonstrates the diversified searching ability of WOA for global solution to achieve accurate segmentation results.
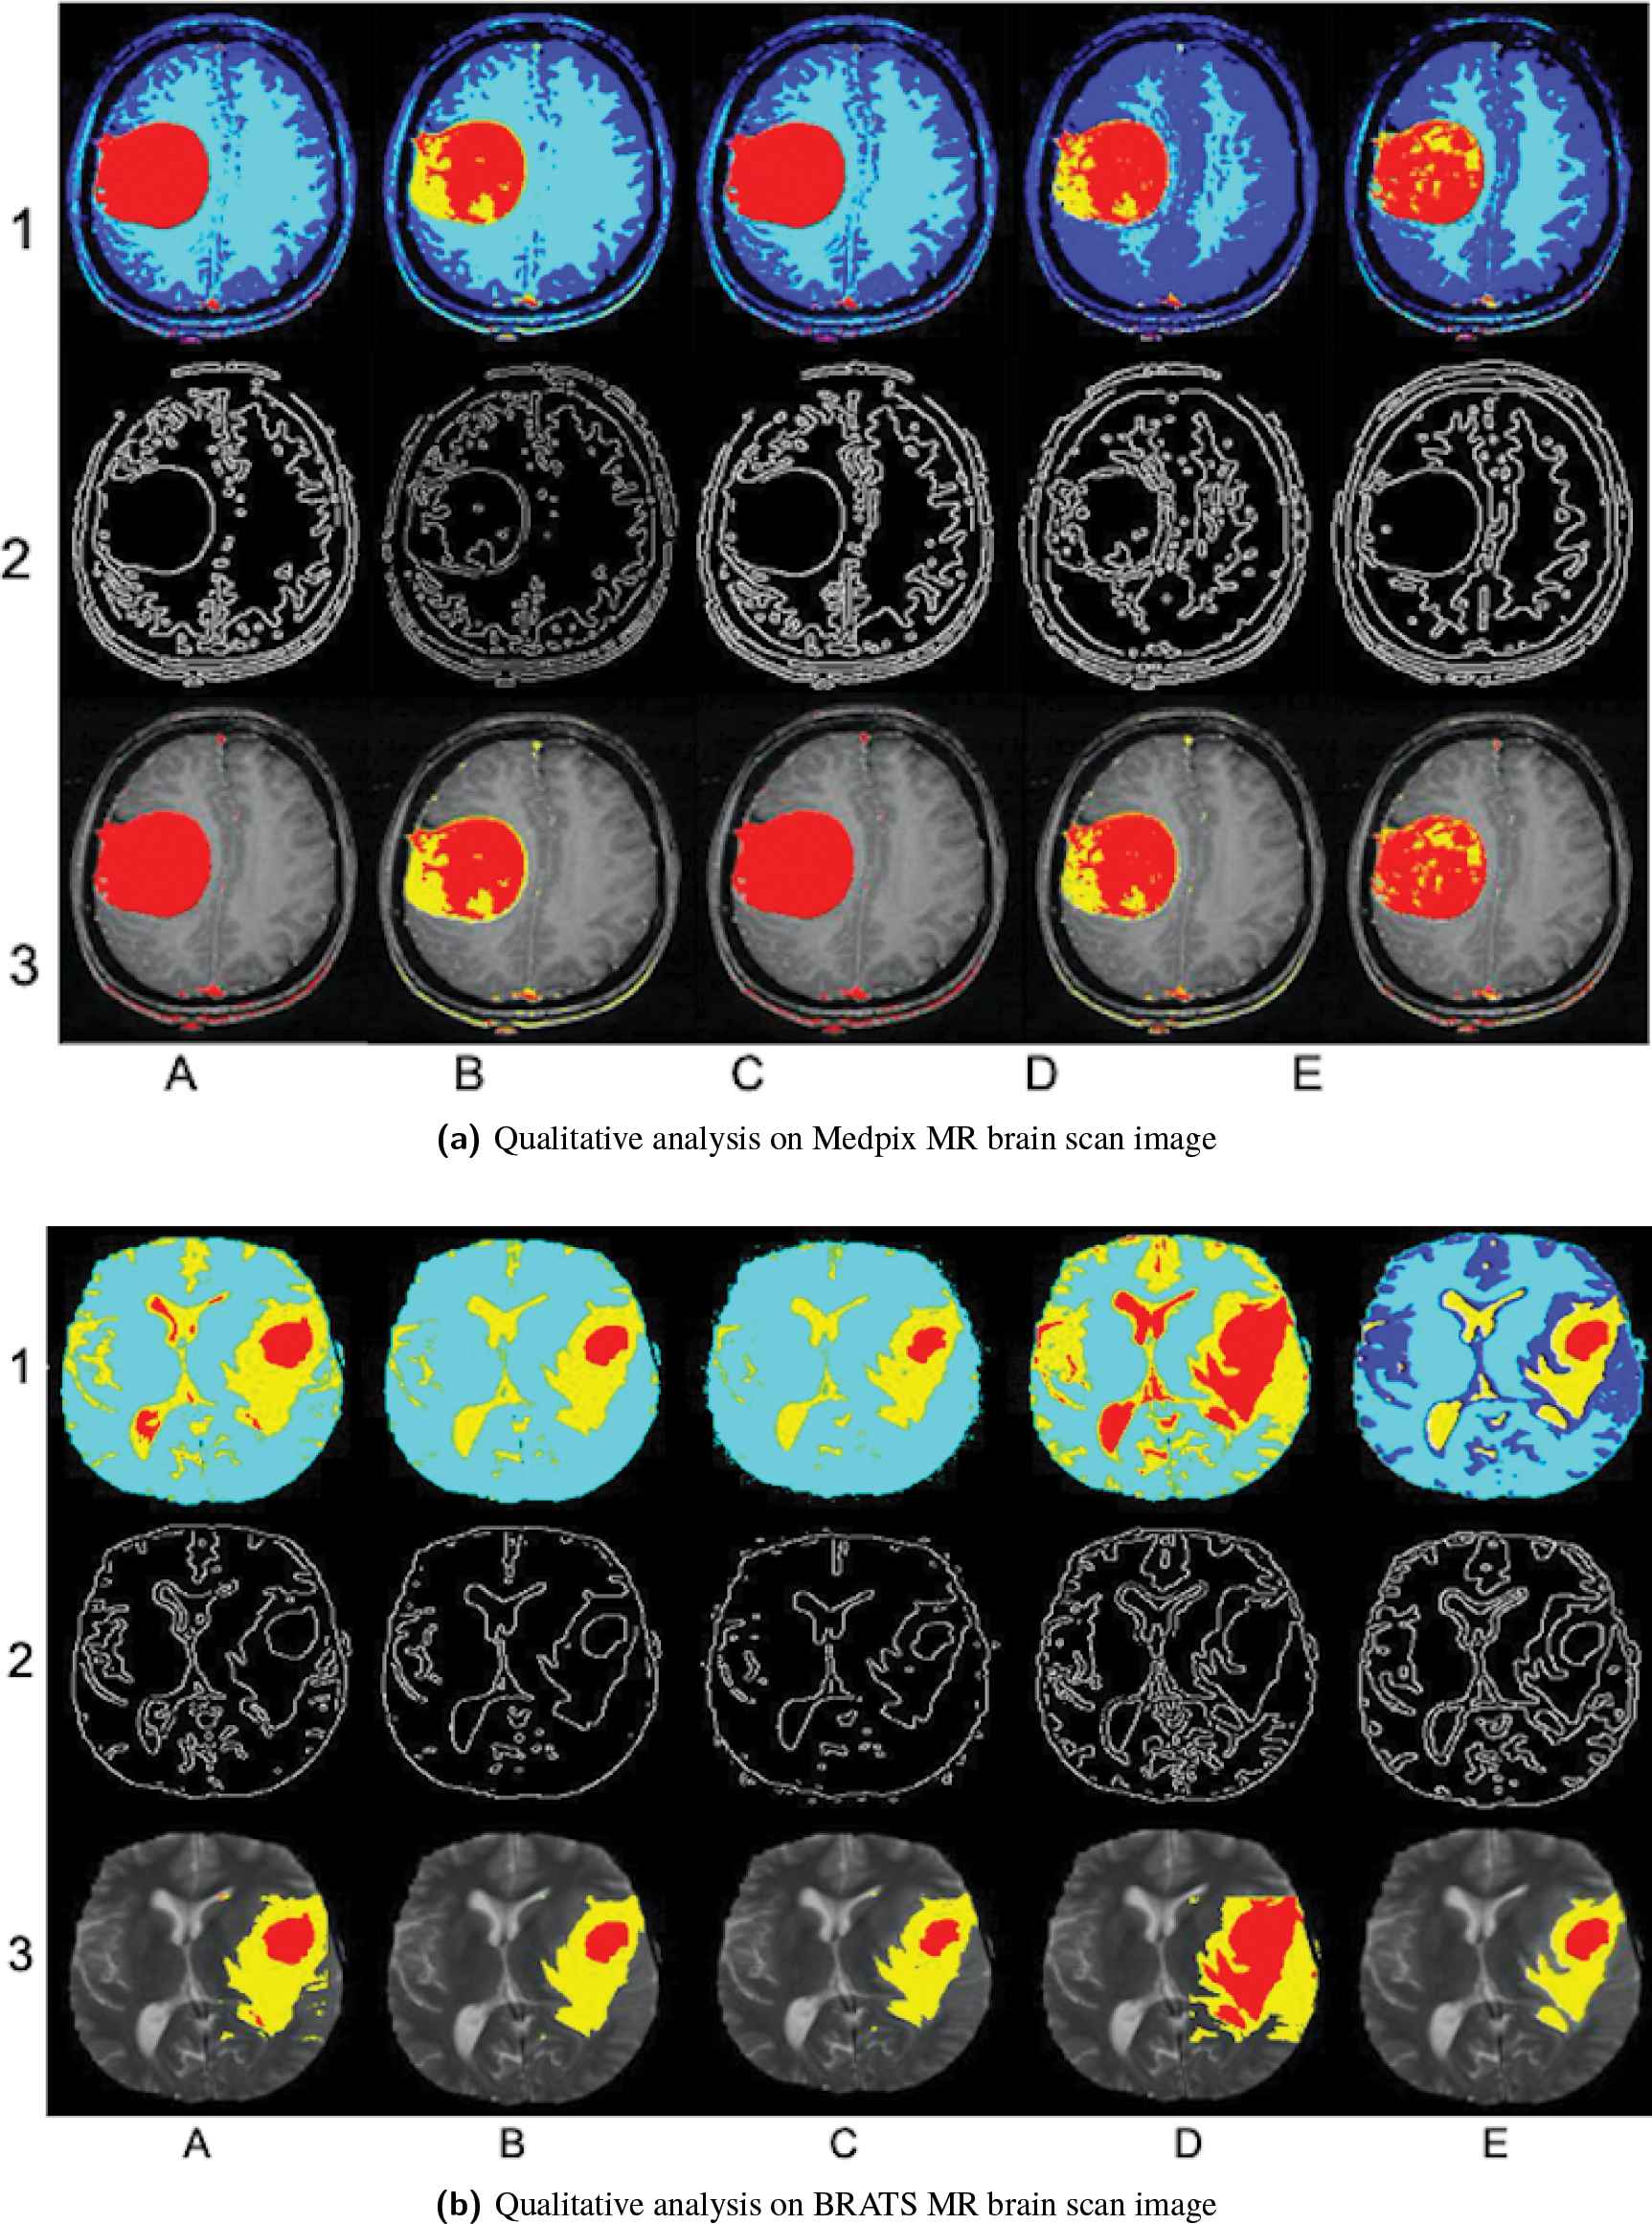
Comparison of segmentation results on MR images.
The visual inspection of results in Figure 7(b) clearly demonstrate that PSO-KM exhibits over segmentation in identifying the tumor region. Also, it can be seen that fuzzy KM and GA-KM identifies the tumor region correctly but fails to isolate the edema region accurately which is notably important for starting therapeutic procedure. Though intensity variations in the tissue regions of tumor and edema are not strong, the proposed algorithm remarkably identifies the tumor region and reduces the cumbersome in isolating the tumor region from edema which could greatly help radiologist during clinical procedure. This owes to the advantage of employing wavelets for strong texture FE and WOA for global optimal solution to improve the segmentation quality especially, in delineating the tumor region accurately.
5.2. Quantitative Analysis
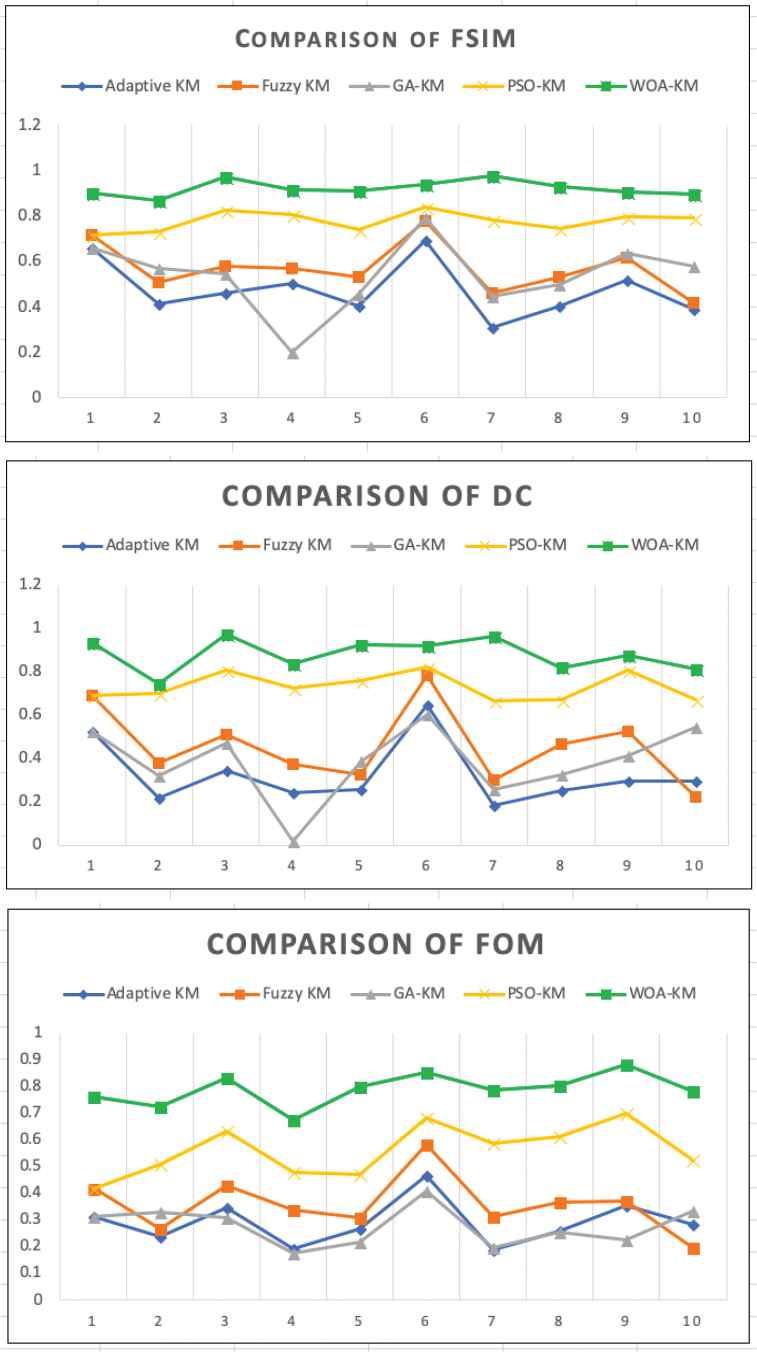
The FSIM, DC and FOM metrics calculated for the segmentation results obtained from five different intelligence algorithms, adaptive KM, Fuzzy KM, PSO-KM, GA-KM, WAO-KM on five CT and MRI images are given in Table 2. The comparative graphs for the FSIM, DC and FOM metrics in Table 2 are shown in Figure 8. It can be understood from these figures that the proposed WOA-KM approach displayed higher segmentation performance compared to other methods. Nevertheless, statistical analysis was conducted to conform the promising performance of the proposed approach.
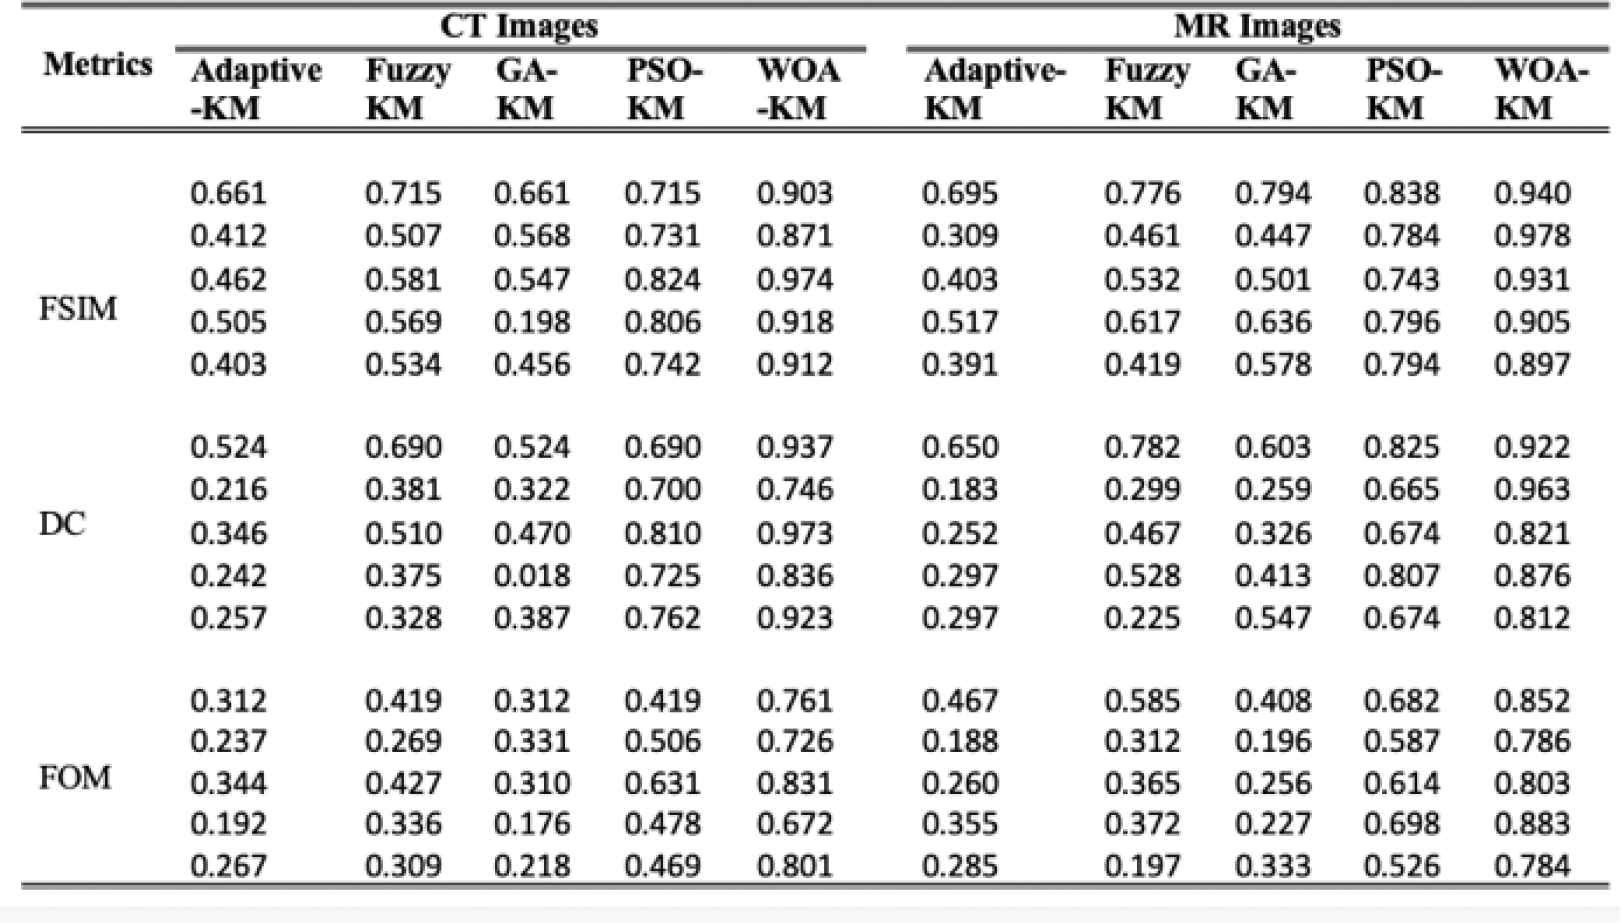 |
GA, genetic algorithm; PSO, particle swarm optimization; WOA, whale optimization algorithm; KM, K-means; DC, dice; FSIM, feature similarity; FOM, feature of merits.
Quantitative comparison of segmentation results on CT and MR images.
Quantitative analysis of segmentation results.
5.3. Statistical Analysis
5.3.1. ANOVA anlysis
The quantitative results given in Table 2 were used to perform various statistical analyses. Toward this, as first step ANOVA analysis was carried out on FSIM, DC and FOM results and the findings are given in Table 3. Observing the statistical results in Table 3, it is clear that the standard deviation and standard deviation error value of FSIM, DC and FOM results are lower for the proposed approach compared to other competing algorithms. Also, the higher values of mean, 95% confidence interval for mean values under proposed approach conforms that its ability in displaying better segmentation results among all other intelligence methods.
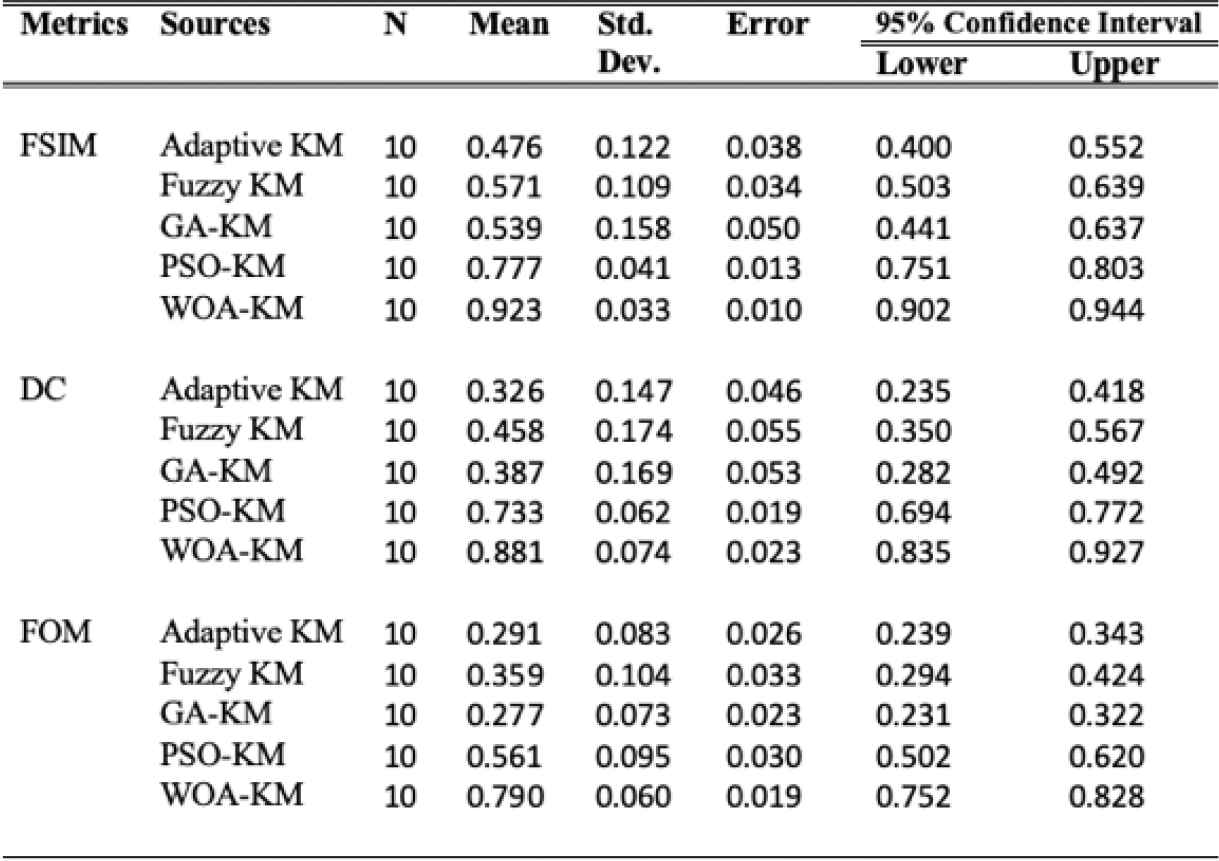 |
GA, genetic algorithm; PSO, particle swarm optimization; WOA, whale optimization algorithm; KM, K-means; DC, dice; FSIM, feature similarity; FOM, feature of merits.
Statistics with ANOVA.
5.3.2. Significance of ANOVA analysis
Here the quantitative results reported in Table 2 were used to perform ANOVA significance analysis to demonstrate the significant differences among the five different intelligence algorithms with respect to FSIM, DC and FOM. The obtained ANOVA significance report is given in Table 4. It can be observed from Table 4 that the significance value of FSIM, DC and FOM is less than 0.05 with F value 31.78, 31.38 and 66.03, respectively.
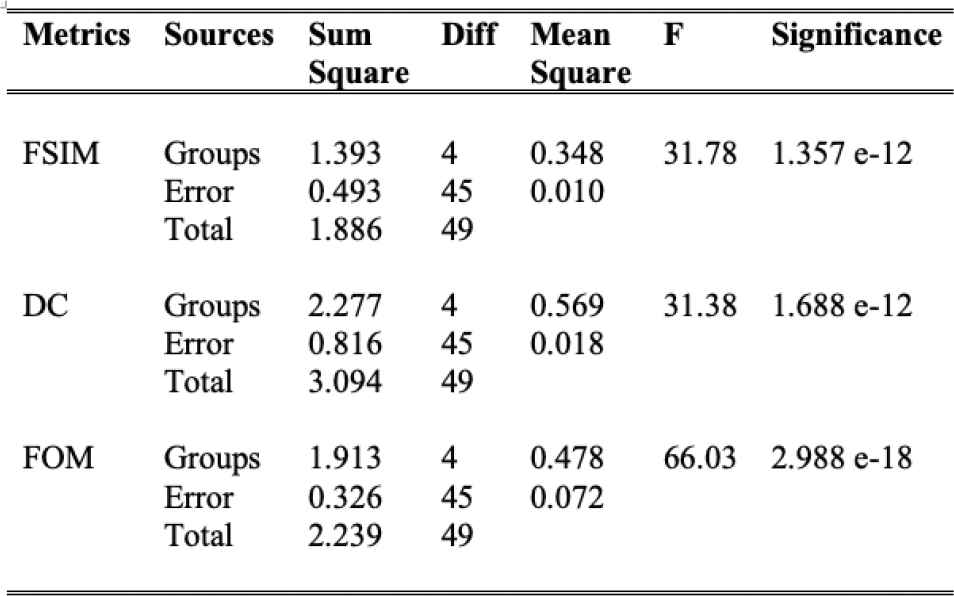 |
ANOVA significance results on quantitative metrics.
These values clearly state that significant difference exists among the five intelligence algorithms with respect to FSIM, DC and FOM. Encouraged by these results, post-hoc multiple comparison was performed to prove that the proposed approach differed significantly from other intelligence algorithm.
5.3.3. Post-hoc ANOVA analysis
Finally, post-hoc pairwise multiple comparison analysis was performed on FSIM, DC and FOM results and the findings are shown in Figure 9(a), (b) and (c), respectively. In this figure, the blue and red bar indicates the mean difference for the proposed approach and other competing algorithms, respectively. From the visual inspection of these figures, it can be seen that in all the three figures the red bars does not overlap the blue bar. This clearly confirms that segmentation results obtained from the proposed approach is statistically different and higher compared to other competing algorithms in term of FSIM, DC and FOM.
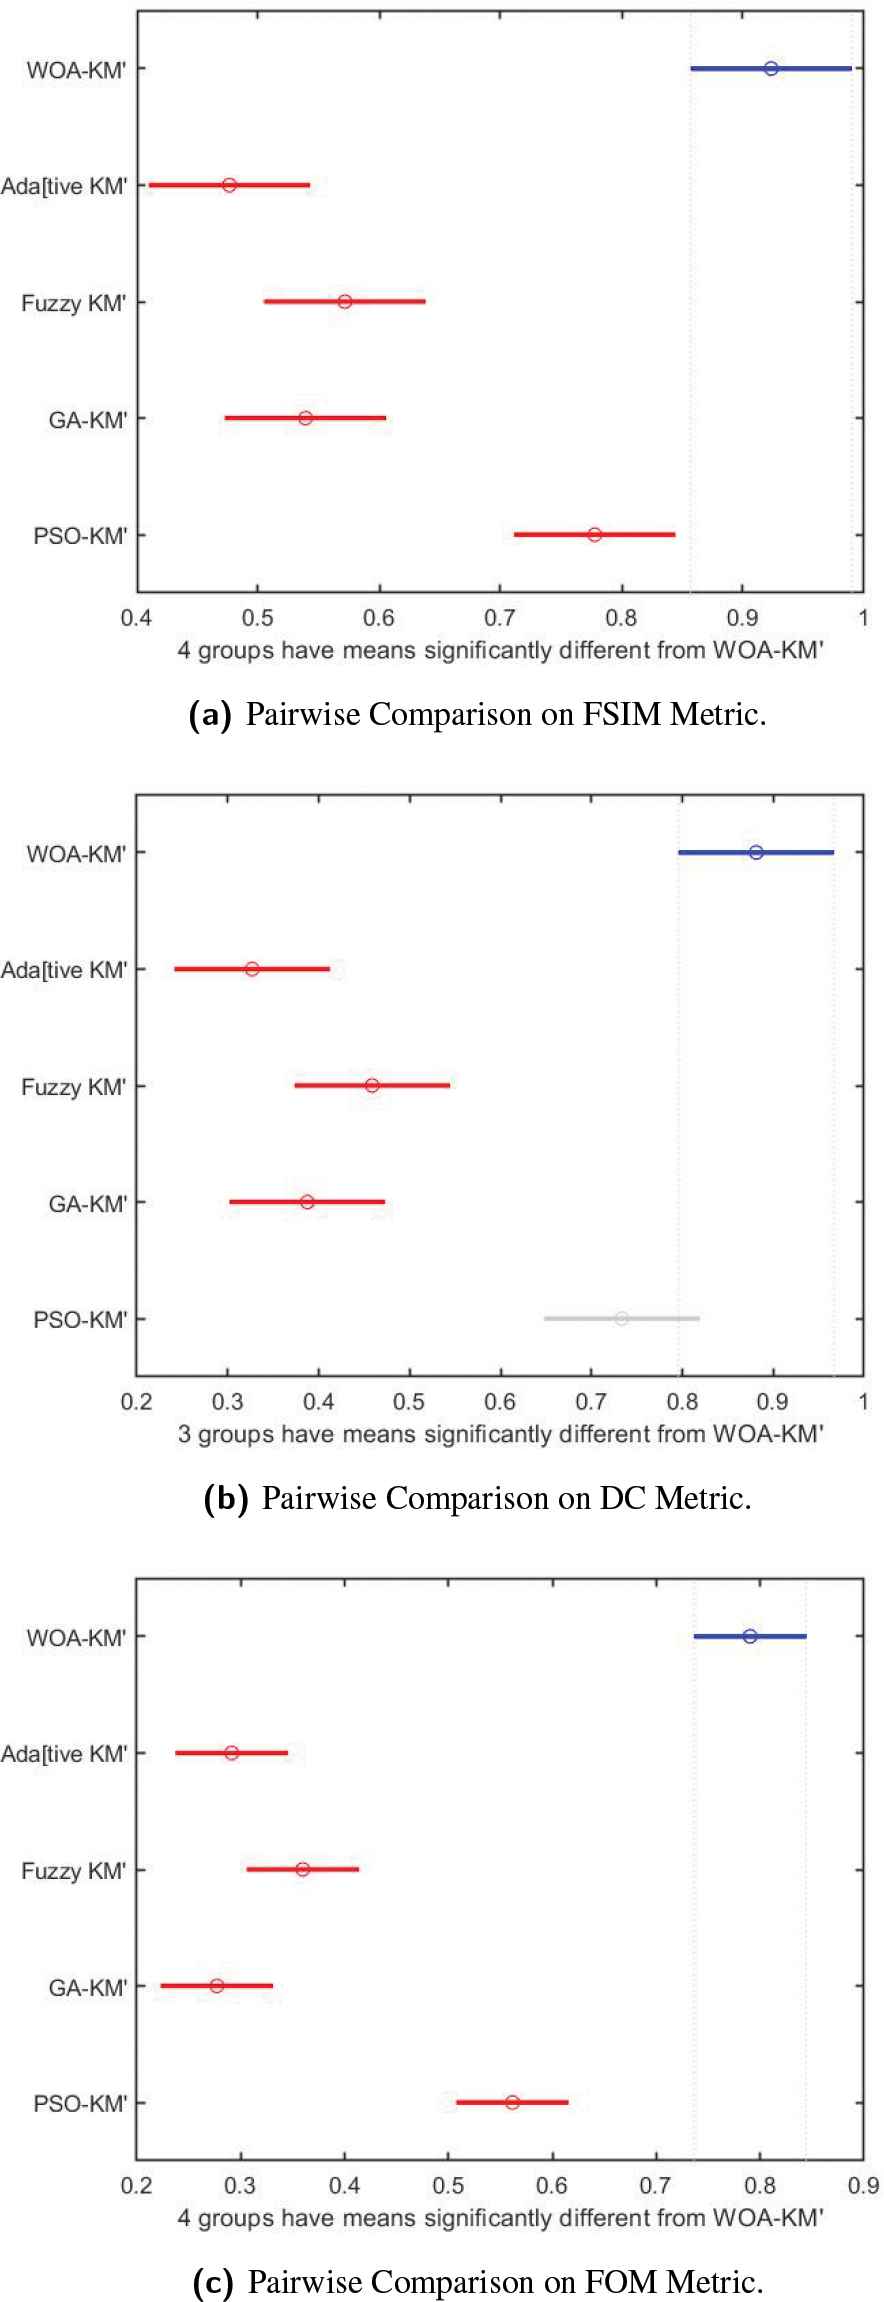
Post-hoc ANOVA analysis of segmentation results.
6. CONCLUSIONS
A new approach for unsupervised medical image segmentation is presented. The proposed approach integrates the merits of wavelet-based multiresolution analysis for texture FE and the global optimizer WOA for cluster center optimization to maximize the efficiency of the KM clustering algorithm for medical image segmentation. Further, a comparison study with four different intelligence algorithms, adaptive KM, fuzzy KM, GA-KM and PSO-KM is presented on CT and MR images with respect to FSIM, DC and FOM. The comparison results revealed the efficacy of the proposed approach over other intelligence algorithms. Finally, the statistical analysis results conformed the promising performance of the proposed approach and can be recommended to achieve clinical significance.
The future research can be taken forward in three directions. First, the proposed work can be further enhanced combining color information with texture features to segment tumor subregions, such as edema, enhancing tumor region and enhanced tumor region for better treatment planning. Also, the inclusion of more texture features from 3D medical images with high third dimension resolution can further broaden the space for enhancement. Second, the proposed approach can be experimented with unsupervised deep learning strategy such as auto-encoders and deep belief networks to extract the essential low-dimensional features to examine whether their impact on performance is positive or negative. Third, the performance of proposed approach can also be investigated hybridizing WOA with other optimization algorithms such as Coyote, Galactic swarm and Butterfly optimizer.
CONFLICTS OF INTEREST
The authors declare no conflict of interest.
AUTHORS' CONTRIBUTIONS
T.V and H.A substantially contributed to conception and design, T.V carried out the experiments, H.A validated the experiment results, T.V drafted the manuscript receiving the inputs from H.A.
ACKNOWLEDGMENTS
The authors are very grateful to thank their Institution, Prince Sattam Bin Abdulaziz University at AlKharj in Saudi Arabia for providing financial support and extend a special thanks to their Deanship of Scientific Research for technical resource support in accomplishing this work successfully. Also, the authors would like to thank the reviewers for their constructive comments and suggestions, which have improved the quality of this paper.
REFERENCES
Cite this article
TY  - JOUR
AU  - Thavavel Vaiyapuri
AU  - Haya Alaskar
PY  - 2020
DA  - 2020/07/01
TI  - Whale Optimization for Wavelet-Based Unsupervised Medical Image Segmentation: Application to CT and MR Images
JO  - International Journal of Computational Intelligence Systems
SP  - 941
EP  - 953
VL  - 13
IS  - 1
SN  - 1875-6883
UR  - https://doi.org/10.2991/ijcis.d.200625.001
DO  - 10.2991/ijcis.d.200625.001
ID  - Vaiyapuri2020
ER  -