
Cancer Cell Detection through Histological Nuclei Images Applying the Hybrid Combination of Artificial Bee Colony and Particle Swarm Optimization Algorithms
- DOI
- 10.2991/ijcis.d.200915.003How to use a DOI?
- Keywords
- Artificial bee colony; Image processing; Nuclei segmentation; PSO
- Abstract
Cancer is a fatal disease that is continuously growing in the developed countries. It is also considered as a main global human health problem. Based on several studies, which have been conducted so far, we found out that Hybrid Particle Swarm Optimization and Artificial Bee Colony Algorithm has never been used in any relevant study; so, in this study we purposed using this algorithm for detecting the centers of the nuclei with the help of histological images to obtain accurate results. If we compare this algorithm with previously proposed algorithms, this algorithm doesn't require a lot of parameters, and besides, it is faster, simpler, and more flexible. This study has been carried out on histological images obtained from a database containing 810 microscopic slides of stained H&E samples from PSB-2015 crowd-sourced nuclei dataset. During the determination process, the noise on images was first eliminated using morphological techniques, and then, we used Hybrid PSO-ABC algorithm to for segmentation of the nucleic images and compared the results with other optimization algorithms to test its accuracy and efficiency. The average 99.38% accuracy rate was assured for cancer nuclei. To demonstrate the robustness of this experiment, the results were compared with other known cancer nuclei detection procedures, which are already mentioned in the literature. Using the new proposed algorithm showed the highest accuracy when it was compared to rest of the methods. The high value outcome confirms that the suggested method outperformed as compared to other algorithms because it shows a higher distinctive ability.
- Copyright
- © 2020 The Authors. Published by Atlantis Press B.V.
- Open Access
- This is an open access article distributed under the CC BY-NC 4.0 license (http://creativecommons.org/licenses/by-nc/4.0/).
1. INTRODUCTION
Since 2017, rare cancer types have been on the rise. Nearly 13% of all the diagnosed cancers belong to the rare type, representing less than 6 cases in every 100,000 people, especially in 20 and above adults every year. This year, 28 rare cancer cases have been discussed in the special section review indicating their mortality trends, survival rates, and diagnosis. It further gives a general review of the selected cancer cases, their risk factors, and symptoms [1]. Cancer is the most established cause of death, which exists all over the world and only lung cancer caused approximately 1.7 million deaths, 0.79 million people died of liver cancer, 0.78 million deaths were reported because of colorectal cancer, stomach cancer took 0.76 million lives, and 0.58 million women died because of breast cancer.
The detection and diagnosis of cancer by oncologists is mainly a computer-based process; however, in the general imaging literature, artificial intelligence is the most popular research method because of high capacity to detect and recognize different cancers [2]. It is unfortunate that the mentioned computer-based method could not adequately detect cancer.
This research presents a new approach to detecting the cancer nuclei using histopathological images using Artificial Bee Colony (ABC) and Particle Swarm Optimization (PSO) algorithms (Hybrid PSO-ABC). Three steps were taken to detect cancer nuclei in histopathological forms. In this process, the red portion of the histological images was first identified. In the smoothing process, 20*20 two-dimensional median filtering and Gaussian kernel-based morphological filtering were conducted. Then, ABC algorithm was incorporated to determine the maximum value of cancer division. And lastly, the approximation threshold value was used to obtain the nucleic division.
Developing an algorithm for nuclei detection with the help of ABC algorithm [3], which is based on PSO [4] algorithm, is the main contribution of this paper. This work includes three nuclei detection steps through histopathological images. The red channel of a colored nuclei image was chosen as a preprocessing step.
A 2D median filter (20*20 size) was used for Gaussian kernel-based morphological filtering. The next step is application of the ABC algorithm to find the optimum threshold value that gives information about nuclei segmentation. For velocity and position of bees, we applied PSO to find the best position for every bee. In the end, we used the estimated optimum threshold value for the nucleic segmentation [5]. This work is robust, which is evident from the fact that the approach was tested on public nuclei dataset images, which were obtained from the PSB-2015 crowd-sourced nuclei dataset [6].
This paper includes a literature review, which is given in Section 2. The fundamentals of ABC and PSO algorithms, the proposed ABC-PSO approaches, and their advantages/disadvantages have been mentioned in Section 3. Section 4 deals with the simulation results and discussion, and finally, the major conclusions and suggestions for future work have been mentioned in Section 5.
2. LITERATURE REVIEW
In the following text, a comprehensive overview of the related studies is given. It should be noted that a few existing nucleus determination techniques can be grouped into these categories: Morphological operations used after thresholding techniques, level sets, region growing algorithm, graph-cuts, and k-means. The most recently used methods for nuclei detection in histology images depend on morphological features. Basically, morphological features include nucleic region stability and symmetry, which help identifying nuclei [2,7]. Furthermore, in the work that has been done in a previous research [8], the researchers proposed the usage of the Hough transform and the Difference of Gaussian (DoG) to determine the cell nuclei in symmetrical shapes. On the other hand, another research [9] came up with a graph-cut methodology that uses image signals of the Laplacian of Gaussian (LoG) filter whereas some researchers [10] used a symmetrical local phase. In the same way, a research paper [11] focused on the nature of the gradient to locate the nuclei center; however, all these techniques can probably produce undesired results on the rod-shaped nuclei and the irregular malignant nuclei. Moreover, another work [12] utilized maximum steady extremal regions for detection. This process could be affected by poorly-stained nuclei or those having distorted chromatin surfaces. A study [13] proposed the active contour-focused procedure for the determination and division of intersecting nuclei shapes, which are actually different as compared to tumor cells.
A classic research [14] used AdaBoost classifier to monitor the pixels and the Haar-like features, and then combined their results to identify the nuclei in the breast tissue samples marked with immunohistochemistry. Though the efficiency of this technique was low when small nuclei and thin fibroblasts were found/determined. Nucleus and cell characterizations are part of several histopathological processes. Moreover, some nucleus properties like size, shape, and texture are used in nuclear pleomorphism evaluation of breast cancer images [15].
Nuclei localization and segmentation based on CNN has been given in many previous researches [16–20]. In a work [21], CNN was used to identify miotic and nonmiotic cells focusing on information gathered from color, shape, and texture. The nuclei have been categorized according to their appearances to find cancerous tissues, which are found in prostate cancer [22]. The location of the detected nuclei was used with the shape features for discriminating malignant nuclei from normal cell in prostate histology images, and for this purpose, an unsupervised manifold learning framework was applied [13]. Recently, a research [23] introduced AdaBoost classifiers for nuclei segmentation and characterized them based on their intensities and morphological features. This process is primarily centered on nuclei segmentation and very little on performance evaluation.
In another work [24], the nuclei are characterized as cancer, lymphocyte, or stomach cancer. Based on morphological features in breast histopathology images using Hematoxylin and Eosin (H&E) were stained that requires accurate nuclei segmentation in the tissues.
Researchers belonging to various fields of optimization have widely used the ABC algorithm since its introduction in 2005 mainly because of its easy application. Swarm Intelligence (SI) algorithms have been used to perform many research-related tasks. “Above-and-beyond” efficiency, stability, and improvement were witnessed in many of them compared to the other local search algorithms [15].
To identify breast cancer using a microarray dataset including peripheral blood (PB) samples is a less known technique, which was proposed in a research paper [25]. Hybrid ABC is used with the help of a Least Square-Support Vector Machine (LS-SVM) or its common name ABC-SVM. The identification of breast cancer is done by detecting the Circulating Tumor Cells (CTCs) in the PB; however, it is still difficult to catch CTCs in metastatic diseases.
Additionally, in a work [26], a method has been presented for binary categorization problems using data mining processes applying the ABC algorithm, which is considerable with 96.5% diagnosis precision rate and its function was enormous. The researchers presented a fuzzy method, which was optimized using Ant’s Colony Optimization (ACO) for detecting breast cancer in women. The algorithm of the ACO was based on how ants look for food in their nearest environment. In this method, the author used fuzzy rules to classify the groups as cancroids and un-cancroids [27].
For the region of interest (ROI), a study [28] applied the ABC algorithm as an optimization algorithm to classify samples into malignant and benign tumors using the neural network. In short, the classification requires a three-layer neural network composed of seven features to identify the samples as benign or malignant. The classification results achieved 96.5% overall accuracy, 96.9% sensitivity, 95% specificity, and 3.5% error. The global guided ABC (GGABC) algorithm was proposed in a research [29], after which, it was accepted as a hybrid population-based meta-heuristic approach that handled the shortcomings of classical ABC and the breast cancer status that could be predicted with the help of an algorithm [21].
Also, in a work [30], asymmetric approach was applied using MIAS database for the extraction of suspicious regions to optimize the meta-heuristic algorithm. This method is centered on the PB tissue determination, which can indirectly detect whether cancer cells are present. A two-step elimination process was utilized by choosing the available breast cancer tissues and PB microarray dataset. The ABC-SVM yielded a 96.28% sensitivity result of clustering and hierarchical clustering achieved 84.98%. Moreover, BAT algorithm was used in the retinal images for optic disc detection. It was proposed in a previous research [31]. To localize and segment the optic disc in human retina images, a new approach was projected in a research paper [32] that used Fuzzy Clustering Algorithm (FCA).
A system for automatic classification of microscopic breast tissue has been introduced by some researchers [33] that differentiates UDH from actionable ADH and DCIS subtypes. It has 87.9% accuracy rate when test data is used. For 26 of the 33 test cases, 84.6% test accuracy was obtained when it is compared to diagnostic results of nine pathologists on the same test set (on average 81.2%).
The SVM usage was described in another work [34], which has been used to divide IHC images to obtain quantitative measurements of the stained membranes to determine the traces of over-expressed HER2 protein. A researcher [35] proposed automatic quantitative image analysis, which is a useful technique.
In this method, for enhancing the quality of image of nucleic segments, the researchers applied the top-bottom hat transformation. The ROIs were obtained, and later, precise location was determined through wavelet decomposition multi-scale region grading (WDMR). The experimental values indicated that the average value of sensitivity was 91.53% while specificity was 91.64%. Furthermore, sensitivity was 99.05%, accuracy was 96.19%, and 93.33% were possible values for benign and malignant cells. In another work [36], an effective and improved method has been presented based on wavelet transformation to classify the texture. In this work, they used the upgraded local binary pattern applying wavelet transformation.
Although, many studies have been conducted in the literature in this area of research, none of them used the ABC algorithm for nuclei image segmentation to detect cancer. By comparing the proposed method with the existing ones, we obtained high accuracy in cancer nuclei detection, and besides, we paid attention to save the processing time.
In this paper, to demonstrate the quality of research work, the suggested method was carried out on histological images and mainly on a database that has 810 microscopic slides of H&E stained samples obtained from a PSB-2015 crowd-sourced nuclei dataset [6].
3. ABC ALGORITHM AND THE PROPOSED METHOD
This newly-developed optimization technique replicates smart foraging action of honeybees. A colony of honeybees can effectively work as a team to complete their particular tasks. These bees can be sub-divided into three groups: employed, onlooker, and scout bees. Employed ones look for food, keep the food location in their memories, and inform the spectator bees about it. Then, the spectator bees choose the high-quality food resources out of all the food resources. The food resource with good fitness value is assured by the onlooker bees, but the less qualified bees cannot do that. The choice for food resource with good fitness value will be better, if onlooker bees select it.
The total swarm of the ABC has been divided into two parts. The bees, which occupy the first half of the swarm and the spectator bees, which occupy the remaining part; therefore, the total solution for the swarm equals the total number of onlooker or employed bees in a swarm. The artificial bee colonies generate the random initial populations to solve the food resource issue and it depends on NS, which represents the number of swarms.
Here,
At the end of search task completion, all the employed bees will communicate their food knowledge with onlooker bees while performing shake dances. The nectar knowledge provided by the employed bees is circulated through a spectator bee, which chooses a food resource based on its nectar quantity. It is also termed as roulette-wheel selection method (RWS), and it is expressed as follows:
Here,
If it is impossible to enhance a position after a few iterations, a food resource is generally discarded. If a discarded resource is denoted by Xi, the scout bee will determine some new food resource
Here,
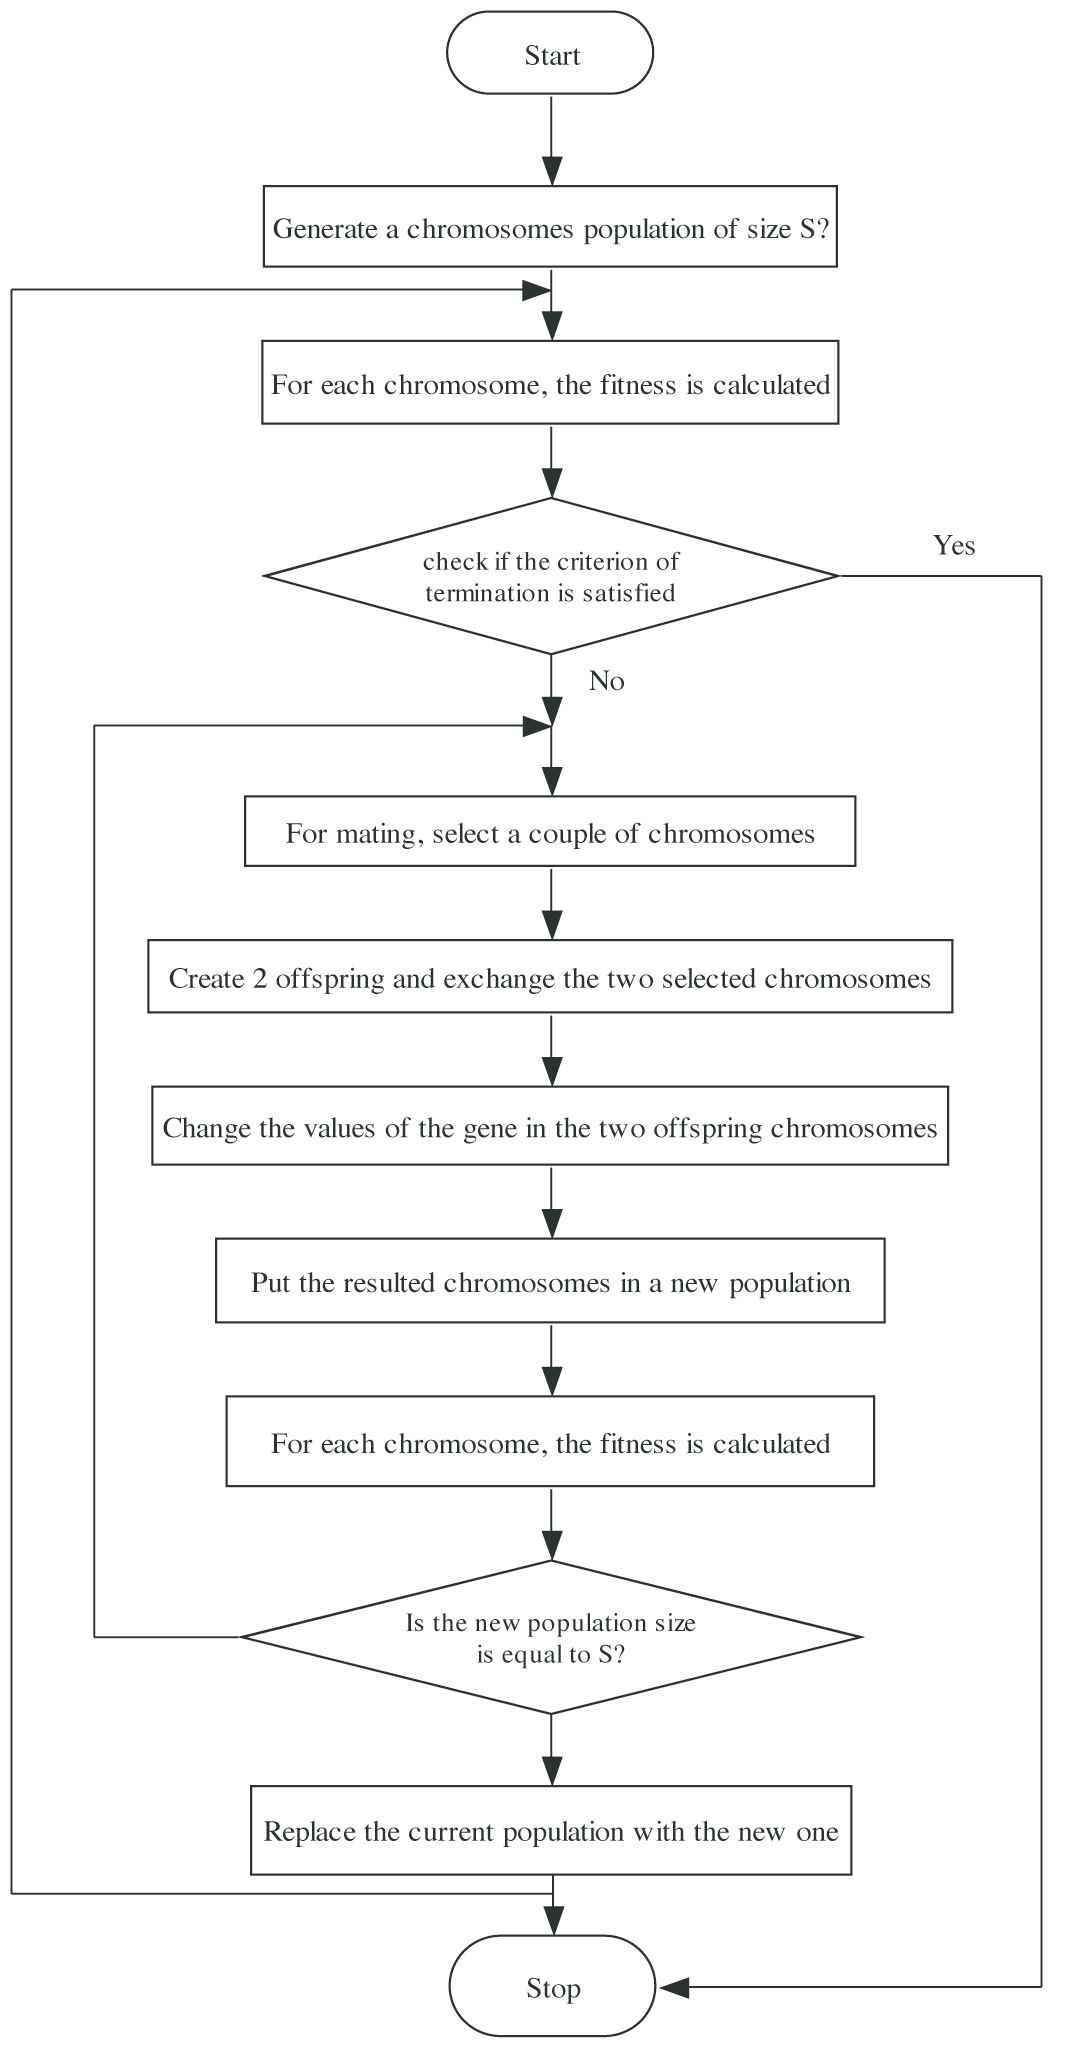
Flowchart of Artificial Bee Colony (ABC) algorithm.
Figure 1 briefly explains the important steps of the ABC algorithm:
Step 1: Randomly initialize the swarm.
Step 2: For initial swarm, we must update the solution.
Step 3: Generate a new candidate solution (Yi) for every employed bee, which should be based on Eq. (1). Use hunger selection procedure for choosing the better one out of Xi and Yi, and consider it as new Xi. Before doing that, we must calculate the fitness of Yi.
Step 4: The evaluation of Ri by every spectator bee is based on Eq. (2).
Step 5: Based on Eq. (1), the present solution regarding food resources should be decided. Calculate Xi fitness and apply the hunger selection procedure for selecting a better one out of Yi and Yi as new Xi.
Step 6: If the discarded Xi exists, the scout bee locates it and updates it using Eq. (3).
Step 7: Update the already-found superlative solution, and iteration = iteration + 1.
Step 8: In case, iterations reach the maximum iteration, finish the procedure, and display the output result; otherwise, perform Step 2.
3.1. Methodology for Cancer Nuclei Detection Using ABC Algorithm
In this section, methodology involved in the ABC-based detection of cancer nuclei has been explained step by step, which is displayed in Figure 2.
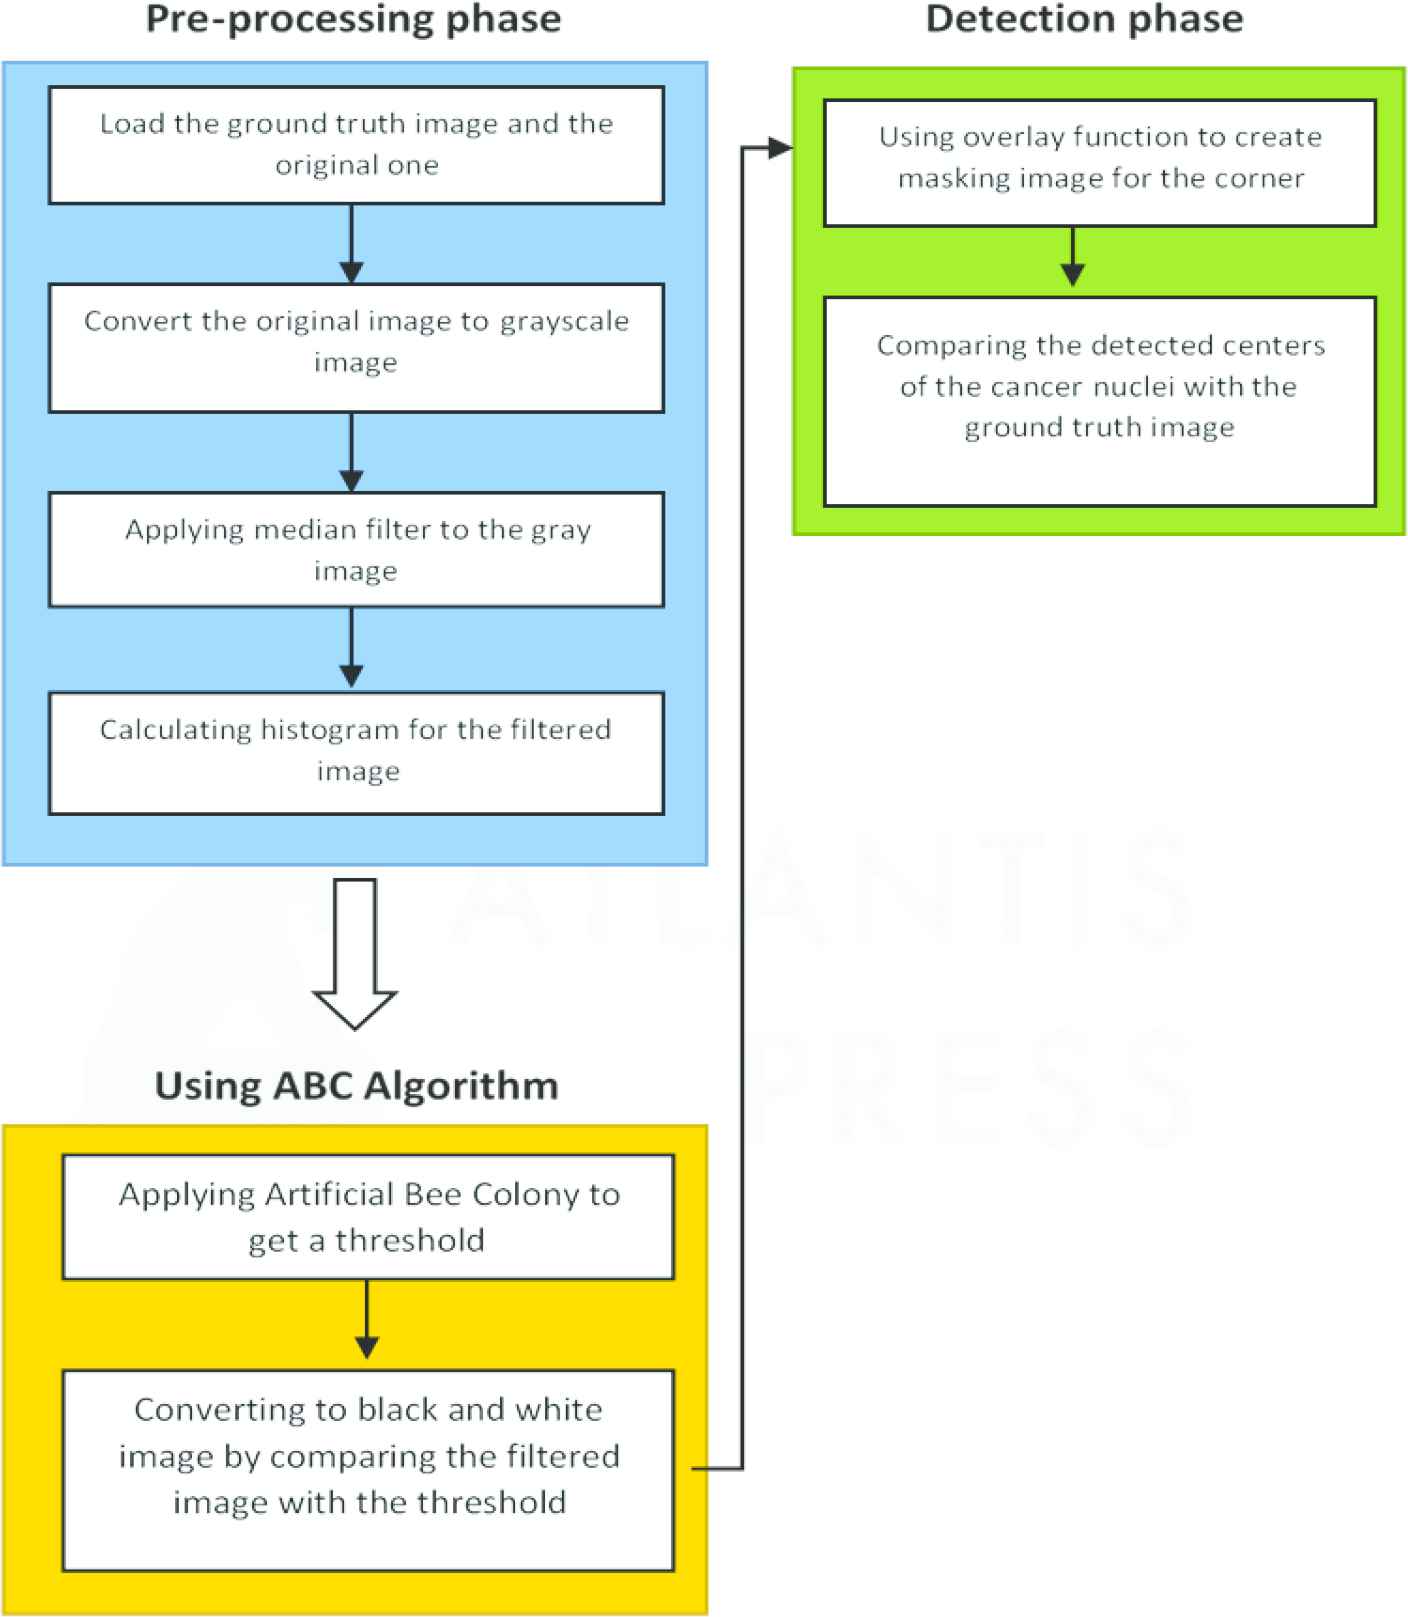
Flowchart displaying the process of Artificial Bee Colony (ABC)-based cancer nuclei detection.
Step 1: The image is either taken from the database or the camera.
Step 2: The database is used to select the true image.
Step 3: For detecting cancer nuclei, the preprocessing the image is done through two processes: RGB-to-gray image conversion and then the obtained gray image is processed through median filtering conversion. 3D-colored image is converted into two-dimensional image using the gray image conversion process, which eliminates hue and saturation but maintains luminance. For eliminating the salt-and-pepper-induced noise, gray scale image is converted and then, the obtained gray image undergoes median filtering. Later, the nonlinear function of the image obtained. After noise reduction and safeguarding the edges, this method becomes more efficient as compared to the convolution operation method.
Step 4: After filtering median, the median image histogram is used to gather useful information like the location of the image and the intensity distribution of the median.
Step 5: ABC algorithm is applied on a median image histogram applying the OTSU method. As a fitness function, weighted sum of the variances of the histogram of the selected image is calculated.
Step 6: The ABC finally provides the threshold value for detecting the cancer nuclei, and the obtained threshold value is then compared to the median filtering value. In case, the threshold value exceeds each point on the image, the point on image turns white; otherwise, it becomes black.
Step 7: After black-and-white image conversion, the overlay function was applied to the image for masking the image corners before it is compared to the true image. Sensitivity, positive predicted value, specificity, accuracy, negative predicted value, and computation time are needed for effective comparison and analysis.
3.2. Proposed Hybrid PSO-ABC for Nuclei Segmentation
There are a number of factors in a PSO algorithm that may influence its effectiveness. For any given optimization issue, some of these factors’ standards and choices have a major impact on the effectiveness of the PSO technique, and other factors have little or no effect [37]. The fundamental PSO factors include the swarm volume, the velocity mechanism, number of particles, and the number of iterations. Moreover, PSO is affected by inertia weight (W) and velocity (V). Scientists have tried to improve its performance by planning various kinds of methods, segmentation, and algorithms for both ABC and PSO to obtain the best solution in terms of particle velocity and location. In PSO, particle velocity is extremely significant because it is the step dimension of the group of bees (swarm). At every step, each and every particle carries on with changing velocity, and each particle moves in all the dimensions of the inspection space [38]. There are two features in this context: exploration and exploitation. Exploitation implies the focus on the study around a searching region for purification of an optimistic solution while exploration is the capability of discovering various regions of the study space for determining a high-quality optimum.
While applying any optimization algorithms, it is essential to calculate the superiority of the candidate solutions. For this reason, the fitness of the clusters should be estimated. Getting objects placed in distinct clusters can be complex [39,40]. PSO analyzes every particle based on a pre-equipped fitness function, frequency position, and maximum velocity. Figure 3 shows the step by step methodology to find the position and velocity of the ABC method.
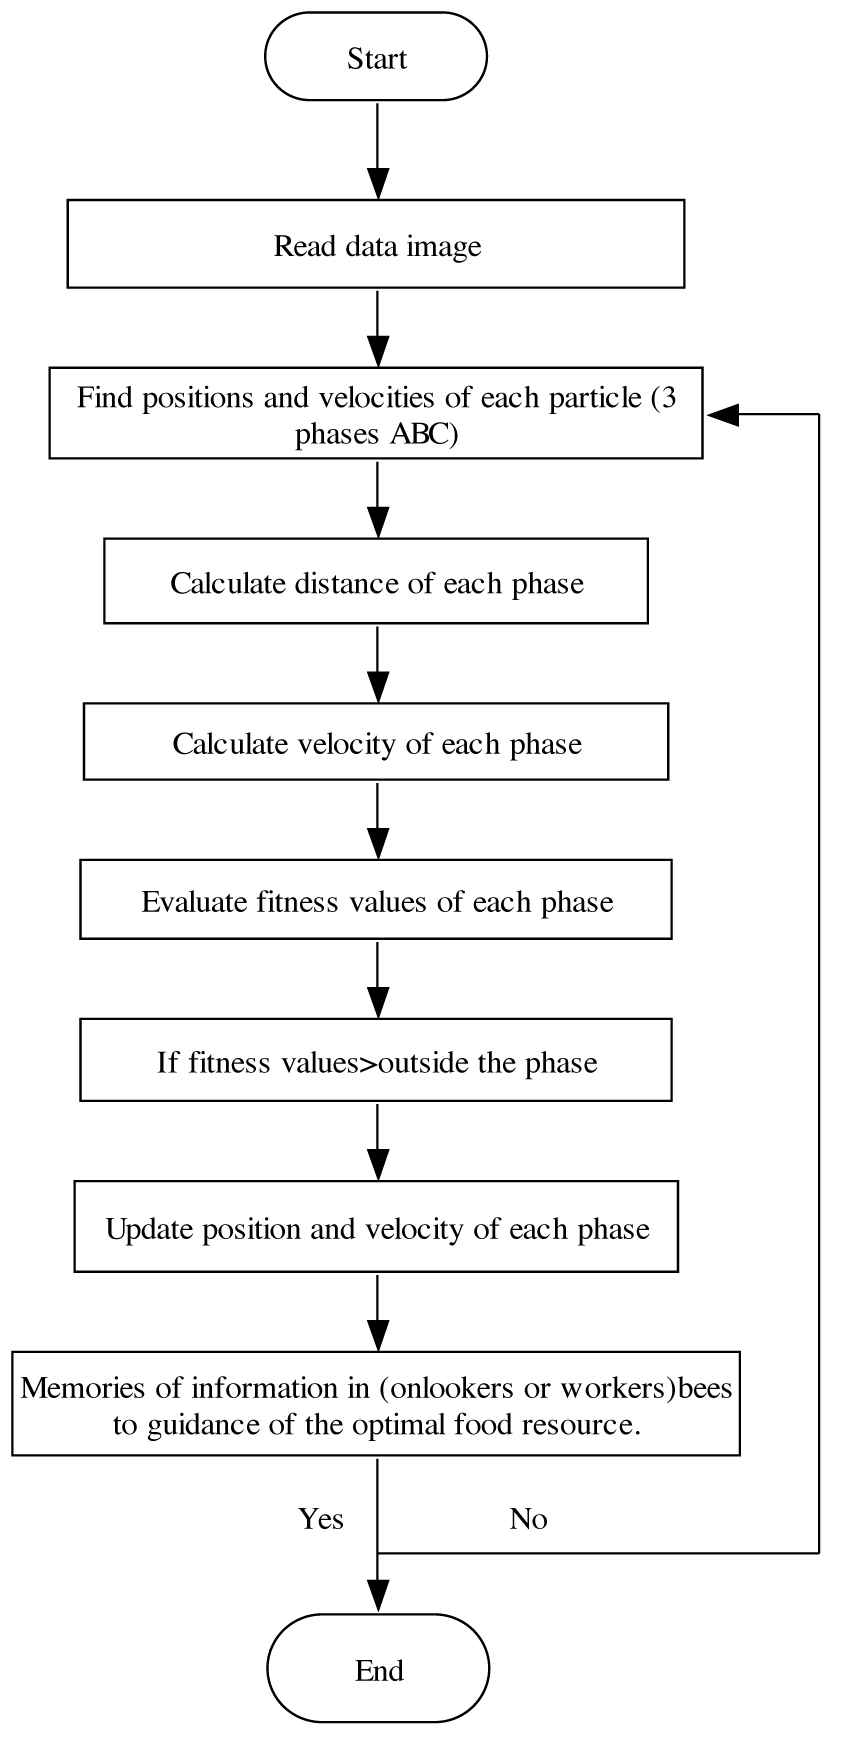
Flowchart of methodology to find the position and velocity of the Artificial Bee Colony (ABC) method.
To improve the quality of the image and reducing the noise of all the images, the median filter was applied at every stage during preprocessing
This reduces time and memory requirements. During the segmentation stage, ABC and PSO are useful. Finally, the original image helps finding the formed skin cancer regions. The Modified Particle Swarm Optimization (MPSO) is applied to the picture segments while PSO recognizes a multi-level threshold. The mentioned method is suitable for gray images [41,42].
3.3. Formulation of Equations for Hybrid PSO-ABC and Results
The fitness value has been selected for suitable values of location and velocity, and its formula is as follows:
Onlooker bees evaluate the information about the nectar to employ every worker bee and choose a food resource that has the best nectar using the following formula:
Here, in ABC algorithm,
Eq. (7) measures fresh and all other food resources, which worker bee find out. It is given below:
If the fitness of a food resource does not enhance after a limit, it is rejected and replaced by an arbitrarily-produced food resource by the scout bees, which act according to the negative feedback mechanism and fluctuation feature of ABC [43,44].
During each iteration, every particle in the group of bees relocates to another location in the search space. In iteration
The position update rule remains unchanged in the equation given below:
Here, w is the inertia weight, ѵi new and ѵi old are new and old velocities of the particle i, Xold i is the particle’s old position, and K1 = K2 values are within the range 0 to 1. Eqs. (6) and (7) show that i is the particle index,
Here,
If a particle’s velocity increases, and becomes maximum, it is denoted as
If maximum velocity is attained, after that, the particles may randomly move and end up with providing the best solution; however, if it is too small, the particle’s movement will be imperfect and the swarm may lead to local optimum solution.
Every super swarm particle appears as a set of PSO factors, which need to be optimized. The function of every super swarm particle, which is based on the number of analysis optimization issues, is measured and it will depend on the number of repetitions of the sub-swarm optimizations. When we use the PSO algorithm, every pixel is categorized in a cluster, which depends on the highest fitness function.
The velocity supports the search directions for every particle, and it is updated in every iteration of the algorithm. ABC and PSO algorithms vary because the number of vectors for every particle is different in both algorithms. In ABC, there is one solution vector for every individual. In PSO, there are 3 vectors for every particle: velocity, position, and previous best location. While calculating visual annotations, we analyzed the performance of our method.
4. RESULTS AND DISCUSSION
Results are obtained using a personal computer with the following specification: Intel core i7 processor, 2.90 GHz speed with MATLAB version 2019a. Total 810 histological images were processed, and relevant data were obtained. For effective analysis, we noted the following parameters: negative predictive value sensitivity, positive predictive value, precision, specificity, F1 score, recall, and computation time for image processing. Equations used for calculating of the mentioned parameters are given below:
For this research, 810 histological images were tested and detection was carried out using the proposed method and the details are presented. The proposed method demonstrated superior sensitivity as compared to the other considered methods, as Figure 4 and Table 1 indicate.
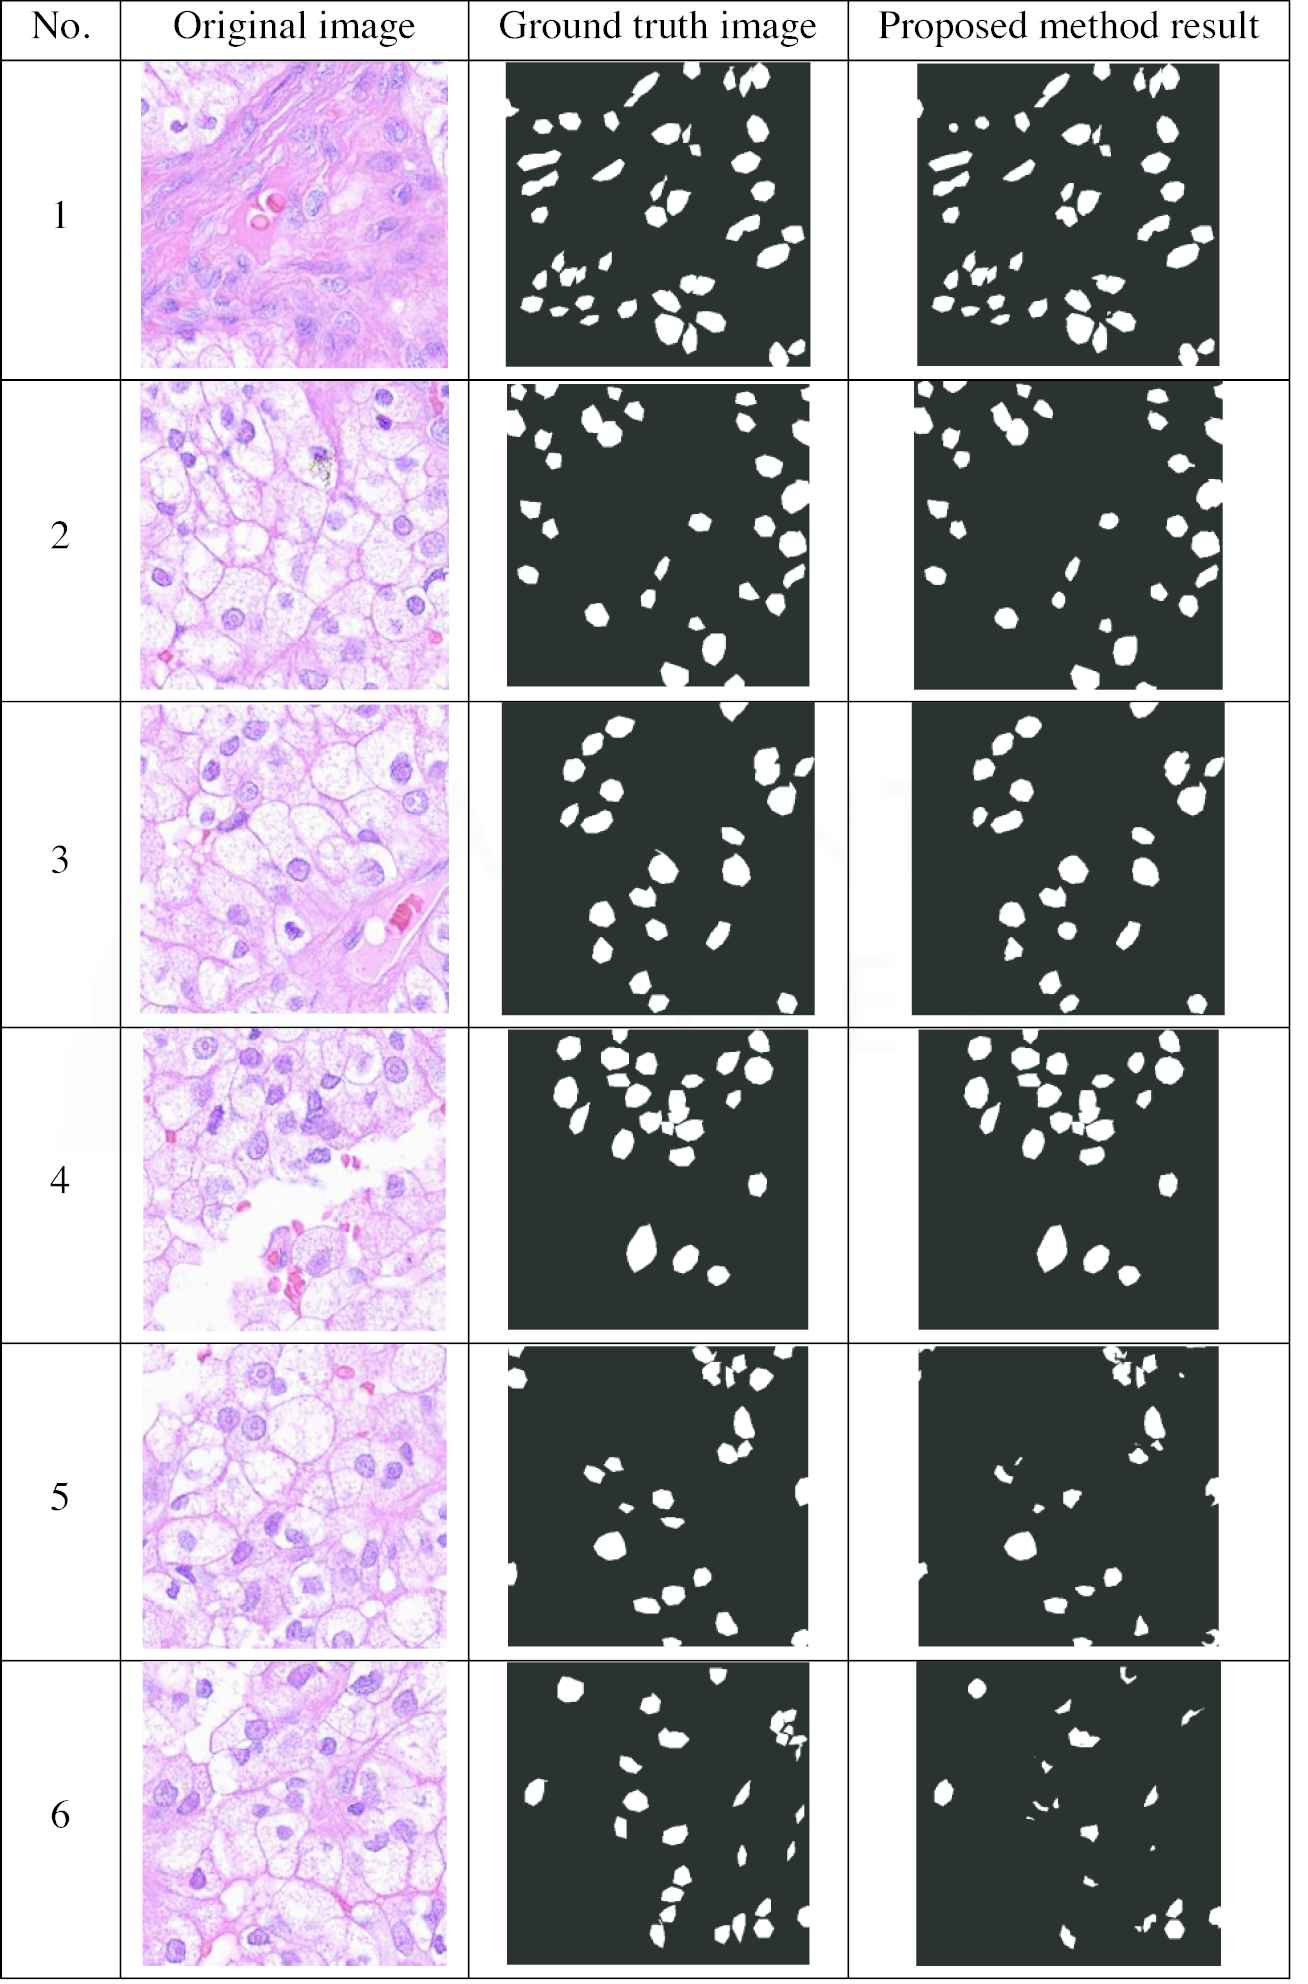
Results of some sample nuclei images.
| Method | Precision | Recall | F1 Score | Median Distance (Q1, Q3) |
|---|---|---|---|---|
| Center-of-the-Pixel Convolutional Neural Network (CP-CNN) [25] | 0.697 | 0.687 | 0.692 | 3.606 (2.236, 7.616) |
| Stacked Sparse Autoencoder (SSAE) [26] | 0.617 | 0.644 | 0.630 | 4.123 (2.236, 10) |
| CRImage [24] | 0.657 | 0.461 | 0.542 | 3.071 (1.377, 9.022) |
| LIPSyM [10] | 0.725 | 0.517 | 0.604 | 2.236 (1.414, 7.211) |
| Super-Resolution Convolutional Neural Network (SR-CNN) [47] | 0.783 | 0.804 | 0.793 | 2.236 (1.414, 5) |
| Proposed Hybrid Method | 0.795 | 0.823 | 0.81 | 2.14 (1.38, 4.75) |
Results of performance parameters of 810 histological images taken from PSB-2015 crowd-sourced nuclei dataset.
Graphic comparison between the proposed method and other methods is shown in Figure 5.
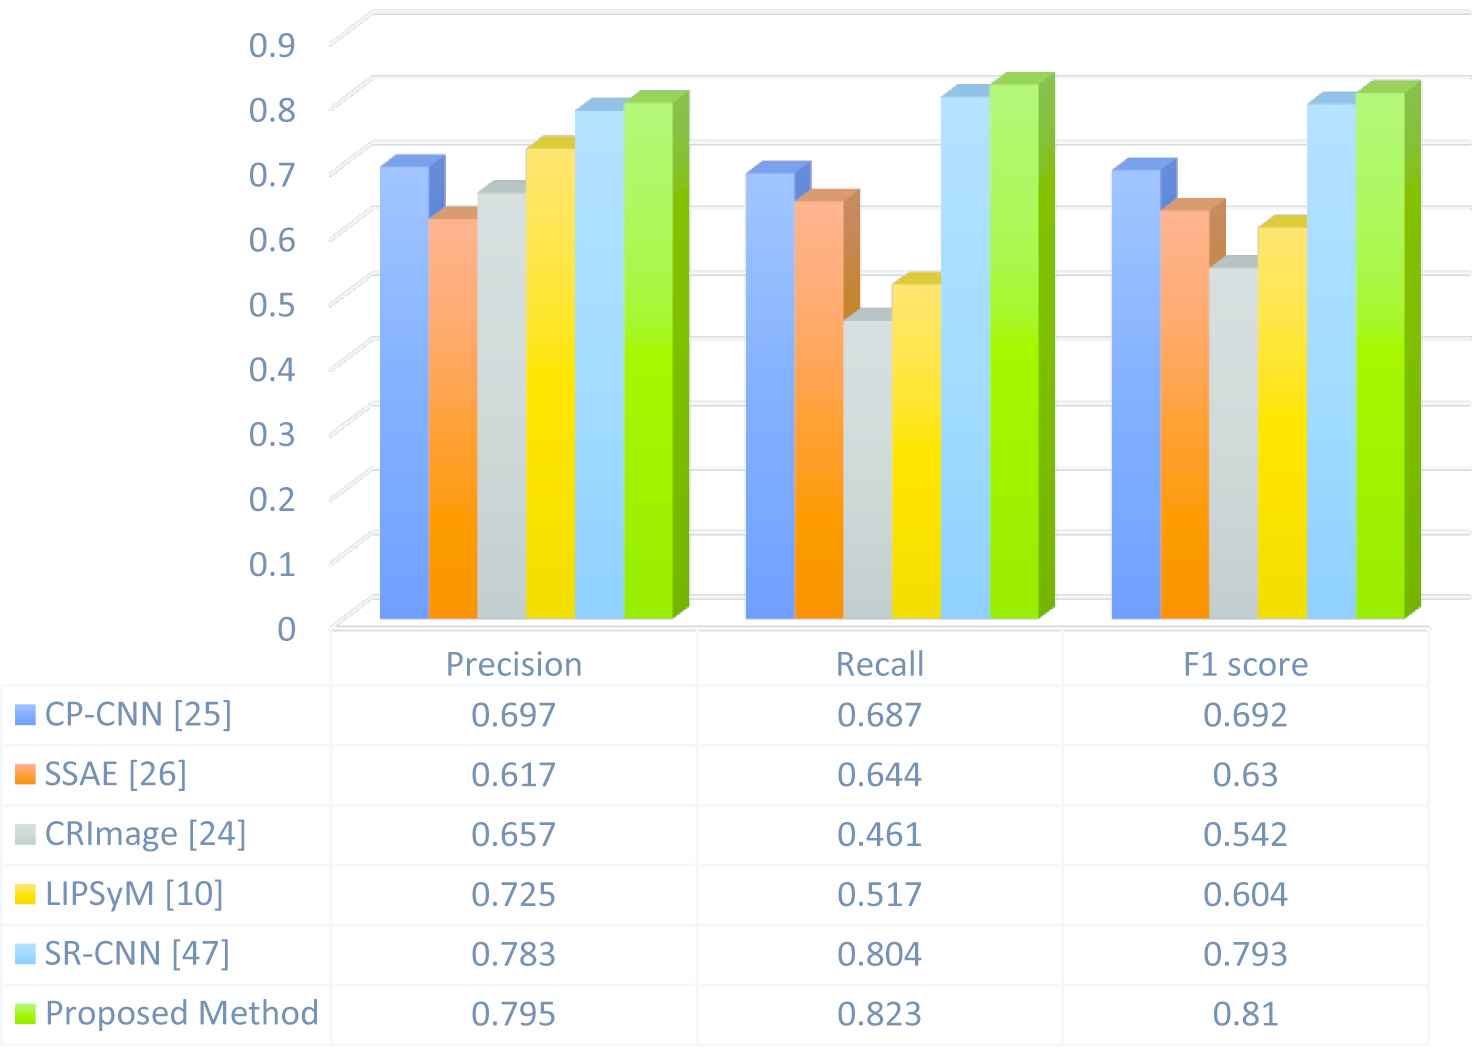
Comparison between the proposed method and the other methods.
The results for the similar database are shown in Table 2. For all the four parameters, the proposed method (ABC based on PSO) demonstrated the greatest segmentation performance.
| Segmentation Method % | Parameters |
||
|---|---|---|---|
| Accuracy | Sensitivity | Specificity | |
| Statistical Region Merging (SRM) [48] | 72.50 | 77.51 | 93.32 |
| PSO [49] | 91.78 | 78.26 | 99.12 |
| J measure based SEGmentation (JSEG) [50] | 93.70 | 69.77 | 97.83 |
| Artificial Skin Lesion Merging (ASLM) [51] | 94.77 | 87.17 | 97.60 |
| Proposed Hybrid Method | 96.88 | 88.42 | 99.40 |
Results of the segmentation performance of the database images of nuclei lesions’ similarity factors.
The modifications in velocity and position particles of the ABC based on the PSO method reduce the number of swarm factors for limiting their user interfaces with automatic and semi-automatic procedures. The position and velocity equations of the PSO algorithm were processed and used to optimize new positions, and besides, they reduced the nuclei image segmentation for medical imaging and achieved the maximum fitness values for the proposed methodology.
This paper applies a hybrid mix of ABC and PSO algorithms depending on particle swarm search for global optimization, which improved both efficiency and accuracy. Some other strategies were also used. The results of the ABC and PSO algorithms assured high accuracy and specificity of nuclei image segmentation. The locations were optimized assuring good performance for several function estimations.
For overcoming the problem of restricting the resolution, classification and segmentation were carried out based on biologically-inspired algorithms and methods; so we believe that the researchers will able to use them in future studies.
In Table 3, the consumption of time for all the processing steps is shown:
| Working Steps | Image Processing | Segmentation |
|---|---|---|
| Total time consuming (sec) | 17.144 ± 4.0316 | (19.87 ± 15.18) × 10−3 |
Total time consumption of the proposed method for all images.
Image processing steps took long time due to the graphic features of the nuclei images.
5. CONCLUSION
This paper proposed cancer nuclei detection method based on ABC algorithm. The computation time to detect the centers of cancer nuclei was 0.4867 seconds. The proposed method has been experimentally verified with 810 images, which were taken from a publically available crowd-sourced dataset. Then, we compared the effectiveness of the proposed method to the already existing cancer nuclei detection techniques. The proposed methods were verified using a personal computer equipped with Intel Core processor i7, 2.90 GHz processor speed, and MATLAB version 2019a. For effective comparisons, sensitivity, specificity, and accuracy were chosen as parameters for evaluation of the proposed methods. The combination of proposed methods (ABC and PSO) has achieved higher accuracy and specificity as compared to other considered algorithms. The proposed methods showed 0.94% sensitivity, 99.98% specificity, and 99.39% accuracy on a set of 810 histological images available in PSB-2015 crowd-sourced nuclei dataset. Finally, the proposed method presented more suitable evidences for detecting nuclei in the histological images.
In future work, we are planning to apply other nature-inspired algorithms with different medical imaging lesions of nuclei image segmentation for use in many applications. We hope to decrease the time with no effect on accuracy. The aim of the hybrid algorithm for the velocity and position equations is boosting the performance and to get extra benefits from the algorithms like PSO and ABC.
CONFLICTS OF INTEREST
The authors declare no conflict of interest.
AUTHORS' CONTRIBUTIONS
Faozia Ali Alsarori conceived of the presented idea. Hilal Kaya carried out the methodology. Javad Rahebi performed the numerical simulations. Daniela E. Popescu and D. Jude Hemanth analyzed the validation performance.
FUNDING
The authors declare that no funding was received for this work.
ACKNOWLEDGMENT
The authors sincerely thank the Harvard University for making the dataset “PSB Crowdsourced Nuclei Annotation” available for research. It has been used in this paper.
REFERENCES
Cite this article
TY  - JOUR
AU  - Faozia Ali Alsarori
AU  - Hilal Kaya
AU  - Javad Rahebi
AU  - Daniela E. Popescu
AU  - D. Jude Hemanth
PY  - 2020
DA  - 2020/09/22
TI  - Cancer Cell Detection through Histological Nuclei Images Applying the Hybrid Combination of Artificial Bee Colony and Particle Swarm Optimization Algorithms
JO  - International Journal of Computational Intelligence Systems
SP  - 1507
EP  - 1516
VL  - 13
IS  - 1
SN  - 1875-6883
UR  - https://doi.org/10.2991/ijcis.d.200915.003
DO  - 10.2991/ijcis.d.200915.003
ID  - Alsarori2020
ER  -