
Clustering-Based Monarch Butterfly Optimization for Constrained Optimization
 , Han Cui2, Xiaohui Wei2, Zhaoquan Cai3, 4, *
- DOI
- 10.2991/ijcis.d.200821.001How to use a DOI?
- Keywords
- Global optimization problem; Monarch butterfly optimization; Clustering; Greedy strategy; Constrained optimization
- Abstract
Monarch butterfly optimization (MBO) algorithm is a newly-developed metaheuristic approach that has shown striking performance on several benchmark problems. In order to enhance the performance of MBO, many scholars proposed various strategies for benchmark evaluation and practical applications. As an application of artificial intelligence (AI), machine learning (ML) developed fast and succeeded in dealing with so many complicated problems. However, up to now, ML did not use to improve the performance of MBO algorithm. In this paper, one of ML techniques, clustering, is introduced into the basic MBO algorithm, so an improved clustering-based MBO namely CBMBO is proposed. In CBMBO algorithm, the whole population is divided into two subpopulations according to k-means clustering. Also, only the individuals having better fitness can be passed to the next generation instead of accepting all the updated individuals used in the basic MBO algorithm. In order to improve the diversity of the population, few individuals having worse fitness are accepted as new individuals. In order to verify the performance of our proposed CBMBO algorithm, CBMBO is compared with six basic and four improved metaheuristic algorithms on twenty-eight CEC 2017 constrained problems with dimension of 30, 50, and 100, respectively. The experimental results suggest a significant addition to the portfolio of computational intelligence techniques.
- Copyright
- © 2020 The Authors. Published by Atlantis Press B.V.
- Open Access
- This is an open access article distributed under the CC BY-NC 4.0 license (http://creativecommons.org/licenses/by-nc/4.0/).
1. INTRODUCTION
In real-life application, optimization is intended for selecting a vector from a special domain to generate an optimal solution. Especially, constrained optimization is much closer to real life, so more and more attention has been paid on its study from theoretical analyses and engineering applications. Recently, though many optimization strategies have been designed, they can loosely be divided into two categories: determined and random methods. Determined methods have strict steps, and each run will generate the same results if the conditions are set in the same way. When dealing with complicated problems, the traditional determined methods will take long time. On the contrary, random methods are based on certain random distribution, so they are probabilistic computational methods. Also, for different runs, different results will be generated even if the same conditions are provided. One of the most presentative random methods is metaheuristic algorithms [1]. Because many complicated problems are difficult to be solved by the determined methods, many researchers turn to metaheuristic algorithms. Accordingly, many excellent metaheuristic algorithms have been designed [2], such as ant colony optimization (ACO) [3–6], genetic algorithms (GAs) [7–9], biogeography-based optimization (BBO) [10], differential evolution (DE) [11–14], krill herd (KH) [15–17], artificial bee colony (ABC) [18,19], teaching-learning-based optimization (TLBO) [20], firefly algorithm (FA) [21–23], social group optimization (SGO) [24,25], earthworm optimization algorithm (EWA) [26], elephant herding optimization (EHO) [27,28], moth search (MS) algorithm [29,30], socio evolution and learning optimization (SELO) [31], charged system search (CSS) [32], particle swarm optimization (PSO) [33–35], and cuckoo search (CS) [36–38]. The significance of the metaheuristic methods is usually accepted by the practical engineering community. Due to their great merits, a large number of difficult problems have been well addressed by metaheuristic algorithms, such as image [39–41], scheduling [42–46], feature selection [47–49] and detection [50,51], object extraction [52], path planning [53], cyber-physical social system [54], training neural networks [55,56], texture discrimination [57], factor evaluation [58], reliability optimization problem [59], classification [60,61], saliency detection [62], economic load dispatch [63,64], shape design [65], unit commitment [66], signal processing [67], code detection [68], many-objective optimization [69–71], fault diagnosis [72–74], vehicle routing [75], multi-objective optimization [76,77], constrained optimization [78,79], knapsack problem [80,81], and fault diagnosis [72].
After carefully studying the migration behavior of monarch butterflies in North America, Wang et al. proposed a new metaheuristic algorithm for global optimization [82]. In monarch butterfly optimization (MBO), two operators (migration and butterfly adjusting operator) are repeated until the stop conditions are met. In MBO algorithm, the newly generated individuals are passed to the next generation no matter that their fitness is better or not. This will lead to slow convergence at the later search phase. Therefore, many researchers have improved monarch butterfly optimization (IMBO) algorithms from various respects.
Learning [83] is the process of acquiring new or modifying existing knowledge, behaviors, skills, values, or preferences. While learning is a natural and ongoing behavior in humans and animals, a significant body of research has been recently dedicated to make it a fundamental component of our next generation intelligent machines, that is, machine learning (ML) [84]. ML involves many critical branches, and some of them, like opposition-based learning (OBL) [85,86], Q-learning [87,88], and knowledge learning [89], have been incorporated into the metaheuristic algorithms with the aim of enhancing their performance.
However, as one of important branches of ML, clustering has not been used to better the performance of metaheuristic algorithms, not to mention MBO algorithm. In this paper, clustering, is firstly introduced into the basic MBO algorithm, so an improved clustering-based MBO namely CBMBO is proposed. In MBO, the whole population is divided into two subpopulations according to their fitness. While in CBMBO, all the individuals are put into two groups through clustering. Clustering will minimize the distance between different individuals in one group, while clustering will maximize the distance between different individuals in different groups. The individuals in two groups are considered as subpopulation 1 and 2, respectively, and they are then updated according to the migration and butterfly adjusting operators.
In MBO, all the individuals generated by migration are passed to the next generation. In order to accelerate the convergence speed, a greedy strategy is utilized [90]. That is, only the monarch butterflies with better fitness are passed to the next generation. In order to improve the diversity of the population, an updated migration operator is proposed. In the updated migration operator, few individuals having worse fitness are accepted as new individuals. In order to verify the performance of our proposed CBMBO algorithm, CBMBO is compared with six basic and four improved metaheuristic algorithms on twenty-eight CEC 2017 constrained problems with dimension of 30, 50, and 100, respectively. The experimental results indicated that our proposed CBMBO algorithm has better performance than the comparative algorithms (six basic and four improved metaheuristic algorithms).
The rest of this paper is organized as follows: Section 2 gives a brief description of MBO. Herein, the mainframe of the proposed CBMBO is provided in Section 3. Subsequently, CBMBO is studied by twenty-eight CEC 2017 constrained benchmark problems in Section 4. Finally, our works are summarized in Section 5.
2. RELATED WORK
Though MBO [82] has been proposed, many scholars have worked on MBO algorithm. In this section, some of the most representative work regarding MBO are summarized and reviewed.
Feng et al. [91] proposed a novel multi-strategy monarch butterfly optimization (MMBO) algorithm for the discounted 0–1 knapsack problem (DKP). In MMBO, two effective strategies, neighborhood mutation with crowding and Gaussian perturbation, are introduced into MMBO. Experimental analyses show that the first strategy can enhance the global search ability, while the second strategy can strengthen local search ability and prevent premature convergence during the evolution process. Accordingly, MBO is combined with each strategy, denoted as NCMBO and GMMBO, respectively. The experimental results on three types of large-scale DKP instances show that NCMBO, GMMBO, and MMBO are all suitable for solving DKP.
Yi et al. [92] proposed a new quantum-inspired MBO algorithm, called QMBO, by incorporating quantum computation into the basic MBO algorithm. In QMBO, certain number of the worst butterflies are updated by quantum operators. The Uninhabited Combat Air Vehicles (UCAV) path planning navigation problem is modeled into an optimization problem, and then its optimal path can be obtained by the proposed QMBO algorithm. In addition, B-Spline curves are utilized to further smoothen the obtained path and make it more feasible for UCAV. The UCAV path obtained by QMBO is compared with the basic MBO, and the experimental results show that QMBO can find much shorter path than MBO.
Ghetas et al. [93] proposed an innovation method called MBHS to tackle the optimization problem. In MBHS, the harmony search (HS) adds mutation operators to the process of adjusting operator to enhance the exploitation, exploration ability, and speed up the convergence rate of MBO. For the purpose to validate the performance of MBHS, 14 benchmark functions are used, and the performance is compared with well-known search algorithms.
Based on the intrinsic mechanism of the search process of MBO and the character of differential mutation operator, Feng et al. [94] proposed a novel DEMBO based on DE mutation strategy and MBO, in which migration operator is replaced by differential mutation operator to enhance its global optimization ability. The over-all performance of DEMBO is verified and analyzed by 30 typical discounted knapsack problem instances. The approximation ratio of all the KP instances obtained by DEMBO is close to 1.0.
Feng et al. [95] proposed a novel chaotic MBO (CMBO) algorithm, in which chaos theory is introduced in order to enhance its global optimization ability. In CMBO, 12 one-dimensional classical chaotic maps are used to tune two main migration processes of monarch butterflies. Meanwhile, applying Gaussian mutation operator to some worst individuals can effectively prevent premature convergence of the optimization process.
Kelotra and Pandey [96] proposed a stock market prediction system that effectively predicted the state of the stock market. The deep convolutional long short-term memory (Deep-ConvLSTM) model acted as the prediction module, which was trained by using the proposed Rider-based monarch butterfly optimization (Rider-MBO) algorithm. The proposed Rider-MBO algorithm was the integration of rider optimization algorithm (ROA) and MBO. The evaluation was based on the evaluation metrics by using six forms of live stock market data. The proposed stock market prediction model acquired a minimal MSE and RMSE of 7.2487 and 2.6923 that shows the effectiveness of the proposed method in stock market prediction.
Ghanem and Jantan [97] combined ABC with elements from the MBO algorithm. The combined method introduces a new hybrid approach by modifying the butterfly adjusting operator in MBO algorithm and uses that as a mutation operator to replace employee phase of the ABC algorithm. The new algorithm is called Hybrid ABC/MBO (HAM). The proposed algorithm was evaluated using 13 benchmark functions and compared with the nine metaheuristic methods.
Yang et al. [98] presented a new version of MBO with simulated annealing (SA) strategy called SAMBO. The SA strategy was put in the migration operator and butterfly adjusting operator. So the newly-proposed algorithm had two features. One was that the algorithm accepted all the butterfly individuals whose fitness were better than their parents. The other was that the algorithm randomly selected some individuals which were worse than their parents to disturbance the convergence of algorithm. Finally, the experiments were carried on 14 continuous nonlinear functions, and results showed that SAMBO exceeded MBO on most functions.
Feng et al. [99] presented a generalized OBL MBO with Gaussian perturbation namely OMBO, in which OBL strategy is used on half individuals of the population in the late stage of evolution and Gaussian perturbation acts on part of the individuals with poor fitness in each evolution. OBL guarantees the higher convergence speed of OMBO and Gaussian perturbation avoids to be stuck at a local optimum. In order to test and verify the effectiveness of OMBO, three groups of 15 large-scale 0–1 KP instances from 800 to 2000 dimensions are used. The experimental results indicate that OMBO can find high-quality solutions.
Ghanem and Jantan [100] proposed a new approach for intrusion detection that was mainly implemented using the Hybrid ABC algorithm (ABC) and MBO. This approach was implemented for preparing an artificial neural system (ANN) in order to increase the precision degree of classification for malicious and nonmalicious traffic in systems. In the beginning, the system was prepared in such a way that it selected the suitable biases and weights utilizing a hybrid ABC and MBO. Subsequently, the artificial neural network was retrained by using the information gained from the ideal weights and biases which are obtained from the hybrid algorithm (HAM) to get the intrusion detection approach able to identify new attacks.
Chen et al. [101] proposed a new version of MBO algorithm by introducing a greedy strategy to solve the dynamic vehicle routing problems (DVRPs). Both migration operation and the butterfly adjusting operator only accept the offspring of butterfly individuals that have better fitness than their parents. To improve performance, a later perturbation procedure is implemented, to maintain a balance between global diversification and local intensification. The computational results indicate that the proposed technique outperforms the existing approaches in the literature for average performance by at least 9.38%.
Dhillon et al. [102] extended MBO algorithm to address frequency control problem arising due to sudden source and load fluctuation in a three-area test power system. The considered test system consists of both distributed and centralized power generations using wind, hydro, gas, and steam. The controllers optimized using the proposed approach were simulated on MATLAB and Simulink platform.
Meng et al. [103] an IMBO in order to overcome the shortcomings of the MBO. The IMBO uses the strategy of dynamic and random dividing the population into two subpopulations at every time-step, and the butterflies in different subpopulations usually use different searching methods in order to keep the diversity of population search. Experiments are done on a set of 10 benchmark functions, and the results show that the proposed algorithm can improve the convergence efficiency in function optimization, and is more stable when being compared with MBO and PSO algorithms.
Faris et al. [104] modified the position updating of MBO to involve previous solutions in addition to the best solution obtained thus far. To prove the efficiency of the IMBO, a set of 23 well-known test functions is employed. The statistical results show that IMBO benefits from high local optima avoidance and fast convergence speed which helps this algorithm to outperform basic MBO and another recent variant of this algorithm called greedy strategy and self-adaptive crossover operator MBO (GCMBO). The results of the proposed algorithm are compared with nine other approaches in the literature for verification. Furthermore, it is also employed to train neural networks as well. The IMBO-based trainer is tested on 15 popular classification datasets obtained from UCI ML repository. The results are compared to a variety of techniques in the literature including the original MBO and GCMBO.
Ehteram et al. [105] used MBO algorithm to address the utilization of a multi-reservoir system in order to improve production of hydroelectric energy. Three periods of dry (1963–1964), wet (1951–1952), and normal (1985–1986) conditions were considered in the operation of a 4-reservoir system. Results showed that MBO can generate more energy when comparing with PSO and GA.
Hu et al. [106] introduced a self-adaptive strategy to dynamically adjust the butterflies in land 1 and 2. Accordingly, an IMBO algorithm, called Monarch Butterfly Optimization with Self-adaptive Population (SPMBO), is put forward. In SPMBO, only the generated individuals better than before can be accepted as the new individuals for the next generations in migration operator. Finally, the proposed SPMBO algorithm is further benchmarked by thirteen standard test functions with dimension of 30 and 60, respectively. The experimental results indicate that the search ability of the proposed SPMBO approach outperforms significantly the basic MBO algorithm on most test functions.
3. MBO ALGORITHM
In MBO, two important operators (migration operator and butterfly adjusting operator) are repeated until the stop condition is met. So, next the detailed description of two important operators will be provided.
3.1. Migration Operator
In MBO, the number of monarch butterflies in Land 1 (Subpopulation 1) and Land 2 (Subpopulation 2) is ceil(p*NP) (NP1) and NP-NP1 (NP2), respectively. Here, ceil(x) rounds x to the nearest integer greater than or equal to x; NP is the total number of the population; p is the ratio of monarch butterflies in Land 1. This migration process can be expressed as follows:
3.2. Butterfly Adjusting Operator
For all the elements in monarch butterfly j, if a randomly-generated number rand is smaller than or equal to p, it can be updated as
Under this condition, if rand > BAR, it can be further updated as follows:
In Eq. (6), α is the weighting factor that is given as Eq. (8).
4. CBMBO ALGORITHM
After carefully studying the migration behavior of monarch butterflies in North America, Wang et al. [82] proposed a new metaheuristic algorithm for global optimization.
In MBO, the whole population is divided into two subpopulations according to the fixed ratio, and then for the individuals in two subpopulations, two operators (migration and butterfly adjusting operator) are implemented in order to update the position of each butterfly. In MBO algorithm, the newly-generated individuals are passed to the next generation no matter that their fitness is better or not. This will lead to slow convergence at the later search phase. Therefore, many researchers have IMBO algorithms from various respects.
Aiming to the disadvantage of the basic MBO algorithm, a kind of ML technology, clustering, is introduced to improve the performance of MBO. Accordingly, a new improved version of MBO, that is, clustering-based MBO, is proposed. The detailed description of CBMBO can be provided below. For our current work, let us assume that all the tasks are minimal problems.
Generate the initial population
The initial population is randomly generated in the search range. This process is the same with the basic MBO algorithm.
Evaluate the population
All the butterfly individuals in the butterfly population are evaluated according to the given objective function, and then the fitness of all the butterfly individuals is obtained.
Divide the whole population into two subpopulations
In MBO, the number of monarch butterflies in Land 1 and Land 2 is respectively determined as ceil(p*NP) (NP1) and NP-NP1 (NP2) according to the fixed ratio p as mentioned before. This unchanged calculation scheme fails to take into the dynamic change of the population account. Therefore, a flexible and dynamic determination scheme is designed according to the current population.
The k-means clustering is a partitioning method, which can partition data into k mutually exclusive clusters. Here, k-means clustering is used to divide the whole population into two subpopulations. Therefore, in this paper, the number of clusters k is set to 2. After implementing k-means clustering, the whole population has been divided into two clusters (each cluster corresponds to one subpopulation). Each cluster (subpopulation) in a k-means partition consists of butterfly individuals and a centroid (or center). In each cluster (subpopulation), the sum of the distances between the centroid and all butterfly individuals of the cluster is minimized. There are many different distance metrics for k-means clustering. In contrast to the fixed number of monarch butterflies in Land 1 and Land 2, the number of monarch butterflies determined by k-means clustering is dynamically changed as the algorithm continues. This dynamic way will fully explore the information of the optimization process.
Updating migration operator
In the basic MBO algorithm, for the butterfly individuals in subpopulation 1, they are updated by migration operator, as shown Eqs. (1–3) [82]. In this way, all the newly-generated butterflies are accepted, and permitted to be passed to the next generation [82]. Sometimes, this may lead to slow convergence. Wang et al. [90] proposed a greedy strategy which ensures that only those butterfly individuals having better fitness are allowed to move to the succeeding stage, which can be given as follows:
wherewhere rand is randomly-generated number between 0 and 1, and ρ is a fixed number in the range [0, 1]. In general, in order to accelerate the convergence, ρ is not more than 0.1.According to Eq. (10), at each generation, the approximate round(ρ*NP1) butterfly individuals in subpopulation 1 having worse fitness will be accepted and passed to the next generation. Here, round(x) rounds the elements of x to the nearest integers. In this way, the diversity of the population will be improved without influencing the convergence of the MBO.
Butterfly adjusting operator
For the butterfly individuals in Land 2 (subpopulation 2), they will be updated by butterfly adjusting operator. In CBMBO, the butterfly adjusting operator is the same with MBO.
Combine subpopulation 1 with subpopulation 2
After implementing the updating migration operator and butterfly adjusting operator, the butterfly individuals in subpopulation 1 and subpopulation 2 are combined as one whole population.
Evaluate the population
All the butterfly individuals in population are evaluated according to the given objective function, and then the fitness of all the butterfly individuals is obtained.
Output the results
If the stop condition is met, then the algorithm stops and the final solution will be provided; otherwise, go to (3) and continue to implement the optimization process.
Based on the above analyses, finally the mainframe of CBMBO method is provided as shown in Algorithm 1. Also, its corresponding flowchart can be provided in Figure 1.
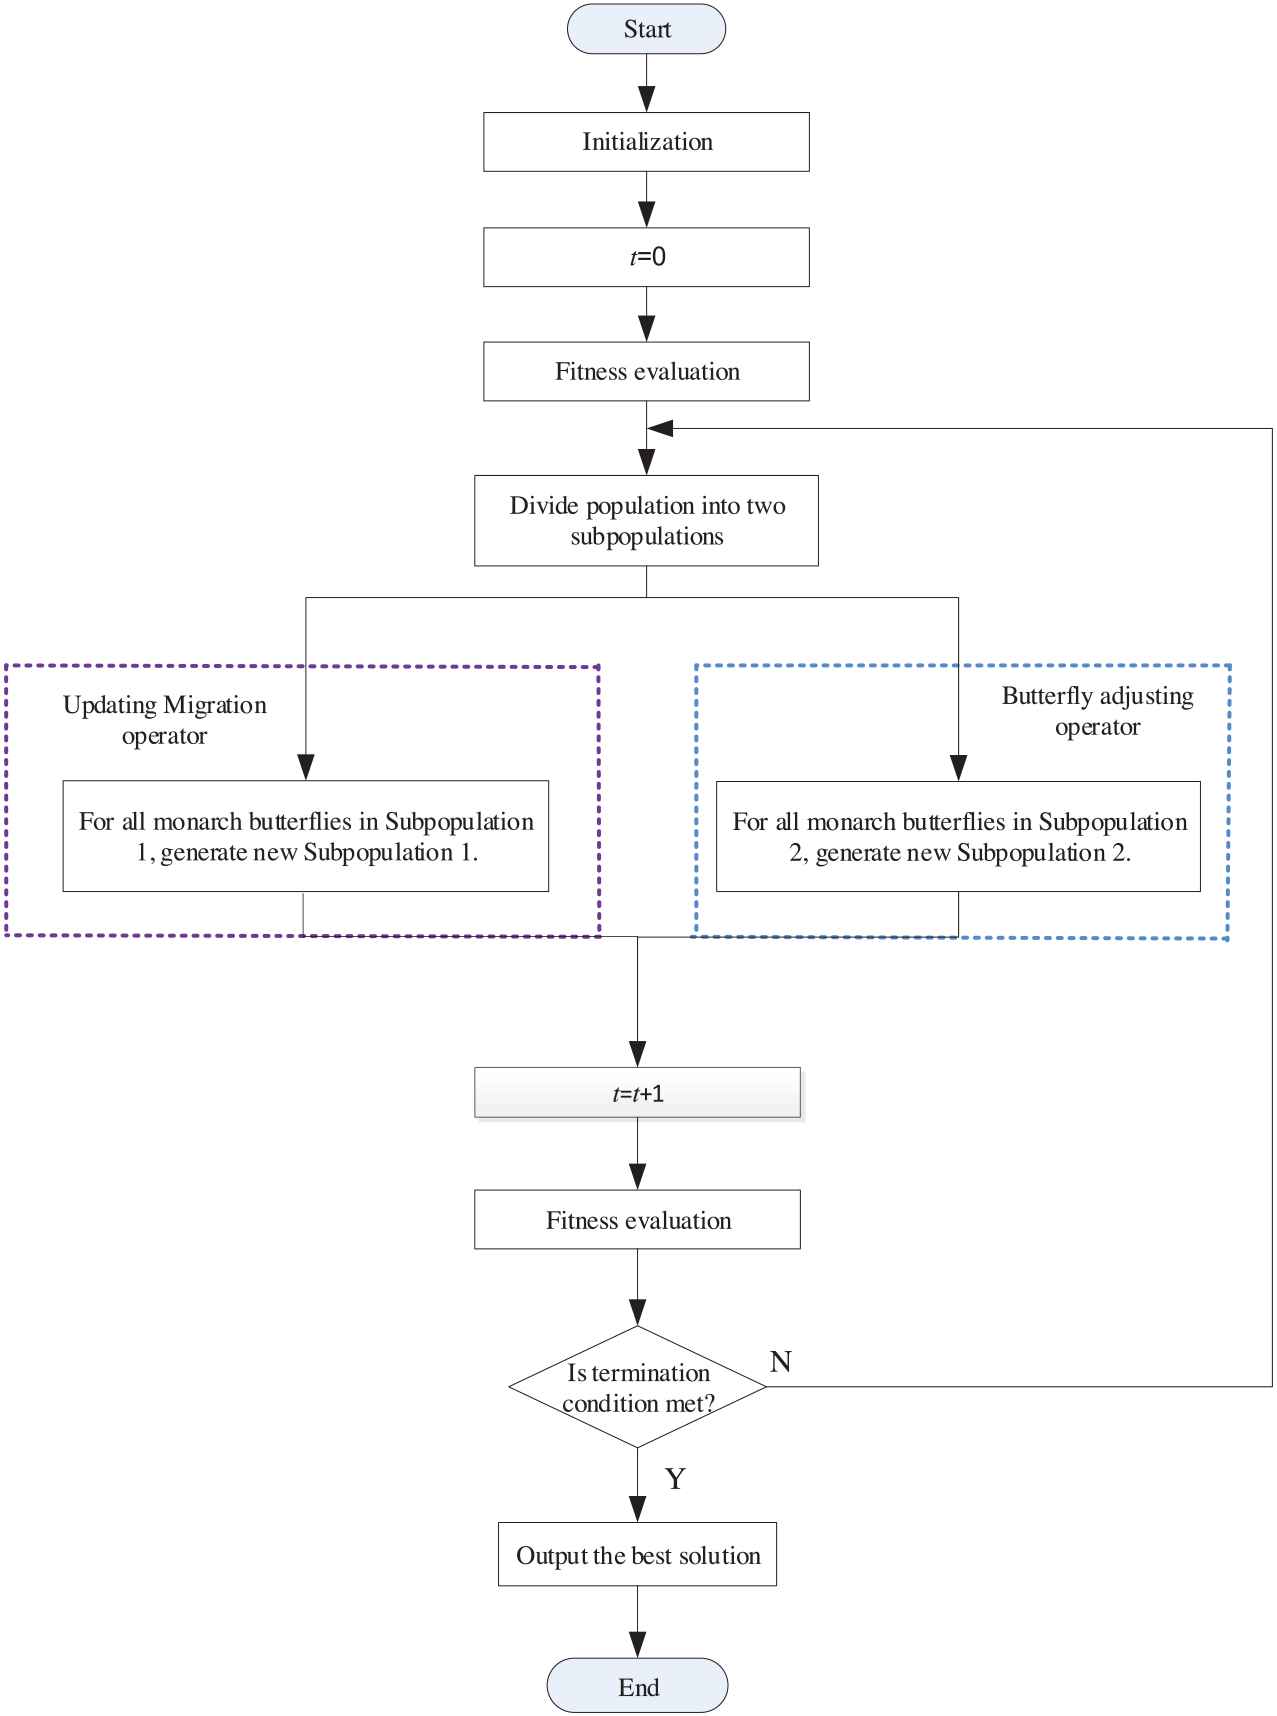
Flowchart of clustering-based monarch butterfly optimization (CBMBO) algorithm.
Algorithm 1: CBMBO algorithm
Begin
Step 1: Generate the initial population. Set the generation counter
Step 2: Evaluate the population. Evaluate each butterfly according to the given objective function.
Step 3: Divide the whole population into two subpopulations. Divide the whole population into two subpopulations through k-means clustering method.
Step 4: While t < MaxGen do
for
Generate
end for i
for
Generate
end for j
Combine subpopulation 1 with subpopulation 2 to generate the wholepopulation.
Evaluate the butterfly population according to the given objectivefunction.
end while
Step 5: If the stop condition is met, output the final solution; otherwise, go to Step 3.
End.
5. EXPERIMENTS
In order to prove the merits of CBMBO, it is compared on function optimization problems with five basic and four improved methods, respectively. Here, the parameters for MBO and CBMBO are used: max step Smax = 1.0, butterfly adjusting rate BAR = 5/12, migration period peri = 1.2, the migration ratio p = 5/12, and the ratio ρ = 0.1. That is to say, about 10% of butterfly individuals in subpopulation 1 having worse fitness will be passed to the next generation. It must be pointed out that the Euclidean distance is used in k-means clustering when dividing the whole population into two subpopulations. In addition, to acquire a fair comparison, all the experiments are conducted on the same PC as described in [107].
In this section, the proposed CBMBO algorithm is verified by twenty-eight CEC 2017 constrained benchmark functions (F01–F28). The characteristics of the twenty-eight CEC 2017 constrained benchmark functions (F01–F28) can be found in Table 1, including the number of decision variables and constraints (inequality constraints and equality constraints).
| Problem | Search Range | Type of Objective | Number of Constraints |
|
|---|---|---|---|---|
| E | I | |||
| F01 | [−100, 100]D | Nonseparable | 0 | 1 |
| Separable | ||||
| F02 | [−100, 100]D | Nonseparable, rotated | 0 | 1 |
| Nonseparable, rotated | ||||
| F03 | [−100, 100]D | Nonseparable | 1 | 1 |
| Separable | Separable | |||
| F04 | [−10, 10]D | Separable | 0 | 2 |
| Separable | ||||
| F05 | [−10, 10]D | Nonseparable | 0 | 2 |
| Nonseparable, rotated | ||||
| F06 | [−20, 20]D | Separable | 6 | 0 |
| Separable | ||||
| F07 | [−50, 50]D | Separable | 2 | 0 |
| Separable | ||||
| F08 | [−100, 100]D | Separable | 2 | 0 |
| Nonseparable | ||||
| F09 | [−10, 10]D | Separable | 2 | 0 |
| Nonseparable | ||||
| F10 | [−100, 100]D | Separable | 2 | 0 |
| Nonseparable | ||||
| F11 | [−100, 100]D | Separable | 1 | 1 |
| Nonseparable | Nonseparable | |||
| F12 | [−100, 100]D | Separable | 0 | 2 |
| Separable | ||||
| F13 | [−100, 100]D | Nonseparable | 0 | 3 |
| Separable | ||||
| F14 | [−100, 100]D | Nonseparable | 1 | 1 |
| Separable | Separable | |||
| F15 | [−100, 100]D | Separable | 1 | 1 |
| F16 | [−100, 100]D | Separable | 1 | 1 |
| Nonseparable | Separable | |||
| F17 | [−100, 100]D | Nonseparable | 1 | 1 |
| Nonseparable | Separable | |||
| F18 | [−100, 100]D | Separable | 1 | 2 |
| Nonseparable | ||||
| F19 | [−50, 50]D | Separable | 0 | 2 |
| Nonseparable | ||||
| F20 | [−100, 100]D | Nonseparable | 0 | 2 |
| F21 | [−100, 100]D | Rotated | 0 | 2 |
| Rotated | ||||
| F22 | [−100, 100]D | Rotated | 0 | 3 |
| Rotated | ||||
| F23 | [−100, 100]D | Rotated | 1 | 1 |
| Rotated | Rotated | |||
| F24 | [−100, 100]D | Rotated | 1 | 1 |
| Rotated | Rotated | |||
| F25 | [−100, 100]D | Rotated | 1 | 1 |
| Rotated | Rotated | |||
| F26 | [−100, 100]D | Rotated | 1 | 1 |
| Rotated | Rotated | |||
| F27 | [−100, 100]D | Rotated | 1 | 2 |
| Rotated | Rotated | |||
| F28 | [−50, 50]D | Rotated | 0 | 2 |
| Rotated | ||||
Details of 28 test problems. D is the number of decision variables, I is the number of inequality constraints, E is the number of equality constraints.
Because intelligent methods are always stochastic methods, thirty trials are implemented for each method in order to obtain typical statistical performances. The results of thirty implementations are recorded in Tables 3–15. The best value found is highlighted.
5.1. Comparisons with Five Basic Metaheuristic Algorithms
Here, the proposed CBMBO algorithm is benchmarked by twenty-eight constrained functions.
5.1.1. Benchmark evaluation
In this section, except MBO algorithm, the CBMBO is compared with five basic metaheuristic algorithms, which are bat algorithm (BA) [108], evolutionary strategy (ES) [109,110], HS [111], probability-based incremental learning (PBIL) [112], and PSO [33,113]. For other parameters, they can be found in Table 2. The results of the implementations are recorded in Tables 3–5. The best value found by each method is highlighted.
| Algorithm | Parameter Settings |
|---|---|
| BA | Loudness A = 0.5, pulse rate r = 0.5, and scaling factor ε = 0.001. |
| ES | The number of offspring |
| HS | HM accepting rate = 0.95 and pitch adjusting rate = 0.7. |
| PBIL | A learning rate of 0.05, 1 good population member, and 0 bad population members to use to update the probability vector each generation, an elitism parameter of 1, and a 0 probability vector mutation rate. |
| PSO | An inertial constant = 0.3, a cognitive constant = 1, and a social constant for swarm interaction = 1. |
Parameter settings of BA, ES, HS, PBIL, and PSO.
| BA | CBMBO | ES | HS | MBO | PBIL | PSO | |
|---|---|---|---|---|---|---|---|
| F01 | 1.12E5 | 3.82E4 | 8.15E4 | 6.78E4 | 6.48E4 | 6.75E4 | 5.55E4 |
| F02 | 1.00E5 | 4.47E4 | 8.11E4 | 6.73E4 | 5.06E4 | 7.07E4 | 5.59E4 |
| F03 | 1.30E5 | 4.50E4 | 8.35E4 | 8.06E4 | 6.76E4 | 7.04E4 | 6.17E4 |
| F04 | 624.20 | 293.50 | 970.70 | 817.60 | 482.30 | 830.50 | 578.30 |
| F05 | 1.97E6 | 1.80E5 | 3.48E6 | 2.11E6 | 1.07E6 | 1.85E6 | 7.81E5 |
| F06 | 2.32E3 | 675.40 | 2.87E3 | 2.38E3 | 1.32E3 | 2.29E3 | 1.47E3 |
| F07 | 9.59E3 | 9.00E3 | 9.47E3 | 9.57E3 | 9.24E3 | 9.59E3 | 9.54E3 |
| F08 | 1.06E3 | 966.90 | 1.06E3 | 1.05E3 | 977.00 | 1.04E3 | 1.04E3 |
| F09 | 8.80 | 0.99 | 8.14 | 7.29 | 1.79 | 4.25 | 6.34 |
| F10 | 1.06E3 | 990.50 | 1.05E3 | 1.04E3 | 999.30 | 1.03E3 | 1.03E3 |
| F11 | 7.98E3 | 7.31E3 | 8.28E3 | 8.88E3 | 7.83E3 | 7.96E3 | 8.84E3 |
| F12 | 4.11E4 | 9.48E3 | 4.78E4 | 4.76E4 | 2.65E4 | 4.99E4 | 2.56E4 |
| F13 | 1.54E10 | 1.20E9 | 1.72E10 | 1.68E10 | 6.56E9 | 1.77E10 | 6.10E9 |
| F14 | 20.63 | 20.26 | 21.20 | 21.16 | 20.54 | 21.76 | 21.20 |
| F15 | 80.91 | 50.85 | 82.13 | 78.22 | 62.39 | 76.99 | 62.87 |
| F16 | 938.00 | 329.20 | 960.60 | 905.60 | 665.60 | 972.70 | 678.50 |
| F17 | 11.88 | 3.52 | 13.20 | 12.64 | 6.26 | 13.79 | 7.26 |
| F18 | 4.45E4 | 8.18E3 | 4.76E4 | 4.71E4 | 3.04E4 | 4.97E4 | 2.50E4 |
| F19 | 104.70 | 43.54 | 107.70 | 104.70 | 79.28 | 104.30 | 101.90 |
| F20 | 8.63 | 4.85 | 9.48 | 9.22 | 6.42 | 9.29 | 9.29 |
| F21 | 1.50E5 | 4.79E4 | 1.72E5 | 1.66E5 | 1.06E5 | 1.69E5 | 9.34E4 |
| F22 | 2.41E11 | 1.67E10 | 2.29E11 | 1.91E11 | 6.50E10 | 1.82E11 | 8.06E10 |
| F23 | 20.38 | 21.20 | 21.14 | 21.16 | 21.15 | 21.17 | 21.16 |
| F24 | 156.40 | 89.12 | 152.70 | 148.20 | 112.20 | 147.40 | 121.00 |
| F25 | 1.78E3 | 871.00 | 1.74E3 | 1.73E3 | 1.25E3 | 1.75E3 | 1.31E3 |
| F26 | 44.30 | 11.29 | 43.42 | 42.35 | 25.52 | 42.01 | 23.75 |
| F27 | 1.66E5 | 3.79E4 | 1.67E5 | 1.67E5 | 9.43E4 | 1.69E5 | 9.37E4 |
| F28 | 157.20 | 114.20 | 154.20 | 150.80 | 130.90 | 142.80 | 147.20 |
| Total | 1 | 27 | 0 | 0 | 0 | 0 | 0 |
Mean function values with D = 30 obtained by CBMBO and other six basic metaheuristic algorithms.
| BA | CBMBO | ES | HS | MBO | PBIL | PSO | |
|---|---|---|---|---|---|---|---|
| F01 | 2.17E5 | 9.45E4 | 2.23E5 | 1.63E5 | 1.61E5 | 1.55E5 | 1.36E5 |
| F02 | 2.26E5 | 8.48E4 | 2.01E5 | 1.52E5 | 1.59E5 | 1.50E5 | 1.32E5 |
| F03 | 2.97E5 | 9.31E4 | 2.40E5 | 1.85E5 | 1.89E5 | 1.64E5 | 1.47E5 |
| F04 | 852.90 | 469.00 | 1.88E3 | 1.55E3 | 1.32E3 | 1.58E3 | 1.04E3 |
| F05 | 2.75E6 | 3.61E5 | 8.11E6 | 5.26E6 | 2.81E6 | 4.78E6 | 1.79E6 |
| F06 | 3.41E3 | 1.09E3 | 5.88E3 | 4.68E3 | 2.99E3 | 4.44E3 | 2.76E3 |
| F07 | 9.29E3 | 8.24E3 | 9.19E3 | 9.40E3 | 8.80E3 | 9.35E3 | 9.31E3 |
| F08 | 1.06E3 | 977.90 | 1.08E3 | 1.07E3 | 1.00E3 | 1.06E3 | 1.05E3 |
| F09 | 9.87 | 1.98 | 11.60 | 10.03 | 2.54 | 6.19 | 9.06 |
| F10 | 1.07E3 | 1.01E3 | 1.07E3 | 1.06E3 | 1.03E3 | 1.05E3 | 1.05E3 |
| F11 | 6.89E3 | 5.34E3 | 7.43E3 | 8.48E3 | 6.38E3 | 6.33E3 | 8.28E3 |
| F12 | 7.43E4 | 1.45E4 | 1.12E5 | 9.61E4 | 5.77E4 | 9.88E4 | 4.79E4 |
| F13 | 2.77E10 | 2.69E9 | 5.81E10 | 4.07E10 | 2.65E10 | 3.90E10 | 1.13E10 |
| F14 | 20.09 | 20.25 | 21.33 | 21.24 | 20.73 | 21.77 | 21.29 |
| F15 | 86.15 | 56.29 | 96.81 | 87.46 | 69.67 | 89.42 | 73.59 |
| F16 | 1.53E3 | 583.80 | 1.89E3 | 1.75E3 | 1.30E3 | 1.81E3 | 1.22E3 |
| F17 | 19.01 | 4.51 | 29.06 | 24.95 | 17.63 | 25.04 | 12.91 |
| F18 | 7.22E4 | 1.43E4 | 1.12E5 | 9.56E4 | 5.75E4 | 9.95E4 | 4.84E4 |
| F19 | 183.20 | 76.70 | 199.50 | 191.40 | 156.00 | 184.20 | 183.50 |
| F20 | 13.66 | 8.37 | 17.42 | 16.56 | 12.49 | 16.66 | 16.73 |
| F21 | 2.78E5 | 7.35E4 | 3.93E5 | 3.24E5 | 2.09E5 | 3.23E5 | 1.68E5 |
| F22 | 3.56E11 | 2.43E10 | 6.80E11 | 5.08E11 | 3.34E11 | 5.47E11 | 1.53E11 |
| F23 | 20.14 | 21.29 | 21.27 | 21.25 | 21.24 | 21.27 | 21.26 |
| F24 | 166.20 | 97.94 | 183.40 | 169.30 | 133.90 | 175.20 | 138.40 |
| F25 | 2.88E3 | 1.39E3 | 3.44E3 | 3.14E3 | 2.37E3 | 3.17E3 | 2.32E3 |
| F26 | 63.08 | 16.09 | 97.08 | 83.81 | 67.33 | 84.18 | 44.16 |
| F27 | 2.64E5 | 6.44E4 | 3.84E5 | 3.31E5 | 1.86E5 | 3.46E5 | 1.64E5 |
| F28 | 258.30 | 201.00 | 279.80 | 266.00 | 248.30 | 251.90 | 251.20 |
| Total | 2 | 26 | 0 | 0 | 0 | 0 | 0 |
Mean function values with D = 50 obtained by CBMBO and other six basic metaheuristic algorithms.
| BA | CBMBO | ES | HS | MBO | PBIL | PSO | |
|---|---|---|---|---|---|---|---|
| F01 | 6.77E5 | 3.34E5 | 8.64E5 | 5.40E5 | 9.02E5 | 5.39E5 | 4.76E5 |
| F02 | 6.64E5 | 3.07E5 | 8.20E5 | 5.66E5 | 6.97E5 | 5.39E5 | 4.58E5 |
| F03 | 8.64E5 | 3.35E5 | 1.05E6 | 6.29E5 | 6.46E5 | 5.38E5 | 5.05E5 |
| F04 | 1.91E3 | 1.06E3 | 4.13E3 | 3.67E3 | 2.66E3 | 3.82E3 | 2.38E3 |
| F05 | 5.10E6 | 7.43E5 | 2.37E7 | 1.62E7 | 1.48E7 | 1.54E7 | 5.25E6 |
| F06 | 7.05E3 | 2.32E3 | 1.32E4 | 1.12E4 | 9.14E3 | 1.17E4 | 6.35E3 |
| F07 | 8.63E3 | 6.56E3 | 8.73E3 | 9.11E3 | 8.20E3 | 8.99E3 | 8.93E3 |
| F08 | 1.07E3 | 959.20 | 1.09E3 | 1.08E3 | 984.90 | 1.09E3 | 1.06E3 |
| F09 | 11.05 | 3.78 | 14.39 | 12.77 | 6.75 | 10.56 | 11.43 |
| F10 | 1.08E3 | 1.01E3 | 1.10E3 | 1.09E3 | 1.02E3 | 1.08E3 | 1.07E3 |
| F11 | 4.14E3 | 764.80 | 6.00E3 | 7.62E3 | 2.77E3 | 3.22E3 | 7.23E3 |
| F12 | 1.61E5 | 4.32E4 | 2.95E5 | 2.48E5 | 1.79E5 | 2.41E5 | 1.34E5 |
| F13 | 7.16E10 | 1.08E10 | 1.86E11 | 1.34E11 | 8.72E10 | 1.38E11 | 4.32E10 |
| F14 | 20.05 | 20.31 | 21.43 | 21.37 | 21.02 | 21.73 | 21.39 |
| F15 | 95.54 | 73.99 | 112.00 | 103.60 | 70.41 | 107.80 | 89.43 |
| F16 | 3.24E3 | 1.45E3 | 4.32E3 | 3.97E3 | 2.93E3 | 4.03E3 | 2.78E3 |
| F17 | 43.04 | 11.80 | 74.21 | 60.52 | 37.20 | 62.49 | 33.24 |
| F18 | 1.60E5 | 4.58E4 | 2.97E5 | 2.40E5 | 2.24E5 | 2.40E5 | 1.22E5 |
| F19 | 410.30 | 181.20 | 445.40 | 422.10 | 369.20 | 407.30 | 404.40 |
| F20 | 23.44 | 18.13 | 38.41 | 37.31 | 30.96 | 37.34 | 37.61 |
| F21 | 5.43E5 | 1.94E5 | 9.82E5 | 8.05E5 | 6.39E5 | 8.28E5 | 4.33E5 |
| F22 | 8.98E11 | 9.33E10 | 2.57E12 | 1.65E12 | 8.71E11 | 1.82E12 | 5.23E11 |
| F23 | 20.16 | 21.39 | 21.38 | 21.39 | 21.37 | 21.38 | 21.38 |
| F24 | 180.40 | 127.00 | 227.50 | 203.90 | 167.00 | 212.60 | 166.10 |
| F25 | 5.97E3 | 3.24E3 | 7.81E3 | 7.09E3 | 6.28E3 | 7.17E3 | 5.35E3 |
| F26 | 146.10 | 45.99 | 246.00 | 204.40 | 160.20 | 211.40 | 109.70 |
| F27 | 5.78E5 | 1.50E5 | 9.88E5 | 8.03E5 | 4.18E5 | 8.34E5 | 4.55E5 |
| F28 | 554.20 | 453.60 | 612.80 | 580.30 | 537.40 | 555.10 | 552.40 |
| Total | 2 | 25 | 0 | 0 | 1 | 0 | 0 |
Mean function values with D = 100 obtained by CBMBO and other six basic metaheuristic algorithms.
D = 30
The results of twenty-eight CEC 2017 constrained benchmark functions with D = 30 are recorded in Table 3. From Table 3, for average performance, CBMBO has the best performance on twenty-seven out of the twenty-eight benchmarks. BA ranks two, and it is successful in finding the best values on one constrained function (F23). The implementations of other algorithms are similar, and all of them fail to search for the best function values on twenty-eight benchmarks.
D = 50
The results of 28 CEC 2017 constrained benchmark functions with D = 50 are recorded in Table 4. From Table 4, for average function values, CBMBO has the best performance, and it can find the optimal values on twenty-six out of the twenty-eight constrained benchmarks. BA performs slightly better than other metaheuristic algorithms, which is successful in finding the best values on two constrained functions (F14 and F23). For other metaheuristic algorithms, they have the similar performance, and all of them fail to search for the best function values on twenty-eight CEC 2017 constrained benchmark functions.
D = 100
The results of 28 CEC 2017 constrained benchmark functions with D = 100 are recorded in Table 5. From Table 5, CBMCO performs best and it is well capable of finding the best function values on twenty-five out of the twenty-eight constrained benchmarks. BA performs slightly better than MBO, and it is successful in finding the best values on two and one functions, respectively. For other metaheuristic algorithms, they have the similar performance, and all of them fail to search for the best function values on twenty-eight CEC 2017 constrained benchmark functions.
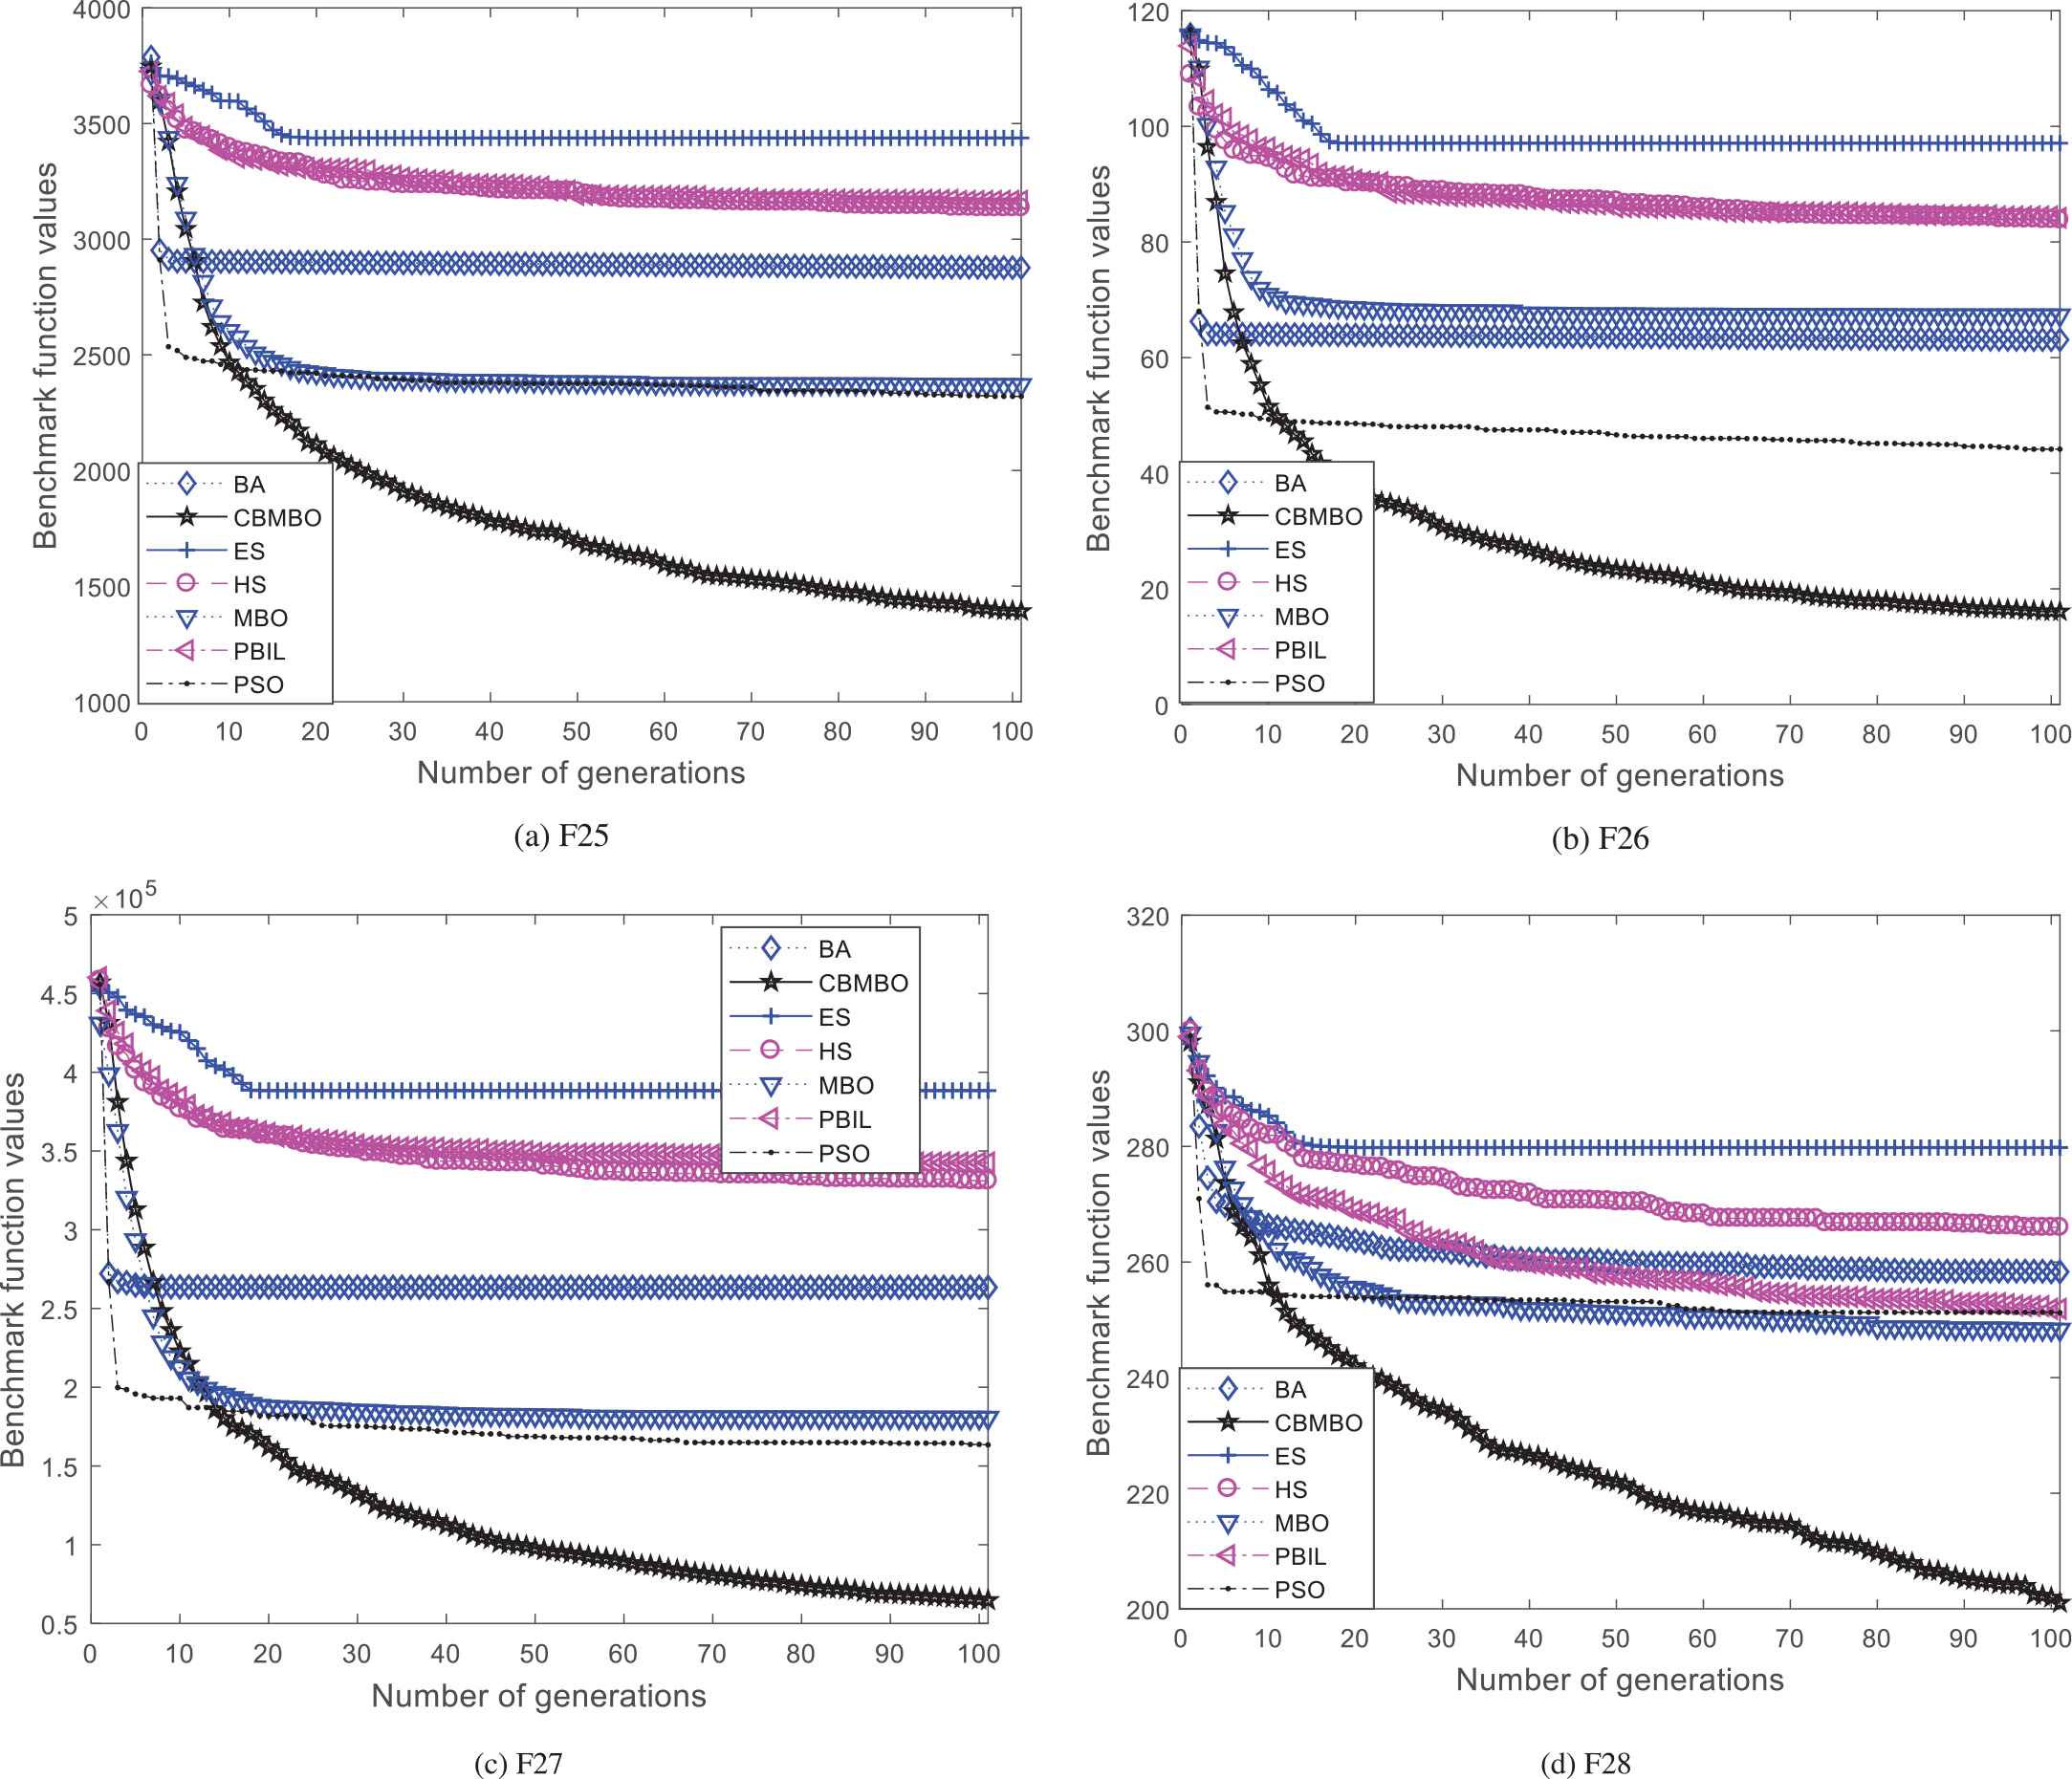
Furthermore, in order to prove the advantages of the proposed CBMBO method over other six algorithms when solving constrained optimization problems, convergence maps of the seven methods (BA, CBMBO, ES, HS, MBO, PBIL, and PSO) on F25–F28 with D = 30, 50, and 100 are given in Figures 2–4.

Convergent curves of the most presentative constrained functions with D = 30 obtained by clustering-based monarch butterfly optimization (CBMBO) and six other basic metaheuristic algorithms: (a) F25, (b) F26, (c) F27, and (d) F28.
Convergent curves of the most presentative constrained functions with D = 50 obtained by clustering-based monarch butterfly optimization (CBMBO) and six other basic metaheuristic algorithms: (a) F25, (b) F26, (c) F27, and (d) F28.

Convergent curves of the most presentative constrained functions with D = 100 obtained by clustering-based monarch butterfly optimization (CBMBO) and six other basic metaheuristic algorithms: (a) F25, (b) F26, (c) F27, and (d) F28.
It can be observed from Figure 2 that CBMBO has better optimization process in comparison with other six algorithms during the whole search process. For other six algorithms, the performance of MBO is only inferior to CBMBO, which is not worse than other metaheuristic algorithms.
From Figure 3, we can see that CBMBO has full advantage over other six metaheuristic algorithms during the whole search process. For other six algorithms, in general cases, PSO has relative better performance than other metaheuristic algorithms.
Also, for Figure 4, we can see that CBMBO has the fastest convergence to the optimal function values over other six metaheuristic algorithms during the whole search process. For other six algorithms, in general cases, MBO has relative better performance than other metaheuristic algorithms.
5.1.2. Comparisons with other six basic optimization methods by using t-test on twenty-eight CEC 2017 constrained functions
According to the final function values of thirty independent runs on twenty-eight 30-D, 50-D, and 100-D CEC 2017 constrained benchmark functions, as shown in Section 4.1.1, the t values on twenty-eight test problems of the two-tailed test with the 5% level of significance between CBMBO method and other six metaheuristic methods (BA, ES, HS, MBO, PBIL, and PSO) are provided in this section.
D = 30
The t values on twenty-eight 30-D test problems of the two-tailed test with the 5% level of significance between CBMBO algorithm and other six algorithms are recorded in Table 6. In Table 6, the value of t is significant at α = 0.05 by a two-tailed test. The result is highlighted in bold font for showing the better performance of CBMBO w.r.t. comparative method. The “Better,” “Equal,” and “Worse” in the last three rows indicate better than, equal to, and worse performance respectively of the CBMBO as compared with the comparative one. Here, we take the comparison between CBMBO and MBO as an example. CBMBO has better, equal, and worse performance than MBO on twenty-three, four, and one problems, respectively. Therefore, it can be said that CBMBO outperforms MBO on most constrained problems. In addition, for BA, ES, HS, PBIL, and PSO, CBMBO has the absolute advantage over them, and has better performance on almost all the benchmarks (twenty-seven out of twenty-eight benchmarks). The examples described above indicate that CBMBO significantly outperforms BA, ES, HS, PBIL, and PSO on most benchmarks.
D = 50
The t values on twenty-eight 50-D CEC 2017 constrained benchmark functions of the two-tailed test with the 5% level of significance between CBMBO algorithm and other six algorithms are recorded in Table 7. In Table 7, the value of t is significant at α = 0.05 by a two-tailed test. The result is highlighted in bold font for showing the better performance of CBMBO w.r.t. comparative method. The “Better,” “Equal,” and “Worse” in the last three rows indicate better than, equal to, and worse performance respectively of the CBMBO as compared with the comparative one. Here, the comparison between BA and CBMBO is taken as an example. CBMBO has better and worse performance than BA on twenty-six and two constrained problems, respectively. Apparently, it can be said that the performance of CBMBO is significantly better than BA on most constrained benchmarks. In addition, for ES, HS, PBIL, and PSO, CBMBO has the absolute advantage over them on twenty-seven out of the twenty-eight CEC 2017 constrained benchmarks. The examples mentioned above indicate that CBMBO significantly outperforms all the four comparative algorithms on most benchmarks.
D = 100
The t values on twenty-eight 100-D CEC 2017 constrained benchmark functions of the two-tailed test with the 5% level of significance between CBMBO algorithm and other six algorithms are recorded in Table 8. In Table 8, the value of t is significant at α = 0.05 by a two-tailed test. The result is highlighted in bold font for showing the better performance of CBMBO w.r.t. comparative method. The “Better,” “Equal,” and “Worse” in the last three rows indicate better than, equal to, and worse performance respectively of the CBMBO as compared with the comparative one. Here, we take the comparison between CBMBO and MBO as an example. Though CBMBO and MBO have the similar performance on four benchmark functions, CBMBO has better performance than MBO on most problems (twenty-three functions). In addition, for other five comparative algorithms (BA, ES, HS, PBIL, and PSO), CBMBO performs better than them on most CEC 2017 constrained benchmark functions. The comparisons above indicate that CBMBO significantly outperforms the comparative algorithms on most benchmarks. Looking carefully at the results as shown in Table 8, it is safe to say, CBMBO is a competitive and promising method on most cases when compared with the other four methods.
| BA | ES | HS | MBO | PBIL | PSO | |
|---|---|---|---|---|---|---|
| F01 | 9.94 | 11.06 | 8.82 | 3.83 | 7.77 | 4.76 |
| F02 | 8.65 | 10.38 | 8.27 | 0.90 | 9.54 | 3.92 |
| F03 | 12.08 | 9.23 | 8.62 | 3.04 | 6.75 | 3.92 |
| F04 | 13.69 | 35.55 | 36.94 | 4.49 | 45.35 | 17.59 |
| F05 | 11.57 | 20.29 | 21.53 | 3.47 | 23.28 | 10.28 |
| F06 | 18.70 | 36.49 | 30.99 | 4.22 | 31.70 | 16.03 |
| F07 | 25.15 | 24.80 | 29.74 | 7.78 | 30.72 | 29.03 |
| F08 | 11.93 | 12.16 | 11.41 | 0.95 | 9.53 | 9.58 |
| F09 | 15.52 | 15.51 | 14.23 | 1.27 | 7.51 | 12.03 |
| F10 | 13.33 | 11.25 | 11.28 | 1.01 | 7.11 | 8.48 |
| F11 | 9.41 | 15.64 | 29.70 | 3.86 | 12.87 | 28.91 |
| F12 | 18.63 | 34.26 | 30.98 | 4.77 | 39.72 | 15.86 |
| F13 | 13.71 | 22.97 | 19.36 | 3.35 | 27.94 | 11.16 |
| F14 | 7.37 | 62.86 | 65.01 | 15.22 | 144.50 | 57.65 |
| F15 | 10.01 | 13.15 | 11.79 | 2.91 | 11.16 | 4.86 |
| F16 | 27.68 | 42.28 | 35.16 | 7.10 | 38.64 | 20.08 |
| F17 | 16.13 | 26.98 | 29.12 | 3.68 | 34.56 | 12.23 |
| F18 | 25.26 | 32.20 | 35.33 | 6.62 | 40.38 | 16.23 |
| F19 | 25.24 | 33.45 | 28.78 | 11.82 | 30.16 | 30.96 |
| F20 | 18.58 | 27.70 | 24.72 | 7.50 | 27.68 | 27.51 |
| F21 | 12.87 | 23.46 | 23.02 | 5.57 | 28.13 | 9.96 |
| F22 | 11.08 | 19.84 | 25.32 | 3.83 | 23.10 | 12.22 |
| F23 | −13.65 | −3.66 | −2.53 | −2.78 | −1.58 | −2.45 |
| F24 | 13.76 | 16.69 | 15.76 | 3.18 | 14.77 | 7.44 |
| F25 | 17.00 | 24.18 | 22.03 | 4.87 | 23.76 | 10.91 |
| F26 | 16.75 | 22.38 | 21.89 | 5.25 | 21.52 | 9.44 |
| F27 | 16.29 | 28.29 | 25.66 | 4.96 | 31.33 | 11.50 |
| F28 | 17.31 | 19.48 | 17.44 | 6.21 | 12.38 | 14.85 |
| Better | 27 | 27 | 27 | 23 | 27 | 27 |
| Equal | 0 | 0 | 0 | 4 | 1 | 0 |
| Worse | 1 | 1 | 1 | 1 | 0 | 1 |
Comparisons between CBMBO and other six basic metaheuristic algorithms at α = 0.05 on a two-tailed t-tests on twenty-eight CEC 2017 constrained problems with D = 30.
| BA | ES | HS | MBO | PBIL | PSO | |
|---|---|---|---|---|---|---|
| F01 | 9.41 | 14.54 | 8.88 | 4.02 | 8.10 | 5.38 |
| F02 | 11.97 | 17.25 | 12.77 | 4.37 | 9.91 | 7.74 |
| F03 | 11.10 | 18.69 | 13.61 | 4.35 | 12.44 | 8.28 |
| F04 | 12.80 | 62.55 | 50.63 | 8.97 | 52.95 | 27.72 |
| F05 | 13.18 | 32.62 | 35.08 | 4.33 | 32.10 | 13.28 |
| F06 | 22.20 | 62.84 | 44.66 | 6.30 | 38.11 | 20.91 |
| F07 | 24.45 | 31.39 | 39.84 | 12.61 | 36.11 | 35.38 |
| F08 | 9.37 | 10.80 | 9.76 | 1.78 | 9.17 | 7.91 |
| F09 | 18.40 | 24.16 | 20.51 | 0.79 | 9.70 | 18.05 |
| F10 | 9.27 | 10.47 | 8.69 | 1.57 | 6.27 | 6.77 |
| F11 | 16.16 | 27.45 | 43.35 | 4.29 | 13.38 | 39.85 |
| F12 | 32.65 | 48.38 | 53.98 | 6.23 | 54.01 | 23.64 |
| F13 | 20.14 | 48.48 | 38.00 | 5.77 | 29.56 | 11.39 |
| F14 | −10.60 | 83.01 | 84.04 | 28.23 | 160.69 | 87.82 |
| F15 | 10.86 | 16.95 | 12.86 | 2.99 | 13.34 | 6.77 |
| F16 | 27.47 | 47.28 | 45.00 | 8.30 | 45.43 | 21.13 |
| F17 | 30.35 | 43.90 | 55.99 | 7.30 | 40.48 | 19.32 |
| F18 | 30.87 | 50.78 | 52.29 | 6.64 | 52.14 | 24.55 |
| F19 | 29.60 | 45.84 | 44.46 | 21.18 | 38.00 | 38.75 |
| F20 | 13.63 | 55.53 | 52.99 | 16.14 | 43.70 | 42.43 |
| F21 | 19.48 | 44.95 | 35.54 | 5.19 | 33.11 | 12.20 |
| F22 | 15.45 | 24.11 | 43.23 | 5.50 | 34.30 | 15.99 |
| F23 | −30.99 | −2.70 | −3.57 | −3.21 | −1.85 | −2.67 |
| F24 | 12.79 | 17.57 | 15.50 | 4.12 | 16.27 | 8.48 |
| F25 | 23.08 | 32.91 | 28.88 | 6.44 | 29.17 | 14.40 |
| F26 | 21.55 | 46.09 | 39.46 | 8.23 | 39.96 | 18.32 |
| F27 | 21.65 | 50.90 | 42.11 | 5.14 | 46.60 | 15.47 |
| F28 | 12.93 | 21.33 | 17.60 | 8.65 | 13.09 | 12.96 |
| Better | 26 | 27 | 27 | 24 | 27 | 27 |
| Equal | 0 | 0 | 0 | 3 | 1 | 0 |
| Worse | 2 | 1 | 1 | 1 | 0 | 1 |
Comparisons between CBMBO and other six basic metaheuristic algorithms at α = 0.05 on a two-tailed t-tests on twenty-eight CEC 2017 constrained problems with D = 50.
| BA | ES | HS | MBO | PBIL | PSO | |
|---|---|---|---|---|---|---|
| F01 | 7.40 | 15.43 | 7.44 | 8.72 | 8.03 | 4.72 |
| F02 | 8.72 | 15.91 | 10.77 | 4.41 | 11.17 | 6.32 |
| F03 | 7.08 | 14.08 | 10.65 | 3.74 | 7.75 | 6.24 |
| F04 | 14.68 | 58.27 | 53.68 | 6.52 | 46.38 | 25.96 |
| F05 | 14.14 | 61.69 | 57.11 | 6.46 | 34.44 | 16.82 |
| F06 | 28.77 | 87.87 | 62.53 | 7.93 | 50.66 | 26.15 |
| F07 | 25.82 | 44.01 | 52.70 | 19.58 | 43.95 | 46.79 |
| F08 | 10.34 | 12.12 | 11.50 | 1.46 | 11.98 | 9.63 |
| F09 | 9.04 | 13.42 | 11.36 | 1.99 | 8.26 | 9.48 |
| F10 | 8.81 | 10.95 | 9.46 | 1.06 | 9.22 | 7.98 |
| F11 | 15.66 | 25.30 | 33.54 | 3.23 | 12.07 | 31.71 |
| F12 | 27.18 | 63.15 | 55.30 | 6.41 | 48.82 | 22.70 |
| F13 | 15.62 | 38.44 | 36.88 | 4.47 | 21.24 | 12.18 |
| F14 | −8.20 | 61.43 | 56.93 | 30.89 | 81.37 | 60.68 |
| F15 | 6.88 | 13.67 | 10.65 | −0.62 | 11.92 | 5.19 |
| F16 | 25.83 | 46.18 | 42.78 | 6.82 | 47.42 | 20.86 |
| F17 | 21.50 | 58.10 | 44.90 | 4.78 | 44.81 | 19.56 |
| F18 | 21.84 | 48.49 | 46.07 | 9.45 | 39.30 | 17.21 |
| F19 | 30.24 | 41.59 | 39.59 | 22.23 | 32.61 | 34.15 |
| F20 | 3.83 | 55.70 | 43.86 | 25.29 | 54.19 | 58.72 |
| F21 | 19.50 | 38.63 | 36.08 | 6.22 | 36.61 | 15.89 |
| F22 | 14.04 | 49.14 | 43.93 | 3.67 | 34.19 | 13.39 |
| F23 | −33.10 | −0.90 | −0.30 | −2.16 | −1.35 | −0.94 |
| F24 | 8.46 | 16.52 | 12.81 | 3.09 | 13.91 | 6.23 |
| F25 | 14.80 | 31.04 | 26.67 | 7.00 | 25.51 | 13.80 |
| F26 | 19.36 | 38.78 | 34.82 | 6.31 | 35.50 | 12.55 |
| F27 | 18.26 | 50.25 | 48.28 | 4.62 | 41.31 | 17.39 |
| F28 | 13.10 | 27.28 | 21.88 | 7.01 | 15.49 | 14.86 |
| Better | 26 | 27 | 27 | 23 | 27 | 27 |
| Equal | 0 | 1 | 1 | 4 | 1 | 1 |
| Worse | 2 | 0 | 0 | 1 | 0 | 0 |
Comparisons between CBMBO and other six basic metaheuristic algorithms at α = 0.05 on a two-tailed t-tests on twenty-eight CEC 2017 constrained problems with D = 100.
5.2. Comparison with Four Improved Metaheuristic Algorithms
In order to further verify the effectiveness of the CBMBO, the proposed CBMBO algorithm is further compared with three improved metaheuristic algorithms on twenty-eight CEC 2017 constrained functions. The improved metaheuristic algorithms used in this paper are algorithms, multi-swarm bat algorithm (MBA) [114], hybrid method based on KH and quantum-behaved PSO (QKH) [115], and BA with variable neighborhood search (VNBA) [116], and their parameters can be found in Table 9.
| Algorithm | Parameter Settings |
|---|---|
| MBA | Five swarms, loudness A = 0.5, pulse rate r = 0.5, and scaling factor ε = 0.001. |
| MBO | Max step Smax = 1.0, butterfly adjusting rate BAR = 5/12, migration period peri = 1.2, and the migration ratio p = 5/12. |
| QKH | Foraging speed Vf = 0.02, maximum diffusion speed Dmax = 0.005, and maximum induced speed Nmax = 0.01. |
| VNBA | Loudness A = 0.5, pulse rate r = 0.5, scaling factor ε = 0.001, the minimum frequency fmin = 0, and the maximum frequency fmax is set to the mean of the difference of upper bound and lower bound of the bat, the number of neighbors nNE = 4, the threshold for nonimproved bats NI = 0.2*NP. |
Parameter settings of MBA, MBO, QKH, and VNBA.
5.2.1. Benchmark evaluation
As before, the dimensions of these functions are 30, 50, and 100, respectively. The results of the implementations are recorded in Tables 10–12. The best value found by each method is highlighted.
| CBMBO | MBA | MBO | QKH | VNBA | |
|---|---|---|---|---|---|
| F01 | 4.39E4 | 4.26E4 | 5.65E4 | 8.62E4 | 5.70E4 |
| F02 | 4.00E4 | 4.87E4 | 6.67E4 | 9.14E4 | 6.41E4 |
| F03 | 3.94E4 | 8.05E4 | 7.64E4 | 1.47E5 | 6.58E4 |
| F04 | 288.80 | 272.20 | 469.90 | 630.40 | 466.90 |
| F05 | 1.46E5 | 1.69E5 | 8.34E5 | 1.47E6 | 4.80E5 |
| F06 | 654.60 | 825.20 | 1.28E3 | 1.70E3 | 1.18E3 |
| F07 | 9.00E3 | 9.21E3 | 9.21E3 | 9.50E3 | 9.44E3 |
| F08 | 973.90 | 1.03E3 | 987.60 | 1.03E3 | 983.80 |
| F09 | 1.07 | 5.85 | 0.77 | 9.49 | 5.34 |
| F10 | 985.20 | 1.04E3 | 1.01E3 | 1.05E3 | 993.90 |
| F11 | 7.26E3 | 9.07E3 | 7.95E3 | 8.60E3 | 7.03E3 |
| F12 | 8.94E3 | 2.09E4 | 2.71E4 | 2.53E4 | 1.62E4 |
| F13 | 1.51E9 | 4.23E9 | 9.85E9 | 8.26E9 | 2.93E9 |
| F14 | 20.27 | 20.40 | 20.55 | 20.82 | 21.01 |
| F15 | 55.14 | 58.31 | 62.27 | 53.76 | 60.49 |
| F16 | 365.90 | 642.60 | 636.40 | 664.10 | 513.60 |
| F17 | 3.40 | 6.73 | 7.80 | 7.02 | 4.88 |
| F18 | 9.23E3 | 1.56E4 | 2.86E4 | 2.52E4 | 1.73E4 |
| F19 | 44.79 | 67.01 | 75.65 | 95.57 | 94.68 |
| F20 | 4.81 | 3.60 | 6.28 | 7.48 | 8.96 |
| F21 | 4.17E4 | 7.97E4 | 7.81E4 | 1.09E5 | 7.64E4 |
| F22 | 1.28E10 | 7.10E10 | 8.10E10 | 1.75E11 | 7.51E10 |
| F23 | 21.17 | 20.90 | 21.16 | 21.13 | 21.20 |
| F24 | 91.19 | 112.00 | 116.50 | 132.60 | 113.70 |
| F25 | 873.10 | 1.25E3 | 1.17E3 | 1.31E3 | 1.16E3 |
| F26 | 10.53 | 21.22 | 25.18 | 27.44 | 18.84 |
| F27 | 4.37E4 | 7.55E4 | 9.05E4 | 1.04E5 | 6.69E4 |
| F28 | 111.40 | 145.50 | 133.90 | 154.10 | 147.40 |
| Total | 21 | 4 | 1 | 1 | 1 |
Mean function values with D = 30 obtained by CBMBO and other four improved metaheuristic algorithms.
| CBMBO | MBA | MBO | QKH | VNBA | |
|---|---|---|---|---|---|
| F01 | 9.61E4 | 8.04E4 | 2.10E5 | 2.11E5 | 1.41E5 |
| F02 | 7.93E4 | 9.03E4 | 1.63E5 | 2.10E5 | 1.50E5 |
| F03 | 9.04E4 | 1.33E5 | 1.74E5 | 2.65E5 | 1.68E5 |
| F04 | 451.40 | 400.10 | 1.21E3 | 944.40 | 765.10 |
| F05 | 2.47E5 | 1.19E4 | 3.29E6 | 1.42E6 | 5.79E5 |
| F06 | 1.00E3 | 1.11E3 | 3.24E3 | 2.40E3 | 1.95E3 |
| F07 | 8.20E3 | 8.50E3 | 8.86E3 | 9.12E3 | 9.15E3 |
| F08 | 984.20 | 1.03E3 | 986.70 | 1.02E3 | 985.80 |
| F09 | 1.74 | 5.69 | 1.59 | 10.66 | 5.21 |
| F10 | 997.50 | 1.04E3 | 1.03E3 | 1.05E3 | 996.80 |
| F11 | 5.31E3 | 8.83E3 | 6.59E3 | 7.59E3 | 5.05E3 |
| F12 | 1.62E4 | 3.72E4 | 6.73E4 | 3.33E4 | 2.57E4 |
| F13 | 2.62E9 | 5.90E9 | 1.78E10 | 8.81E9 | 3.66E9 |
| F14 | 20.25 | 20.46 | 20.72 | 20.87 | 21.08 |
| F15 | 55.24 | 55.97 | 72.55 | 50.79 | 67.97 |
| F16 | 578.80 | 1.06E3 | 1.27E3 | 1.04E3 | 857.10 |
| F17 | 5.43 | 9.77 | 18.28 | 9.30 | 7.78 |
| F18 | 1.49E4 | 2.14E4 | 6.34E4 | 3.38E4 | 2.69E4 |
| F19 | 76.51 | 109.40 | 158.10 | 167.60 | 165.60 |
| F20 | 8.14 | 5.27 | 12.39 | 12.05 | 16.57 |
| F21 | 6.22E4 | 1.26E5 | 2.41E5 | 1.21E5 | 9.78E4 |
| F22 | 3.27E10 | 7.94E10 | 4.39E11 | 1.87E11 | 5.96E10 |
| F23 | 21.28 | 20.98 | 21.25 | 21.02 | 21.28 |
| F24 | 101.20 | 102.70 | 143.80 | 128.20 | 115.00 |
| F25 | 1.40E3 | 1.92E3 | 2.21E3 | 1.92E3 | 1.76E3 |
| F26 | 14.73 | 29.90 | 57.17 | 32.89 | 24.30 |
| F27 | 6.84E4 | 1.08E5 | 2.14E5 | 1.21E5 | 9.95E4 |
| F28 | 198.60 | 236.70 | 237.60 | 250.50 | 248.10 |
| Total | 19 | 5 | 1 | 1 | 2 |
Mean function values with D = 50 obtained by CBMBO and other four improved metaheuristic algorithms.
| CBMBO | MBA | MBO | QKH | VNBA | |
|---|---|---|---|---|---|
| F01 | 3.63E5 | 2.12E5 | 7.32E5 | 6.70E5 | 5.16E5 |
| F02 | 3.32E5 | 1.78E5 | 5.97E5 | 6.34E5 | 5.16E5 |
| F03 | 3.96E5 | 2.71E5 | 7.05E5 | 9.12E5 | 5.52E5 |
| F04 | 923.70 | 912.80 | 2.60E3 | 1.81E3 | 1.64E3 |
| F05 | 7.90E5 | 1.42E3 | 1.28E7 | 2.07E6 | 1.49E6 |
| F06 | 2.55E3 | 2.07E3 | 8.75E3 | 4.30E3 | 4.00E3 |
| F07 | 6.62E3 | 7.01E3 | 8.19E3 | 8.36E3 | 8.70E3 |
| F08 | 977.20 | 1.03E3 | 994.80 | 1.02E3 | 984.70 |
| F09 | 3.94 | 6.06 | 4.27 | 10.68 | 7.35 |
| F10 | 1.01E3 | 1.05E3 | 1.03E3 | 1.05E3 | 1.03E3 |
| F11 | 597.80 | 8.04E3 | 3.21E3 | 5.49E3 | 48.69 |
| F12 | 4.09E4 | 7.98E4 | 2.15E5 | 7.97E4 | 7.26E4 |
| F13 | 1.01E10 | 1.39E10 | 1.00E11 | 1.62E10 | 1.46E10 |
| F14 | 20.32 | 20.60 | 21.01 | 20.97 | 21.24 |
| F15 | 69.61 | 60.01 | 85.09 | 53.44 | 85.86 |
| F16 | 1.47E3 | 2.12E3 | 3.13E3 | 2.35E3 | 2.13E3 |
| F17 | 11.55 | 19.34 | 40.30 | 20.17 | 18.68 |
| F18 | 4.60E4 | 4.63E4 | 2.08E5 | 7.89E4 | 7.08E4 |
| F19 | 169.40 | 241.20 | 371.50 | 338.80 | 381.20 |
| F20 | 18.50 | 10.77 | 31.70 | 24.62 | 36.81 |
| F21 | 1.77E5 | 2.23E5 | 4.79E5 | 2.77E5 | 2.58E5 |
| F22 | 1.00E11 | 1.56E11 | 1.07E12 | 3.14E11 | 1.72E11 |
| F23 | 21.40 | 21.20 | 21.37 | 21.07 | 21.39 |
| F24 | 126.80 | 108.50 | 155.20 | 138.90 | 162.10 |
| F25 | 3.59E3 | 3.69E3 | 5.92E3 | 4.06E3 | 4.15E3 |
| F26 | 44.34 | 56.78 | 164.50 | 68.27 | 66.00 |
| F27 | 1.97E5 | 2.25E5 | 5.97E5 | 2.72E5 | 2.42E5 |
| F28 | 438.40 | 510.10 | 553.60 | 527.10 | 545.10 |
| Total | 16 | 9 | 0 | 2 | 1 |
Mean function values with D = 100 obtained by CBMBO and other four improved metaheuristic algorithms.
D = 30
The results of twenty-eight CEC 2017 constrained benchmark functions with D = 30 are recorded in Table 10. From Table 10, for average performance, CBMBO has the best performance on twenty-one out of the twenty-eight constrained benchmarks. MBA ranks two, and it is successful in finding the best values on four constrained functions. The implementations of MBO, QKH, and VNBA are similar, and all of them can search for the best function values on only one benchmark.
D = 50
The results of 28 CEC 2017 constrained benchmark functions with D = 50 are recorded in Table 11. From Table 11, for average function values, CBMBO has the best performance, and it can find the optimal values on nineteen out of the twenty-eight benchmarks. MBA performs slightly better than VNBA, and they rank 2 and 3, respectively, which are successful in finding the best values on five and two constrained functions. MBO and QKH have the similar performance, and both of them can successfully search for the best function values on only one CEC 2017 constrained benchmark function.
D = 100
The results of 28 CEC 2017 constrained benchmark functions with D = 100 are recorded in Table 12. From Table 12, CBMBO performs best and it is well capable of finding the best function values on sixteen out of the twenty-eight constrained benchmarks. MBA is only inferior to CBMBO, and it is successful in finding the best values on nine constrained functions. For other metaheuristic algorithms, QKH performs best on two constrained functions (F15 and F23), which is better than VNBA. While, MBO fails to search for the best function values among twenty-eight benchmarks.
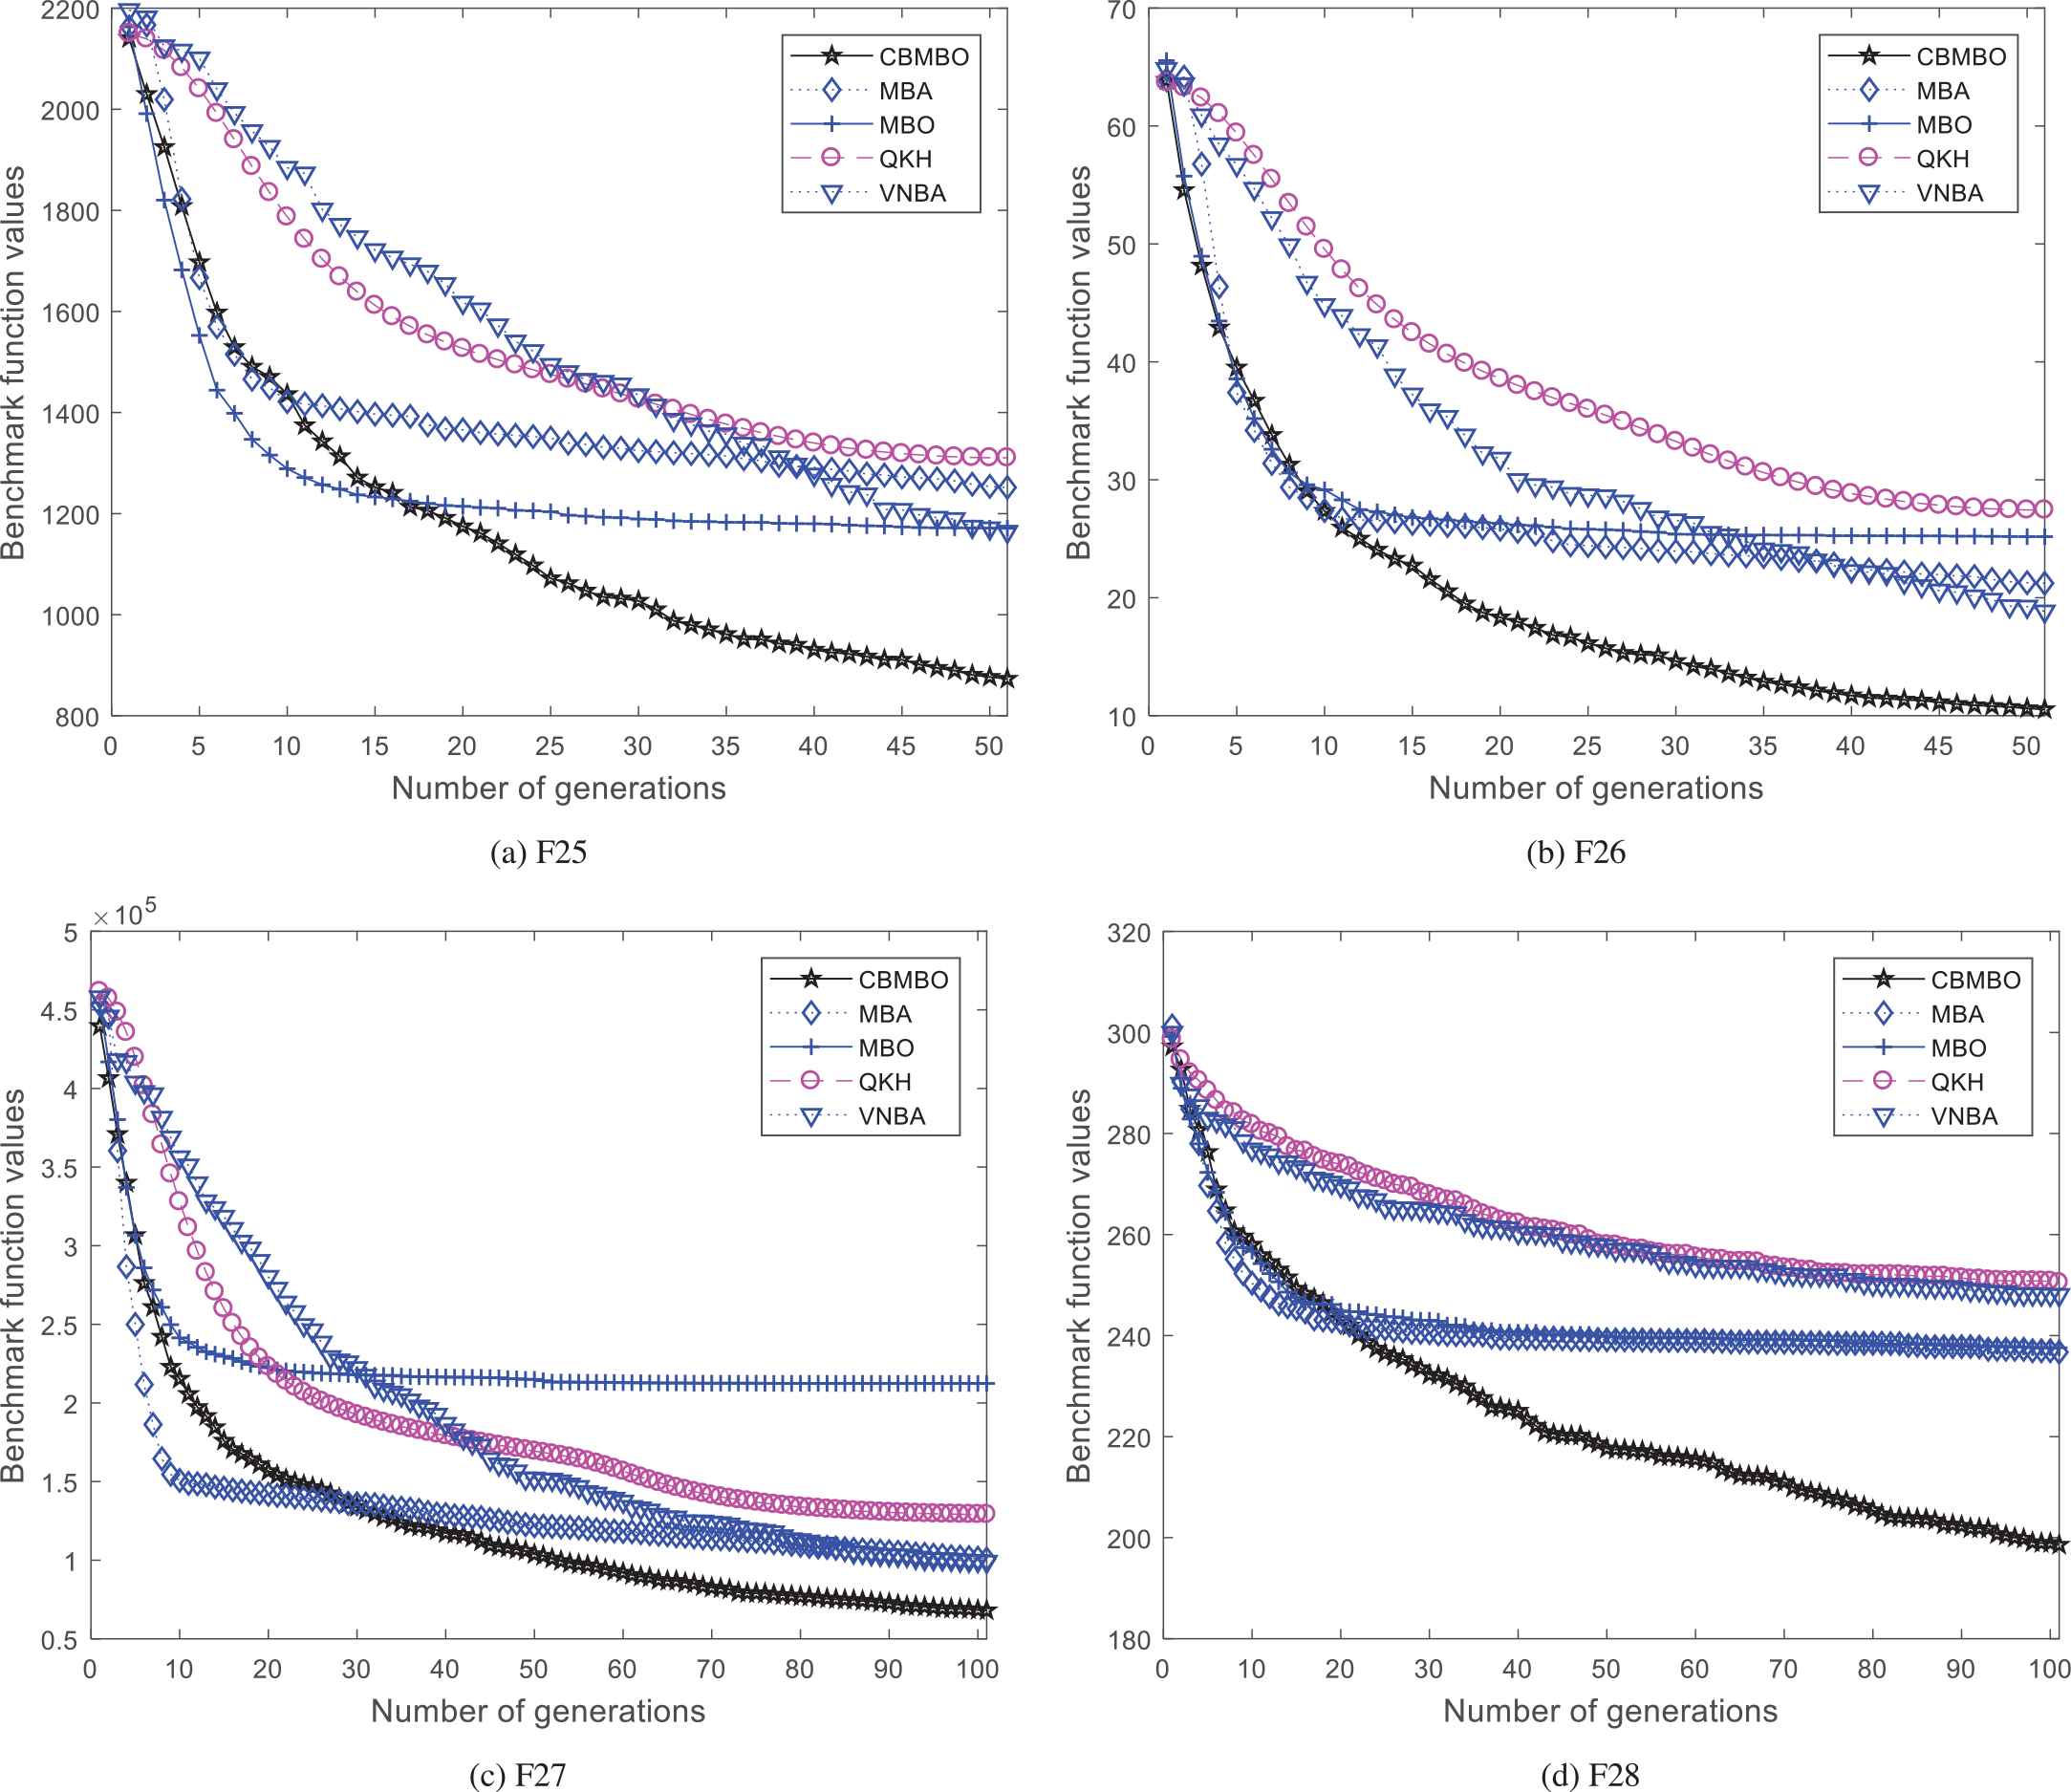
Furthermore, in order to prove the advantages of CBMBO method over other four algorithms when solving constrained optimization problems, convergence maps of the five methods (CBMBO, MBA, MBO, QKH, and VNBA) on F25–F28 with D = 30, 50, and 100 are given in Figures 5–7.

Convergent curves of the most presentative constrained functions with D = 30 obtained by clustering-based monarch butterfly optimization (CBMBO) and four other improved metaheuristic algorithms: (a) F25, (b) F26, (c) F27, and (d) F28.
Convergent curves of the most presentative constrained functions with D = 50 obtained by clustering-based monarch butterfly optimization (CBMBO) and four other improved metaheuristic algorithms: (a) F25, (b) F26, (c) F27, and (d) F28.

Convergent curves of the most presentative constrained functions with D = 100 obtained by clustering-based monarch butterfly optimization (CBMBO) and four other improved metaheuristic algorithms: (a) F25, (b) F26, (c) F27, and (d) F28.
It can be observed from Figure 5 that CBMBO has better optimization process in comparison with other four algorithms during the whole search process. For other four algorithms, the performance of VNBA and MBO is only inferior to CBMBO, which is better than MBA and QKH.
From Figure 6 that CBMBO has absolute advantage over other four metaheuristic algorithms during the whole search process. For other four algorithms, in general, VNBA performs better than other three metaheuristic algorithms (MBA, MBO, and QKH).
For D = 100 case, from Figure 7 that CBMBO performs better than other four metaheuristic algorithms during the whole search process. For other four algorithms, in general, MBA is only inferior to CBMBO, and it performs better than other three metaheuristic algorithms (MBO, QKH, and VNBA).
5.2.2. Comparisons with other four optimization methods by using t-test for twenty-eight CEC 2017 constrained functions
According to the final function values of thirty independent runs on twenty-eight 30-D, 50-D, and 100-D CEC 2017 constrained benchmark functions, as shown in Section 5.2.1, the t values on twenty-eight constrained problems of the two-tailed test with the 5% level of significance between CBMBO method and other four metaheuristic methods (MBA, MBO, QKH, and VNBA) are provided in this section.
D = 30
The t values on twenty-eight 30-D constrained problems of the two-tailed test with the 5% level of significance between CBMBO algorithm and other algorithms are recorded in Table 13. In Table 13, the value of t is significant at α = 0.05 by a two-tailed test. The result is highlighted in bold font for showing the better performance of CBMBO w.r.t. comparative method. The “Better,” “Equal,” and “Worse” in the last three rows indicate better than, equal to, and worse performance respectively of the CBMBO as compared with the comparative one. Here, we take the comparison between CBMBO and VNBA as an example. CBMBO has better, equal, and worse performance than VNBA on twenty-three, four, and one problems, respectively. Therefore, it can be said that CBMBO has absolute advantage over VNBA on most test problems. In addition, for MBA, MBO, and QKH, CBMBO performs significantly better them, and has the better performance on almost all the benchmarks. The examples described above indicate that CBMBO significantly outperforms MBA, MBO, QKH, and VNBA on most benchmarks.
D = 50
The t values on twenty-eight 50-D CEC 2017 constrained benchmark functions of the two-tailed test with the 5% level of significance between CBMBO algorithm and other four algorithms are recorded in Table 14. In Table 14, the value of t is significant at α = 0.05 by a two-tailed test. The result is highlighted in bold font for showing the better performance of CBMBO w.r.t. comparative method. The “Better,” “Equal,” and “Worse” in the last three rows indicate better than, equal to, and worse performance respectively of the CBMBO as compared with the comparative one. Here, the comparison between CBMBO and QKH is taken as an example. CBMBO has better and worse performance than QKH on twenty-six and one constrained problems, respectively. The performance between CBMBO and QKH has no significant differences on one constrained problem (F15). To summarize, it can be said that the performance of CBMBO is not worse than QKH on most test problems. In addition, for MBA, MBO, and VNBA, CBMBO has the absolute advantage over them on most CEC 2017 constrained benchmarks. The examples mentioned above indicate that CBMBO significantly outperforms all the four comparative algorithms on most benchmarks.
D = 100
The t values on twenty-eight 100-D CEC 2017 constrained benchmark functions of the two-tailed test with the 5% level of significance between CBMBO algorithm and other four algorithms are recorded in Table 15. In Table 15, the value of t is significant at α = 0.05 by a two-tailed test. The result is highlighted in bold font for showing the better performance of CBMBO w.r.t. comparative method. The “Better,” “Equal,” and “Worse” in the last three rows indicate better than, equal to, and worse performance respectively of the CBMBO as compared with the comparative one. Here, we take the comparison between CBMBO and MBA as an example. Though CBMBO and MBA have the similar performance on five benchmark functions, CBMBO has better performance than CBMBO on most problems (fourteen functions). In addition, for other three comparative algorithms (MBO, QKH, and VNBA), CBMBO performs better than them on most CEC 2017 constrained benchmark functions. The comparisons above indicate that CBMBO significantly outperforms the comparative algorithms on most benchmarks. Looking carefully at the results as shown in Table 15, it is safe to say, CBMBO is a competitive and promising method on most cases when compared with the other four methods.
| MBA | MBO | QKH | VNBA | |
|---|---|---|---|---|
| F01 | −0.12 | 1.89 | 7.31 | 3.42 |
| F02 | 1.80 | 3.34 | 9.25 | 4.98 |
| F03 | 5.19 | 5.46 | 8.77 | 6.42 |
| F04 | −1.00 | 5.07 | 20.88 | 10.15 |
| F05 | 0.49 | 4.29 | 25.82 | 6.71 |
| F06 | 3.33 | 5.49 | 26.15 | 12.37 |
| F07 | 9.47 | 7.49 | 22.43 | 17.59 |
| F08 | 7.39 | 1.18 | 6.64 | 1.05 |
| F09 | 13.14 | −0.58 | 22.24 | 7.76 |
| F10 | 9.81 | 2.60 | 12.18 | 1.37 |
| F11 | 31.40 | 4.99 | 23.71 | −4.72 |
| F12 | 7.93 | 5.50 | 17.12 | 5.16 |
| F13 | 4.57 | 4.10 | 18.60 | 3.50 |
| F14 | 5.87 | 15.59 | 14.70 | 33.69 |
| F15 | 1.18 | 1.86 | −0.62 | 1.74 |
| F16 | 12.35 | 5.40 | 14.55 | 6.91 |
| F17 | 10.19 | 5.77 | 16.20 | 5.16 |
| F18 | 6.82 | 6.10 | 20.06 | 6.64 |
| F19 | 11.49 | 12.07 | 20.10 | 25.23 |
| F20 | −8.64 | 7.62 | 10.96 | 28.82 |
| F21 | 7.83 | 3.60 | 16.38 | 6.83 |
| F22 | 6.63 | 4.31 | 19.69 | 4.62 |
| F23 | −14.27 | −0.85 | −2.36 | 1.72 |
| F24 | 4.70 | 3.76 | 9.23 | 4.82 |
| F25 | 8.44 | 3.79 | 10.78 | 5.48 |
| F26 | 9.60 | 5.77 | 15.22 | 5.07 |
| F27 | 7.20 | 4.05 | 14.25 | 5.48 |
| F28 | 11.75 | 8.38 | 15.05 | 14.10 |
| Better | 21 | 23 | 26 | 23 |
| Equal | 5 | 5 | 1 | 4 |
| Worse | 2 | 0 | 1 | 1 |
Comparisons between CBMBO and other four improved metaheuristic algorithms at α = 0.05 on a two-tailed t-tests on twenty-eight CEC 2017 constrained problems with D = 30.
| MBA | MBO | QKH | VNBA | |
|---|---|---|---|---|
| F01 | −2.13 | 6.98 | 8.80 | 6.08 |
| F02 | 1.20 | 4.87 | 11.97 | 8.47 |
| F03 | 3.68 | 3.91 | 10.14 | 7.30 |
| F04 | −2.50 | 8.33 | 23.59 | 14.51 |
| F05 | −10.31 | 5.83 | 38.21 | 6.59 |
| F06 | 1.81 | 7.10 | 24.47 | 14.70 |
| F07 | 8.39 | 14.03 | 24.47 | 26.36 |
| F08 | 6.41 | 0.19 | 4.71 | 0.17 |
| F09 | 8.84 | −0.22 | 20.10 | 6.10 |
| F10 | 7.59 | 2.81 | 9.23 | −0.08 |
| F11 | 48.45 | 4.63 | 30.15 | −4.11 |
| F12 | 10.50 | 7.05 | 15.35 | 6.78 |
| F13 | 5.03 | 3.81 | 17.29 | 2.06 |
| F14 | 16.08 | 20.88 | 27.71 | 51.59 |
| F15 | 0.29 | 4.42 | −2.01 | 4.38 |
| F16 | 14.84 | 7.49 | 16.47 | 10.82 |
| F17 | 8.39 | 7.22 | 10.94 | 5.60 |
| F18 | 5.90 | 6.19 | 22.73 | 9.68 |
| F19 | 9.94 | 17.66 | 24.15 | 25.29 |
| F20 | −15.89 | 13.33 | 13.58 | 40.22 |
| F21 | 8.45 | 7.03 | 14.90 | 6.22 |
| F22 | 5.16 | 7.43 | 20.47 | 3.33 |
| F23 | −22.30 | −2.50 | −10.66 | 0.61 |
| F24 | 0.31 | 5.05 | 5.06 | 2.31 |
| F25 | 7.36 | 5.05 | 8.58 | 5.20 |
| F26 | 8.38 | 7.34 | 13.55 | 6.03 |
| F27 | 5.21 | 6.28 | 11.06 | 4.73 |
| F28 | 10.67 | 8.45 | 17.27 | 14.82 |
| Better | 19 | 25 | 26 | 24 |
| Equal | 4 | 2 | 1 | 3 |
| Worse | 5 | 1 | 1 | 1 |
Comparisons between CBMBO and other four improved metaheuristic algorithms at α = 0.05 on a two-tailed t-tests on twenty-eight CEC 2017 constrained problems with D = 50.
| MBA | MBO | QKH | VNBA | |
|---|---|---|---|---|
| F01 | −7.43 | 5.18 | 9.08 | 5.32 |
| F02 | −5.83 | 3.03 | 6.87 | 6.66 |
| F03 | −3.29 | 3.85 | 9.96 | 5.08 |
| F04 | −0.28 | 6.23 | 24.08 | 19.27 |
| F05 | −9.07 | 5.11 | 13.83 | 4.26 |
| F06 | −3.89 | 6.56 | 16.03 | 11.29 |
| F07 | 5.83 | 18.55 | 29.17 | 30.74 |
| F08 | 4.85 | 0.98 | 3.50 | 0.62 |
| F09 | 2.79 | 0.25 | 8.94 | 3.84 |
| F10 | 4.27 | 1.16 | 4.55 | 2.22 |
| F11 | 40.48 | 4.10 | 24.64 | −3.10 |
| F12 | 8.65 | 8.71 | 14.60 | 9.94 |
| F13 | 1.27 | 5.38 | 2.88 | 1.84 |
| F14 | 15.45 | 34.55 | 28.60 | 58.11 |
| F15 | −2.66 | 2.50 | −4.83 | 3.93 |
| F16 | 9.82 | 8.12 | 17.07 | 12.01 |
| F17 | 8.37 | 6.35 | 12.97 | 9.61 |
| F18 | −0.14 | 8.44 | 8.34 | 5.75 |
| F19 | 9.71 | 20.33 | 17.09 | 29.09 |
| F20 | −16.70 | 21.88 | 10.98 | 37.91 |
| F21 | 2.62 | 3.94 | 6.33 | 4.12 |
| F22 | 2.78 | 4.25 | 13.56 | 3.18 |
| F23 | −23.89 | −2.75 | −19.49 | −0.61 |
| F24 | −2.63 | 2.09 | 1.75 | 4.47 |
| F25 | 0.61 | 5.35 | 3.17 | 2.61 |
| F26 | 3.08 | 6.29 | 6.50 | 5.03 |
| F27 | 1.49 | 5.53 | 4.08 | 2.50 |
| F28 | 9.55 | 8.78 | 12.65 | 14.21 |
| Better | 14 | 24 | 25 | 24 |
| Equal | 5 | 3 | 1 | 3 |
| Worse | 9 | 1 | 2 | 1 |
Comparisons between CBMBO and other four improved metaheuristic algorithms at α = 0.05 on a two-tailed t-tests on twenty-eight CEC 2017 constrained problems with D = 100.
All the experiments conducted in this section have proven the effectiveness and efficiency of the proposed CBMBO algorithm. This also indicates that CBMBO is a promising, robust optimization strategy for solving the constrained problems.
6. CONCLUSIONS
In the basic MBO algorithm, after initializing the butterfly population, the whole population is divided into two subpopulations according to the fixed ratio. This fixed partition scheme fails to take full advantage of the population information during the optimization process. In this paper, one of ML techniques, clustering, is introduced into the basic MBO algorithm, so an improved clustering-based MBO namely CBMBO is proposed. In CBMBO algorithm, the whole population is divided into two subpopulations according to k-means clustering. The butterfly individuals in the same subpopulation have the minimal distance. Also, in migration operator, only the individuals having better fitness can be passed to the next generation instead of accepting all the updated individuals used in the basic MBO algorithm. In order to improve the diversity of the population, few individuals having worse fitness are accepted as new individuals. In order to verify the performance of our proposed CBMBO algorithm, CBMBO is compared with six basic and four improved metaheuristic algorithms on twenty-eight CEC 2017 constrained problems with dimension of 30, 50, and 100, respectively. The experimental results suggest a significant addition to the portfolio of computational intelligence techniques.
In function optimization, there are various aspects that are worthy of further investigation. First of all, the parameters in the proposed CBMBO algorithm may be regulated to assure that it will have much more fast convergence speed. Another direction for future work is how to apply CBMBO to real applications, such as test-sheet composition problem, UCAV path planning, and WSN dynamic deployment. Finally, future analysis of the proposed CBMBO method using dynamic system and Markov chain can give a theoretical insight into their advantages and disadvantages.
CONFLICTS OF INTEREST
The authors have declared no conflicts of interest.
AUTHORS' CONTRIBUTIONS
Conceptualization, Sibo Huang; research literature, Sibo Huang and Han Cui; literature search, Sibo Huang and Han Cui; writing—original draft preparation, Sibo Huang; writing—review and editing, Sibo Huang; funding acquisition, Zhaoquan Cai and Xiaohui Wei. All authors have read and agreed to the published version of the manuscript.
ACKNOWLEDGMENTS
This work was supported by the National Natural Science Foundation of China (No. 61772225), the Major Projects of Guangdong Education Department for Foundation Research and Applied Research (No. 2017KZDXM081, No. 2018KZDXM066), the Featured Innovative Projects of Department of Education of Guangdong Province (No.2019KTSCX175), and the Scientific Research Program of Huizhou under Grant (No.2017C0402018).
REFERENCES
Cite this article
TY  - JOUR
AU  - Sibo Huang
AU  - Han Cui
AU  - Xiaohui Wei
AU  - Zhaoquan Cai
PY  - 2020
DA  - 2020/09/23
TI  - Clustering-Based Monarch Butterfly Optimization for Constrained Optimization
JO  - International Journal of Computational Intelligence Systems
SP  - 1369
EP  - 1392
VL  - 13
IS  - 1
SN  - 1875-6883
UR  - https://doi.org/10.2991/ijcis.d.200821.001
DO  - 10.2991/ijcis.d.200821.001
ID  - Huang2020
ER  -