
A New Hybrid and Ensemble Gene Selection Approach with an Enhanced Genetic Algorithm for Classification of Microarray Gene Expression Values on Leukemia Cancer
 , Ali H. Işik2, , Tuncay Yiğit3,
 - DOI
- 10.2991/ijcis.d.200928.001How to use a DOI?
- Keywords
- Ensemble approach genetic algorithm; Hybrid algorithm microarray leukemia gene selection; Cancer classification
- Abstract
Leukemia cancer, like other types of cancer, is a deadly health condition that threatens the lives of many people around the world. Micro array data are used extensively to reveal the gene-cancer as well as gene–gene relationships of Leukemia cancer due to the fact that it allows the expression value of thousands of genes to be revealed at once. However, the size of the high-dimensional data that the micro arrays accommodate makes it difficult to work with these data. In this study, a new approach was suggested in order to classify the micro arrays of leukemia cancer in a more efficient way by reducing the data size choosing the significant genes. This approach includes two steps: the ensemble step and the hybrid step. In the first step, a gene filtration process is carried out by creating an ensemble gene selection algorithm through Fisher correlation score, Wilcoxon rank sum, and information gain methods. In the second step, the feature selection phase step, the most successful genes among these genes are revealed by using an enhanced genetic algorithm. As a result of the classification process, the leave one out cross validation (LOOCV), 5-fold, and 10-fold cross validation results were found 100%, 98.57, and 97.14, respectively also 100% accuracy was obtained by 2 genes.
- Copyright
- © 2020 The Authors. Published by Atlantis Press B.V.
- Open Access
- This is an open access article distributed under the CC BY-NC 4.0 license (http://creativecommons.org/licenses/by-nc/4.0/).
1. INTRODUCTION
Cancer is defined as a disease where abnormal cells are reproduced in an uncontrolled way and invade other tissues. More people will suffer from this disease every day and it will also cause death of individuals. Leukemia is a type of cancer that occurs as a result of rapid growth of blood stem cells in bone marrow [1]. According to a report published in 2019, it is estimated that 61,780 new people will be caught in this disease in one year and 22,840 people will die due to this disease [2]. Therefore, the studies that are carried out to reveal the genetic reasons of Leukemia and to diagnose it instantly are gaining more importance every day. Within this scope, a micro array technology that enables the expression values of thousands of genes to be analyzed and be measured simultaneously plays an important role in revealing the gene-cancer and gene–gene relationships [3]. Micro array data keep thousands of genes in each sample, but thanks to the difficulty in obtaining the data, the number of samples is insufficient. Meanwhile, only some of these genes are relevant to the disease where majority might be irrelevant [4]. As a result of this, some problems arise such as excessive calculation cost, incompatibility of the highly complex data with the classification algorithm, and lower success rate of classification.
In order to increase the classification rate and to decrease the computing cost for revealing the significant genes, various feature selection approaches were suggested in the literature. Feature selection is defined as the process of determining the most appropriate subset among the features [5].
In this study, all feature selection processes are for determining the most appropriate gene-subset. To this end, this process will be referred to as gene selection in the study. Although major gene selection methods are classified under 3 categories as filter, wrapper, and hybrid [6], different approaches such as embedded [7], online [8], and ensemble [9] can also be seen in the literature.
One of the gene selection methods is called the filter approach and it depends heavily on statistical data such as correlation and distance among the genes while determining the gene-subset [10]. Although this method determines the significant genes instantly, it works independent from classification algorithms. Thus, its classification success is lower than those of other approaches. However, it can be used for slower approaches as a pretreatment process to opt out statistically insignificant genes from data sets. Thanks to this, heuristic algorithms with high computing costs run fast and the incompatibility problem between data and algorithm is eliminated. To this end, Fisher correlation score (FCS) [11], information gain (IG) [12], and Wilcoxon rank sum (WRS) [13] are used among the popular algorithms which are used in the literature or gene selection and classification of cancer data.
Wrapper approaches try to find subsets that have high classification success rates. It can yield a higher performance since it directly focuses on classification success. However, high numbers of potential subsets in data sets with huge data size and classification success for each solution set require a high computing cost. In wrapper approach, genetic algorithm (GA) [14] is widely used for gene selection.
Hybrid approaches, by combining the advantages of filter and wrapper approaches, both decrease the computing costs and utilize an iterative method to increase the classification success. Generally, in the first step of this approach, statistically significant genes are determined among micro array data set through a filter. In the second step, an iterative selection process is carried out according to the classification success among these genes. Various hybrid algorithms such as FCS and bat algorithm [6], cellular automata and ant colony optimization [7], IG and support vector machine (SVM) [15], and PSO and K nearest neighborhood (KNN) [16] are recommended in the literature. In their study, Lee, C-P, and Leu [17] followed a different arrangement by using gene selection through GA in the first place and filter process in the second.
Ensemble algorithms, on the other hand, run on a principle that combines the results of various algorithms doing the same task. Thanks to this method, it is aimed to obtain the performance values of individual algorithms at a better level when they work en masse [18]. This unification process can be done in some ways. Ensemble algorithms can be created by combining various filter algorithms and wrapper approaches [19]. By this means, a disadvantage of one algorithm can be eliminated by another disadvantage. Furthermore, ensemble filtration and wrapper approaches can return both ensemble and hybrid output when they are run in turns [9,20–23].
In this study, it was aimed to classify the data related to leukemia cancer by designing an ensemble and hybrid algorithm. It was also aimed to reveal the gene-cancer as well as gene–gene relationships. To that end, the gene filtration algorithms that are frequently used in the literature such as FCS, IG, and WRS were put into an ensemble form in the first step of the study. Later, a common gene filtration process was performed. The genes obtained from the filtration process were combined by passing them through a threshold value according to the classification performance. After determining the statistically significant genes, second step was taken by creating a lower subset complexity. The selection of the most significant genes related to leukemia cancer in the second step was performed by increasing the classification success iteratively while using a GA. While the performance of the selected genes was measured by KNN in the first step, the relevance value of the GA in the second step was determined by an ensemble approach which was made up of KNN, SVM, and Naïve Bayes algorithms.
The arrangement of this paper is as follows: In the Section 2, the algorithms that were used in this approach are explained. In the Section 3, the ensemble and hybrid algorithm are explained in detail. In the Section 4, findings that were obtained following the gene selection and classification processes through the developed approach are shared. In Sections 5 and 6, the discussion and results are presented, respectively.
2. MATERIALS AND METHODS
In this section, filter algorithms such as FCS, IG, and WRS, which are used in the first step of the developed approach, are explained. Then, the GA used in the second step is presented.
2.1. Fisher Correlation Score
Due to the fact that it is a simple and fast algorithm, FCS is one of the most preferred algorithms in machine learning and in downsizing micro array data [24]. The purpose of FCS can be summarized as finding subsets that represent different classes as long as the distance between the features is the same [25]. Equation (1) was used in order to grade the genes inside the micro array data through FCS and in order to choose the genes possessing the highest score [26]:
For each j class,
2.2. Information Gain
IG is simply defined as a decrease in entropy that emerges after being partitioned by a gene, samples of which was selected from a data set, or by a class parameter [27]. IG measures the variant of a gene within a class. Thanks to this method, the amount of data it carries can be revealed by studying the value changes of a gene throughout different classes. If a selected gene does not have different values in different classes, it can be concluded that it carries less data, or it has a high entropy. To this end, the entropy of class parameter must be calculated initially. For this calculation, this Equation (2) was used [28]:
H(A) represents the probability distribution entropy of class attribute while P(a) is the fraction of samples in class a to all samples. However, since the data in the micro array data sets are continuous, determining a threshold value is required for each feature before the probability computation process. In this study, this value was determined by having the mean of each feature. The values that are higher or lower than this mean with respect to this threshold value are designed in a way that can point to two different probabilities. Following the entropy calculation, class dependent entropy for each gene is calculated by Equation (3) below [29]. Afterward, IG is calculated as in Equation (4) by opting out the gene entropies from the entropy of the class.
In the equations provided, B represents the gene, IG of which was desired to be calculated.
2.3. Wilcoxon Rank Sum
WRS measures the difference of a feature on other samples. WRS test are mostly preferred for conditions where the number of samples is low. Therefore, WRS has a huge advantage on gene filtration of micro array data where the number of samples is low and where the number of features is high. The first computation required for this measurement is carried out [13] as in Equation (5):
The function given in the
2.4. Genetic Algorithm
GA is an optimization algorithm that imitates the survival effort of living things under changing environmental conditions. It works on particle swarm principles and it includes various solution methods within [30]. In gene selection, it is used to determine the most appropriate genes with the purpose to increase the classification success of the GA and to reduce the size of data set.
A traditional GA consists of selection, crossover, and mutation operators that are performed iteratively after the problem is adapted to the algorithm. In the adaptation step, the data set is divided into subsets at the size of the number of genes. These subsets are called chromosomes and all chromosomes are called population. The selection operator computes a fitness value for each chromosome for crossover. This fitness value is obtained by computing the classification success that the genes in the chromosomes obtain. In the crossover step, paired chromosomes according to their fitness values can exchange genes among each other in proportion to the crossover rate. In this way, common genes of two chromosomes are able to create new and more successful chromosomes. Mutation is the change that occurs in the genes of chromosomes at mutation rate. Thanks to these changes, different genes can also be tested by enlarging the solution set. By choosing the chromosomes with the highest performance value following the mutation processes, a new generation is created. These operators are repeated until the desired fitness function is obtained or as much as the number of iterations.
3. PROPOSED APPROACH
The approach that was developed in this study is made up of two steps. In the first step, gene selection is done by letting the filter algorithms work in ensemble way. In the second step, another gene selection is done iteratively by using GA among the genes that were obtained from the first step. Furthermore, in this step, classification algorithms are used in ensemble way to compute the fitness value of the GA.
As mentioned earlier, although they run fast, gene filtering approaches are not sufficient on their own for choosing the significant genes. Wrapper approaches, on the other hand, yield a higher classification success even though the computation cost is high. Therefore, the hybrid algorithms that are created by combining these two different approaches run fast and better performance values can be obtained from them. Yet, while the genes are being selected in the filtering step, there are some genes left out. This can pose a great risk because these left out genes might be significant when they are selected with different genes and they might be related to cancer although they are not statistically significant according to the relevant filtering algorithm. In this case, a poor gene pool that does not possess sufficient information about cancer is transferred to the wrapper approach in the second step. This will have a direct effect on the performance of the wrapper approach and the desired performance value can never be obtained by these filtered genes. In the first step, using multiple algorithms that perform gene selection through statistical methods instead of using only one single filter algorithm makes it possible to overcome this difficulty. Thus, even if a cancer-related gene is not chosen by one algorithm, it still has a chance to be selected by another one. In this respect, an ensemble gene selection algorithm using Fisher correlation algorithm, IG, and WRS was developed for the first step of the study.
The developed ensemble gene selection algorithm grades all the genes through three filter algorithms separately. The three gene grading list that was obtained as a result of this is put into an order from the gene with the highest grade to the one with the lowest. At this point, in order to determine the number of genes to be selected, the performance values that KNN obtain as a fast classification algorithm are used. In the KNN algorithm, Euclidean distance function which is given in Equation (7) was used to calculate the distance between gene expression values and the value of 5 was used as K parameter. The performance score of each subset is calculated by leave one out cross validation (LOOCV) method. Initially, gene-subsets are determined through each filter algorithm. By choosing the subsets with the most successful LOOCV value a new common subset is created. In this way, the gene selection processes are completed in the first step. However, under the condition when the most successful LOOCV values are obtained using different number of genes by each filter algorithm, it appears a disproportional distribution. On one hand, a filter algorithm can return a higher success with fewer genes, on the other hand, another one can have the same success with a greater number of genes. In order that the mutation operator of the developed GA in the second step can take this disproportional distribution into consideration, significance degree of each gene is calculated by using Equation (8). The flowchart of the developed ensemble gene selection algorithm is presented in Figure 1.
In the equation,
In the equation, X stands for the selected gene-subset, while
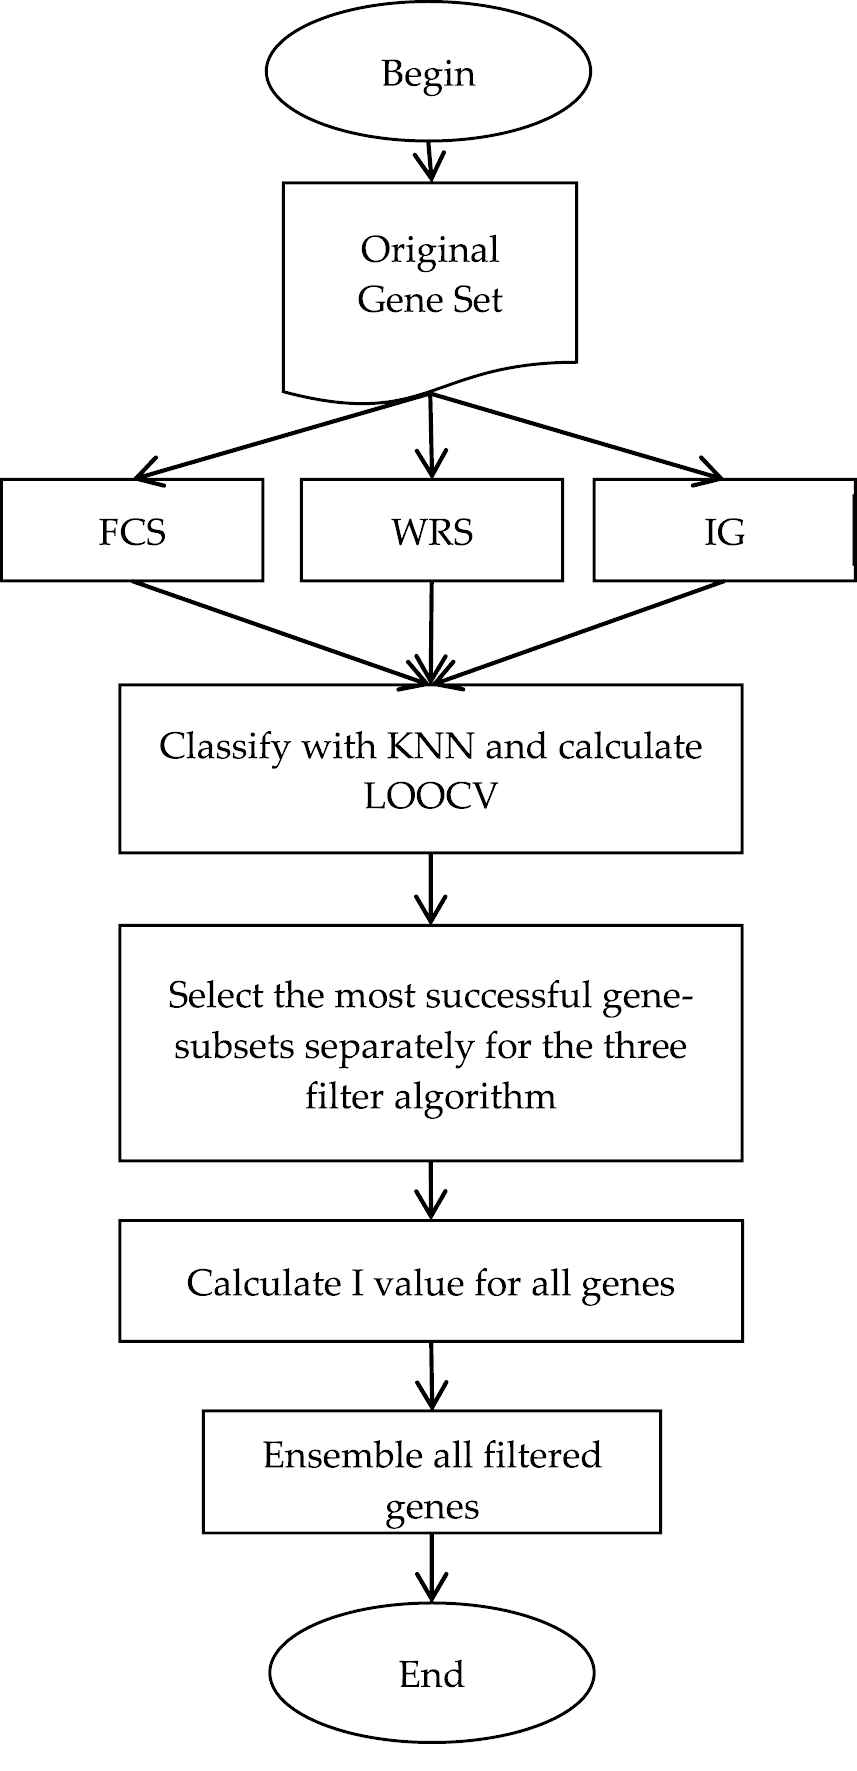
Ensemble gen selection flowchart.
At the adaptation step of the GA, the genes that were selected by the ensemble gene selection algorithm are subdivided into the subsets in a way that they make random combinations (Figure 2). These subsets form the GA chromosomes.
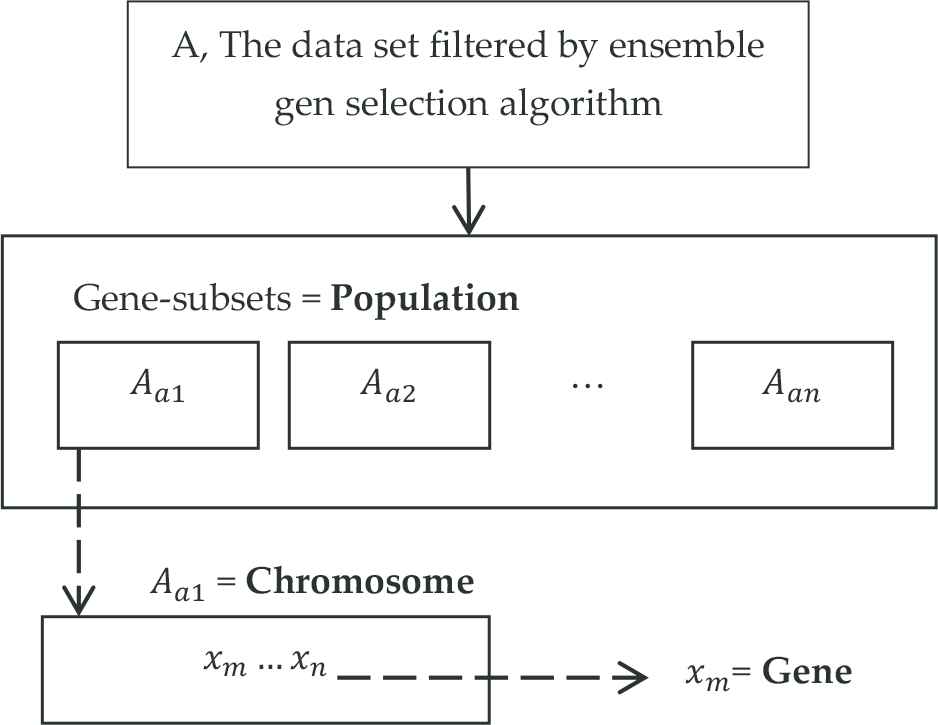
Adaptation of genetic algorithm to the data set.
The fitness value of each chromosome following the adaptation step is the LOOCV value that is obtained as a result of the classification process made with the genes in the chromosome. However, while obtaining this LOOCV value, an ensemble classification algorithm made up of KNN, SVM, and Bayes is used instead of one single algorithm. This algorithm makes a new classification estimation through majority voting by looking at the classification estimations made by KNN, SVM, and Bayes for each sample (Figure 3). Euclidian is used as distance measurement in KNN and nonlinear radial basis function (RBF) is used for the kernel function of SVM.
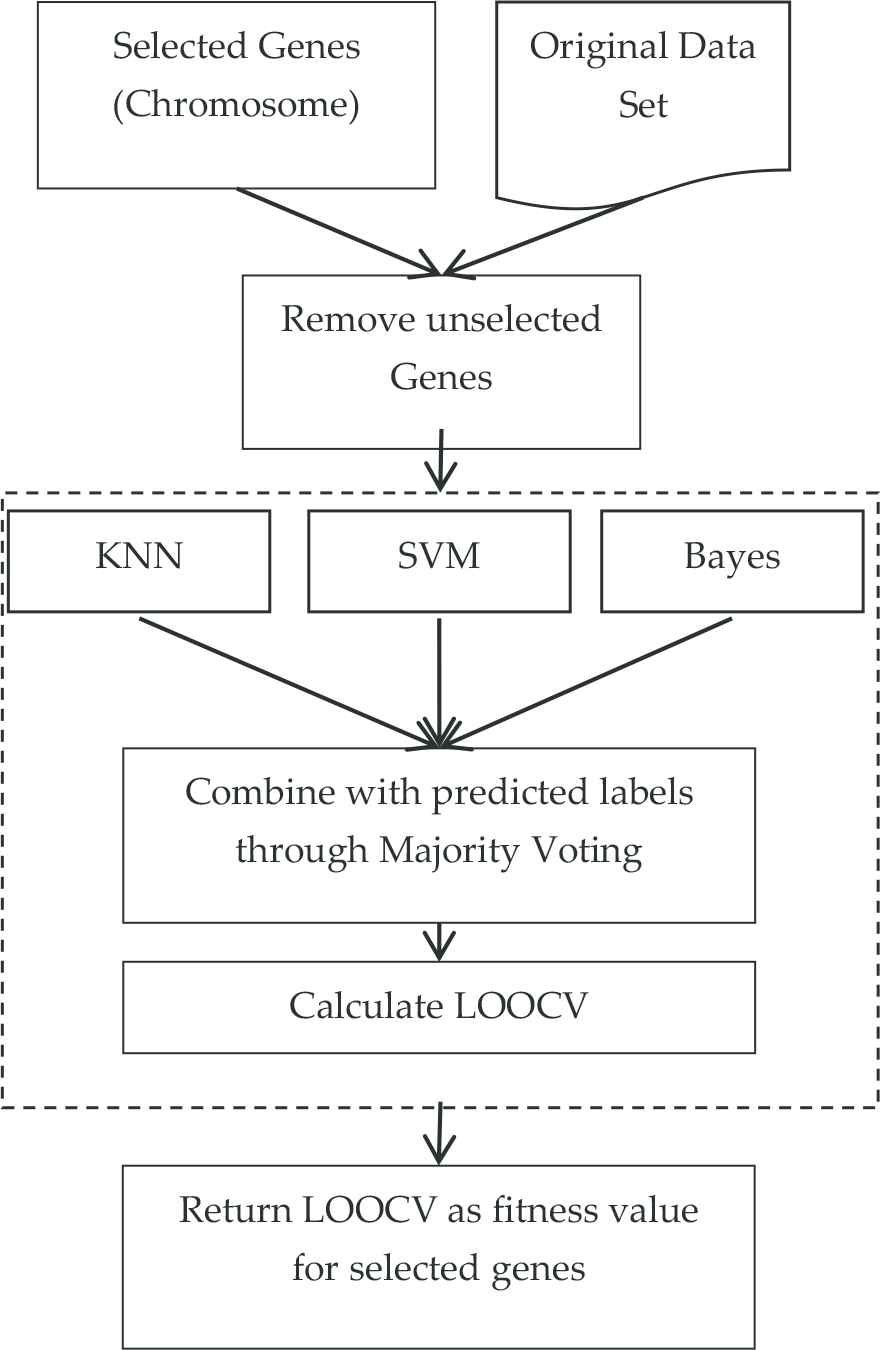
Flowchart of ensemble classifier incalculation of fitness value (leave one out cross validation [LOOCV]) for selected genes.
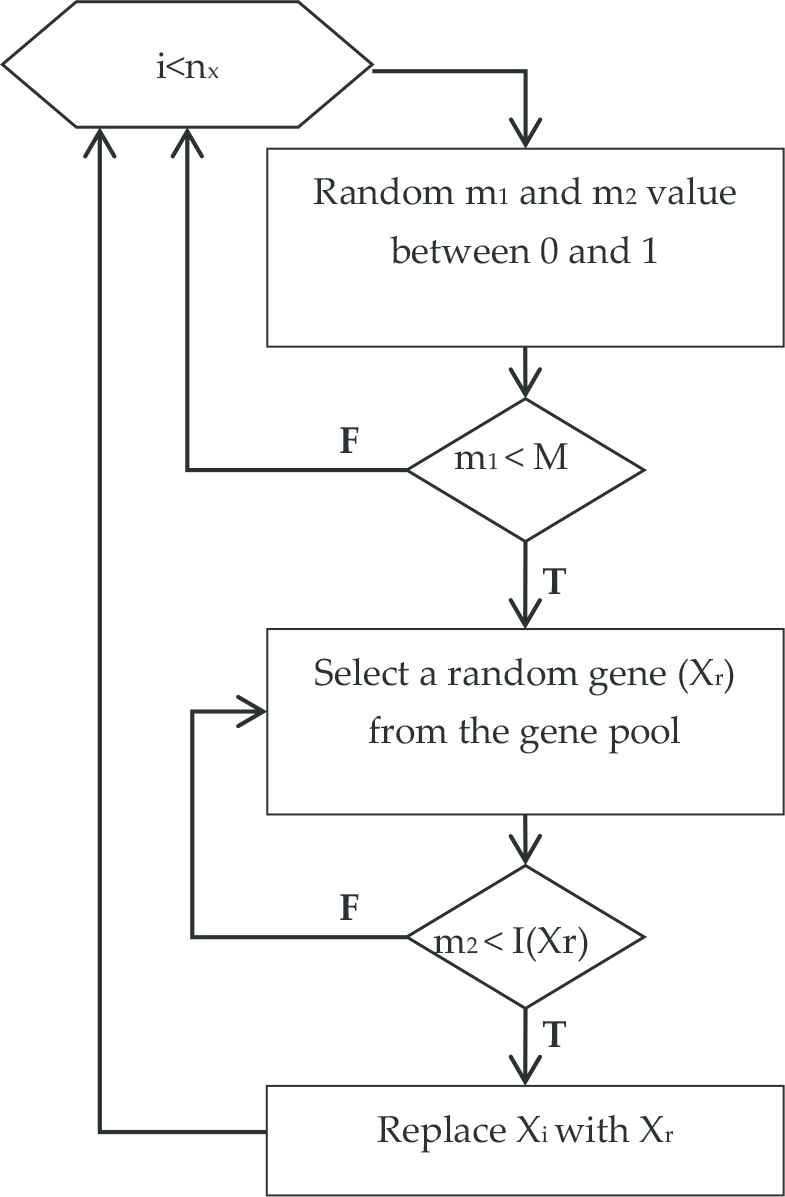
In the crossover step of the GA, the roulette wheel method was used for parent chromosome selection. Thanks to this, chromosomes with high fitness values which were computed in the previous step can transfer their genes to the next generation. As a result, the probability of obtaining more successful child chromosomes due to the crossover process is increased. The crossover process takes place at various places. Meanwhile, new child chromosomes are obtained by transferring random number of genes among chromosomes. As mentioned before, genes with different significance degrees can exist in the same gene pool due to the fact that genes at different amounts are unified by numerous filter algorithms. While using the mutation operator, the purpose was to mutate the genes with high significance degree at a lower amount and to replace the mutated genes with genes with higher significance degree. To that end, the mutation steps provided in Figure 4 was created.
Mutation step in the genetic algorithm.
M shown in Figure 4 stands for mutation rate, nx stands for the total number of genes inside a chromosome, Xi stands for a gene inside a chromosome, and Xr stands for a random gene from the gene pool. The I function was given in Equation (8). After the loop works for each gene in the population, the mutation step is completed.
After the mutation step, the fitness values of all chromosomes in the population are computed again. The iteration is completed by transferring the most successful chromosomes to the next generation. These steps are repeated until the desired fitness value or total iteration number was reached. The pseudo code of the proposed approach is presented in Algorithm 1.
Algorithm 1: Pseudocode for the proposed approach
1: Filtering
2: Grade all the genes separately through FCS, WRS and IG
3: Create new subsets that have different gene counts (2,3‥10,20‥100,200) for each algorithm
4: Calculate success rate of the subsets through KNN
5: Select the most successful subsets for each filter algorithm,
6: Calculate Significance Degrees of each genes by using Equation (8)
7: Combine the three subsets into a new dataset and remove the unselected genes
8: Representation
9: Consider genes selected and combined in the first step as Gene Pool (Solution Domain)
10: Using permutation encoding use the order of these genes in the genes of the GA (Figure 2)
11 Define Ng (gene count to be selected), Nc (population count)
12: Create chromosomes with randomly selected Ng genes in the pool
13: Create a population includes Nc chromosomes
14: Calculation of The Fitness Values
15: Do
16: For each C chromosome in the population
17: Retrieve the samples from the original data set
18: Use only genes that matched with the gene orders in the chromosome
19: Do
20: For each S sample in the data set
21: Take S apart from the data set and reserve the rest for training
22: Classify S as ALL or AML separately through each algorithm (KNN, SVM, Bayes)
23: IF the number of ALL > 1 THEN the final decision is ALL ELSE the final decision is AML
24: Compare the classification result with expected result
25: Fitness value of C chromosome = successful classification counts / total sample count
26: Selection and Cross Over Step
27: Select two parent chromosome as P1 and P2 in the population with using roulette wheel approach
28: Do
29: For each X gene in P1
30: Generate c1 between 0 and 1
31: IF c1> CR (Cross over Rate) THEN exchange X gene with the gene which is the same order in the P2 parent chromosome
32: Mutation Step
33: Do
34 For each X gene in the C chromosome
35: Generate m1 between 0 and 1
36: IF m1< M (Mutation Rate)
37: THEN
38: Select random gene as Xr from the gene pool
39: Generate m2 between 0 and 1
40: IF m2< I(Xr) THEN replace X gene with Xr ELSE go to 38
41: ELSE continue For loop in 34.
42: Evaluation Step
43: Calculate Fitness values of chromosomes as in 14
44: Select Top 20 chromosome for the next generation
45: IF fitness value or total iteration count reached expected values THEN End ELSE go to 26
4. RESULTS
The model developed was coded on Visual Studio 2017 platform using C# programming language. The test processes were performed on a computer running on Intel i7-2670QM processor at 2.20 Ghz with 8 GB of RAM. Leukemia data set was used to assess the performance of the developed model. This data set contains data related to tissue types taken from patients who were diagnosed with two types of leukemia cancer [3]. Among a total of 72 different samples, there are two distinct class data as well as 7129 gene expression values of acute myeloid leukemia (AML) and acute lymphoblastic leukemia (ALL) patients. In this section, performance values, comparisons with similar studies in the literature, and biological significance of the findings obtained are provided, respectively.
4.1. Performance Values
In the first step, the genes that the ensemble gene filter algorithm chooses are obtained by the gene grading of Fisher, WRS, and IG algorithms. Gene-subsets with the highest classification performance are selected by making gene selection processes at different numbers. At this step, the graphic of LOOCV value that the gene filter algorithms obtain through KNN according to different gene numbers is presented in Figure 5. In Table 1, the best 15 performances obtained are shown.
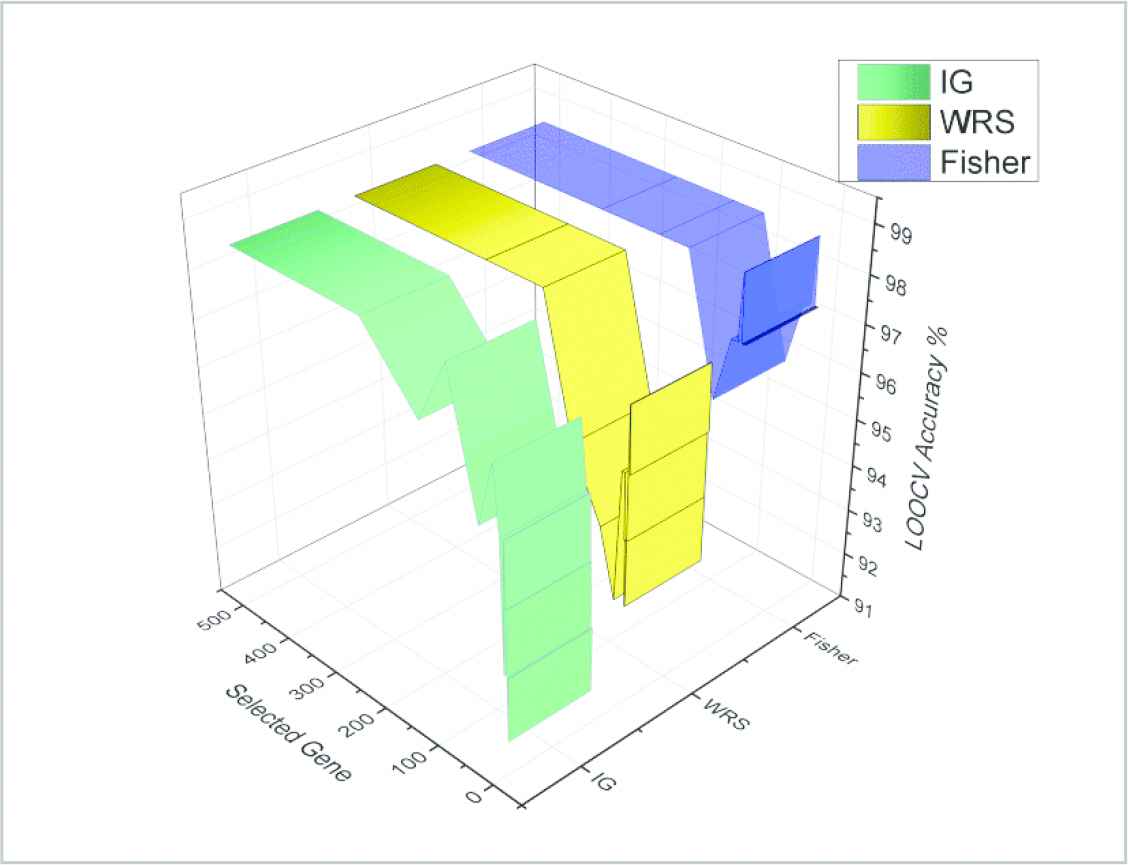
Classification accuracy (leave one out cross validation [LOOCV]) chart of the three gene filter algorithm.
| Filter | LOOCV | Selected Genes | AUC | Time | 5-Fold | 10-Fold |
|---|---|---|---|---|---|---|
| Fisher | 98.61 | 9 | 0.98 | 6 | 98.57 | 98.57 |
| Fisher | 98.61 | 10 | 0.98 | 7 | 98.57 | 98.57 |
| IG | 98.61 | 100 | 0.98 | 56 | 97.24 | 98.57 |
| Fisher | 98.61 | 100 | 0.98 | 56 | 98.57 | 98.57 |
| WRS | 98.61 | 150 | 0.98 | 87 | 98.57 | 98.57 |
| Fisher | 98.61 | 150 | 0.98 | 83 | 98.57 | 98.57 |
| IG | 98.61 | 250 | 0.98 | 141 | 98.57 | 98.57 |
| WRS | 98.61 | 250 | 0.98 | 140 | 98.57 | 98.57 |
| Fisher | 98.61 | 250 | 0.98 | 140 | 98.57 | 98.57 |
| IG | 98.61 | 500 | 0.98 | 288 | 97.14 | 98.57 |
| WRS | 98.61 | 500 | 0.98 | 281 | 98.57 | 98.57 |
| Fisher | 98.61 | 500 | 0.98 | 287 | 98.57 | 98.57 |
| Fisher | 97.22 | 2 | 0.97 | 2 | 97.14 | 97.14 |
| WRS | 97.22 | 3 | 0.97 | 3 | 95.81 | 97.14 |
| Fisher | 97.22 | 3 | 0.97 | 3 | 97.14 | 97.14 |
LOOCV, leave one out cross validation; IG, information gain; WRS, Wilcoxon rank sum; AUC, Area under the curve.
Best 15 performance values of the three gene filter algorithm.
When the obtained LOOCV graphic is studied, although all the filter algorithms show a decreasing attitude if the number of genes decrease, it is seen that the Fisher algorithm shows better results than others if the selection of genes is less than 10. When the best 15 performance values that were obtained according to different gene numbers are studied, it can be seen that the Fisher algorithm can return the value of 98.61 LOOCV with only 9 genes while the IG algorithm returns the same success rate with 100 genes and WRS returns the same success rate with 150 genes. In parallel to the decrease in the number of genes selected, the change in the duration for classification should also be taken into consideration. While the mean duration of classification process with 500 genes was 285.3 ms, the classification processes that were made with 9 selected genes by the Fisher algorithm were made in only 6 ms, a very short period of time. When the fact that elapsed time was 4000 ms with 7200 genes for the classification process of the original data set was taken into consideration, the contribution of gene selection to the deduction of the computation cost can be seen easily. In order to both have the best classification success and to reduce the computation cost and duration, a second step in which fewer genes are selected is needed. To that end, these genes that were obtained by three algorithms are combined into an ensemble gene through a filter algorithm by computing their level of significance. Thus, a new data set consisting of 259 genes was obtained. Later, this new data set was submitted into the input of the GA that works on the second step. The classification process was done through KNN algorithm by using the genes that were determined by the GA. The data set was divided into two parts as 80% training part and 20% test part in order to measure the classification success. For a detailed review of the classification performance, LOOCV, k5-fold, and k10-fold cross validation processes were performed, just as in the first step. The mutation rate of the GA's initial parameters was determined as 0.09, while the crossover rate was determined as 0.35. The population number of the GA was determined as 20 so that sufficient amount of different solution sets can be studied. The halting criteria was determined as conditions of 1000 iterations or of reaching 100% fitness value. Mean values were taken after repeating gene selection, classification, and cross validation processes through GA 100 times. The results obtained were presented in Table 2.
| Selected Genes | Test ACC | Test AUC | LOOCV | LOOCV AUC | 5-Fold | 10-Fold |
|---|---|---|---|---|---|---|
| 5 | 100 | 1 | 100 | 1 | 98.57 | 97.14 |
| 4 | 100 | 1 | 100 | 1 | 97.33 | 97.32 |
| 3 | 100 | 1 | 100 | 1 | 98.64 | 99.15 |
| 2 | 100 | 1 | 100 | 1 | 98.57 | 97.14 |
LOOCV, leave one out cross validation; GA, genetic algorithm; KNN, K nearest neighbor; ACC, Accuracy.
GA/KNN test and cross validation results.
While the highest success rate could be obtained at 98.61 in the first step, this rate raised to 100% thanks to the genes that were selected by the developed algorithm.
Moreover, obtaining this success rate with less genes provided a significant gain in the computation cost and duration (approximately 2.5 ms for 2 and 3 genes). As a result, although the optimum gene number/performance value was obtained for 2 genes, it can be easily understood that selected three genes yield better results when cross validations are taken into account. The halting condition of the GA when it reaches 1000 iteration never occurred since the fitness value of the selected genes reaches 100% at previous iterations. It was observed that the maximum iteration number was 845, minimum iteration number was 1 and mean iteration number was 173.95.
Cross validation values that were obtained for 100 different gene selections were shown on boxplot in Figure 6 so that they can be studied in detail. When the new data set that was created by selecting three genes is transferred on a 3-dimensional distribution graphic (Figure 7), the contribution to the differentiation of ALL and AML cancers samples can be observed. On the graphic, each shape represents a sample x-axis, y-axis, and z-axis represent normalized expression value of the 1st, 2nd, and 3rd genes, respectively.
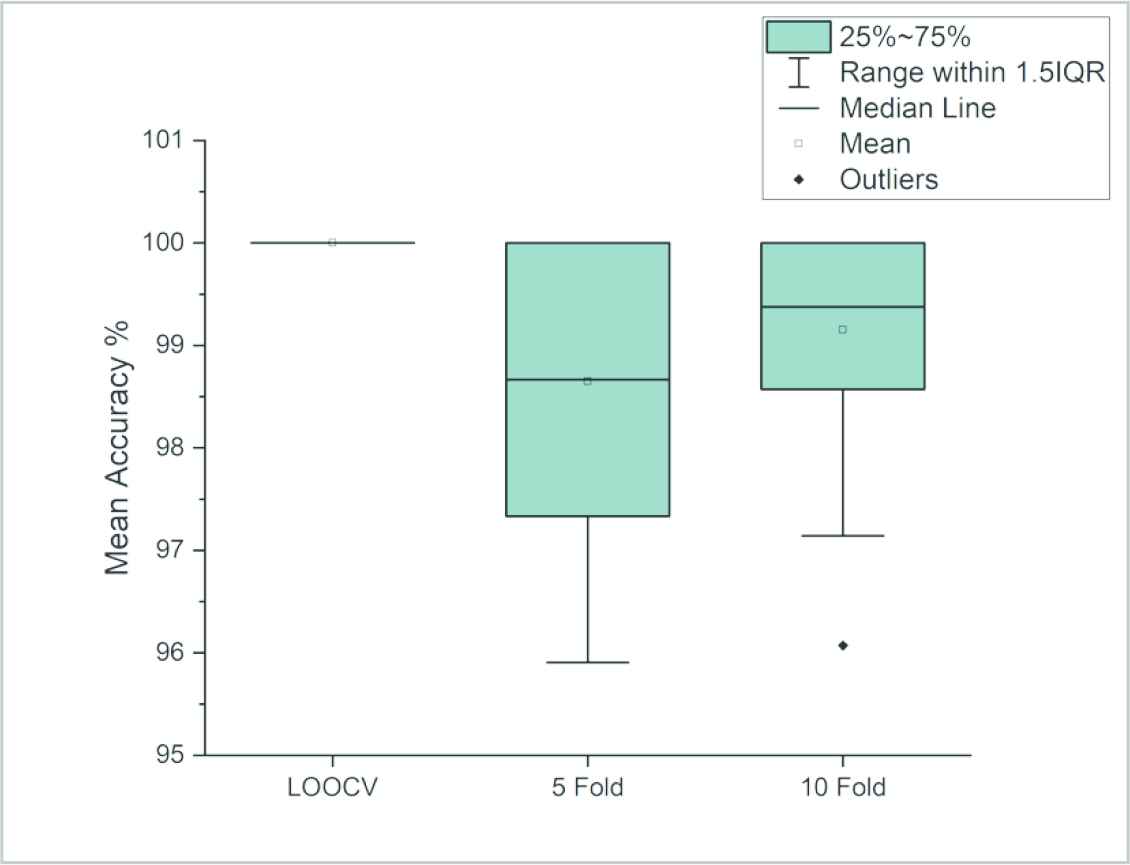
Boxplots for cross validation on 3 genes.
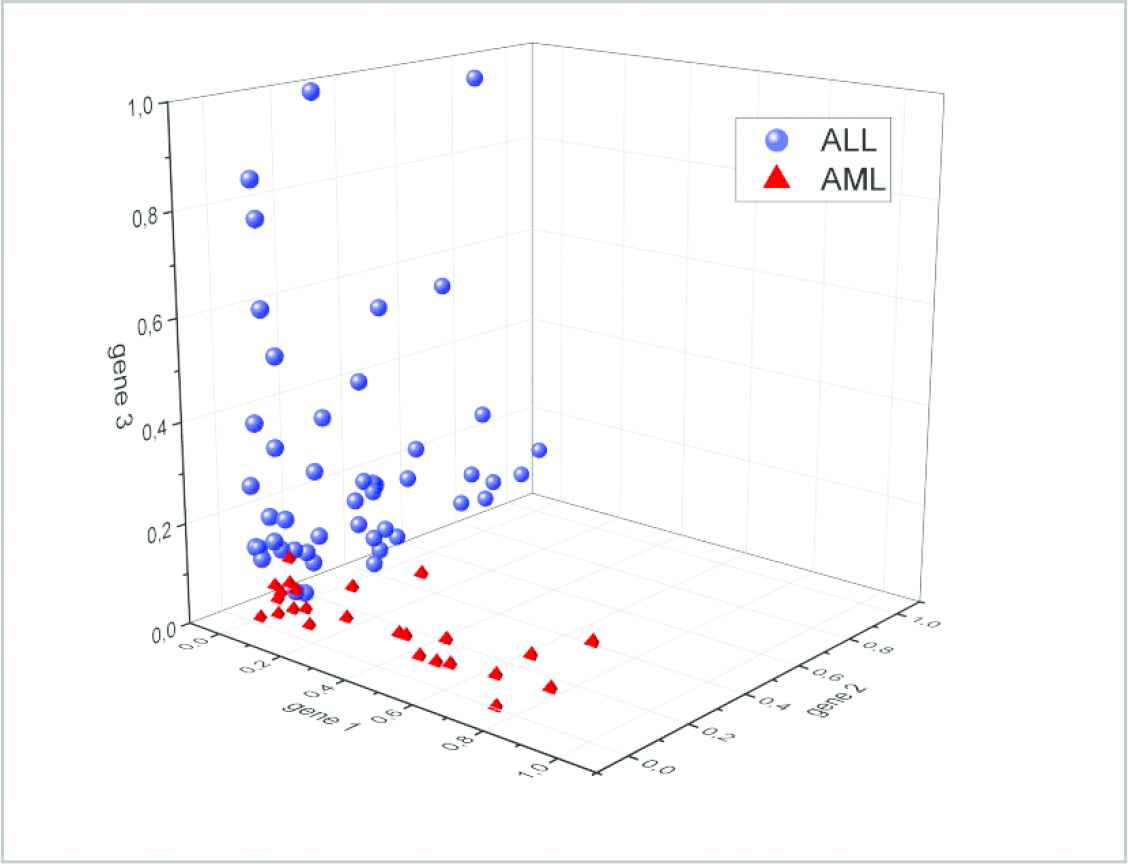
Selected genes in scatter plot.
As a result of the gene selection processes that were made by the developed model, KNN was preferred due to the fact that it is a fast and successful algorithm to classify Leukemia data set. Furthermore, the selected genes were tested with other types of classification algorithms in addition to KNN in order to control whether the developed model is independent from classification algorithms. All the obtained results are presented in Table 3. after computing the Kappa and root mean square error (RMSE) values of the classification processes. When the results are studied, it is seen that KNN, SVM, and ANN return the same classification success and AUC value while other algorithms provide similar results. When the KAPPA value is studied, it can be uttered that all the algorithms are over 0.75, which is a critical value for kappa, and therefore they perform a successful classification process. Finally, when the RMSE values are studied, it is observed that all the algorithms obtain an acceptable error value. As a result, that the selected genes have successful results along with different classification algorithms sets forth the fact that the developed approach is independent from classifier. The ensemble classifier in the developed approach was also compared with individual algorithms and the results obtained after selecting three genes were given in Table 4. The results show that ensemble classifier achieves more successful results than 3 separate algorithms.
| Classifier | Acc. % | AUC | Kappa | RMSE |
|---|---|---|---|---|
| KNN | 98.57 | 1 | 0.967 | 0.085 |
| SVM | 98.57 | 1 | 0.967 | 0.215 |
| Naive Bayes | 97.14 | 0.996 | 0.935 | 0.125 |
| Linear regression | 94.38 | 1 | 0.872 | 0.643 |
| ANN | 98.57 | 1 | 0.967 | 0.129 |
| Random forest | 95.90 | 0.991 | 0.912 | 0.150 |
KNN, K nearest neighbor; SVM, support vector machine; RMSE, root mean square error; ANN, Artificial Neural Network.
Performance values obtained from KNN and different classifiers (5-fold).
| Algorithm | LOOCV ACC | LOOCV AUC | 5-Fold | 10-Fold |
|---|---|---|---|---|
| KNN | 98.61 | 0.980 | 98.57 | 98.57 |
| SVM | 98.61 | 0.989 | 97.14 | 97.14 |
| Bayes | 95.83 | 0.968 | 98.57 | 98.57 |
| Ensemble | 100 | 1 | 98.64 | 99.15 |
KNN, K nearest neighbor; SVM, support vector machine.
Comprasion of cross validation results of ensemble and three individual algorithm.
4.2. Performance Comparison
The developed approach deployed only two genes and while it provides a higher test classification success with a smaller number of genes than most of the methods provided in the literature for classifying Leukemia data set, it obtained the same test values with GALA [31] and Eu [20] algorithms. When the LOOCV values provided in the literature are studied, it can be understood in Table 5. that the developed approach obtained the most successful performance with the lowest number of genes. When the 5-fold data is studied, although the developed approach is more successful than most approaches in the literature, only MBPSO [32] algorithm had a better score. Despite a comparison was attempted for 10-fold, only one study in the literature provides this value. In this study, while 100% 10-fold value was obtained with 10 genes using the MSFCM+WNN [33] algorithm, this percentage is 97.14% with 2 genes and 99.15 with 3 genes using the developed approach.
| Methods | Selected Genes | Test ACC. | LOOCV | 5-Fold | 10-Fold |
|---|---|---|---|---|---|
| GALA [31] | 2 | 100 | – | – | – |
| Eu [20] | 2 | 100 | – | – | – |
| GBC [34] | 4 | 100 | – | – | – |
| IBPSO [35] | 4 | 100 | – | – | – |
| E1 [20] | 12 | 100 | – | – | – |
| SLLE-SC2 [36] | 5 | 99.70 | – | – | – |
| M-SVM [37] | 7 | 98.82 | – | – | – |
| PSO + Adaptive KNN [16] | 3 | 97.06 | – | 95.89 | – |
| IG-SGA [38] | 3 | 97.06 | – | – | – |
| SVM+RFE [39] | 4 | 97.06 | – | – | – |
| SMMDA/KNN [40] | 8 | 96.88 | – | – | – |
| Bagboost [41] | 200 | 95.92 | – | – | – |
| HPSO TS [42] | 7 | 95.81 | – | – | – |
| SLR [43] | 7 | 95.51 | – | – | – |
| Pure TS [42] | 5 | 94.24 | – | – | – |
| AEN-CMI [44] | 26.85 | 91.05 | – | – | – |
| GA/SVM [45] | 6 | – | 100 | – | – |
| GA/SVM [46] | 7 | – | 100 | – | – |
| MMACO/SVM [47] | 6,3 | – | 100 | – | – |
| ACO/SVM [47] | 8,6 | – | 100 | – | – |
| SNR/SVM [47] | 100 | – | 100 | – | – |
| IG+GA/KNN [48] | 203 | – | 100 | – | – |
| GS2/KNN [49] | 10/85 | – | 98.60 | 97.10 | – |
| GS1/KNN [49] | 60/100 | – | 98.60 | 97.90 | – |
| SVM [50] | 500 | – | 94.10 | – | – |
| MBPSO [32] | 2 | – | – | 100 | |
| MSFCM+WNN [33] | 10 | – | – | – | 100 |
| GSA [51] | 10 | – | – | 100 | – |
| SWKC [52] | 14.2 | – | – | (3Fold) 98.20 | – |
| Proposed approach | 2 | 100 | 100 | 98.57 | 97.14 |
| 3 | 100 | 100 | 98.64 | 99.15 |
KNN, K nearest neighbor; SVM, support vector machine; IG, information gain.
Comparison of the proposed approach for leukemia dataset with previous methods in the literature.
4.3. Biological Significance
Revealing gene-cancer and gene–gene relationship has a significant role in cancer studies. Therefore, it was attempted to confirm the relationship between these genes and cancer by studying the biological basics of the genes which are successful at differentiating ALL and AML diseases—types of Leukemia—through the developed approach.
The genes that the developed approach selects the most at the end of one hundred iterations as well as the selection frequencies are provided in Figure 8. In order to examine the gene expression values that belong to different samples of the most selected genes, a heat map of these genes was created (Figure 9). While creating this heat map, average linkage was used as clustering method and Euclidian was used as distance measurement. When the heat map is studied, it can clearly be seen that the selected genes have different expression levels on ALL and AML samples and that this condition is vital in differentiating these two diseases. Thanks to the matchings on the top section of the heat map, the correlation values among the genes can also be studied.
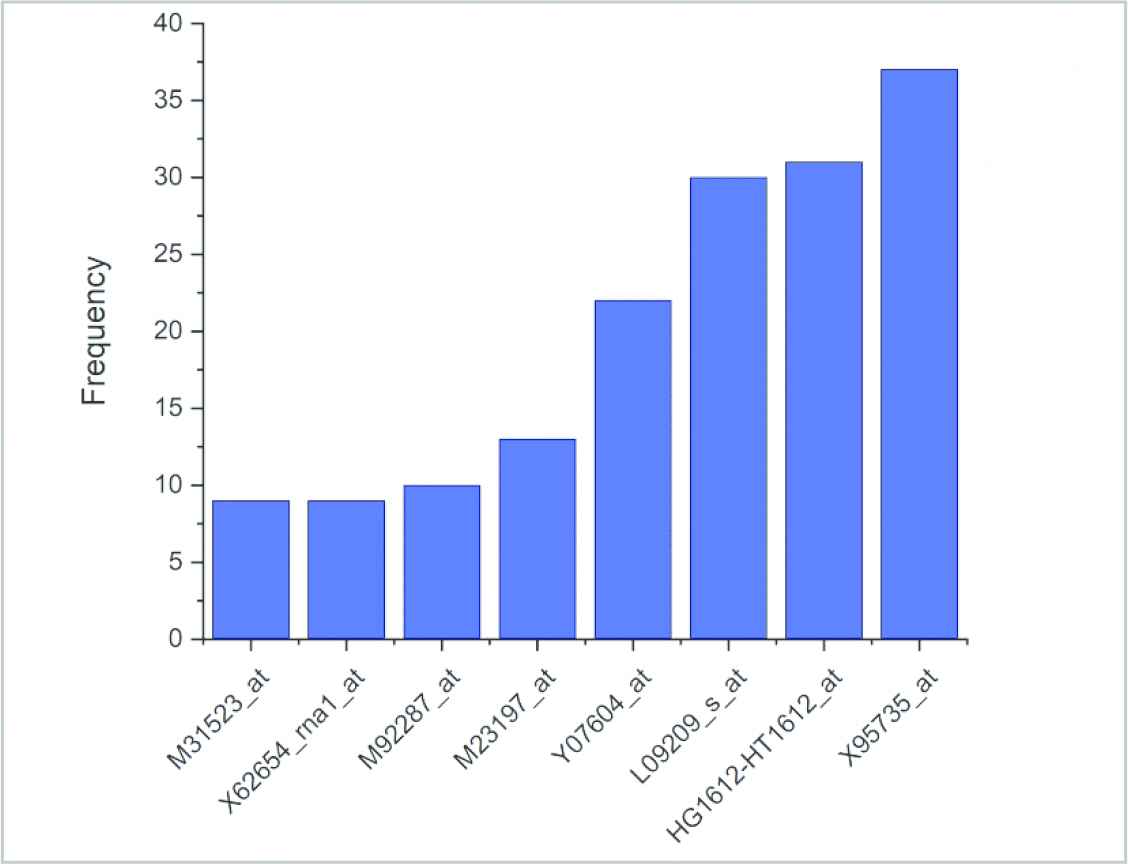
Frequency of most selected genes after 100 repeats.
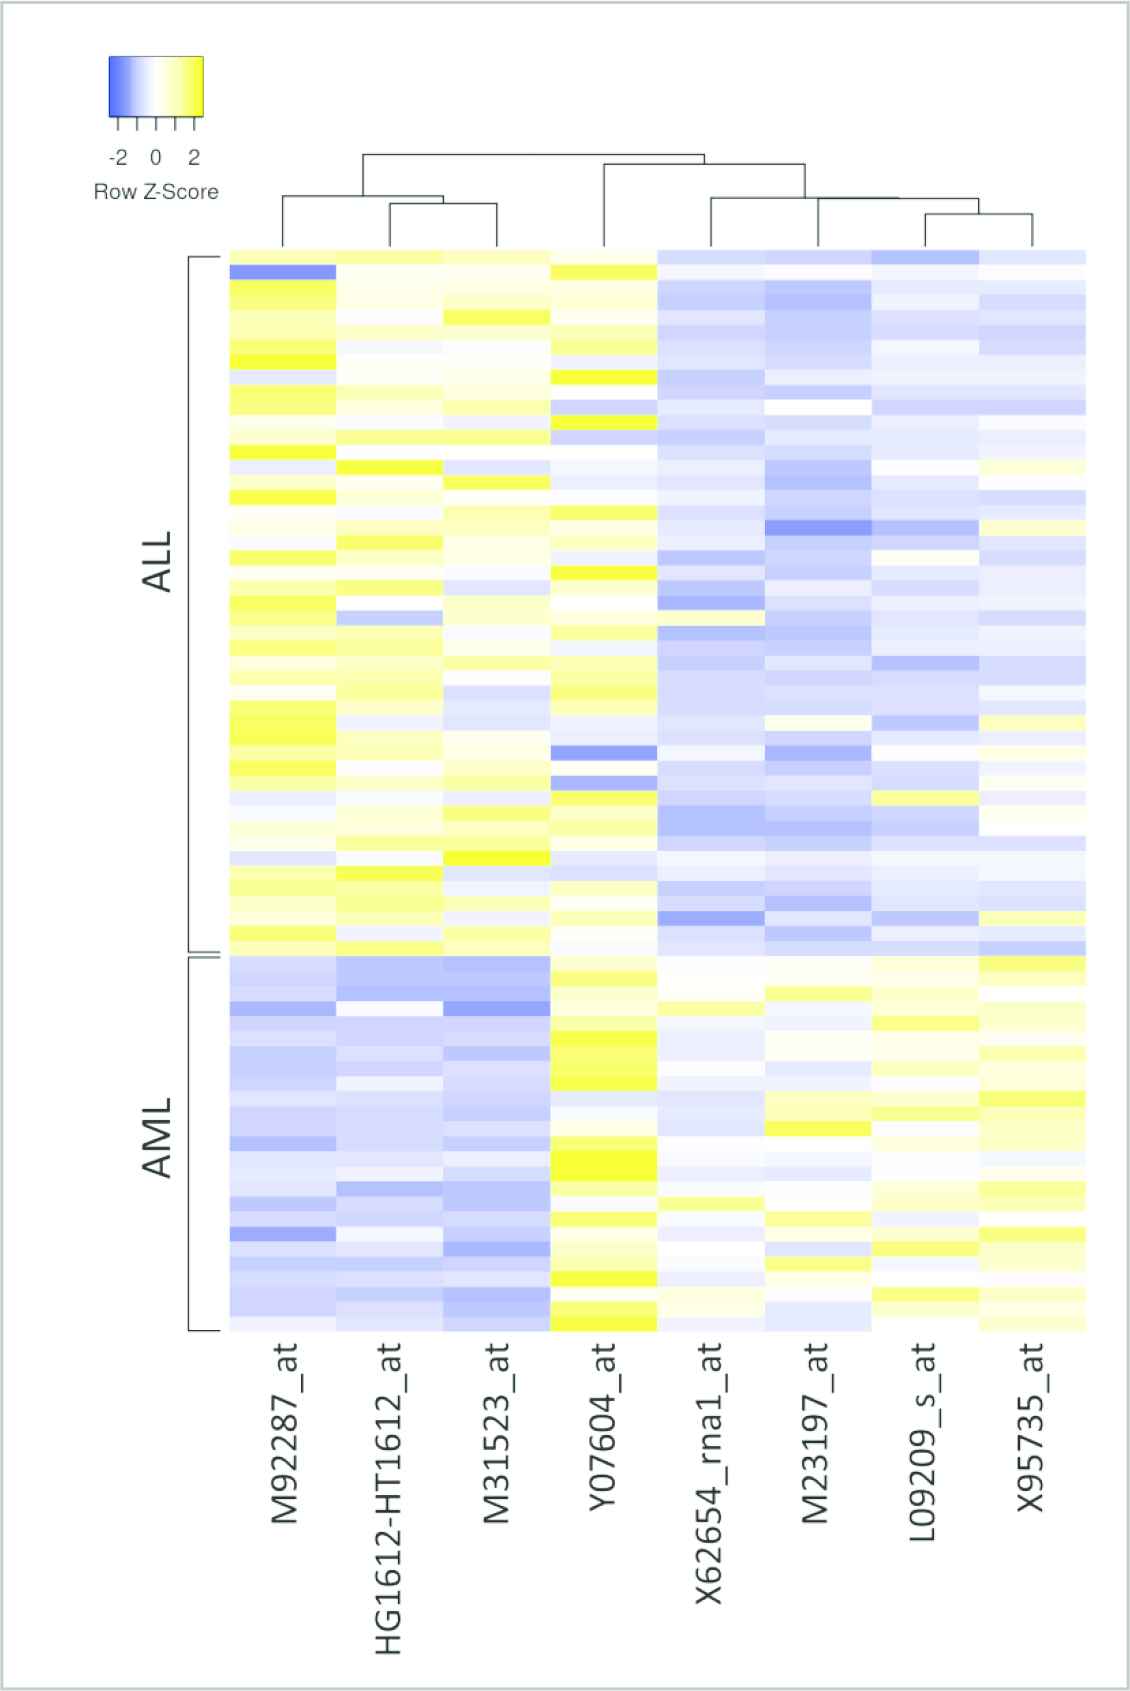
Leukemia heatmap for most selected 8 genes.
The real names of the genes that are selected the most were taken from the gene names database of HUGO Gene Nomenclature Committee at the European Bioinformatics Institute [53] and the information concerning the functions of the genes was taken from the database of Gene Ontology Annotation of European Bioinformatics Institute [54]. The information obtained was merged and presented in Table 6. ZYX gene was qualified as an oncogene in the previous studies and was associated with Leukemia cancer [3,55]. In their study, as a result of their findings, Vargova et al. [56]—by studying the MARCKSL gene—indicated that the gene is oncogenic and that it is a significant biomarker for lymphoma and leukemia. In various other studies, it was also shared that the MARCKSL gene is related to Leukemia [57–59]. Moreover, it was previously shared that the APLP2 gene shows an overexpression against cancer cells generally and that it is related to the increase in the number of tumor cells. Furthermore, it was previously mentioned that the genes in the APLP group have a significant role in the rise of cell migration of AML type Leukemia cells [60,61]. In their study, Kracmarova et al. [62] detected that the NME4 gene which has a high gene expression value is related to AML cancer at terminal levels and that this gene plays an important role in the rise of tumor levels of NME group genes. When the CD33 gene is studied, there are many scientific studies that target this gene for AML treatment [63–65]. In these studies, it was emphasized that expression values that belong to this gene were measured at 90% of AML patients. When the scientific works that were carried out for CCND3 gene are studied, it is understood that mutations that occur in this gene in many types of Leukemia are also seen here [66,67]. In their study stretching over 20 years, Lin et al. [68] confirmed that the gene rearrangements that occur in TCF3 gene have a positive contribution to the survival rate of ALL patients. In a study by Mirkowska et al. [69], it was observed that the CD63 gene has a high expression value in cells with ALL disease when compared to the healthy cells. As a result, it was also validated by the previously studies that all of the genes that are selected the most by the developed approach are oncogene and that they play an active role in the formation of Leukemia as well as in detecting and in treating it.
| Selected Gene | Symbol | Name | Functions |
|---|---|---|---|
| X95735_at | ZYX | Zyxin | RNA binding, metal ion binding, protein binding |
| HG1612-HT1612_at | MARCKSL1 | MARCKS like 1 | Actin binding, calmodulin binding, protein binding |
| L09209_s_at | APLP2 | Amyloid beta precursor-like protein 2 | Heparin binding, identical protein binding, protein binding, serine-type endopeptidase inhibitor activity, transition metal ion binding |
| Y07604_at | NME4 | NME/NM23 nucleoside diphosphate kinase 4 | ATP binding, cardiolipin binding, metal ion binding, nucleoside diphosphate kinase activity, protein binding |
| M23197_at | CD33 | CD33 molecule | Carbohydrate binding, protein binding, protein phosphatase binding, sialic acid binding, signaling receptor activity |
| M92287_at | CCND3 | Cyclin D3 | Cyclin-dependent protein serine/threonine kinase activity, cyclin-dependent protein serine/threonine kinase regulator activity, protein binding, contributes_to protein kinase activity, protein kinase binding, protein kinase binding |
| M31523_at | TCF3 | Transcription factor 3 | DNA binding, transcription factor activity, transcription repressor activity, E-box binding, RNA polymerase II proximal promoter sequence-specific DNA binding, bHLH transcription factor binding, enhancer binding, mitogen-activated protein kinase binding, protein binding, protein heterodimerization, protein homodimerization |
| X62654_rna1_at | CD63 | CD63 molecule | Protein binding |
Descriptions and functions of selected genes.
5. DISCUSSION
Micro array data have an indispensable role in cancer studies. The fact that micro array data have the expression values of thousands of genes provides a significant advantage in revealing the relationship between cancer and genes. However, in order to benefit from this advantage, cancer-related genes must be precisely selected from a huge pool of genes. At this point, gene filter approaches provide a fast solution. It is deduced that genes with high values are related to cancer by grading statistically significant genes through these methods. Then these genes are selected. At this step, genes with lower values but also related to cancer may be eliminated. By using ensemble methods and algorithms with different grading methods together, the selected gene pool can be enlarged in a way to cover all the significant genes. In this case, the number of selected genes and the possibility of genes with less significance to be selected increase. As a result of this, noise can emerge, and this can negatively affect the classification success in the data set. In order to overcome this hindrance, although wrapper approaches are recommended as a second step, undesired genes in the data set as well as the data set size have a negative effect on the success of these approaches. To solve this problem, different from previous studies, a computation of significance degree for the selected genes in the first step was suggested. It was made possible for the GA used for the wrapper approach in the second step to make a mutation process by taking the significance degree into account while analyzing the solution set. Therefore, it was made possible for the classification success to be obtained with fewer genes by minimizing the noise and for the GA to reach the result with fewer process steps. The GA suggested in the study completed the gene selection processes at 100% success rate through 173.95 mean iterations.
Another point that this study focuses is to determine the fitness function of GA. Determining the fitness function has a critical place in the success of gene selection process. A fitness function that cannot measure the significance of the genes cannot carry out a successful gene selection process. Classification success that is obtained by only one classification algorithm is widely used in computing the fitness value of GA. This method where only test process is carried out may also often face the overtraining problem of the classification algorithm Two different processes were made to overcome this problem. Initially, rather than using one single classification algorithm, an ensemble classification algorithm made up of KNN, SVM, and Naive Bayes algorithms was deployed while computing the fitness value. The success of this algorithm that estimate classification by majority voting was used in computing the fitness value. In the second place, LOOCV cross validation process was performed with the selected classification algorithm instead of one single test process. By this means, the developed algorithm was secured against the overtraining problem. Yet, it should be kept in mind that the suggested precautions increase the process cost on each iteration of GA.
6. CONCLUSIONS
In this study, a new hybrid and ensemble gene selection approach with an enhanced GA was proposed in order to select the most related genes to leukemia cancer and to classify cancer data by using these selected genes. Thanks to the developed algorithm, the genes with which leukemia cancer is associated are determined. These genes are ZYX, MARCKSL1, APLP2, NME4, CD33, CCND3, TCF3, and CD63. Additionally, the relationships between these genes were revealed and presented with a leukemia heatmap. In the classification process, AML and ALL types of leukemia cancer were classified with 100% success rate. When the proposed approach is compared to previous studies, it is seen that our study proves to be the most successful one with 100% LOOCV value by using only two genes.
In our study, a new equation was proposed to determine the importance of the genes selected in the filtering stage. The importance levels of the genes were used by the mutation operator; thus, the iteration number of the GA was reduced and by this way, the mutation operator was used more efficiently.
Due to the high-dimensional property, there is a challenging limitation in the micro array data, also known as the curse of dimensionality. This problem occurs while the number of attributes in each sample is too high and the total number of samples is insufficient. Besides that, it should be kept in mind that the gene selection processes that take a long time because more than one algorithm was used in the approach and also the study had an iterative structure.
Thanks to the developed approach, different cancer datasets with two class parameters can be classified, and gene–gene, cancer–gene relationships of different cancers can be revealed. Since the developed algorithms work with two classes, it performs in binary classification. In future studies, filtering methods can be enhanced to work in datasets with more than two classes, and new filtering approaches can be used in the ensemble approach.
CONFLICTS OF INTEREST
The authors declare that there is no conflict of interest.
AUTHORS' CONTRIBUTIONS
Mehmet BİLEN and Ali Hakan IŞIK designed the study, performed the experiments and wrote the paper. Tuncay YİĞİT reviewed and edited the manuscript. All authors read and approved the manuscript.
Funding Statement
The authors received no specific funding for this work.
ACKNOWLEDGMENTS
The authors are grateful to the reviewers for valuable comments that helped to improve the paper.
REFERENCES
Cite this article
TY  - JOUR
AU  - Mehmet Bilen
AU  - Ali H. Işik
AU  - Tuncay Yiğit
PY  - 2020
DA  - 2020/10/06
TI  - A New Hybrid and Ensemble Gene Selection Approach with an Enhanced Genetic Algorithm for Classification of Microarray Gene Expression Values on Leukemia Cancer
JO  - International Journal of Computational Intelligence Systems
SP  - 1554
EP  - 1566
VL  - 13
IS  - 1
SN  - 1875-6883
UR  - https://doi.org/10.2991/ijcis.d.200928.001
DO  - 10.2991/ijcis.d.200928.001
ID  - Bilen2020
ER  -