
A Learning-Based Framework for Identifying MicroRNA Regulatory Module

- DOI
- 10.2991/ijcis.d.201009.001How to use a DOI?
- Keywords
- MicroRNA regulatory module; Convolutional autoencoder; K-means; MicroRNA-target interaction
- Abstract
Accurate identification of microRNA regulatory modules can give insights to understand microRNA synergistical regulatory mechanism. However, the identification accuracy suffers from incomplete biological data. In this paper, we proposed a learning-based framework called MicroRNA regulatory module dentification with Convolutional Autoencoders (MICA). Firstly, the framework applied convolutional autoencoders to extract significant features of microRNA and their target-genes. Then they were clustered into microRNA clusters and target-gene clusters. Finally, the two types of clusters were combined into modules by known microRNA–target interactions. Compared with three existing methods on three cancer data sets, the modules detected by the proposed method exhibited better overall performance.
- Copyright
- © 2020 The Authors. Published by Atlantis Press B.V.
- Open Access
- This is an open access article distributed under the CC BY-NC 4.0 license (http://creativecommons.org/licenses/by-nc/4.0/).
1. INTRODUCTION
MicroRNAs (miRNAs) are ~22 nt small noncoding RNAs [1]. Binding to the target messenger RNAs (mRNAs), miRNAs contribute to the degradation and translational inhibition of mRNAs [2]. A growing body of literature show that multiple miRNAs (miRNA groups) collectively regulate one or more target-genes (mRNA groups) in a variety of cancer-related processes such as cell apoptosis, proliferation, and metastasis [3]. A miRNA regulatory module (MRM) consists of a group of miRNAs and their target genes [4], which plays a key role in cancer progression and prognosis [5–8]. The identification of MRMs is critical to elucidate the regulatory mechanism of miRNAs in complex cellular systems.
A number of relevant methods have been proposed to identify MRMs. Based on the formation of the relationship between miRNA groups and mRNA groups, these methods can be divided into expansion mode and association mode.
Expansion mode attaches more importance to miRNAs than target genes. Hence, it typically first obtains some miRNA clusters based on miRNA functional similarity or local structure information and then adds mRNAs to the clusters to form MRMs. For example, Mirsynergy [9] first obtains miRNA clusters by maximizing the synergism between two miRNAs, then expends the clusters by adding mRNAs based on the topological correlation between miRNAs and mRNAs. In our previous work, we proposed a computational framework called DeMine [10]. Firstly, the miRNA regulatory network is transformed into miRNA-miRNA synergistic network based on local structural information. Then, the miRNA clusters are detected by maximizing the cluster entropy density. Finally, each miRNA cluster is expanded by adding co-regulated target genes to form the final MRMs.
Association mode first obtains miRNA clusters and mRNA clusters by certain characteristics of miRNAs and mRNAs, respectively, and then combines them into final modules based on their biological relationship. For example, Jayaswal et al. applied K-medoids to cluster miRNAs/mRNAs according to microarray expression and then combined the two types of clusters to form modules [11]. Karim et al. developed a novel method Discovering Collective Group Relationships (DICORE ) that first obtains miRNA clusters and mRNA clusters according to their functional similarity, then associates them to form MRMs according to the correlative relationship between them [12].
The two types of methods generally use certain algorithms, such as Pearson correlation coefficient (PCC), LASSO [13], to predict miRNA-target relationships based on miRNA/mRNA expression profiles. However, the false-positive data in the used expression profiles affect the quality of miRNA-target predication, thereby the quality of the detected modules.
To solve the problem, we download and exploit some experimentally validated data to detect MRMs. More importantly, we propose a computational framework called MicroRNA regulatory module Identification with Convolutional Autoencoders (MICA) to detect miRNA regulatory modules. To reduce the impact of false positive data on modules quality, the framework applies convolutional autoencoder (CAE) to obtain significant features of miRNAs/mRNAs from their expression profiles. We test the proposed method on bladder cancer (BLCA), breast cancer (BRCA), and liver hepatocellular cancer (LIHC) data sets downloaded from The Cancer Genome Atlas (TCGA). Compared with expansion-based Mirsynergy, DeMine, and association-based DICORE, the quality of the modules detected by the proposed method is less affected by false-positive data, hence the detected modules exhibit better overall performance.
The remainder of this paper is organized as follows: We describe the proposed method in Section 2. The experiment data, result analysis, and comparison between the four methods are provided in Section 3. Finally, we conclude this paper in Section 4.
2. METHODS
In this section, we first give an overview of the proposed three-stage method, and then introduce each stage of the method in order: feature extraction based on CAE, miRNA/mRNA cluster detection, and MRM formation.
2.1. MICA Model Overview
Figure 1 depicts the workflow of MICA. Given the inputs of m/miRNA expression profiles, we perform MRM detection by the three-stage method. At stage 1, we apply CAE to obtain significant features of miRNAs/mRNAs from their expression profiles. At stage 2, we first utilize the elbow method to automatically determine the number of clusters K from the obtained features. We then employ K-means to cluster miRNAs and mRNAs from their obtained features, respectively. At stage 3, we first associate miRNA clusters and mRNA clusters according to the experimentally validated miRNA–target interactions (MTIs) to form MRMs. Finally, we filtrate the final MRMs with at least two miRNAs and mRNAs.
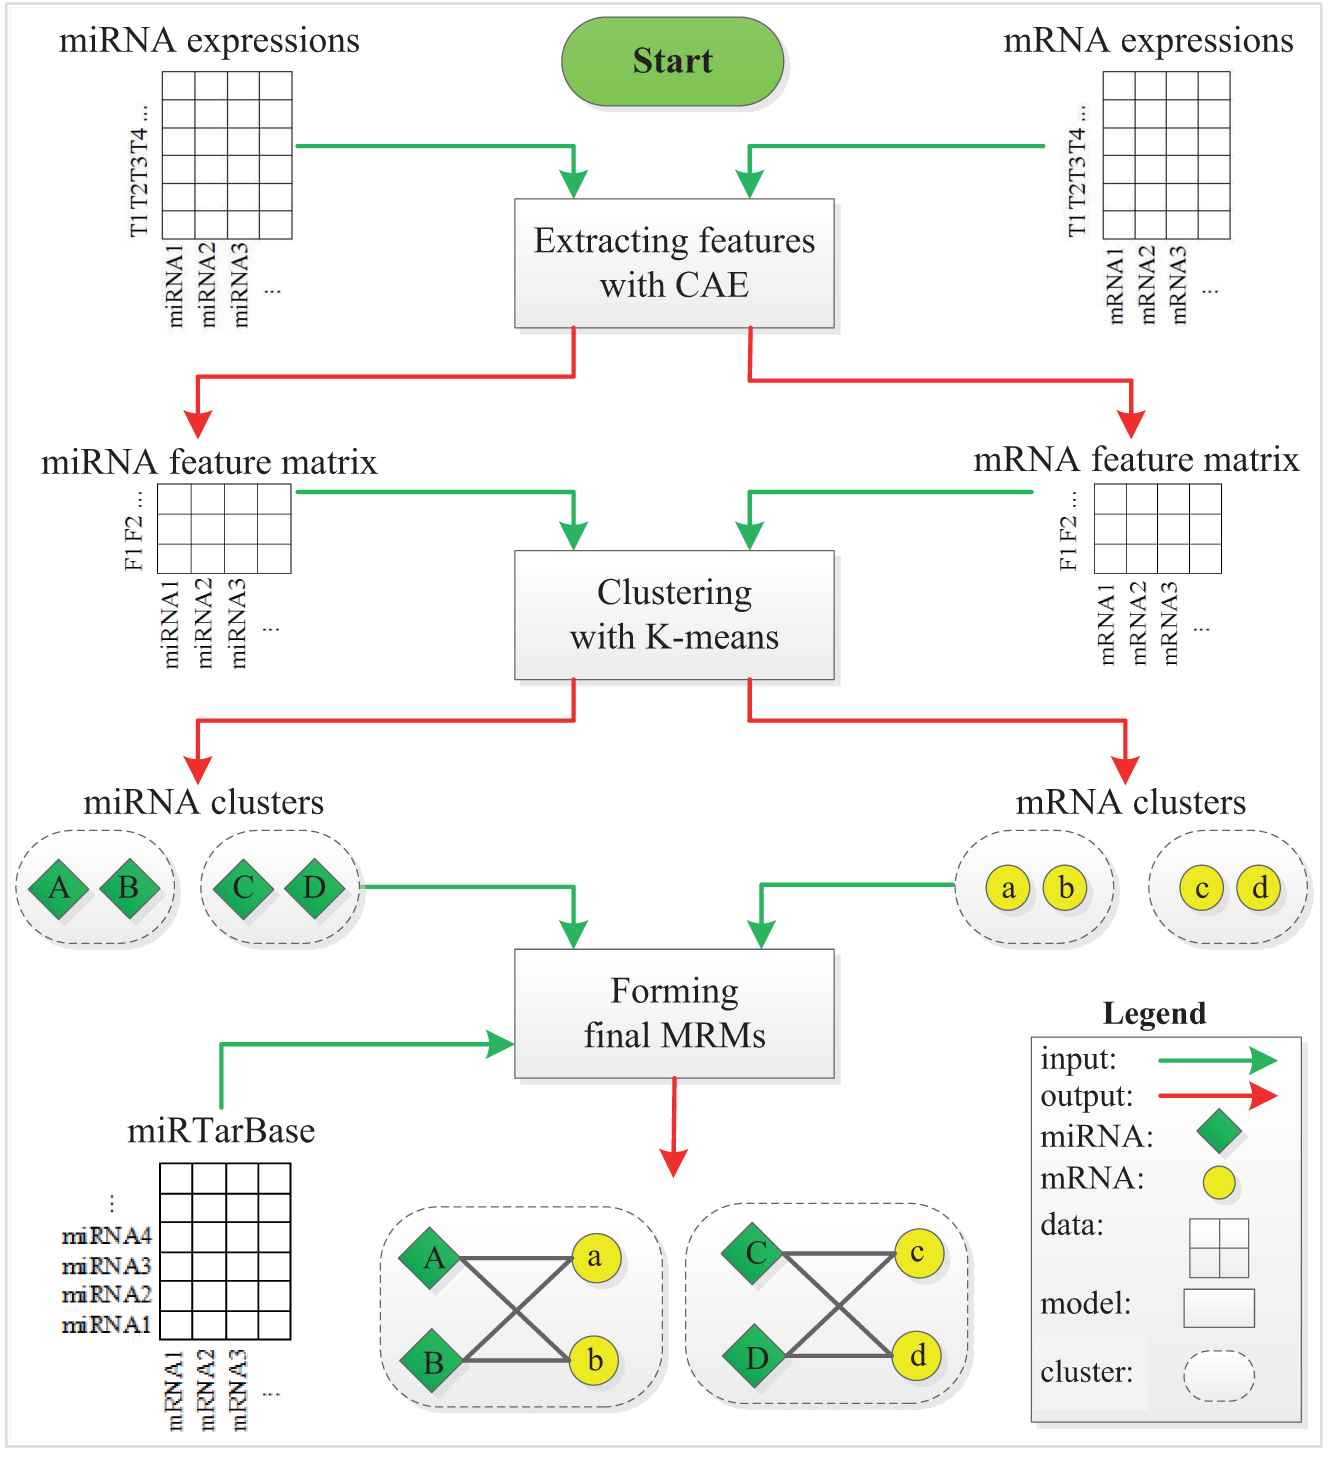
Illustration of MICA workflow.
2.2. Feature Extraction Based on CAE
CAE can aid to obtain the essential characteristics of objects and produce promising results by reducing data dimension and the impact of false-positive data. Hence, CAE has been widely used in various biomedical tasks such as tumor risk evaluation [14], histological image analysis [15], and miRNA-disease association identification [16].
In this work, both miRNA and target-gene expression profiles are high-dimensional imformation with false positives. It is not conducive to calculate and the accuracy of the results if the expression profiles are directly used for clustering. Hence, we employed CAEs to obtain the significant features of miRNAs/mRNAs from the expression data before clustering.
The structure of the proposed CAE model is shown in Figure 2, which consists of two convolution layers (kernel-size = 4 or 2), two max-pooling layers (pool-size = 4 or 2), and one fully connected layer. Convolutional layers are used to extract features from the input. Max-pooling layers are used for dimensionality reduction. The fully connected layer is used to obtain the final compressed representation of original profile data.
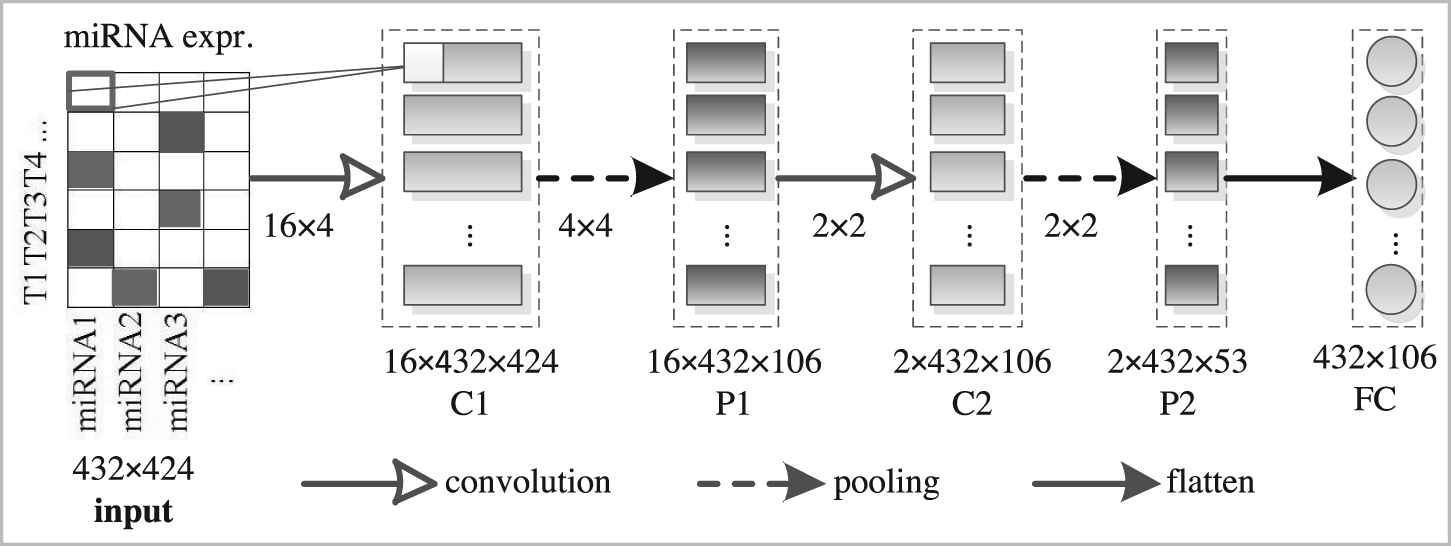
The architecture of the designed convolutional autoencoder model.
Taking miRNA expression profile as an example, we used a
It is worth to note that in the proposed network model, we used dropout strategy to reduce the possibility of over fitting and the impact of false positive data. Dropout is implemented by only keeping some neurons active with a certain probability (i.e., dropout_rate). Here, we set dropout_rate = 0.3. The parameters of the model were determined by balancing the accuracy of representation and the speed of calculation after many tries.
2.3. MiRNA/mRNA Cluster Detection
Due to the simple algorithm and high efficiency of processing big data, we employed K-means method to detect miRNA/mRNA clusters from their compact representation. Here, we take clustering miRNAs as an example. Our goal is to obtain a miRNA set
Accordingly, the SSE of K modules is defined as
The aim of our framework is to find an optimal partition of all miRNAs to obtain K clusters with the least SSE.
K-means algorithm requires a predefined number of clusters, which seems to be the biggest drawbacks of this algorithm. Moreover, no perfect mathematical criterion exists. A feasible method to choose the optimal number of clusters is to perform a sensitivity analysis on SSE of different K, such as elbow method [17], gap statistic [18], and jump method [19].
In this paper, we applied the elbow method to determine the optimal cluster number K. The principle of the method is based on the phenomenon that when K is smaller than the optimal number of clusters, the degree of aggregation of each cluster will greatly increase with the increase of K, thus SSE will decrease rapidly; on the other hand, when K is greater than the optimal numbers, the degree of aggregation of each cluster will increase slowly with the increase of K, thus SSE will decrease slowly. The relationship graph between SSE and K likes an elbow. The K corresponding to the elbow is the optimal number of clusters.
According to the above analysis, we applied Equation (3) to obtain candidate K,
Here, d represents the number of nodes after K. The larger d, the greater the changes of SSE before and after K. However, for the larger d, it is more difficult to find K satisfying Equation (3). In the paper, we set
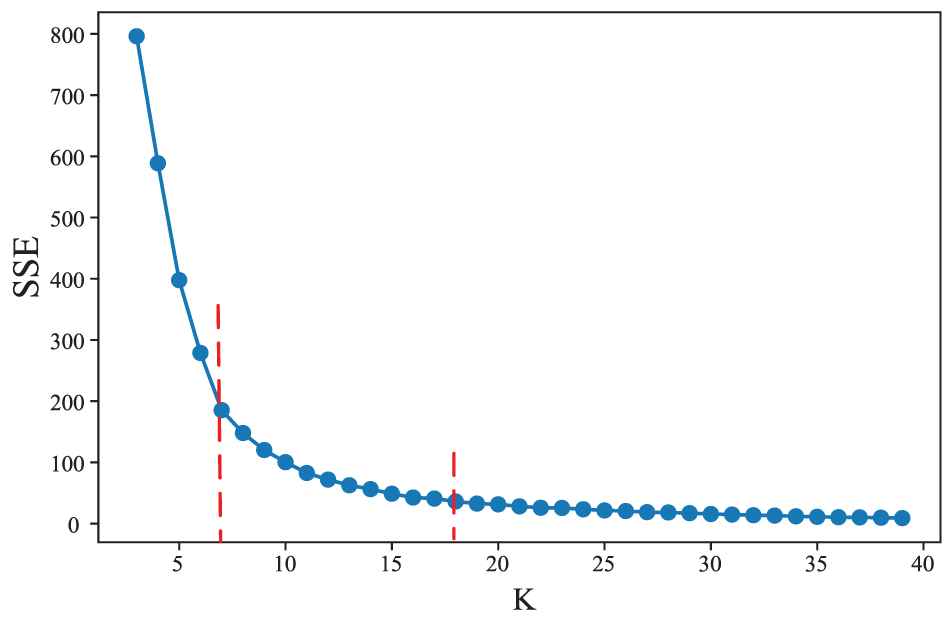
The relationship between sum of squared error (SSE) and the number of clusters K. SSE always decreases with an increase in the cluster number K. For some K, the change of SSE is significantly different before and after them. We choose K with the largest change as the optimal number of clusters.
According to this criterion, we obtained the best K values of 5 and 13 for BLCA and BRCA, respectively. We obtained some miRNA clusters by executing K-means clustering algorithm with the obtained K.
2.4. MRM Formation
After clustering miRNAs/mRNAs, we applied the miRNA regulatory interaction data from the miRTarBase [20] to combine the obtained miRNA clusters and mRNA clusters into miRNA regulatory modules. The candidate modules containing only one miRNA or target-gene were removed, because they were inconsistent with the mechanism of miRNAs co-regulating target mRNAs. For example, in Figure 4, the right miRNA-mRNA cluster is discarded.
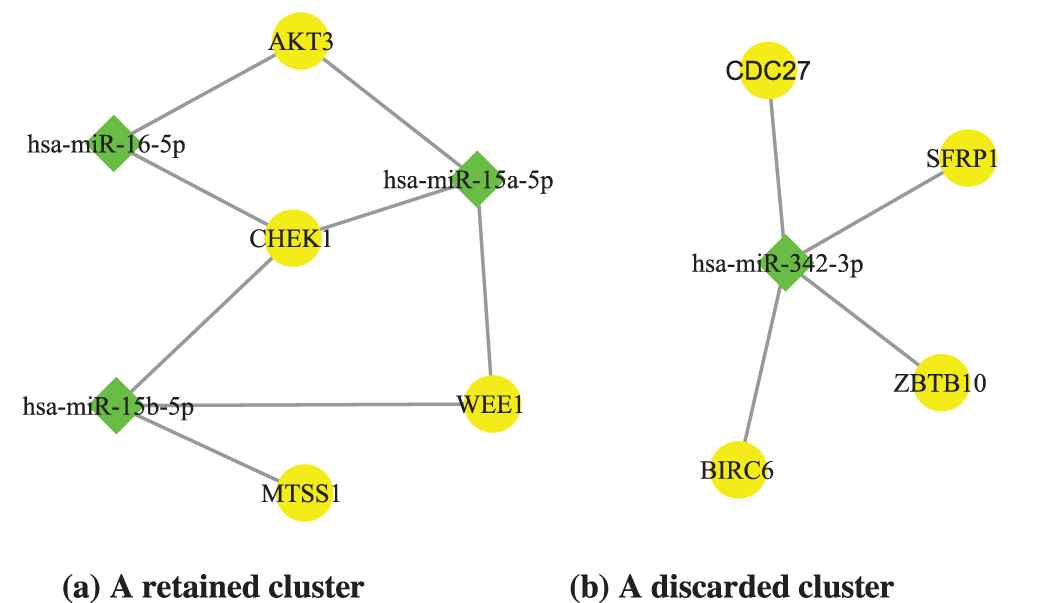
Two examples of microRNA-messenger RNA (mRNA) clusters. According to the synergy mechanism between microRNAs, only the clusters with at least two miRNAs and mRNAs are retained. Hence, the miRNA-mRNA cluster on the right is not what we want.
The pseudocode for MRM formation is outlined in Algorithm 1.
3. EXPERIMENT AND RESULTS
In this section, we first introduce data collection and preprocessing from three types of cancer. Then, we compare the modules identified by the four methods from the topological to biological significance. Specifically, topological analysis includes the number, size and density of evaluation modules, while biological significance analysis involves enrichment of miRNA family and mRNA function. Finally, we further test the prognostic ability of MICA-MRMs.
Algorithm 1: Clusters association process
Input: miRNA cluster set MIC, mRNA cluster set MRC, miRNA-target interaction set MTI
Output: final MRM set M
1: M = {}
2: foreach(mic in MIC)
3: foreach(mrc in MRC)
//search for the cluster with the most edges
4: mc = maxedge(mic, MTI, mrc)
//mc must have at least two miRNAs/mRNAs
5: if(countmi(mc)>1&countmr(mc)>1)
6:
7: endif
8: endfor
9: endfor
10: return M
3.1. Data Collection and Preprocessing
In the work, we exploited three types of data to identify miRNA regulatory modules: miRNA/mRNA expression profiles, experimentally validated miRNA–target interactions, and gene–gene interactions.
We downloaded miRNA/mRNA expression profiles of 424/848/424 BLCA/BRCA/LIHC samples from the Firebrowse website (http://firebrowse.org/). After filtering the data with missing values exceeding 10% of the sample size, we obtained the miRNA/mRNA expression profiles containing 432/368/432 miRNAs and 17,292/16,832/15,064 mRNAs for BLCA, BRCA, and LIHC, respectively.
Experimentally validated MTIs were downloaded from the website miRTarBase (http://mirtarbase.mbc.nctu.edu.tw/php/download.php/hsa-MTI.xlsx). 107, 428, and 49 MTIs related to BLCA, BRCA, and LIHC in the downloaded file were only retained, respectively.
Cancer-related gene–gene interactions (GGI) were downloaded from the STRING website (https://string-db.org/) for Mirsynergy. The collected data sets contain 680/5351/200 GGI for BLCA/BRCA/LIHC, respectively.
3.2. Comparison of Topological Feature of MRMs
Throughout the test, we used the parameter values provided in the three papers. For Mirsynergy, we set cluster density d1(Vc) < 1e−2 and d2(Vc) < 5e−3. For DICORE, we set minimum size threshold for miRNAs θm= 3, minimum size threshold for mRNAs θg= 5, and minimum canonical correlation ρ = 0.5. In addition, as a free parameter method, DeMine does not need to set parameters.
Following the pipeline of MICA, we obtained 5/13/1 MRMs on the BLCA/BRCA/LIHC data sets, respectively. As shown in Table 1, the number of MICA-modules is roughly comparable to the number of MRMs detected by DICORE (7/9/1). Although less than the number of Mirsynergy-modules (9/21/1), MICA detected significantly more modules than DeMine (1/2/0).
| Cancer | Method | #MRM | #miRNA | #mRNA | #MF | Density |
|---|---|---|---|---|---|---|
| BLCA | MICA | 5 | 3.8 | 4.8 | 1 | 0.608 |
| Mirsynergy | 9 | 3.7 | 7.8 | 0 | 0.127 | |
| DeMine | 1 | 2.0 | 2.0 | 0 | 1.000 | |
| DICORE | 7 | 3.1 | 4.1 | 0 | 0.537 | |
| BRCA | MICA | 13 | 5.2 | 7.5 | 3 | 0.497 |
| Mirsynergy | 21 | 4.1 | 21.3 | 0 | 0.088 | |
| DeMine | 2 | 3.0 | 3.0 | 0 | 0.917 | |
| DICORE | 9 | 3.5 | 4.1 | 0 | 0.631 | |
| LIHC | MICA | 1 | 2 | 1 | 0 | 0.667 |
| Mirsynergy | 1 | 2 | 1 | 0 | 0.667 | |
| DeMine | 0 | 0 | 0 | 0 | 0 | |
| DICORE | 1 | 2 | 1 | 0 | 0.667 |
Overall performance of the four methods.
The number of modules obtained reflects the strictness of the identification criteria of different algorithms. Among the four methods, DeMine has the most strict identification criterion that miRNAs used for clustering must coregulate mRNAs, while mirsynergy’s is the easiest to achieve, which only limits the cluster density threshold. MICA and DICORE are between the two. Fewer obtained modules implied that DeMine was not suitable for the three experiment data sets. Therefore, in the following sections, DeMine would not be compared with the other three methods.
The average number of miRNA per MICA-MRM on BLCA/BRCA is 3.8/5.2, which is more than 3.1/4.1 of DICORE and 3.7/4.1 of Mirsynergy. Whereas the average mRNA number per MICA-MRM on BLCA/BRCA is 4.8/7.5, which is evidently less than 7.8/21.3 of Mirsynergy. This indicates that the three methods all attach importance to the coordination between miRNAs. Moreover, MICA and DICORE attach more importance to the correlation between mRNAs than Mirsynergy. Hence, they are more likely to obtain smaller and meaningful regulatory modules.
Due to the limitation of the number of MTIs on LIHC, there only exists one significant MRM. MICA, Mirsynergy, and DICORE successfully identified the module, whereas DeMine failed to detect it. The fact indicated that the three methods were more suitable than DeMine to identify MRMs in a sparse network. Because of only one module on LIHC, we would not discuss the performance comparison between the methods on the dataset.
The density of a module demonstrates the tightness between miRNAs and mRNAs within the module. As illustrated in Figure 5, most of MRMs discovered by the other three methods have stronger internal tightness except Mirsynergy. The average density of MICA-MRMs on BLCA/BRCA is 0.608/0.497, which is roughly comparable to 0.537/0.631 of DICORE and significantly denser than 0.127/0.088 of Mirsynergy. This indicates that the modules detected by MICA and DICORE have stronger topological connection than those detected by Mirsynergy.
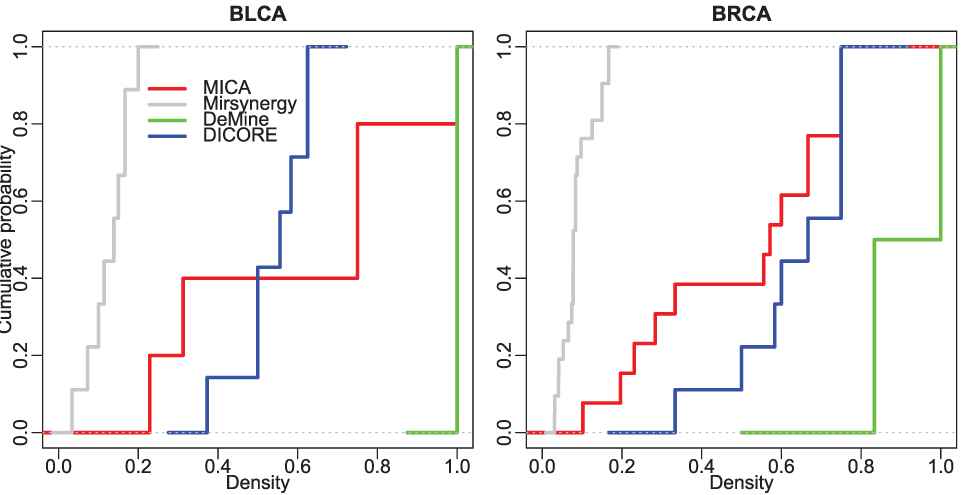
The cumulative distribution of the density of the detected modules.
Based on the above comparison of topological performance of the detected MRMs, we can conclude that although MICA is not the winner in some aspects of module structural performance, it has better overall structural performance than the other three methods.
3.3. Comparison of Synergy between miRNAs
MiRNAs from the same family are more likely to cluster in a module to involve some biological processes [21]. To compare synergy between miRNAs in MRMs detected by MICA, Mirsynergy, and DICORE, we counted the number of MRMs enriched in one or more miRNA families by hyper-geometric testing (q-value < 0.05). The miRNA hairpin sequence family classification file was downloaded from miRBase (http://www.mirbase.org/). Amazingly, 1 and 3 modules detected by MICA on BLCA and BRCA are enriched in miRNA families, respectively. But there is no miRNA family enriched MRMs detected by Mirsynergy and DICORE (Table 1).
Through further analysis, we found that miRNAs in the detected MRMs enriched in the miRNA families often synergistically regulate the development of tumor. For example, miR-200a-3p, miR-200b-3p, and miR-200c-3p from MICA-MRM 10 on BRCA are enriched in the MIPF0000019 family (Table 2). The three miRNAs have been reported in some literatures, which inhibit or promote the biological processes of cancers in a synergistic manner [22–24].
| No. | miRNAs | miRNA Family | q-value |
|---|---|---|---|
| 2 | miR-26a-5p miR-26b-5p | MIPF0000043 | 0.04060 |
| 10 | miR-200a-3p miR-200b-3p miR-200c-3p | MIPF0000019 | 0.01450 |
| 13 | miR-15a-5p miR-15b-5p miR-16-5p miR-195-5p | MIPF0000006 | 0.02484 |
miRNA family enrichment for BRCA-MRMs.
3.4. Comparison of Functional Enrichment of Genes
To compare the biological meaning of mRNA groups in the MRMs identified by the three methods, we performed the functional enrichment analysis of Gene Ontology (GO) terms and Kyoto Encyclopedia of Genes and Genomes (KEGG) pathways. Among 5/13 MICA-modules on BLCA/BRCA, there are 4/12 and 3/8 modules enriched in GO terms and KEGG pathways, respectively. For Mirsynergy, the corresponding numbers are 6/18 (3/9) of 9/21 modules. And among 7/9 DICORE-modules, the corresponding numbers are 5/7 and 4/5, respectively. As shown in Figure 6, the proportion of functional enrichment MRMs identified by MICA is more than that of Mirsynergy and DICORE.
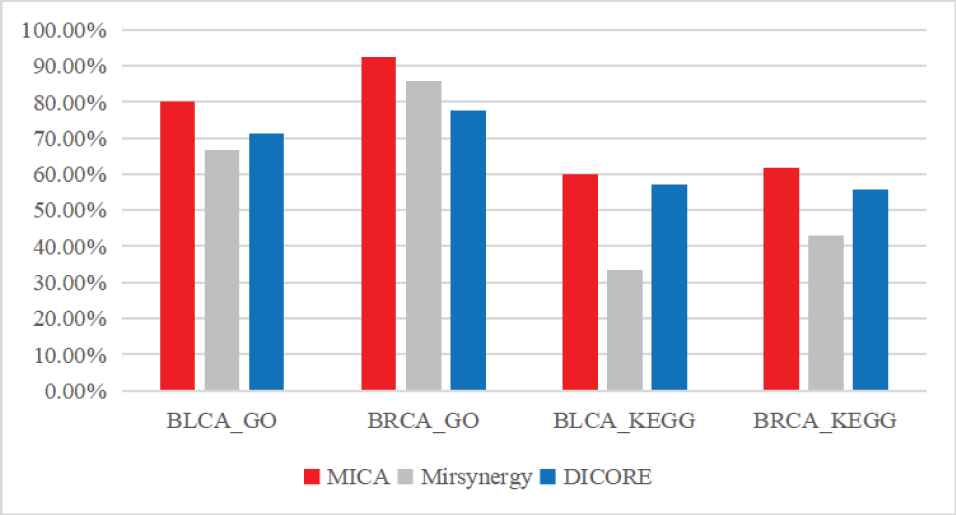
The comparison of biological significance of the miRNA regulatory modules (MRMs) detected by the three methods on three datasets.
In addition, we counted the number of GO and KEGG enriched in each MRM (p-value < 0.005). From Table 2 and Figure 7, we observed that GO terms and KEGG pathways enriched in each MICA-MRM and Mirsynergy-MRM are evidently more than that of each DICORE-MRM. Although Mirsynergy has more average mRNAs per module than MICA, the number of meaningful GO term and KEGG pathway per module is slightly less than MICA.
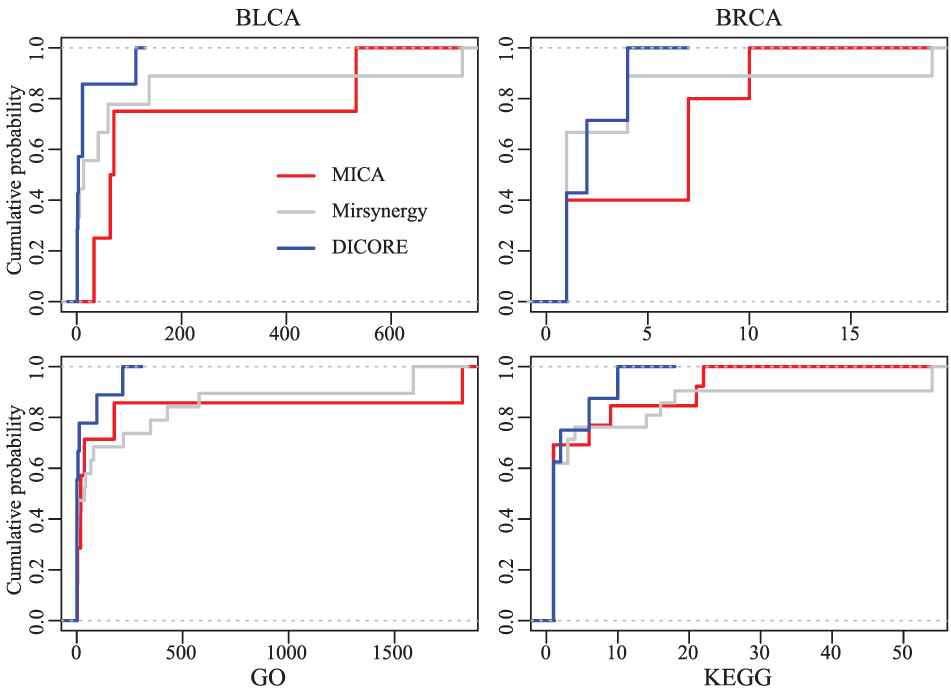
The cumulative distribution curves of the Gene Ontology (GO) terms and KEGG pathways of the detected modules. Here, the abscissa is the number of the GO terms and Kyoto Encyclopedia of Genes and Genomes (KEGG) pathways enriched in each miRNA regulatory module (MRM).
From the above comparison of miRNA family enrichment and gene functional enrichment, we can observe that MICA-MRMs show better overall performance than Mirsynergy-MRMs and DICORE-MRMs in terms of module functional quality.
3.5. Validation of Prognostic Capability of MRMs
For evaluating the prognostic power of the identified modules, we downloaded the clinical information of 566 BRCA and 408 BLCA samples from the TCGA and introduced a “risk score model” proposed by Shukla et al. [25]. The model consists of three stages: (1) multivariate Cox proportional hazard regression is applied to estimate the risk scores by calculating the risk factor coefficient (i.e., miRNAs) correlate to survival time. (2) Patients are split into low-risk group and high-risk group according to whether risk scores of them above the median risk score or not. (3) Kaplan–Meier survival analysis is applied to compare the survival time of the two groups.
In our work, we applied the model to explore all MICA-MRMs on BLCA and BRCA. The result showed that 3 of 5 BLCA-modules and 11 of 13 BRCA-modules have meaningful prognostic capability. For example, MICA-MRM 10 on BRCA consists of 5 miRNAs and 12 mRNAs, whose topological structure is demonstrated in Figure 8.
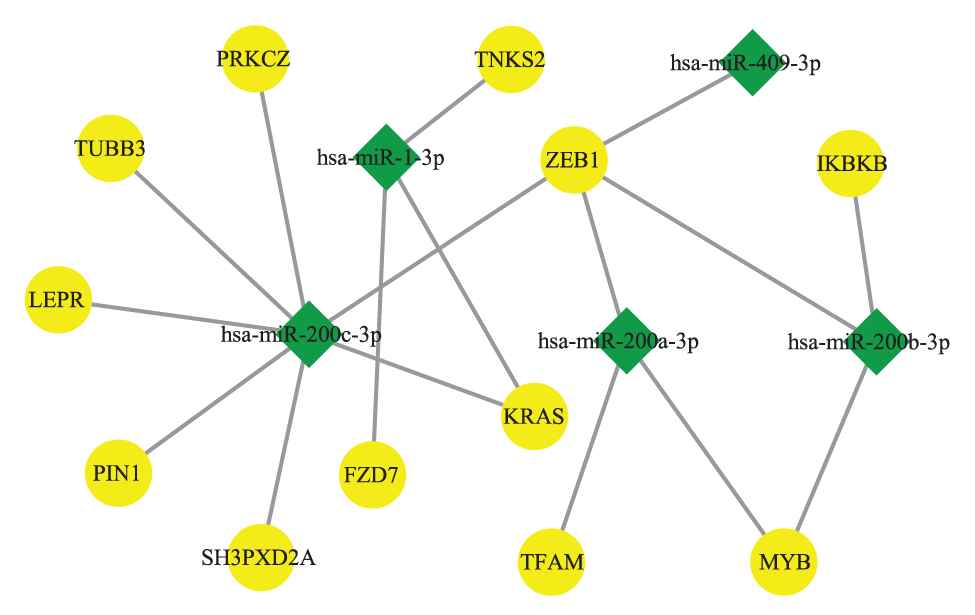
The topological structure of MICA-miRNA regulatory module (MRM) 10 on breast cancer (BRCA).
As illustrated in Figure 9, the five miRNAs in MICA-MRM 10 are inclined to demonstrate the same expression patterns in the two groups. Specifically, their expression are obviously lower in high-risk patients than in low-risk patients. It is also demonstrated in survival time analysis. As shown in Figure 10, patients with low expression are at greater risk of survival (HR = 0.279, 95% CI = 0.123 to 0.624). Just as reported in previous studies, the five miRNAs are tumor suppressor miRNAs that usually inhibit BRCA biological process by suppressing expression of related oncogenes [26–28].
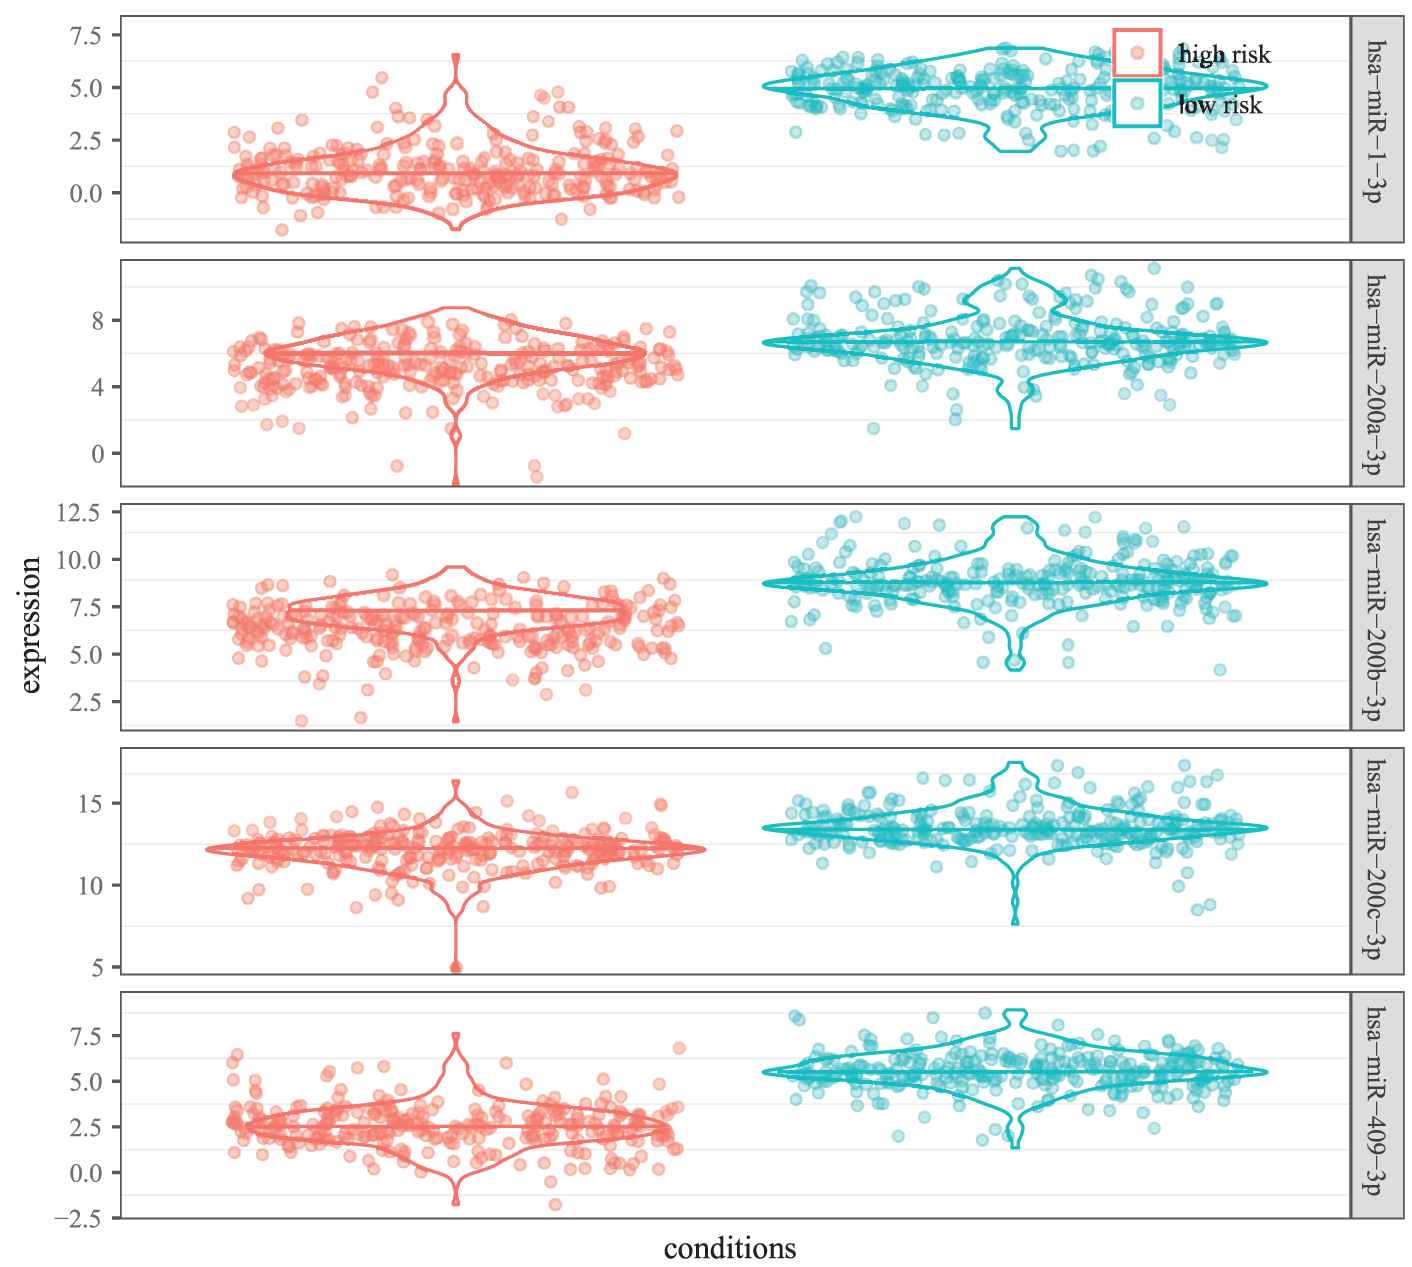
Differential expression of 5 microRNAs in two groups of samples.
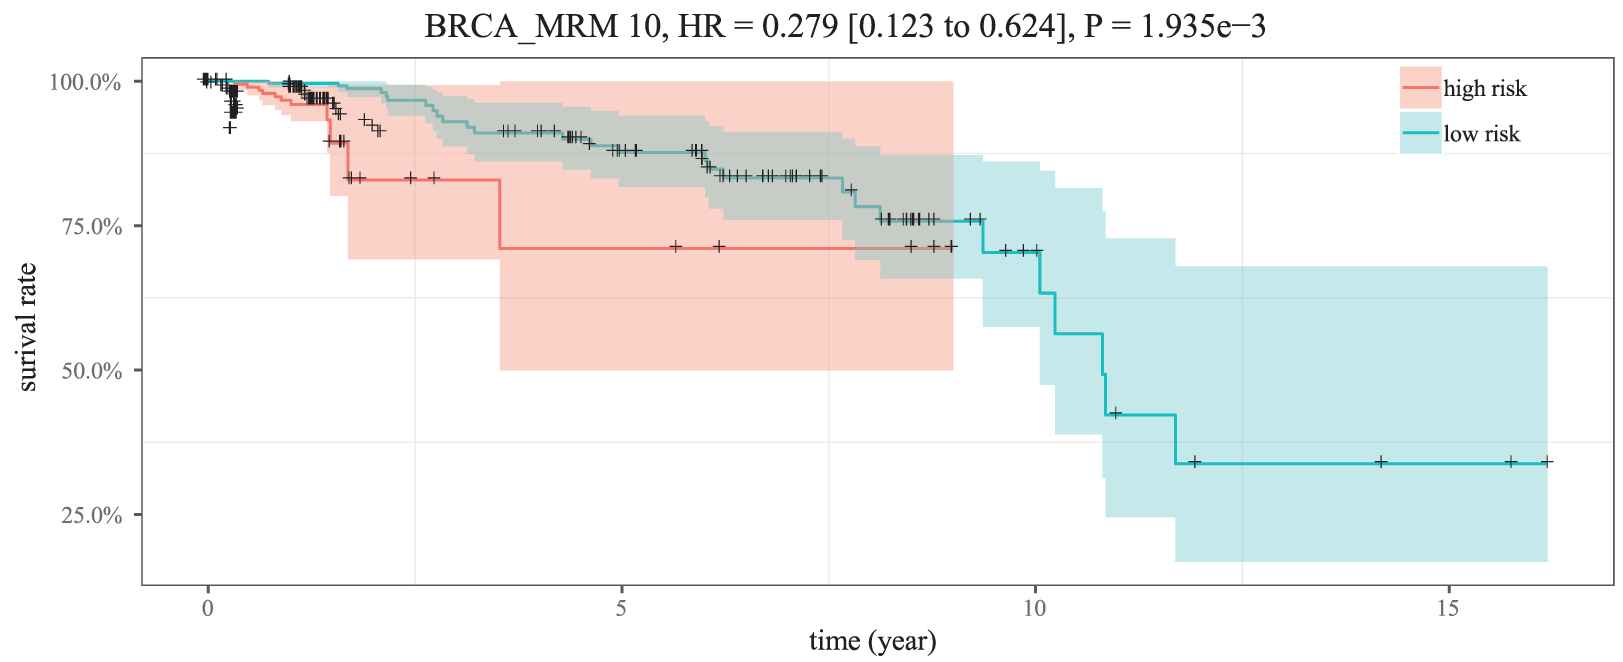
Kaplan–Meier survival analysis for two groups of samples.
We also examined the GO term and KEGG pathway enrichment of target genes in MICA-MRM 10. From Figure 11, we observed that “metabolic process,” “cell differentiation,” and “cell activation” are the three most common GO terms enriched in target genes in MICA-MRM 10. Furthermore, MICA-MRM 10 also involves some important pathways, such as “Insulin signaling pathway,” “Pathways in cancer,” and “Chemokine signaling pathway” (Figure 12). These pathways have been identified as carcinogenic pathways associated with BRCA [29–32].
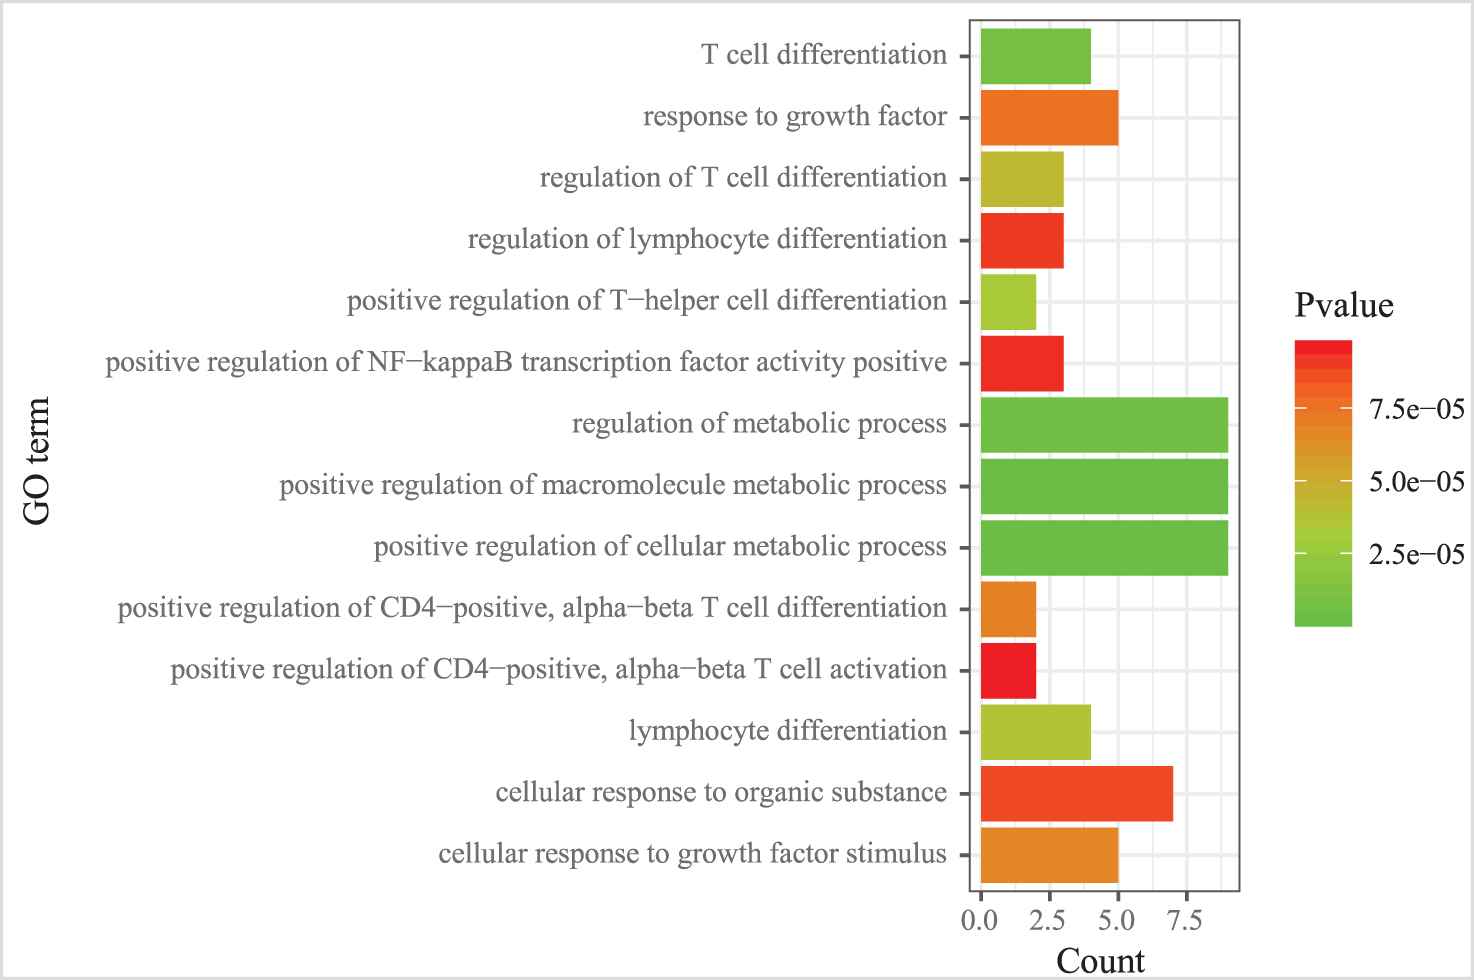
The GO terms enriched by the genes within MICA-miRNA regulatory module (MRM) 10.
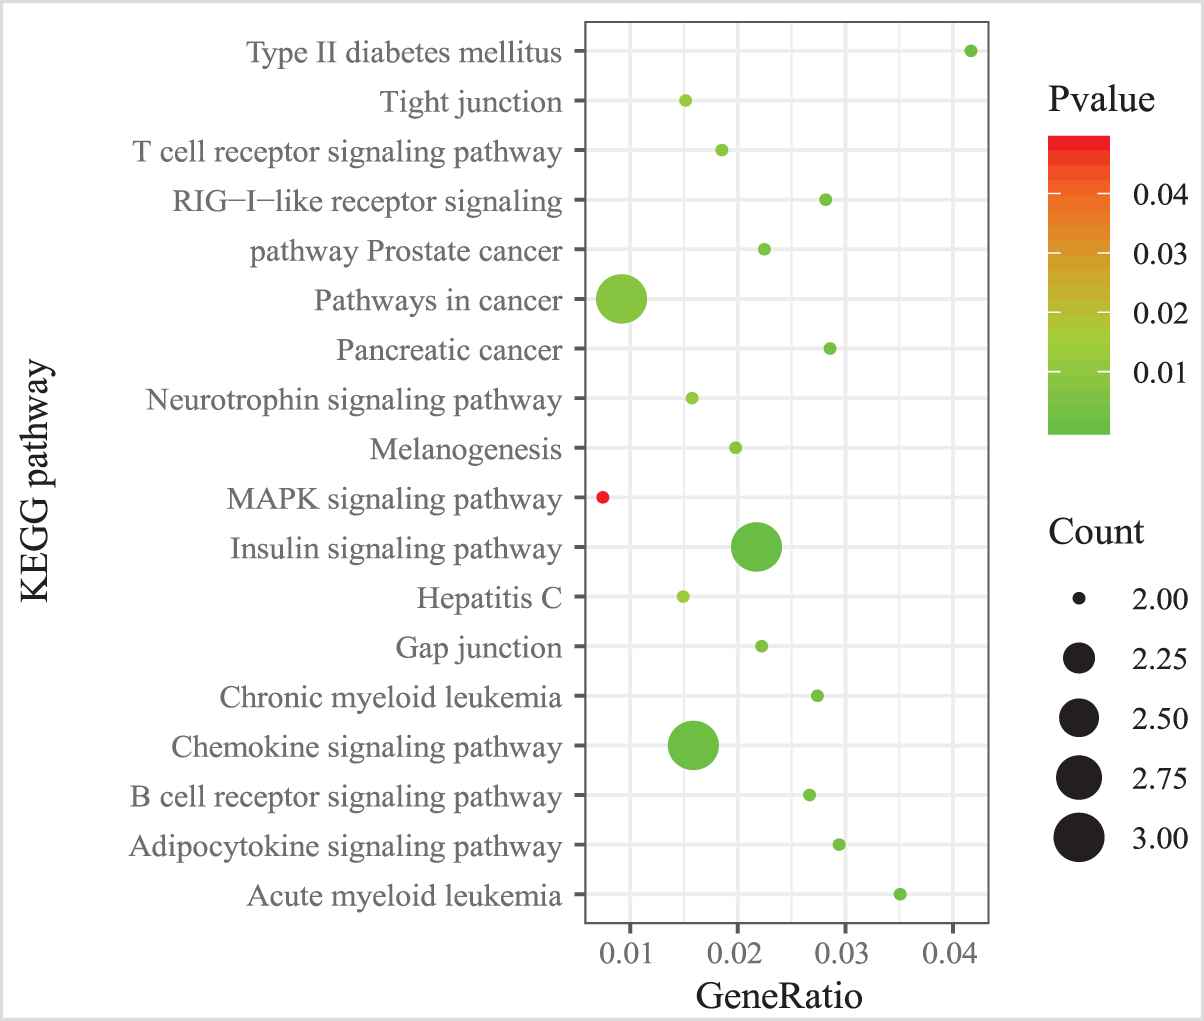
The KEGG pathways enriched by the genes within MICA-miRNA regulatory module (MRM 10).
The experiment results confirmed that the modules detected by MICA are highly associated with patient survival. Hence, the modules detected by MICA have the potential to predict the prognostic signatures of various types of tumors.
4. CONCLUSION
Identification accuracy of miRNA regulatory modules suffers from incomplete biological data. In this article, we propose a learning-based framework named MICA to solve the problem. We first obtain significant features of miRNAs and mRNAs based on CAEs, which can aid to reduce the impact of false positive data on the expression of miRNAs/mRNAs. Then, we employ K-means method to cluster miRNAs and mRNAs, respectively. Finally, we combine the obtained clusters into miRNA regulatory modules by exploiting experimentally validated miRNA-target interactions. To demonstrate the advantages of MICA, we compare it with three existing methods. The experiments on three cancer data sets show that MICA performs better than existing methods, indicating that the proposed learning-based framework can effectively reduce the impact of false-positive data. In addition, case study on BRCA shows that MICA-MRM could be used to predict the prognostic signatures. In the future, MICA has the potential to play an important role in detecting miRNA regulation patterns within complex diseases.
CONFLICT OF INTEREST
The authors declare no conflict of interest.
AUTHORS' CONTRIBUTIONS
Literature search, study conception, experiment completion, and manuscript writing are all conducted by Yi Yang.
ACKNOWLEDGMENTS
This work was supported in part by the “double first-class” discipline construction plan of Hunan Province, China under Grant XiangJiaoTong (2018) No. 469 (Sociology) and the scientific research project of Education Department of Hunan Province, China, under Grant 18A470.
APPENDIX A SOME ACRONYMS IN THE PAPER
| Index | Acronym | Expression |
|---|---|---|
| 1 | BLCA | Bladder cancer |
| 2 | BRCA | Breast cancer |
| 3 | CAE | Convolutional autoencoder |
| 4 | GGI | Gene–gene interaction |
| 5 | LIHC | Liver hepatocellular cancer |
| 6 | MF | MicroRNA family |
| 7 | miRNA | MicroRNA |
| 8 | MRM | MicroRNA regulatory module |
| 9 | mRNA | Messenger RNA |
| 10 | MTI | MicroRNA-Target interaction |
| 11 | SSE | Sum of squared error |
| 12 | GO | Go Ontology |
| 13 | KEGG | Kyoto Encyclopedia of Genes and Genomes |
| 14 | MICA | MicroRNA regulatory module Identification with Convolutional Autoencoders |
APPENDIX B SOURCE CODE AND EXPERIMENT RESULT
The source code files and supplementary data for MICA are available at https://github.com/snryou/mica
REFERENCES
Cite this article
TY  - JOUR
AU  - Yi Yang
PY  - 2020
DA  - 2020/10/16
TI  - A Learning-Based Framework for Identifying MicroRNA Regulatory Module
JO  - International Journal of Computational Intelligence Systems
SP  - 1598
EP  - 1607
VL  - 13
IS  - 1
SN  - 1875-6883
UR  - https://doi.org/10.2991/ijcis.d.201009.001
DO  - 10.2991/ijcis.d.201009.001
ID  - Yang2020
ER  -