
An Evolutionary Self-organizing Cost-Sensitive Radial Basis Function Neural Network to Deal with Imbalanced Data in Medical Diagnosis
- DOI
- 10.2991/ijcis.d.201012.005How to use a DOI?
- Keywords
- Imbalanced data; Medical diagnosis; Radial basis function neural network; Cost-sensitive; Genetic algorithm; Particle swarm optimization
- Abstract
Class imbalance is a common issue in medical diagnosis. Although standard radial basis function neural network (RBF-NN) has achieved remarkably high performance on balanced data, its ability to classify imbalanced data is still limited. So far as we know, cost-sensitive learning is an advanced imbalanced data processing method. However, few studies have focused on the combination of RBF-NN and cost sensitivity. From our knowledge, only one paper has proposed a cost-sensitive RBF-NN for software defect prediction. However, the authors implemented a fixed RBF-NN structure. In this paper, a novel cost-sensitive RBF-NN that optimizes structure and parameters simultaneously is proposed to handle medical imbalanced data. Genetic algorithm (GA) and improved particle swarm optimization (IPSO) are used to optimize the structure and parameters of cost-sensitive RBF-NN respectively, and the optimization of cost-sensitive RBF-NN based on dynamic structure is realized. A cost-sensitive function determined adaptively by the sample distribution as the objective function of RBF-NN, so that it can adapt to datasets with different sample distributions. Experimental results show that the proposed cost-sensitive RBF-NN outperforms other state-of-the-art representative algorithms for five imbalanced medical diagnostic datasets in term of accuracy and area under curve (AUC). It can improve the accuracy of medical diagnosis and reduce the error rate of medical decisions.
- Copyright
- © 2020 The Authors. Published by Atlantis Press B.V.
- Open Access
- This is an open access article distributed under the CC BY-NC 4.0 license (http://creativecommons.org/licenses/by-nc/4.0/).
1. INTRODUCTION
In the last decades, classification systems have played an important role in medical diagnosis [1]. It not only can help doctors reduce the diagnostic error rate, it also can increase efficiency. However, the number of patients with various pathologies in medical datasets is often different, which makes the distribution of the dataset imbalanced [2]. Dealing with datasets with imbalanced class distribution poses a challenge to classifiers [3,4].
Imbalanced data refers to the fact that one class in the dataset is significantly larger than the other classes [5]. The class with a small number of samples is called minority class, and the class with a large number of samples is called majority class. Traditional machine learning algorithms treats the misclassification costs of different classes equally, which results in classifiers tend to focus on majority class [6]. But in the case of imbalanced data, the cost for minority class misclassification is often higher than that for majority class. For example, the cost of misclassifying a patient as a normal person is much greater than the opposite decision, so dealing with imbalanced data is essential for medical diagnosis. Various methods have been developed so far to handle this problem. Shilaskar et al. [2] proposed a modified particle swarm optimization (MPSO) for pathological multiclass imbalanced datasets. Experimental results show that MPSO is better than the other five compared algorithms. A method combining information granularity and clustering is established to deal with imbalanced data [7]. This method effectively improves the performance of prostate cancer prognosis prediction. Very recently, Gan et al. [4] propose an integrated tree augmented naive bayes network (TANBN) with cost-sensitive classification method. This method is used to process medical imbalanced data, and obtains high accuracy and area under curve (AUC).
Among the many imbalanced learning methods, cost-sensitive learning is one of the most advanced methods. For different classes, the cost-sensitive classifier will set different misclassification values, and then train the classifier by minimizing the expected cost [8]. In recent years, many cost-sensitive methods have been proposed to deal with imbalanced data and have obtained satisfactory results, such as MetaCost [9], cost-sensitive artificial neural network (ANN) [10], cost-sensitive k-nearest neighbor (KNN) [11]. However, few researchers pay attention to the combination of radial basis function neural network (RBF-NN) and cost-sensitivity. RBF-NN is a special neural network with only one hidden layer. Due to its better approximation ability of complex nonlinear problems, convergence speed, and simple topology [12], RBF-NN has been widely adopted in various prediction problems [13–15]. From our knowledge, only literature [16] has proposed an adaptive dimensional biogeography optimized cost-sensitive RBF-NN for software defect prediction. However, the authors implemented a fixed RBF-NN structure, which is often not as good as the results obtained by optimizing the structure and parameters simultaneously [17]. In recent years, genetic algorithm (GA) and particle swarm optimization (PSO) as two popular evolutionary methods that have been successfully applied to the simultaneous optimization of RBF-NN structure and parameters. Li et al. [18] proposes a modified PSO based on multi-Gbest strategy to optimize the structure and parameters of RBF-NN simultaneously and applies this method to estimate aero-engine thrust. Jia et al. [19] propose to optimize the architecture and radial basis function parameters of RBF-NN with GA, and then apply the optimized RBF-NN combined with partial least squares to small sample classification. From the previous works, most researchers are concerned with the optimization of conventional RBF-NN. But conventional RBF-NN assumes that the cost of misclassification for each class is equal, which makes it not good at handling imbalanced data. In summary, it is necessary to propose a cost-sensitive RBF-NN with optimized structure and parameters simultaneously.
Based on the above considerations, in this paper, we propose an evolutionary self-organizing cost-sensitive RBF-NN co-optimized by GA and improved particle swarm optimization (IPSO) to handle medical imbalanced data. The IPSO algorithm proposed by Montazer and Giveki [20] adopts an adaptive dynamic adjustment strategy to improve the inertial weight and position update, which has better adaptability to highly nonlinear and complex problems. Specifically, we binary code the hidden layer units of the RBF-NN and use GA for evolution. For the center, radius, and weight of the RBF-NN, we use real-value encoding and optimized it by IPSO. This is because PSO has a deeper intelligent background and is easier to implement for real-value optimization problems [21]. Moreover, a cost-sensitive function determined by the sample distribution is used as the fitness function of GA and IPSO. This cost-sensitive function is also the objective function of RBF-NN. The main contributions of this study are as follows:
-
A novel cost-sensitive RBF-NN that optimizes structure and parameters simultaneously is proposed to handle medical imbalanced data.
-
GA and IPSO are used to optimize the structure and parameters of cost-sensitive RBF-NN respectively, and the optimization of cost-sensitive RBF-NN based on dynamic structure is realized.
-
The algorithm uses a cost-sensitive function determined adaptively by the sample distribution as the objective function of RBF-NN, so that it can adapt to datasets with different sample distributions.
-
The proposed method can improve the accuracy of medical diagnosis and reduce the error rate of medical decisions for five medical problems with imbalanced class distribution.
The remainder of this paper is structured as follows: we review previous research on imbalanced data processing methods in Section 2. The proposed method is shown in Section 3. Section 4 is concerned with experimental results and discussion. Lastly, conclusions are drawn in Section 5.
2. RELATED WORKS
The existing research on imbalanced data processing methods has two main research directions: data-based methods and algorithm-based methods [22]. We will review and analyze the advanced methods of imbalanced data processing in recent years from these two aspects.
The data-based processing methods balances the class distribution by resampling the original data. Resampling methods can be divided into three groups: undersampling, oversampling, and hybrid sampling. Undersampling method improves the sample distribution of the data by reducing the number of majority class samples, such as cluster-based [23,24] and evolution-based methods [25,26]. Although the undersampling methods can improve classification accuracy, it may cause loss of information [27]. In contrast to the undersampling methods, oversampling techniques handle the imbalanced data by repetition of present minority samples or creating new ones. Synthetic minority oversampling technique (SMOTE) is one of the most representative and widely used oversampling algorithms [28]. Its main idea is to generate new samples based on the difference of the feature vectors of minority class samples with their neighbors. Although SMOTE is a simple and effective oversampling method, its blind sampling may make the classification result worse [29,30]. To overcome this drawback, several oversampling methods have been proposed, such as Geometric SMOTE [31] and LR-SMOTE [32], to selectively replicate the minority class samples. In addition, there are some methods of mixing oversampling and undersampling, such as SMOTE-Tomek Link [33].
Algorithm-based processing of imbalanced data mainly involves two aspects: ensemble method and cost-sensitive method. For the aspect of ensemble learning, the ensemble classifier enhances the efficiency of a single classifier by integrating multiple classifiers [34]. Roughly, in approximately two groups can be divided into current ensemble learning methods: iterative and parallel [35]. Boosting is the most common and effectively iterative-based ensemble method. It trains multiple weak classifiers by adjusting the weight distribution of the training data, and combines them linearly to form a strong classifier, such as Adaboost [36], GBDT [37]. For parallel-based ensembles, it means that each base classifier can be trained in parallel, such as bagging, resampling- based ensembles [38–40]. As for cost-sensitive learning, cost-sensitive neural networks are one of the rapidly developing cost-sensitive methods in recent years. A cost-sensitive convolutional neural network has been proposed to identify abnormal industrial control chart patterns [41]. Li et al. [42] proposed a cost-sensitive deep neural network for sequential three-way decision-based image data analysis. A cost-sensitive ANN optimized by artificial bee colony algorithm is proposed to predict software defects [43]. This method optimizes weights and structure of the ANN is selected by trial and error.
Different from previous studies, we proposed an evolutionary self-organizing cost-sensitive RBF-NN jointly optimized by GA and IPSO. This method can optimize both the structure and parameters of RBF-NN simultaneously. The algorithm uses a cost-sensitive function determined adaptively by the sample distribution as the objective function of RBF-NN, so that it can adapt to datasets with different sample distributions.
3. METHODS
3.1. Radial Basis Function Neural Network
RBF-NN has better nonlinear approximation and convergence speed than back propagation networks. It has been proven that RBF-NN can approximate any continuous function if there are a sufficient number of radial basis function neurons [44]. Figure 1 shows the architecture of RBF-NN. Consider an n-dimensional input vector

The architecture of radial basis function neural network (RBF-NN).
In general, training RBF-NN can be separated into two stages: first of all, determine the center and radius of radial basis function by an unsupervised method. Then, apply the supervised method to determine the output weight. Appropriate structure and parameters are very important for RBF-NN. For a better performance, it is necessary to consider the collaborative optimization of the structure and parameters of RBF-NN.
3.2. Genetic Algorithm
Holland proposed GA in the 1970s [45]. Typical GA evolve individuals based on fitness and selection, crossover, and mutation operators. In selection operator, chromosomes are chosen as parents from the population. The larger the fitness value, the greater the probability of being selected. In crossover operator, some genes are exchanged between chromosomes, creating new chromosomes. Then in mutation operator, one or more gene in the chromosome are randomly perturbed (often with a low probability).
3.3. Improved PSO (IPSO)
Particle swarm optimization (PSO) is a swarm intelligence optimization algorithm, which imitates the behavior of birds foraging. In the PSO algorithm, each particle is a feasible solution to the optimization problem. The movement of particles is affected by its previous optimal solution and global optimal solution. and its position is updated according to the speed. The velocity and position of each particle is updated as follows:
For a better performance, we usually hope that particles have a powerful global search capability in the early stages of evolution and good local exploration capability in the late stage of evolution. IPSO adopts an adaptive dynamic adjustment strategy to improve the inertial weight and position update, which has better adaptability to highly nonlinear and complex problems. The dynamic adjustment strategy of the IPSO is as follows:
3.4. The Proposed Hybrid GA and IPSO Optimized Cost-Sensitive RBF-NN
3.4.1. Coding scheme
We assume that the maximum number of hidden units in a RBF-NN is Nmax, and the number of output neurons is S. Each chromosome (or particle) code consists of two parts, as shown in Figure 2. Part 1 is used to determine the number of hidden units in RBF-NN. In Part 1, 1 indicates that the unit is on and 0 is off. The length of Part 1 is the number of maximum hidden units. As shown in Figure 2, the encoding of Part 2 is divided into Nmax segments, and each segment contains the center value (ci), radius value (ri) of a hidden unit, and the weight (w) of hidden units to each output unit. Each segment in Part 2 corresponds to a code in Part 1. In this way, Part 1 and Part 2 contain all the information of a hidden layer unit, including its switching state, the center value and the radius value of radial basis function, and its weight to each output unit. Part 1 and Part 2 are optimized with GA and IPSO algorithms respectively. They share the same fitness function and evolve into the same direction.
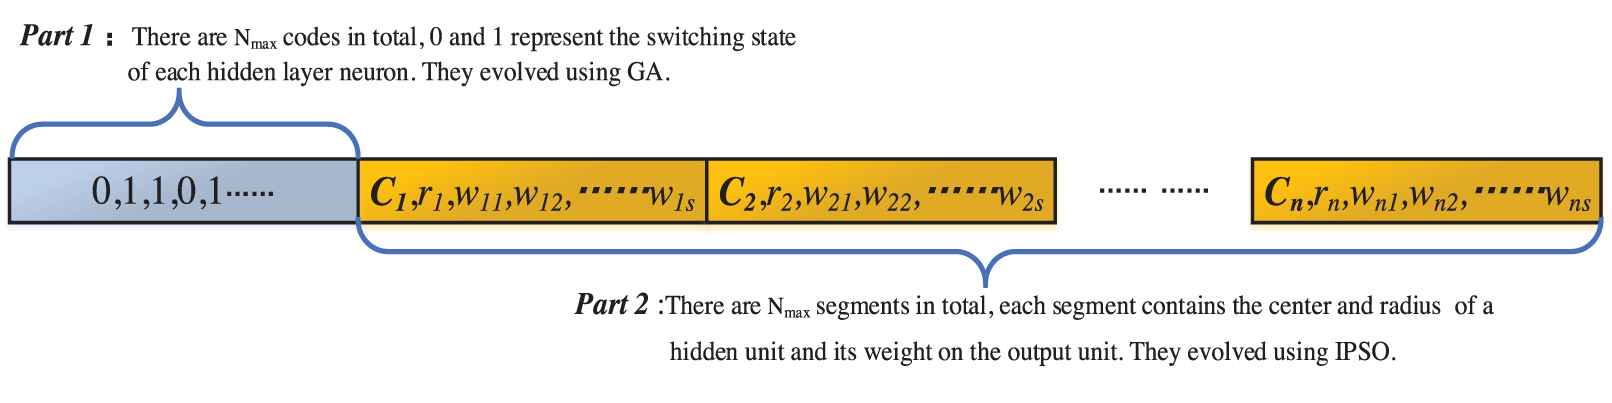
Coding diagram of a chromosome (or particle).
3.4.2. Cost-sensitive fitness function
As to a binary classification problem, the confusion matrix can be represented by Table 1. We use CTP and CTN to represent the costs of TP and TN, respectively. Usually, their values are set as 0. CFP and CFN denote the cost of FP and FN, respectively. In most previous studies, the cost value was often set manually, without considering the impact of sample distribution in the dataset. In this research, the value of CFP is set as imbalance ratio and CFN as 1. In this way, the misclassification cost can be adjusted adaptively according to the sample distribution of different datasets [46,47]. Then, the fitness function can be defined as
| Actual Positive | Actual Negative | |
|---|---|---|
| Predicted Positive | True Positive (TP) | False Positive (FP) |
| Predicted Negative | False Negative (FN) | True Negative (TN) |
Confusion matrix.
3.4.3. The main steps of our proposed method
Figure 3 shows the flowchart of the evolutionary self-organizing cost-sensitive RBF-NN optimized by GA and IPSO algorithm (GA-IPSO-CSRBF). The specific process performed by the algorithm is as follows:
-
Data preprocessing, including deleting missing values, removing useless features and standardizing. Divide the original data into training set and testing set.
-
Initialization parameters: population size (PN); maximum number of hidden units (Nmax); maximum number of iterations (tmax); crossover rate and mutation rate of GA (Pc and Pm); individual and social learning factors
-
Initialize the population based on the initialization parameters.
-
The fitness value of each particle is calculated by Eq. (10). The lower the total cost, the higher the fitness.
-
Apply GA operator (selection, crossover, mutation) to update the structure of RBF-NN. Selection operator uses the roulette wheel selection, which means that the greater the fitness of a particle, the greater the probability that it will be selected. Single-point crossover is used as crossover operator, which indicates selected parents will exchange partly genes at a fixed probability. For the mutation operator, we chose bit-flipping mutation, which changes some genes of a chromosome from 1 to 0 or from 0 to 1.
-
Evolving the center, radius and weight of RBF-NN by Eqs. (3–9).
-
Calculate the fitness of the updated particles. If the best fitness meets the termination condition (best fitness = 0), then output the optimal RBF-NN. Otherwise, return to step 5 until the maximum number of iterations tmax is met. Then, output the structure and parameters of RBF-NN corresponding to the particle with the highest fitness.
-
Use optimized cost-sensitive RBF-NN to predict test data.
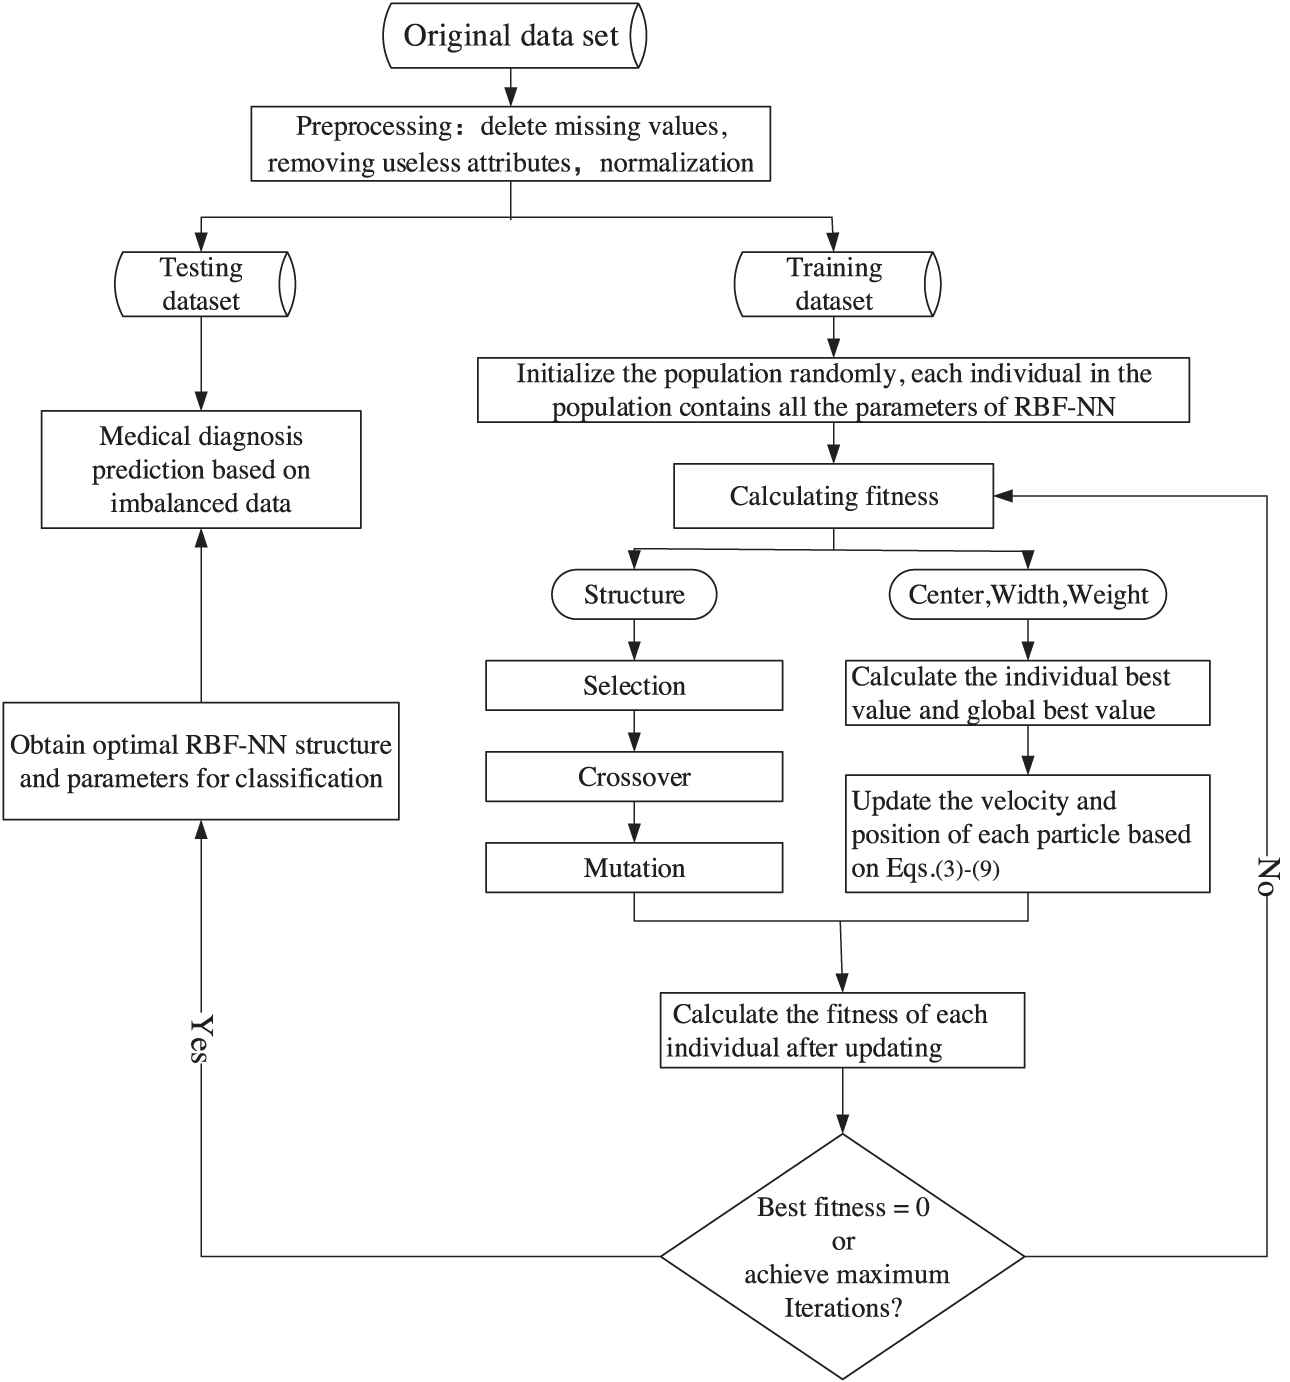
The flowchart of cost-sensitive RBF-NN optimized by GA and IPSO (GA-IPSO-CSRBF) algorithm.
4. EXPERIMENTS
4.1. Experimental Design
We compare the proposed evolutionary self-organizing cost-sensitive RBF-NN optimized by GA and IPSO (CSRBF) model with three groups of methods. The first group contains the RBF-NN and its two cost-sensitive forms in WEKA [48], including cost-sensitive RBF-NN and meta-cost RBF-NN. These three methods are recorded as RBF, CS-RBF, and MC-RBF in the experimental results. For the second group, we compare GA-IPSO-CSRBF with ensemble algorithms with RBF-NN as the base classifier, including Adaboost, Logitboost, Bagging, and Voting. The third group consists of three non-cost-sensitive single classifiers including KNN, support vector machine (SVM), and C4.5.
The parameters of GA-IPSO-CSRBF are set as follows:
4.2. Datasets
We selected five imbalanced medical datasets including Wisconsin diagnostic breast cancer dataset (WDBC), Breast cancer Wisconsin (Original) dataset (Breast cancer), Bupa liver disorders dataset (Bupa), Pima Indians diabetes dataset (Pima) from the UCI learning repository, and lower back pain symptoms dataset (LBPS) from Kaggle.com, a large machine learning competition platform. Table 2 shows the details of five datasets.
| Datasets | Number of Instances | Number of Attributes | Class Distribution |
|---|---|---|---|
| WDBC | 569 | 31 | 357/212 |
| Breast cancer | 699 | 9 | 458/241 |
| Bupa | 345 | 6 | 200/145 |
| Pima | 768 | 8 | 500/268 |
| LBPS | 310 | 12 | 210/100 |
WDBC, Wisconsin diagnostic breast cancer dataset; LBPS, lower back pain symptoms dataset.
Details of the selected datasets.
4.3. Performance Metrics
In this study, accuracy (ACC), true positive rate (TPR), and false positive rate (FPR) are used for evaluating the results. In addition, AUC and the receiver operator characteristic (ROC) curve have been proven to be very suitable in evaluating imbalanced data classification problems [49], so these two indicators are also used in our experimental comparison. The calculation formulas for ACC, TPR, and TFR can be obtained from the confusion matrix in Table 2.
4.4. Experimental Results
4.4.1. Comparison with RBF-NN and its cost-sensitive forms
Table 3 presents a comparison between our GA-IPSO-CSRBF algorithm and RBF, CS-RBF, and MC-RBF in term of ACC on the five datasets. We can see from Table 3 that the GA-IPSO-CSRBF algorithm can achieve the best performance among the four methods with average results of 95.7% ACC in WDBC dataset, 96.4% in Breast cancer dataset, 68.4% in Bupa dataset, 74.4% in Pima dataset, and 80.9% in LBPS dataset.
| Datasets | GA-IPSO-CSRBF | RBF | CS-RBF | MC-RBF |
|---|---|---|---|---|
| WDBC | 0.957 | 0.947 | 0.947 | 0.924 |
| Breast cancer | 0.964 | 0.961 | 0.961 | 0.956 |
| Bupa | 0.684 | 0.641 | 0.583 | 0.495 |
| Pima | 0.744 | 0.743 | 0.687 | 0.691 |
| LBPS | 0.809 | 0.753 | 0.731 | 0.699 |
WDBC, Wisconsin diagnostic breast cancer dataset; LBPS, lower back pain symptoms dataset; GA-IPSO-CSRBF, cost-sensitive RBF-NN optimized by GA and IPSO algorithm; ACC, accuracy.
GA-IPSO-CSRBF compare RBF, CS-RBF, and MC-RBF in terms of ACC.
AUC results of GA-IPSO-CSRBF, RBF, CS-RBF, and MC-RBF are shown in Table 4. All the AUC values of GA-IPSO-CSRBF are greater than 0.5, indicating that its experimental results are acceptable. The compared results in Table 4 show that the AUC values of our proposed method are 0.990 in WDBC dataset, 0.994 in Breast cancer dataset, 0.724 in Bupa dataset, 0.801 in Pima dataset, and 0.885 in LBPS dataset, which are also better than the other three algorithms.
| Datasets | GA-IPSO-CSRBF | RBF | CS-RBF | MC-RBF |
|---|---|---|---|---|
| WDBC | 0.990 | 0.980 | 0.979 | 0.989 |
| Breast cancer | 0.994 | 0.989 | 0.990 | 0.976 |
| Bupa | 0.724 | 0.682 | 0.681 | 0.511 |
| Pima | 0.801 | 0.754 | 0.751 | 0.723 |
| LBPS | 0.885 | 0.839 | 0.841 | 0.752 |
WDBC, Wisconsin diagnostic breast cancer dataset; LBPS, lower back pain symptoms dataset; GA-IPSO-CSRBF, cost-sensitive RBF-NN optimized by GA and IPSO algorithm; AUC, area under curve.
GA-IPSO-CSRBF compare RBF, CS-RBF, and MC-RBF in terms of AUC.
To further evaluate the robustness of the GA-IPSO-CSRBF algorithm to imbalanced data, we compare it with the other three methods, including RBF, CS-RBF, and MC-RBF in the case of the ROC curves. Figure 4 shows the ROC curves based on the five datasets. As shown in Figure 4, for the Bupa, Pima, and LBPS datasets, we can clearly see that the area under the curve of the GA-IPSO-CSRBF algorithm is larger than the other three methods. For the WDBC and breast cancer datasets, although the area under the curve of the other three methods is already very close to 1, our proposed algorithm still has certain advantages. This indicates that our GA-IPSO-CSRBF performs better than RBF, CS-RBF, and MC-RBF in processing imbalanced data of medical diagnosis.

The receiver operator characteristic (ROC) curves for cost-sensitive RBF-NN optimized by GA and IPSO (GA-IPSO-CSRBF) compared to RBF, CS-RBF, and MC-RBF based on the five datasets.
4.4.2. Comparison with different ensemble algorithms
Table 5 shows the comparison between the GA-IPSO-CSRBF algorithm and four ensemble learning methods, including adaboost, logitboost, bagging, and voting in term of ACC on the selected five datasets. Overall, the performance of GA-IPSO-CSRBF is better than several other ensemble algorithms based on RBF-NN. Only for the breast cancer dataset, the accuracy of the GA-IPSO-CSRBF algorithm is slightly lower than logitboost, which is 0.964. But our method outperforms logitboost for the other four datasets. So in general, our proposed method GA-IPSO-CSRBF performs better than logitboost.
| Datasets | GA-IPSO-CSRBF | Adaboost | Logitboost | Bagging | Voting |
|---|---|---|---|---|---|
| WDBC | 0.957 | 0.947 | 0.918 | 0.953 | 0.947 |
| Breast cancer | 0.964 | 0.956 | 0.966 | 0.961 | 0.961 |
| Bupa | 0.684 | 0.680 | 0.583 | 0.631 | 0.641 |
| Pima | 0.744 | 0.735 | 0.691 | 0.691 | 0.743 |
| LBPS | 0.809 | 0.769 | 0.742 | 0.763 | 0.753 |
WDBC, Wisconsin diagnostic breast cancer dataset; LBPS, lower back pain symptoms dataset; GA-IPSO-CSRBF, cost-sensitive RBF-NN optimized by GA and IPSO algorithm; ACC, accuracy.
GA-IPSO-CSRBF compare Adaboost, Logitboost, Bagging, and Voting in terms of ACC.
Table 6 further compares the performance of GA-IPSO-CSRBF, adaboost, logitboost, bagging, and voting in terms of AUC. As shown in Table 6, the AUC values of our proposed algorithm are larger than other ensemble algorithms for five datasets, except for the bagging for the WDBC dataset. But the performance of bagging is inferior to GA-IPSO-CSRBF for the other four datasets. So overall, our proposed algorithm still has the best performance comparison among the ensemble learning methods.
| Datasets | GA-IPSO-CSRBF | Adaboost | Logitboost | Bagging | Voting |
|---|---|---|---|---|---|
| WDBC | 0.990 | 0.989 | 0.969 | 0.993 | 0.980 |
| Breast cancer | 0.994 | 0.988 | 0.991 | 0.991 | 0.989 |
| Bupa | 0.724 | 0.641 | 0.438 | 0.630 | 0.682 |
| Pima | 0.801 | 0.746 | 0.653 | 0.735 | 0.754 |
| LBPS | 0.885 | 0.849 | 0.759 | 0.843 | 0.839 |
WDBC, Wisconsin diagnostic breast cancer dataset; LBPS, lower back pain symptoms dataset; GA-IPSO-CSRBF, cost-sensitive RBF-NN optimized by GA and IPSO algorithm; AUC, area under curve.
GA-IPSO-CSRBF compare Adaboost, Logitboost, Bagging, and Voting in terms of AUC.
Figure 5 demonstrates the ROC curves for GA-IPSO-CSRBF compare to adaboost, logitboost, bagging, and voting based on the five datasets. In other words, the proposed GA-IPSO-CSRBF algorithm is more robust than several other ensemble methods, so it can make more reliable decisions on medical diagnostic problems based on imbalanced data.
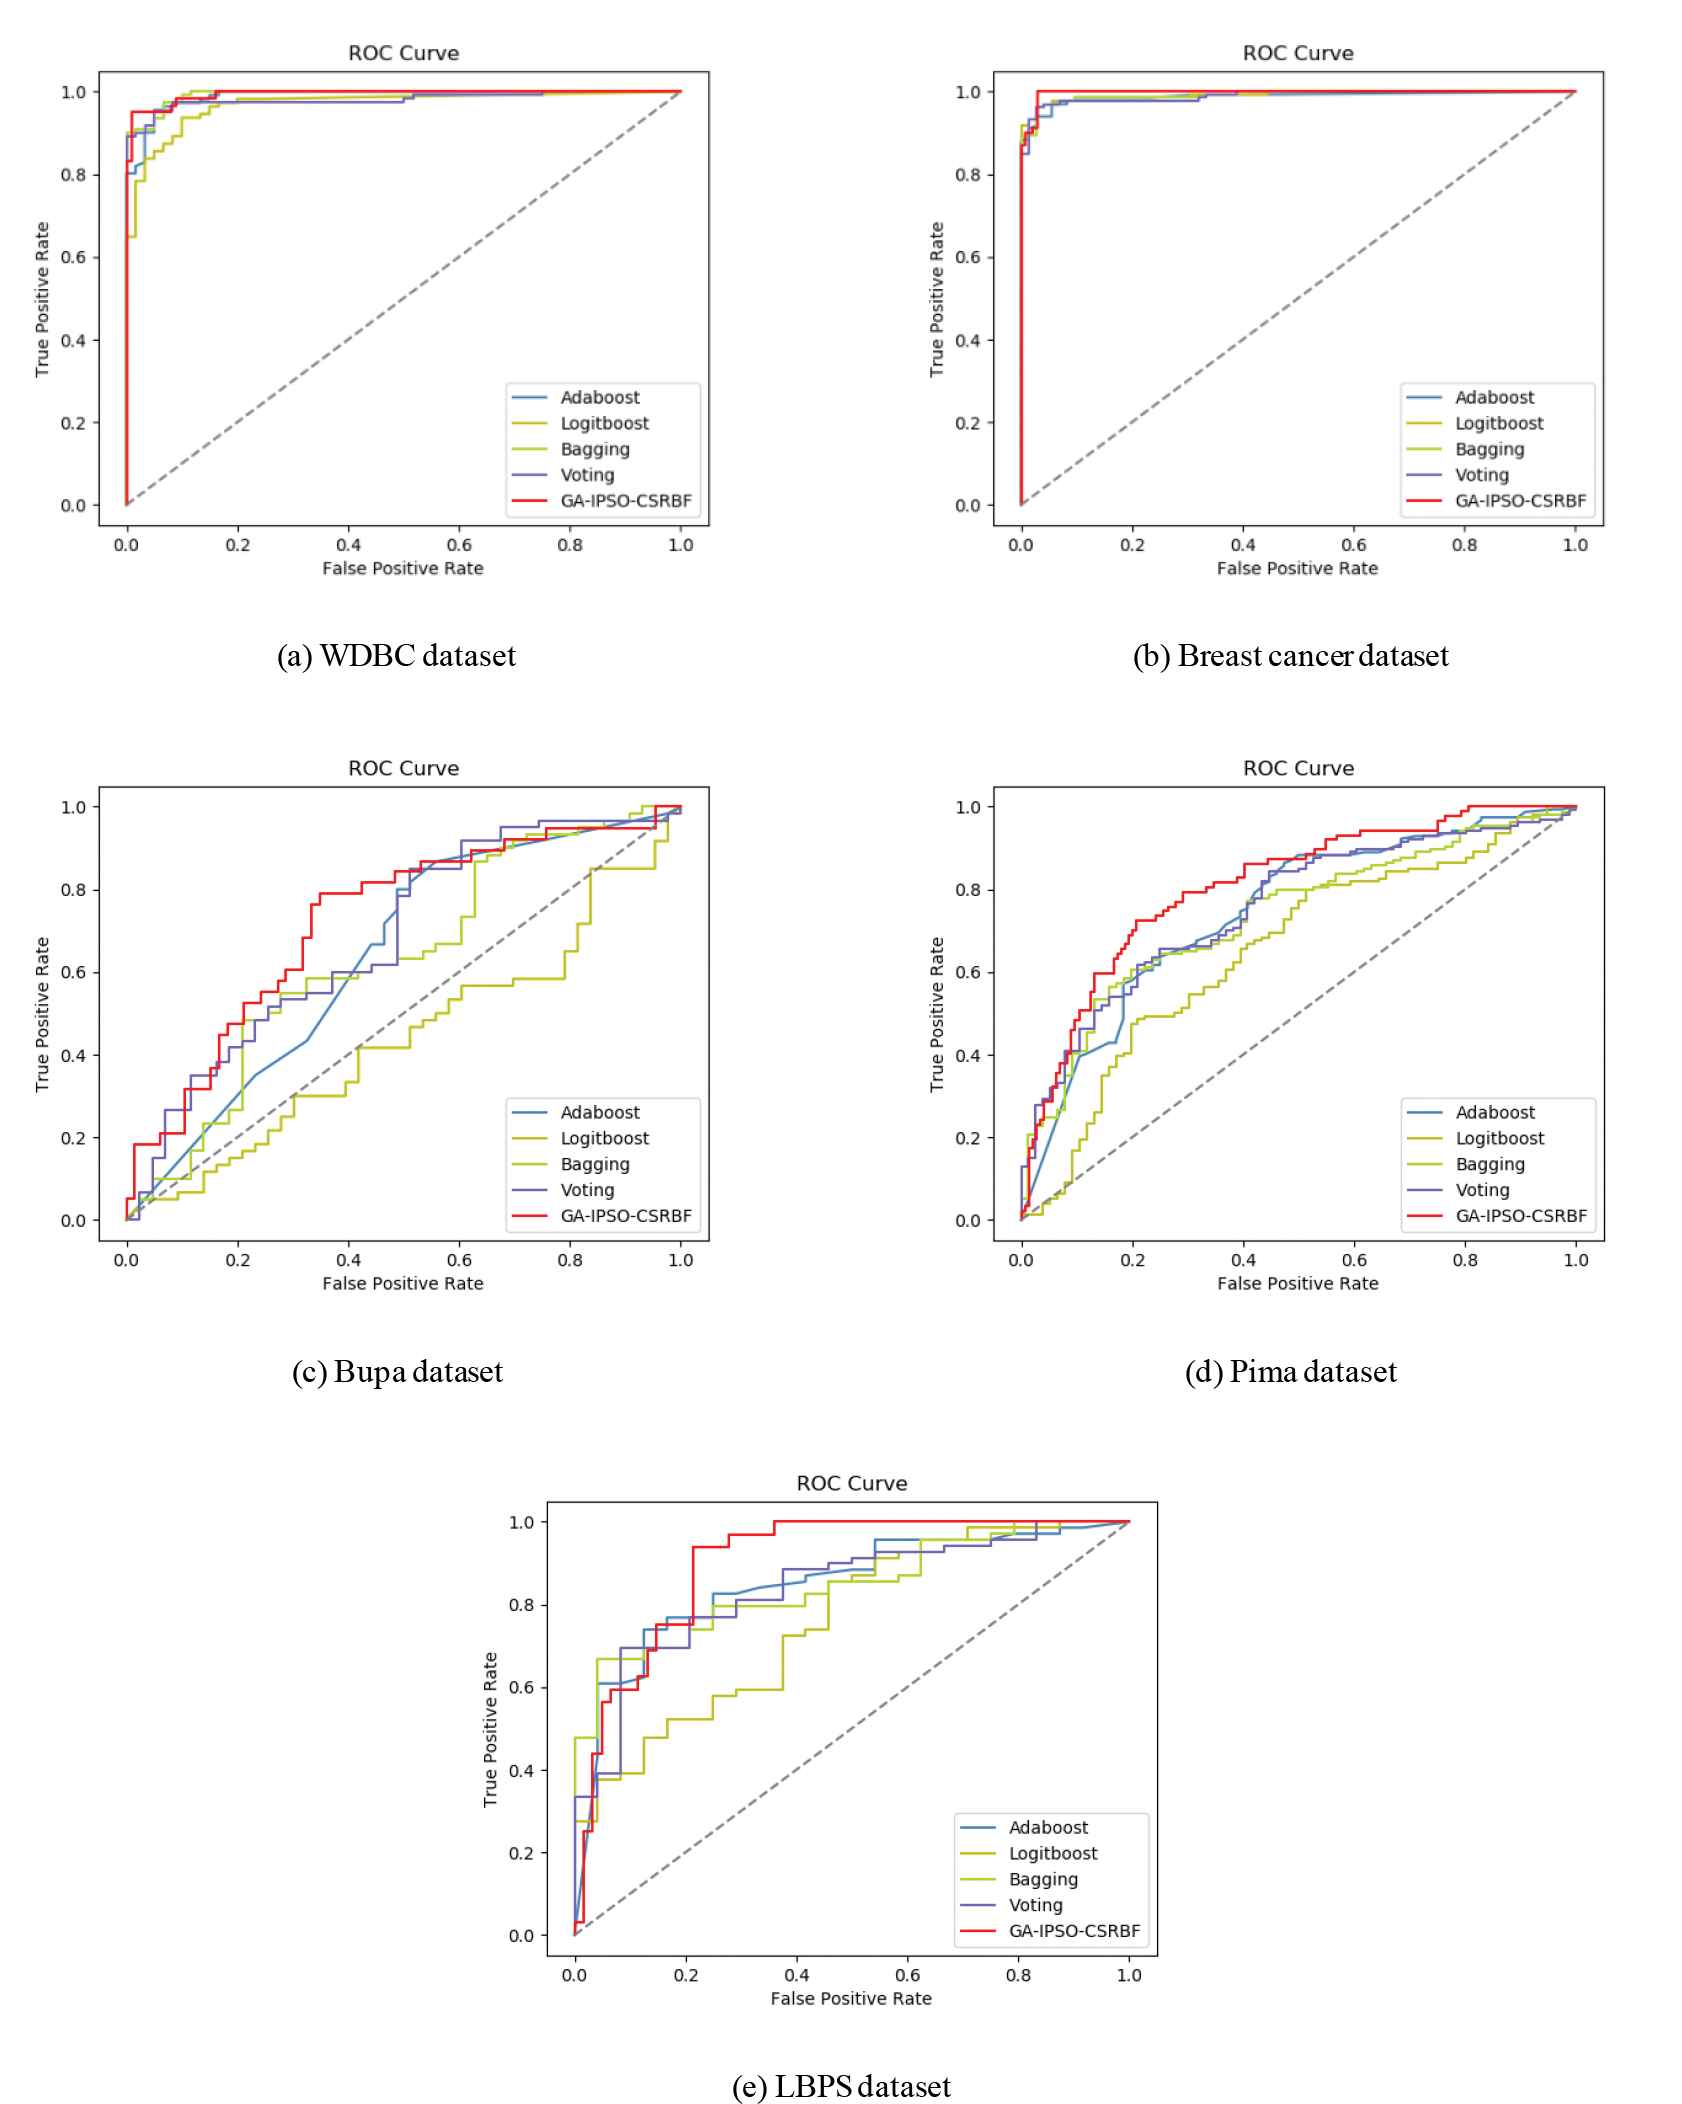
The receiver operator characteristic (ROC) curves for cost-sensitive RBF-NN optimized by GA and IPSO (GA-IPSO-CSRBF) compare to Adaboost, Logitboost, Bagging, and Voting based on the five datasets.
4.4.3. Comparison with different non-cost-sensitive single classifiers
Table 7 presents a comparison of our GA-IPSO-CSRBF algorithm with KNN, SVM, and C4.5 in term of ACC on the five datasets. We can see from Table 7 that the proposed GA-IPSO-CSRBF outperforms the other three algorithms as a whole. Closer inspection of the Table 7 shows compared with KNN method, the GA-IPSO-CSRBF method achieves a slightly inferior performance on breast cancer dataset with average results of 96.4% ACC. But its performance is significantly better than KNN on other four datasets. This shows that the GA-IPSO-CSRBF method is generally better than KNN.
| Datasets | GA-IPSO-CSRBF | KNN | SVM | C4.5 |
|---|---|---|---|---|
| WDBC | 0.957 | 0.953 | 0.649 | 0.947 |
| Breast cancer | 0.964 | 0.966 | 0.941 | 0.902 |
| Bupa | 0.684 | 0.641 | 0.592 | 0.667 |
| Pima | 0.744 | 0.722 | 0.669 | 0.726 |
| LBPS | 0.809 | 0.634 | 0.742 | 0.796 |
WDBC, Wisconsin diagnostic breast cancer dataset; LBPS, lower back pain symptoms dataset; GA-IPSO-CSRBF, cost-sensitive RBF-NN optimized by GA and IPSO algorithm; KNN, k-nearest neighbor; SVM, support vector machine; ACC, accuracy.
GA-IPSO-CSRBF compare KNN, SVM, and C4.5 in terms of ACC.
AUC performance results of GA-IPSO-CSRBF, KNN, SVM, and C4.5 are shown in Table 8. From these compared results, we can see that our GA-IPSO-CSRBF classifier achieves the best performance among all of the algorithms used to compare. On the contrary, due to the imbalance of the data distribution, the AUC value of SVM is only 0.5 for the WDBC and Pima datasets, which is the lowest in the compared classifier.
| Datasets | GA-IPSO-CSRBF | KNN | SVM | C4.5 |
|---|---|---|---|---|
| WDBC | 0.990 | 0.949 | 0.500 | 0.949 |
| Breast cancer | 0.994 | 0.981 | 0.952 | 0.931 |
| Bupa | 0.724 | 0.626 | 0.512 | 0.638 |
| Pima | 0.801 | 0.676 | 0.500 | 0.673 |
| LBPS | 0.885 | 0.591 | 0.500 | 0.601 |
WDBC, Wisconsin diagnostic breast cancer dataset; LBPS, lower back pain symptoms dataset; GA-IPSO-CSRBF, cost-sensitive RBF-NN optimized by GA and IPSO algorithm; KNN, k-nearest neighbor; SVM, support vector machine; AUC, area under curve.
GA-IPSO-CSRBF compare KNN, SVM, and C4.5 in terms of AUC.
To further evaluate the robustness of our method to imbalanced data, we compare it with the other three common methods, including KNN, SVM, and C4.5 regard to the ROC curves. Figure 6 shows the ROC curves based on the five datasets. As shown in Figure 6, the proposed GA-IPSO-CSRBF classifier has demonstrated obvious advantages compared to other three common classifiers. This means that our GA-IPSO-CSRBF performs better than KNN, SVM, and C4.5 in processing imbalanced data of medical diagnosis.
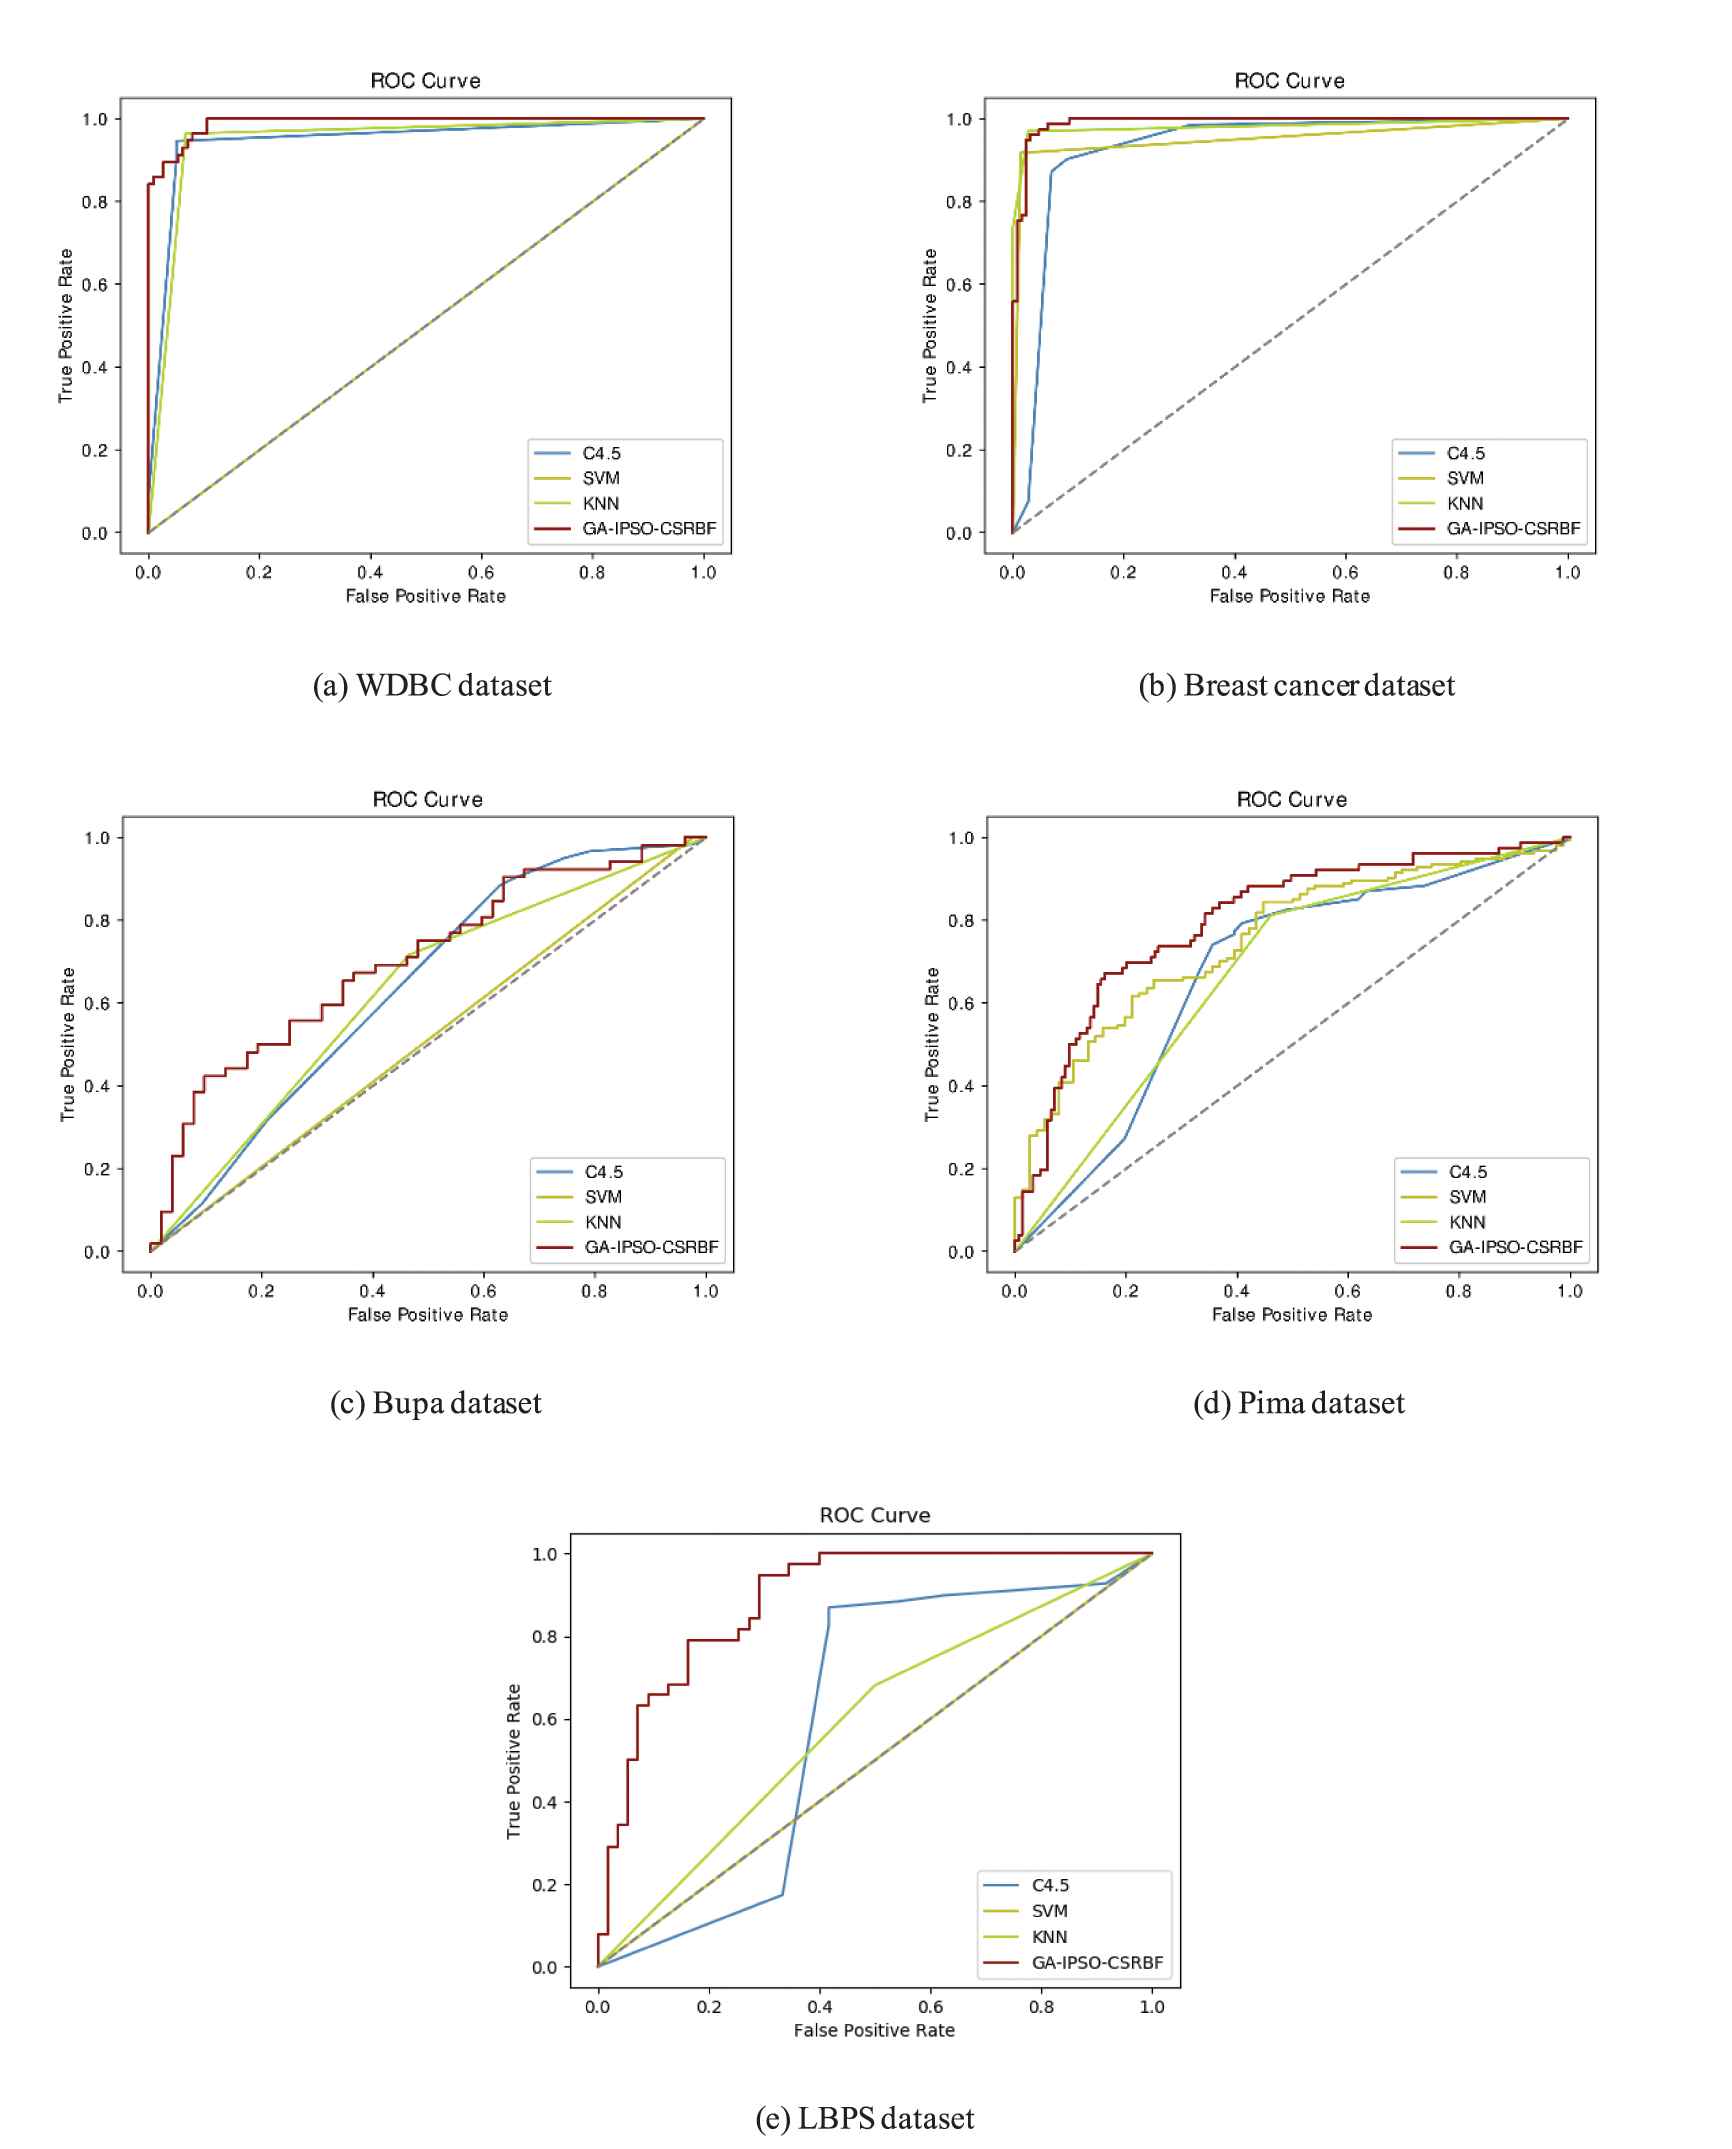
The receiver operator characteristic (ROC) curves for cost-sensitive RBF-NN optimized by GA and IPSO (GA-IPSO-CSRBF) compared to C4.5, support vector machine (SVM), and k-nearest neighbor (KNN) based on the five datasets.
4.5. Discussion
From the above experimental results, it can be seen that our GA-IPSO-CSRBF algorithm not only has a higher accuracy, but also has a larger AUC value than other comparison methods for five different imbalanced medical datasets. This shows that the proposed algorithm can improve the recognition of minority class while taking into account the overall classification accuracy. The reasons are as follows: firstly, we set a larger misclassification cost for the minority class, which makes the proposed algorithm pay more attention to the minority class. Moreover, the objective function of GA-IPSO-CSRBF is to minimize the total misclassification cost, which ensures the overall performance. Thirdly, the misclassification cost of the minority class is set to the imbalanced rate so that the proposed algorithm can adapt to datasets with different sample distributions.
For medical data, the cost of misclassification of minority samples (positive samples) is often higher. The cost of misclassifying a patient as a healthy person is far greater than the cost of misclassifying a healthy person as a patient. GA-IPSO-CSRBF can give more attention to the minority samples and at the same time obtain a good overall performance, so it is more suitable for imbalanced medical data than other comparison algorithms.
5. CONCLUSIONS
In this research, we propose an evolutionary self-organizing cost-sensitive RBF-NN which are jointly optimized by GA and IPSO to handle medical imbalanced data. This method can adaptively optimize both the structure and parameters of cost-sensitive RBF-NN simultaneously. The effectiveness of our proposed approach is tested on five imbalanced medical diagnosis datasets. The experimental results indicate that the proposed model is superior to other comparison methods in terms of accuracy and AUC.
For different medical diagnosis datasets, the proposed model can adaptively generate appropriate structure and parameters of RBF-NN. The cost-sensitive fitness function allows it can more focus on the minority class samples with higher cost of misclassification while taking into account the overall classification accuracy, so it can effectively improve the accuracy of medical diagnosis and reduce the error rate of medical decisions. Moreover, our proposed algorithm has a higher AUC value than other methods, indicating that it has better robustness for processing imbalanced data for medical diagnosis, which is crucial for both doctors and patients.
Although our research has made some progress, there is still much room for improvement in the future. Future research can try to use other representative computational intelligence methods to solve this problem, such as monarch butterfly optimization (MBO) [50], earthworm optimization algorithm (EWA) [51], elephant herding optimization (EHO) [52], and moth search (MS) algorithm [53].
CONFLICTS OF INTEREST
The authors declare no conflicts of interest.
AUTHORS' CONTRIBUTIONS
All authors contributed to the work, and all authors read and approved the final manuscript.
Funding Statement
This research is supported by the National Natural Science Foundation of China (Grant No.: 71571105).
ACKNOWLEDGMENTS
We sincerely thank all reviewers and editors for their careful work and considerations on this paper.
REFERENCES
Cite this article
TY  - JOUR
AU  - Jia-Chao Wu
AU  - Jiang Shen
AU  - Man Xu
AU  - Fu-Sheng Liu
PY  - 2020
DA  - 2020/10/19
TI  - An Evolutionary Self-organizing Cost-Sensitive Radial Basis Function Neural Network to Deal with Imbalanced Data in Medical Diagnosis
JO  - International Journal of Computational Intelligence Systems
SP  - 1608
EP  - 1618
VL  - 13
IS  - 1
SN  - 1875-6883
UR  - https://doi.org/10.2991/ijcis.d.201012.005
DO  - 10.2991/ijcis.d.201012.005
ID  - Wu2020
ER  -