
Link Prediction in Social Networks by Neutrosophic Graph
 , Sovan Samanta2, *, , Madhumangal Pal1, , Qin Xin3,
 - DOI
- 10.2991/ijcis.d.201015.002How to use a DOI?
- Keywords
- Social network; Neutrosophic graph; Link prediction; Modified RSM index
- Abstract
The computation of link prediction is one of the most important tasks on a social network. Several methods are available in the literature to predict links in networks and RSM index is one of them. The RSM index is applicable in the fuzzy environment and it does not incorporate the notion of falsity and indecency parameters which occur frequently in uncertain environments. In the present method, the behaviors of the common neighbor and the other parameters, like nature of job, location, etc., are considered. In this paper, more parameters are included in the RSM index for making it more flexible and realistic and it is best fitted in the neutrosophic environment. Many important properties are studied for this modified RSM index. A small network from Facebook is considered to illustrate the problem.
- Copyright
- © 2020 The Authors. Published by Atlantis Press B.V.
- Open Access
- This is an open access article distributed under the CC BY-NC 4.0 license (http://creativecommons.org/licenses/by-nc/4.0/).
1. INTRODUCTION
Nowadays, the use of social networks [1] are progressing very fast. Social networks can be used for many purposes. Many types of social networks are available. These social networks are prepared to grow their business rapidly, and hence the providers of social networks try to increase their networks.
Over the past few years, online social networking has exploded in popularity as a means for people to share information and build connections with others. For communication, marketing, and spreading of news, etc., it becomes a vital instrument. In the social network market, there is a substantial competitive situation, so all social network organizations are trying to enhance their networks' popularity. So popularity directly depends on how many users and edges/relationship are there between users. In social networks, it is essential to know how to improve the number of edges.
A user of a social network wants to connect to another user by nature of the user, therefore, at first, he/she gathers some information like common friends, personality, age, sex, educational background, job and living area.
It is analyzed that the personalities of common friends are proportional to build a link between to unknown friends. There are lots of graph-theoretic measures for link prediction. However, the given data in social networks are not precise all the times. Fuzzy systems capture these uncertainties with a degree of memberships. So, the fuzzy graph gives a more effective result for this calculation. Samanta and Pal [2–5] introduced many types of fuzzy graphs. Mahapatra et al. [6–8] presented many applications of the fuzzy graph.
It is a common research topic in social networks on how to improve the number of edges in networks, and many types of methods are used to increase links. Nowell et al. [9] introduced common neighbor (CN) methods of link prediction and it is modified as Jaccard's coefficient [10]. Sorensen [11] introduced Sorensen Index. Adamic/Adar (AA) index was introduced by Adamic and Adar [12].
Almost all the link prediction methods are calculated on the basis of the neighbors. The prediction score for links is based on the number of neighbors. If the number of neighbors increases, the probability of predicting links will also increase. Yet neighbors' behavior is essential. But, in link prediction calculation nature of common neighbor plays a vital role. Mahapatra et al. [13] introduced RSM index for link prediction calculation depending on the nature of common neighbor in the fuzzy graph.
Though capturing false data is a research question, some times, data are displayed with falsity and indeterminacy. The number of friends of person may be assumed as true value. But the number of inactive or fake friends may be assumed as falsity. Sometimes data are not available or the data are contradicting the facts. In these cases, indeterminacy may be taken to capture the notions. All three values, true value, falsity, indeterminacy, are taken in neutrosophic graphs [14]. Manh Tuan et al. [15] proposed link prediction calculation by neutrosophic modelling. In these cases, too, the nature of common friends is ignored. Besides, there are some other realistic notions like locality, jobs, educations which have effect in link prediction calculation. In the proposed method, the RSM index has been updated with these notions in neutrosophic fuzzy environment. This article proposes an advanced idea of RSM index, modified RSM index.
Some Notations
All the basic notations are shown in Table 1.
| Notation | Meaning |
|---|---|
| Fuzzy graph | |
| Neutrosophic graph | |
| Vertex set | |
| Edge set | |
| True membership value, indeterminacy membership value, falsity membership value of the vertex |
|
| True membership value, indeterminacy membership value, falsity membership value of the edge |
|
| Set of neighbor of the vertex |
|
| Degree of vertex |
|
| True value, indeterminacy value, falsity value of nature of common neighbors | |
| Link prediction value between the vertices |
|
| True value, indeterminacy value, falsity value of the other parameters | |
| True value, indeterminacy value, falsity value of link prediction by modified RSM index | |
| Score of link prediction between the vertices |
Some basic notations.
2. PRELIMINARIES
A fuzzy graph
A neutrosophic set
A neutrosophic graph is an order pair
2.1. Link Prediction Methods
In a social network, two unknown users may be connect in future. Suppose in Figure 1 consider a small networks, at time
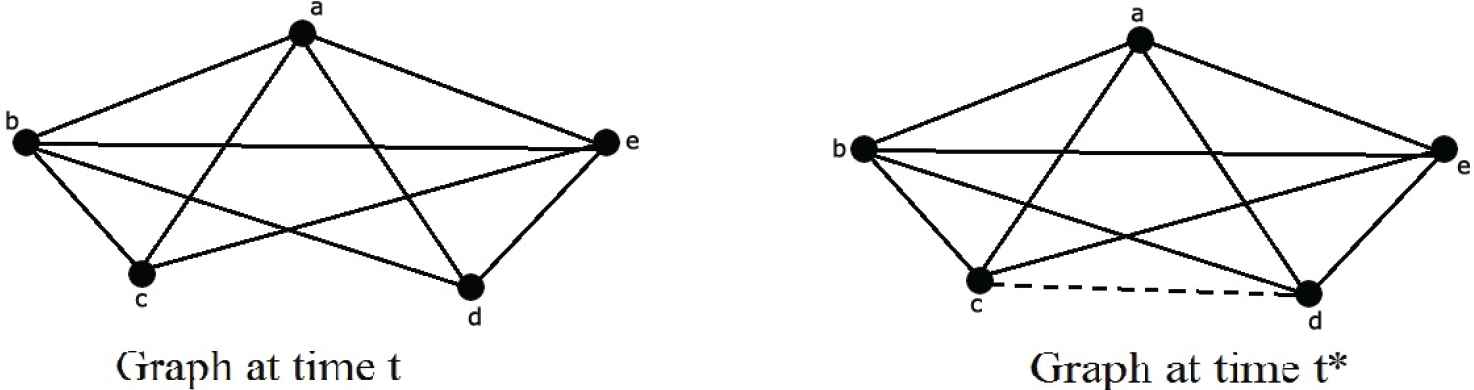
Example of link prediction.
Various types of link prediction methods are available, some of these are given below.
2.1.1. Common neighbors (CN)
CNs [9] methods directly depend on number of common neighbors. Suppose, set of neighbor of a vertex
2.1.2. Salton index
2.1.3. Jaccard index
Suppose, set of neighbor of a vertex
2.1.5. Hub promoted index
The link prediction value by Hub Promoted index [17] is defined as
2.1.6. Hub depressed index
The link prediction value by Hub Depressed index is defined as
2.1.7. Leicht-Holme-Newman index
The link prediction value by Leicht-Holme-Newman index [18] is defined as
2.1.8. Preferential attachment index
The link prediction value by Preferential Attachment index is defined as
2.1.9. AAdar index
The link prediction value by AA index [12] is defined as
2.1.10. Resource allocation index
The link prediction value by Resource Allocation index [19] is defined as
2.1.11. RSM index in fuzzy graph
The link prediction value by RSM index [13] in fuzzy graph is defined as
3. MODIFIED RSM INDEX FOR LINK PREDICTION
All above methods except “RSM index” are based on the number of neighbors. As a result, link prediction value depends on the number of neighbors. The number of common neighbors increases, then the probability of link prediction will be increase. However, the nature of neighbors is significant for the calculation of link prediction in “RSM index.” But, there are several other factors which are essential to predict the link between two unknown people. That is, despite no mutual friends, there are still chances to be linked between two unknown people based on other parameters like location, job, education, etc. In the proposed Modified RSM Index, link prediction value is calculated from nature of neighbor and a few other parameters in neutrosophic environment.
Now introduce the Modified RSM Index in neutrosophic environment-
Consider
Now, true value, indeterminacy value, falsity value of nature of common neighbors are denoted by
Also, consider the
Then the link prediction between
Score of link prediction by Modified RSM Index
3.1. Algorithm to Calculate Score of Link Prediction by the Neutrosophic Graph
Input:
Output:- Score of link prediction between two vertices
Step 1: Calculate true value, indeterminacy value, falsity value of nature of common neighbors (direct) between
Step 2: Calculate
Step 3: Calculate true value, indeterminacy value, falsity value of link prediction between
Step 4: Calculate the score of link prediction by Modified RSM Index is
Example 1.
Consider in Figure 2, a neutrosophic graph with five vertices and the vertices membership value are consider as in Table 2. Edges membership values are consider as in Table 3. Here, we consider three others parameters like (i) job, (ii) location, (iii) education. The membership value between of three parameters between
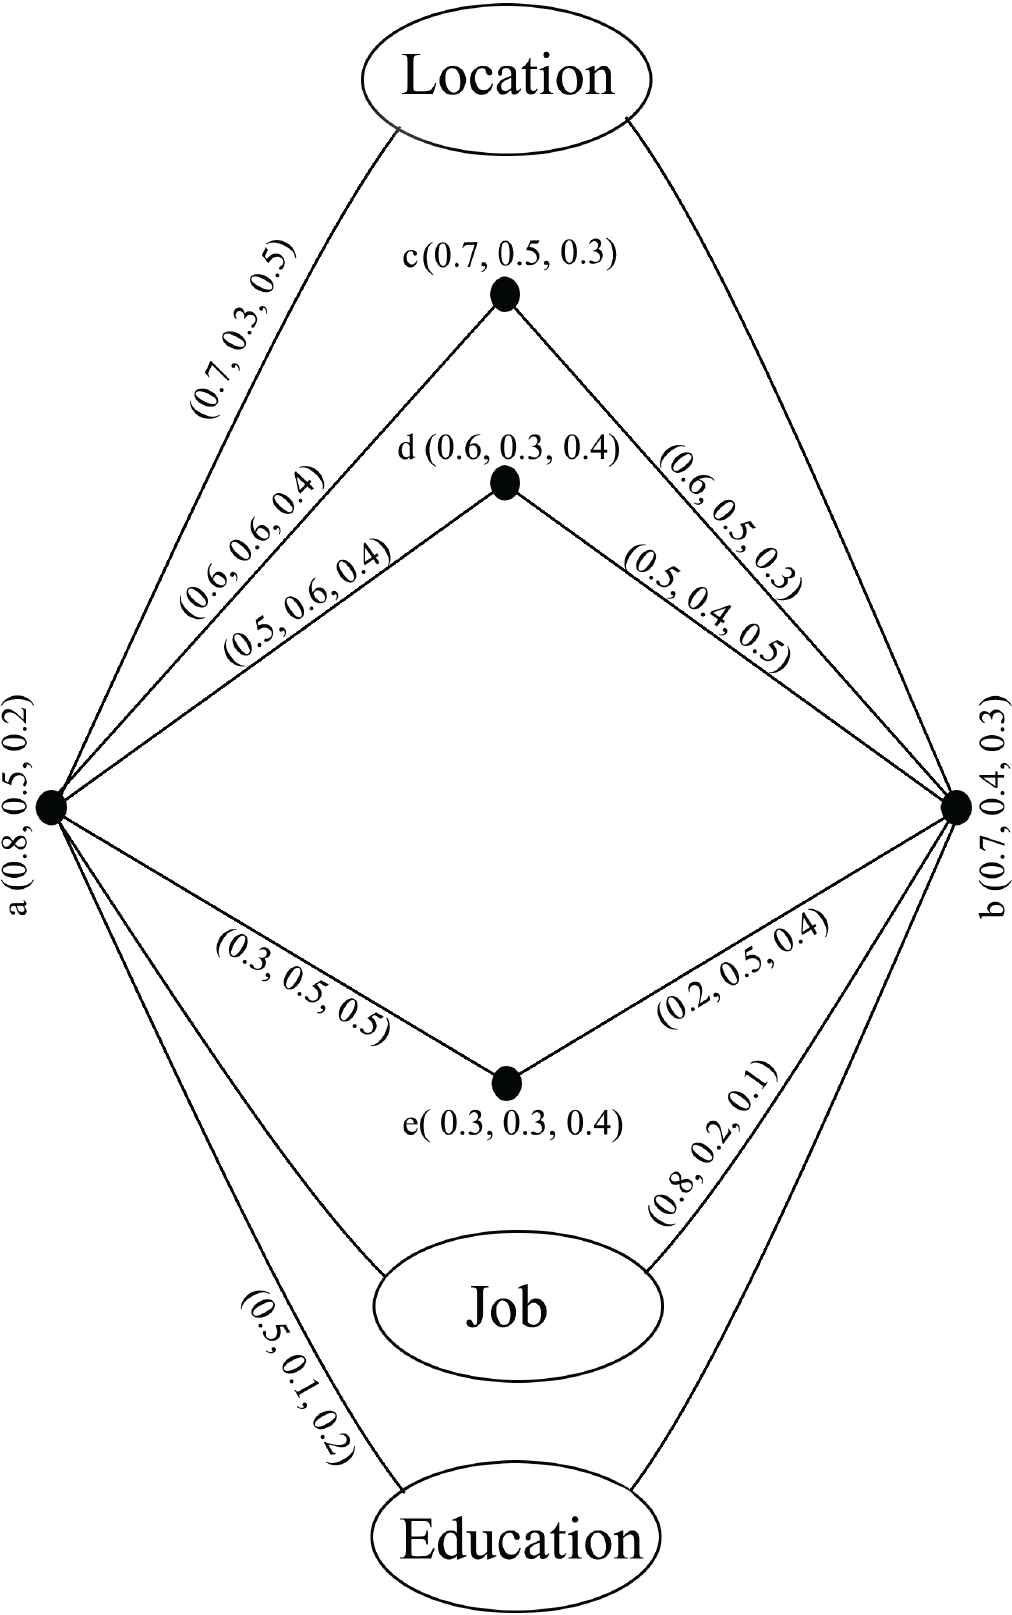
Link prediction by modified RSM index between the vertices a and b.
Similarly, nature of
Score of link prediction by modified RSM is
Lemma 1.
The value of nature of a vertex is not fixed.
Proof.
In Figure 3 a neutrosophic graph shown here
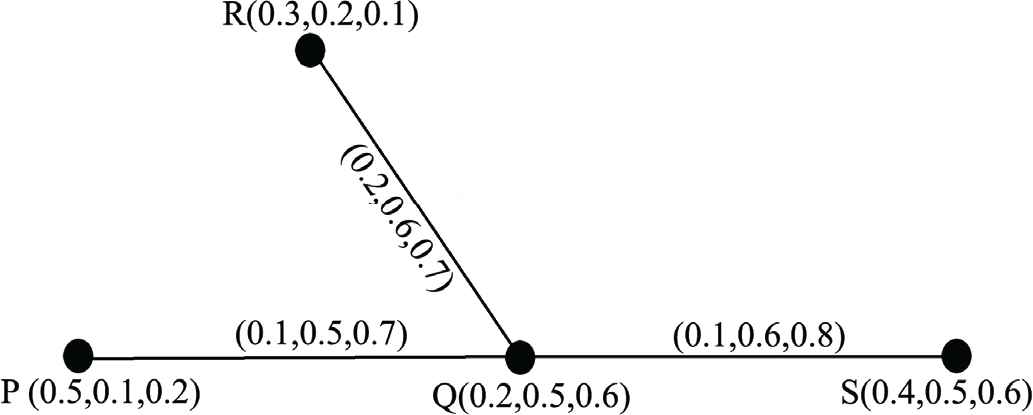
A neutrosophic graph.
| Vertex | Membership Value |
|---|---|
Vertex membership value of Figure 2.
| Edge | Membership Value | Edge | Membership Value |
|---|---|---|---|
Edges membership value of Figure 2.
Theorem 1.
Score of link prediction between
Proof.
The value of
So, the maximum value of
Also, the value of
Then
In the modified RSM index ignore the other parameter then following theorems hold.
Lemma 2.
Let
Proof.
In the Figure 4, consider
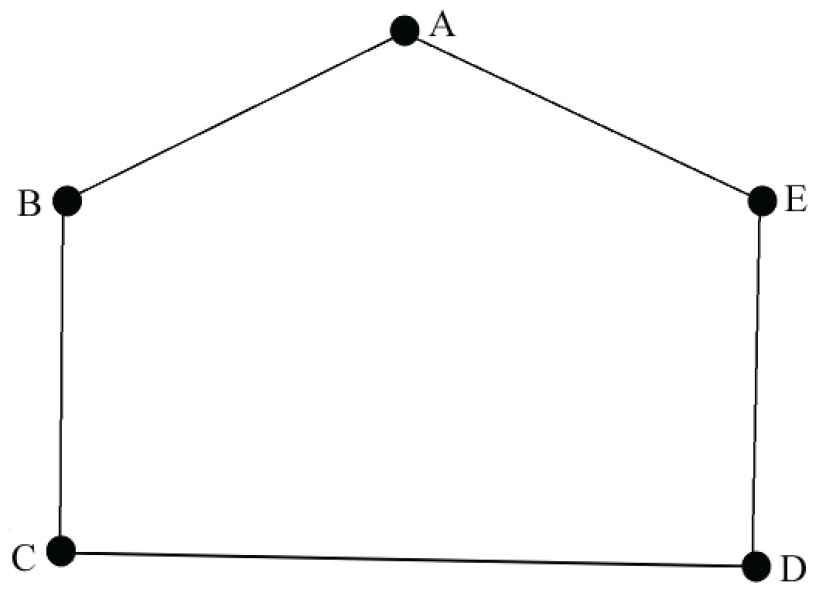
The link prediction for the neutrosophic cyclic graph.
Theorem 2.
Let
Proof.
In Figure 5, consider a star neutrosophic graph with the vertices
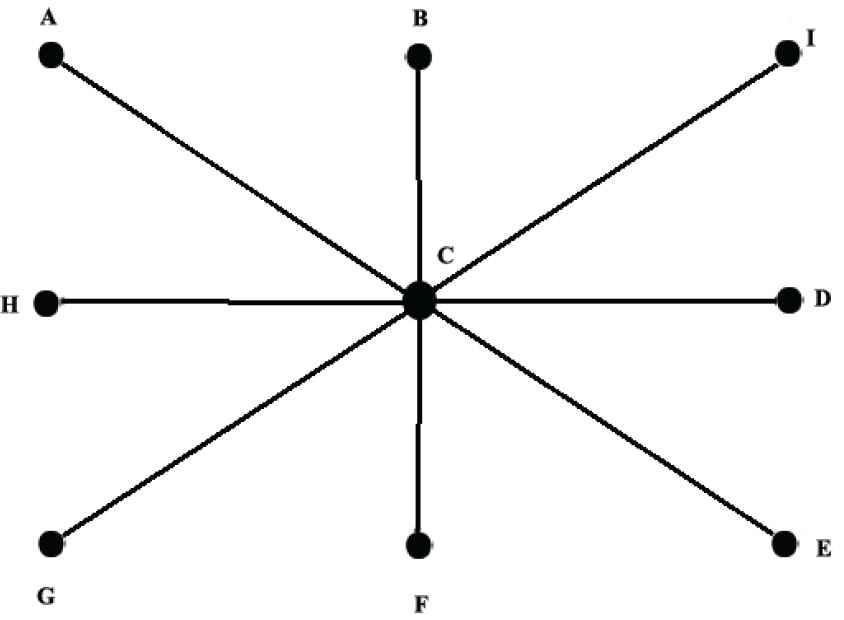
The link prediction for the neutrosophic star graph.
4. VERIFICATION OF MODIFIED RSM INDEX IN A SMALL NETWORK FROM FACEBOOK
Few data have been collected from Facebook, which is reflected in Figure 6. A small network of Facebook friends has been considered for the analysis of modified RSM index. All the users of Facebook have been considered as vertices of this network and there exists an edge between two vertices if they are friends in Facebook. Based on these data, a small network has been considered (see Figure 7). Figure 8 shows the mutual friend between two friends. In the considered network, few link-predicted measures have been shown by Modified RSM index. For the considered graph, vertex have true membership value, falsity and indeterminacy membership value. A total number of Facebook friends of a node are assumed as the indicator of true membership value. The normalized value is taken as true membership value of a vertex. Among Facebook friends, few friends are inactive. These friends indicate the falsity membership value of a vertex. The ratio of inactive friends to the total number of friends is assumed as falsity. The number of inactive friends is considered by calculating the “likes/comments” in the last five posts. Now, indeterminacy membership value of a vertex is taken as
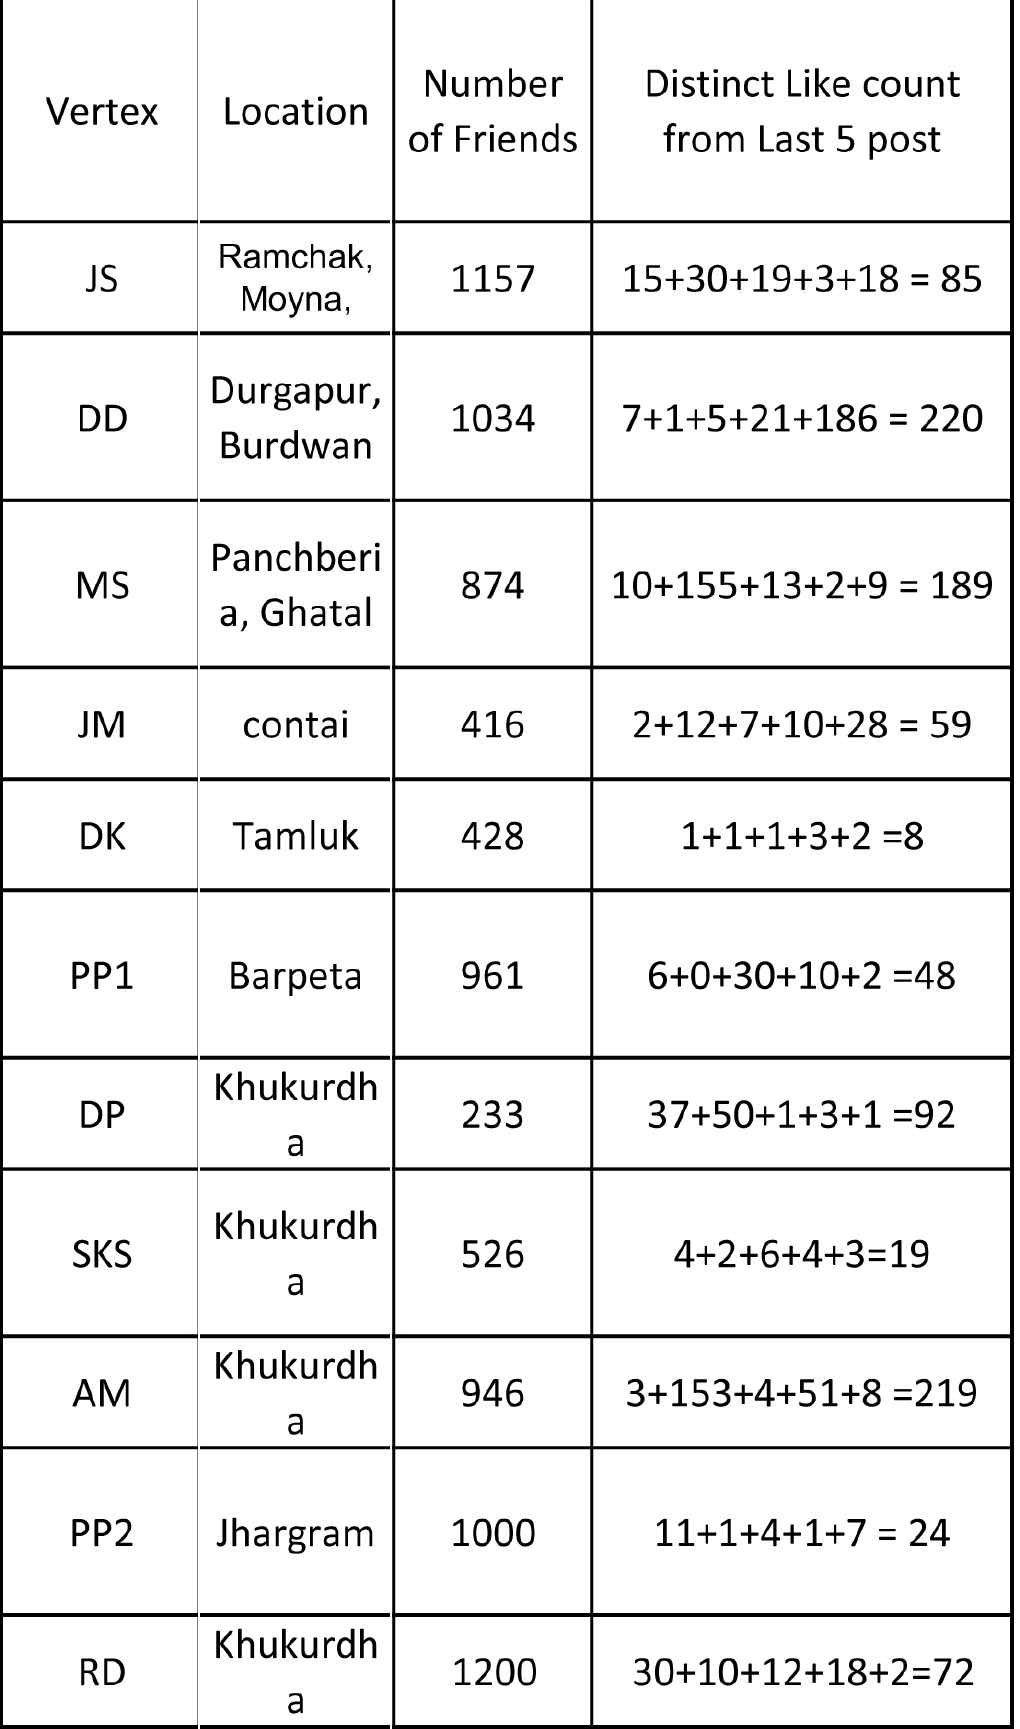
Source data, data taken from Facebook.

Source graph, data taken from Facebook.
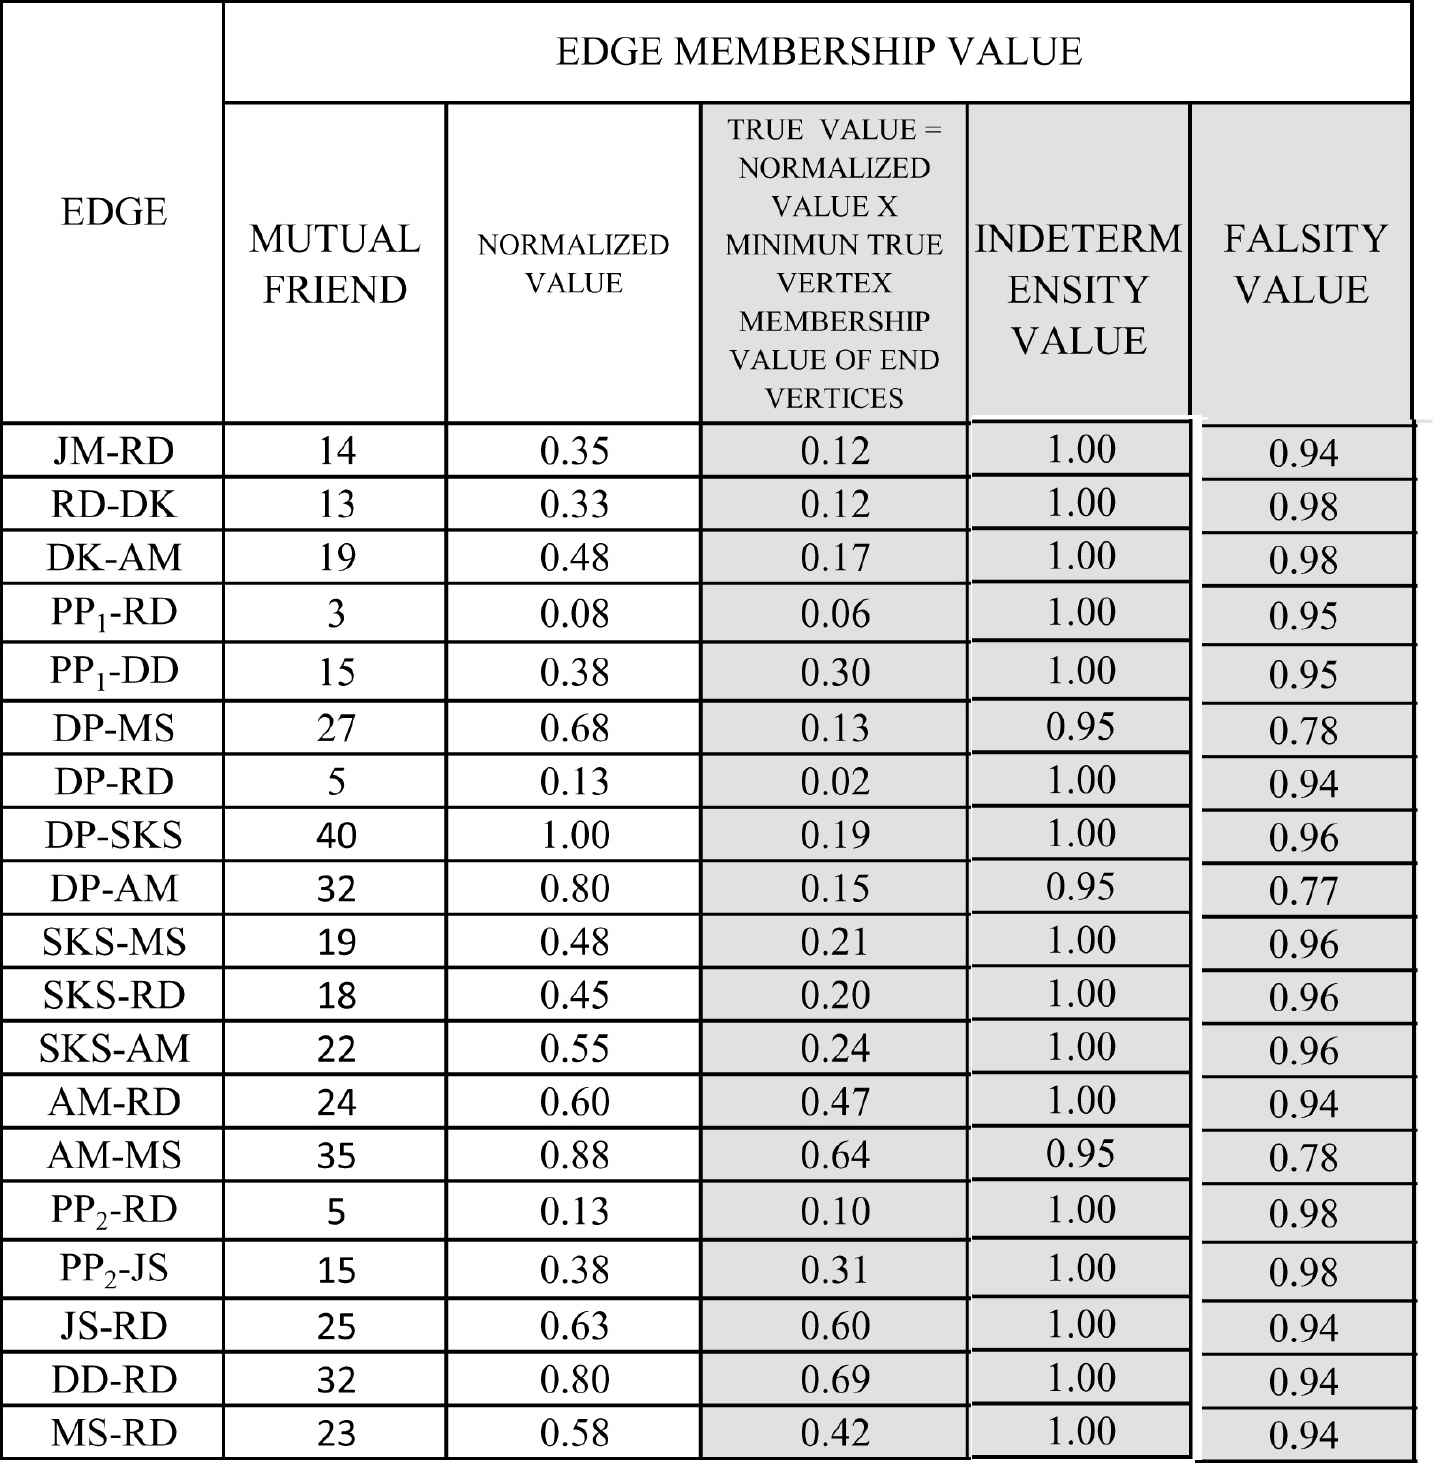
Calculation of edge membership value.

Calculation of vertex membership value.
The true membership value of an edge is calculated from the number of common friends. True membership value of an edge is “Normalized value of mutual friends
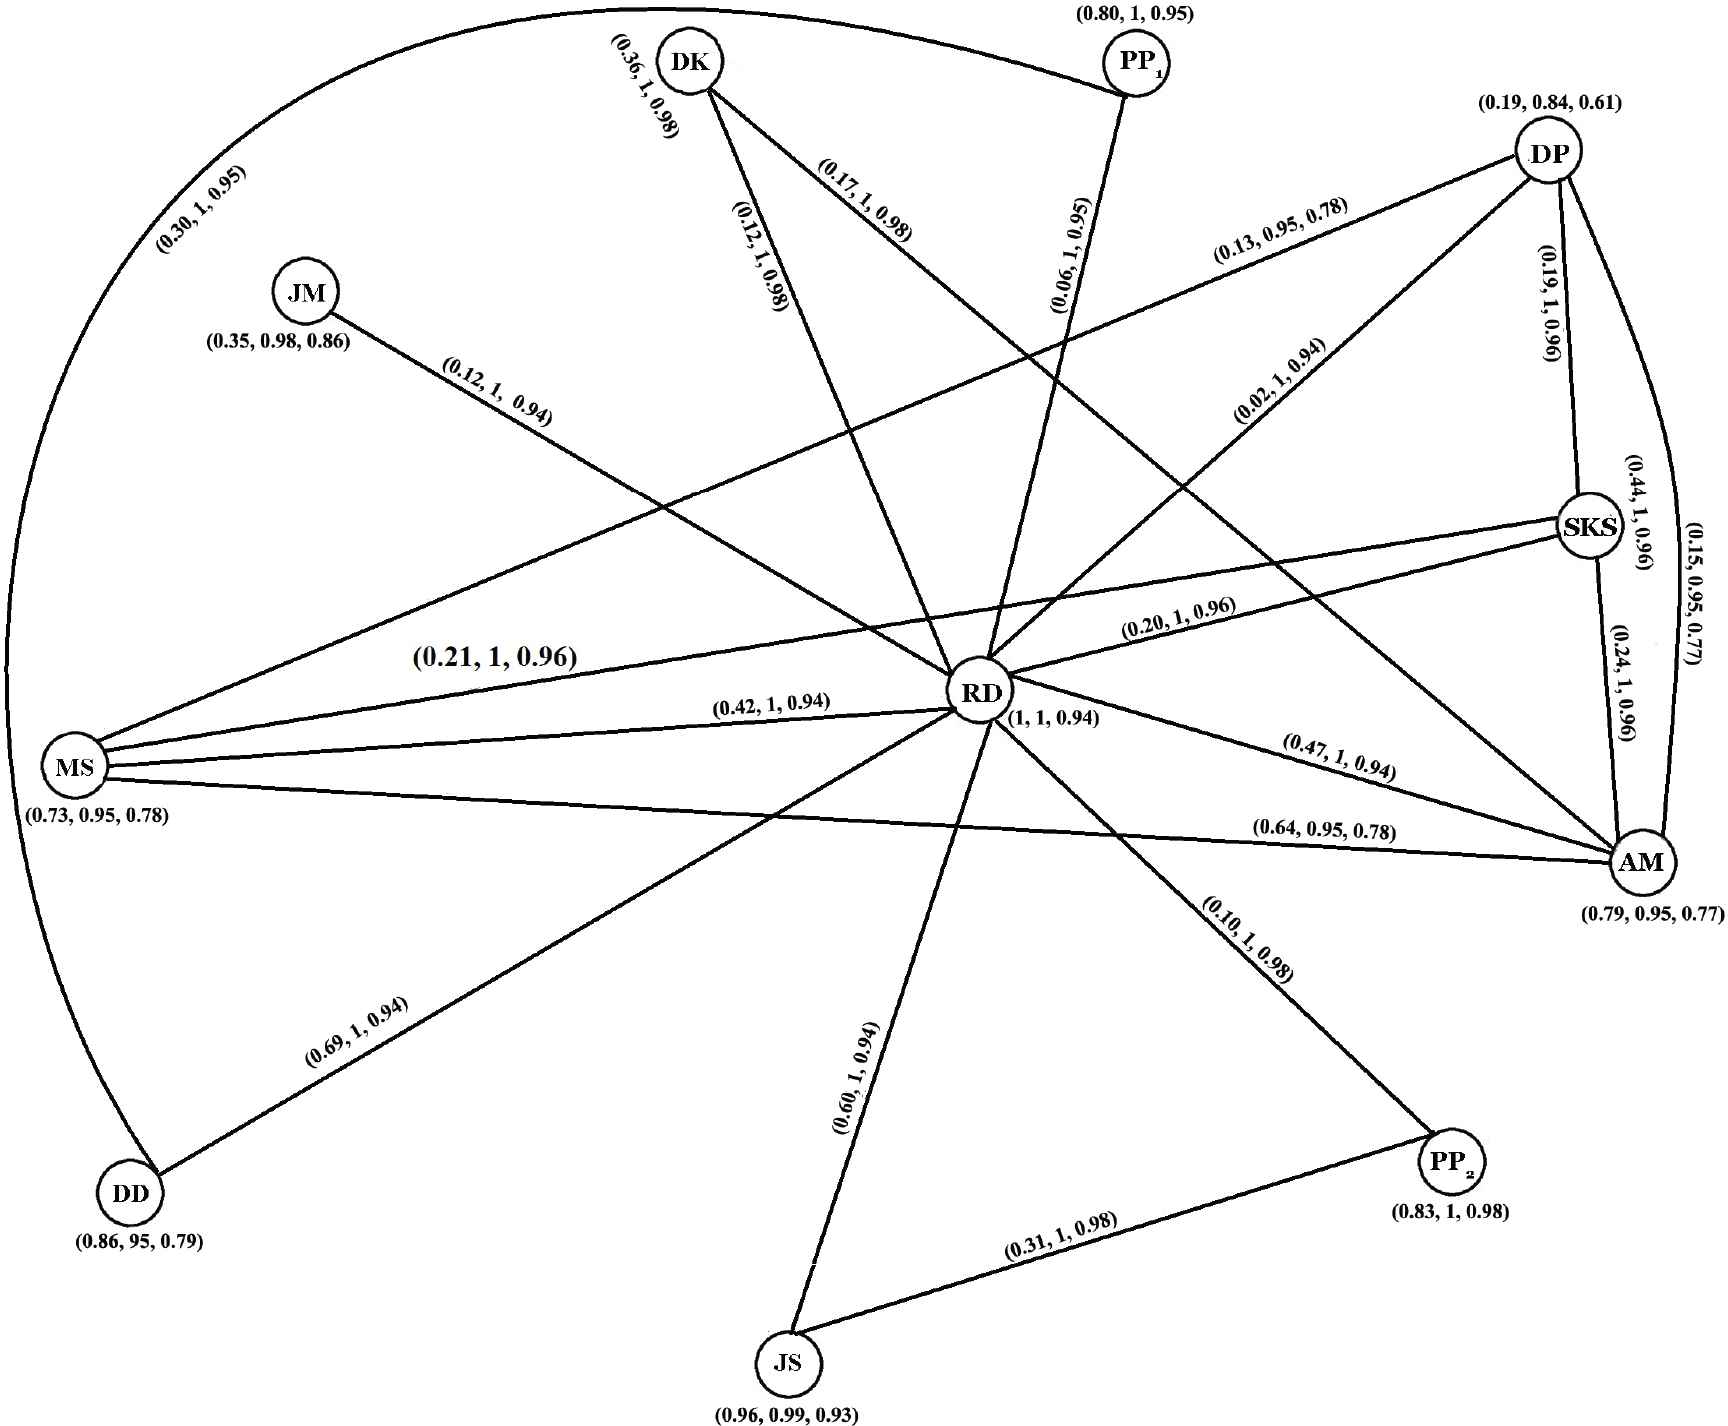
Neutrosophic graph of the source graph.
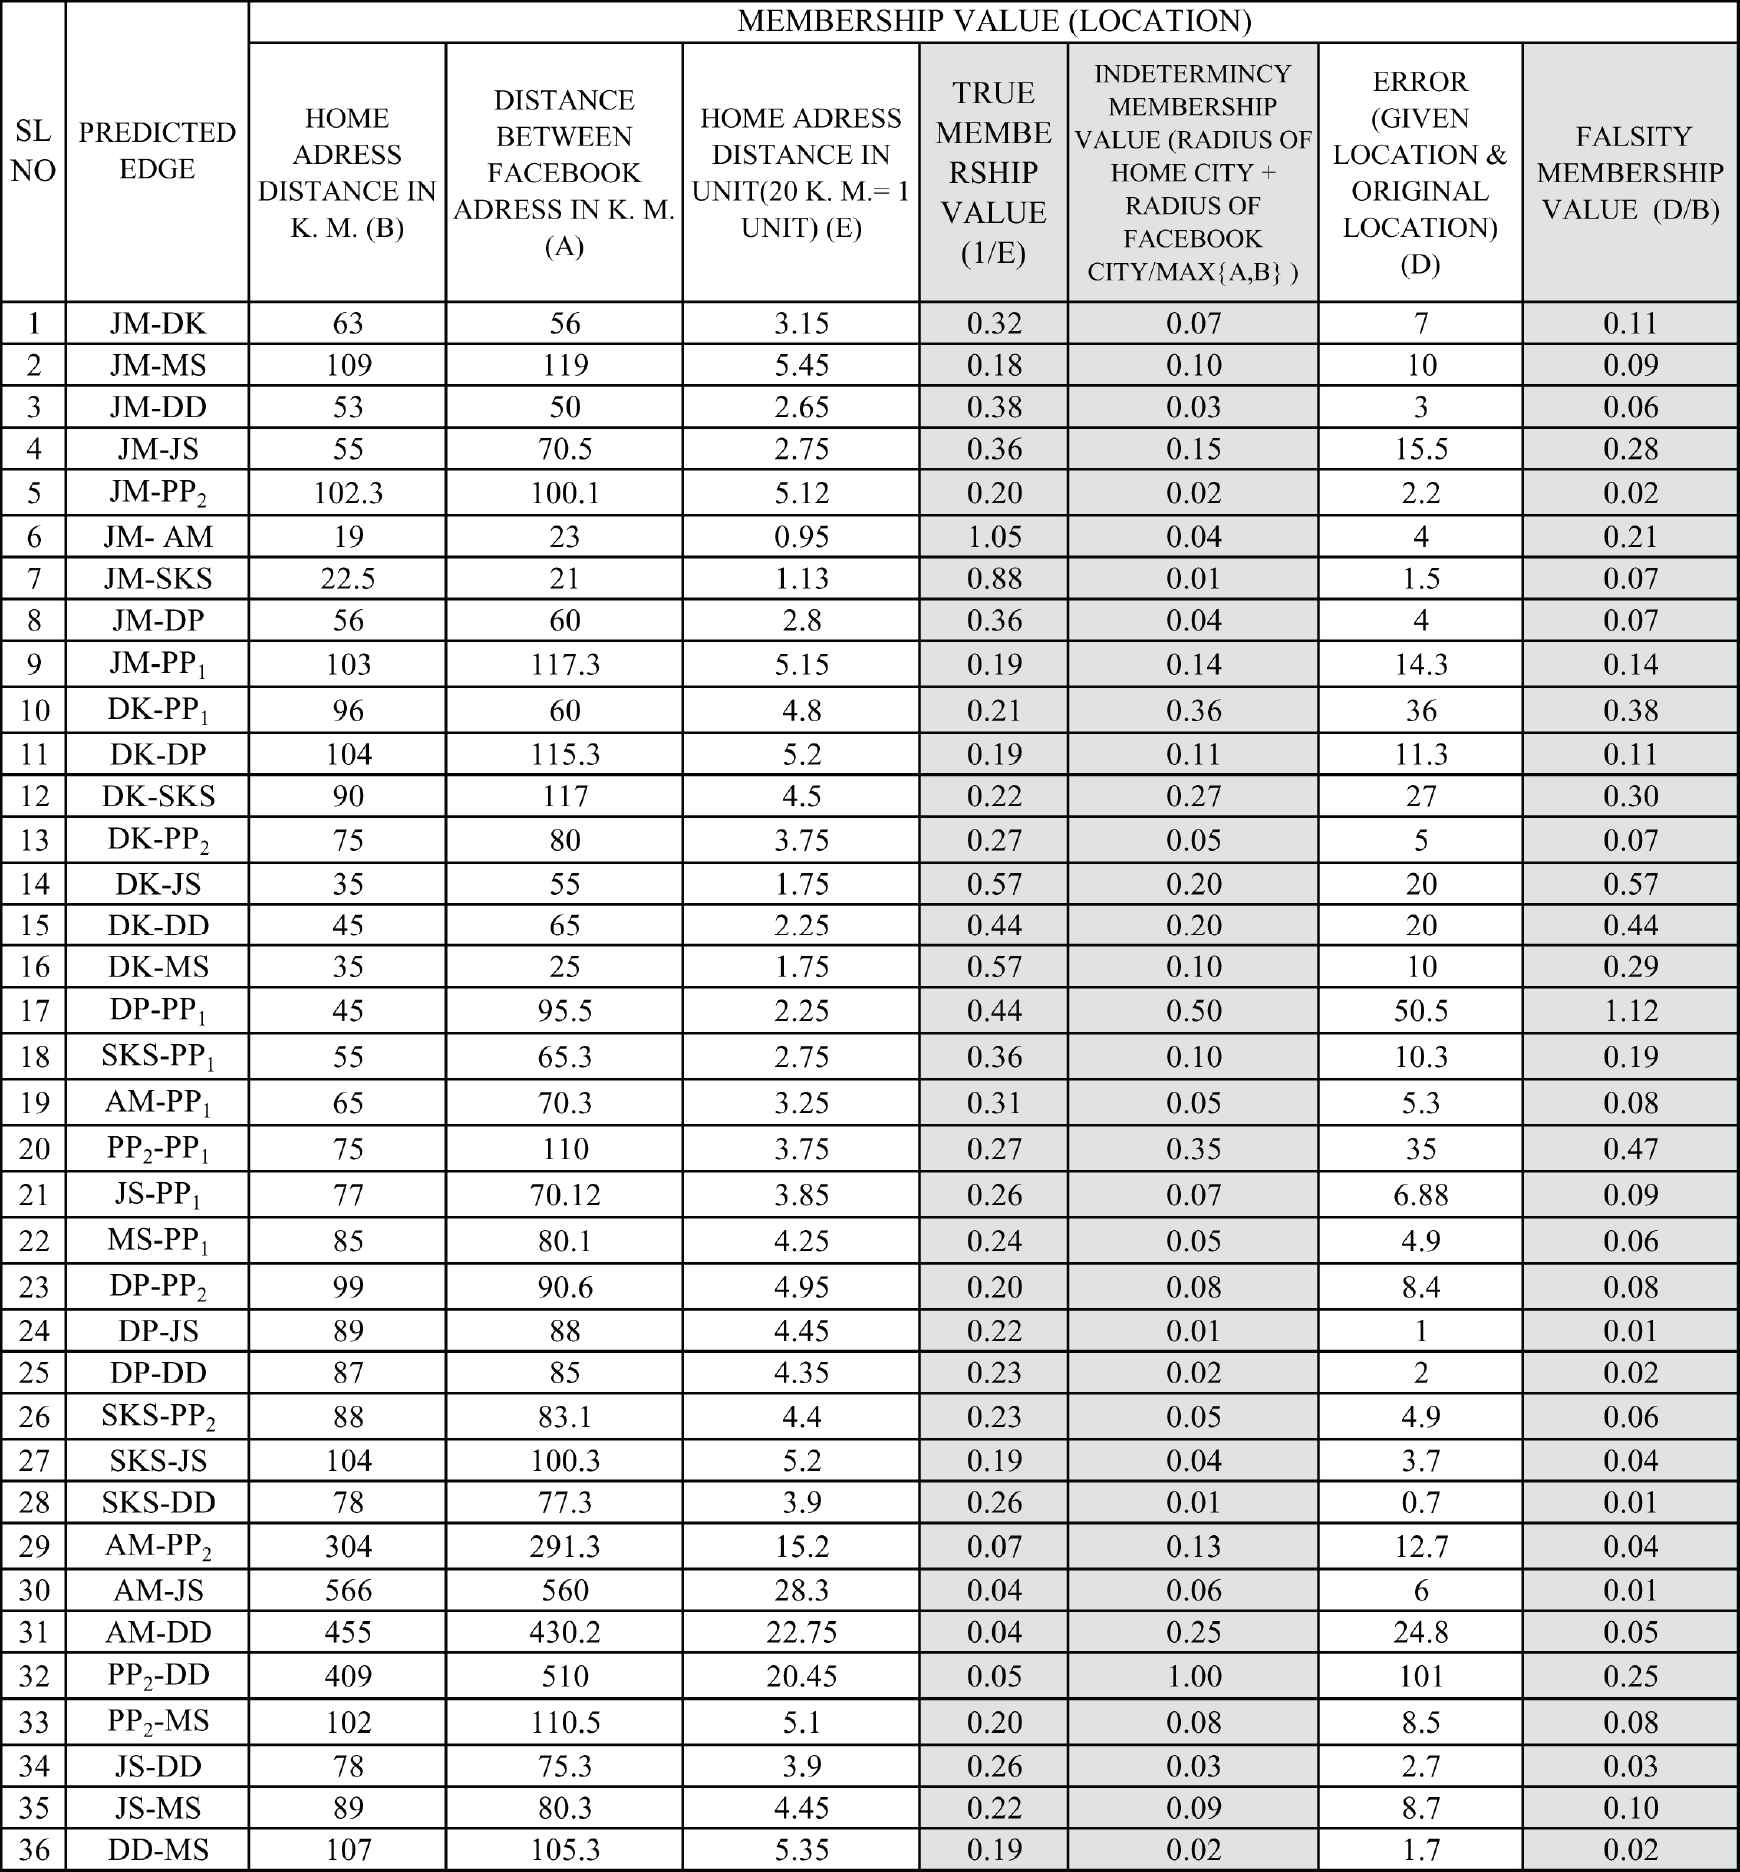
Calculation of location membership value.
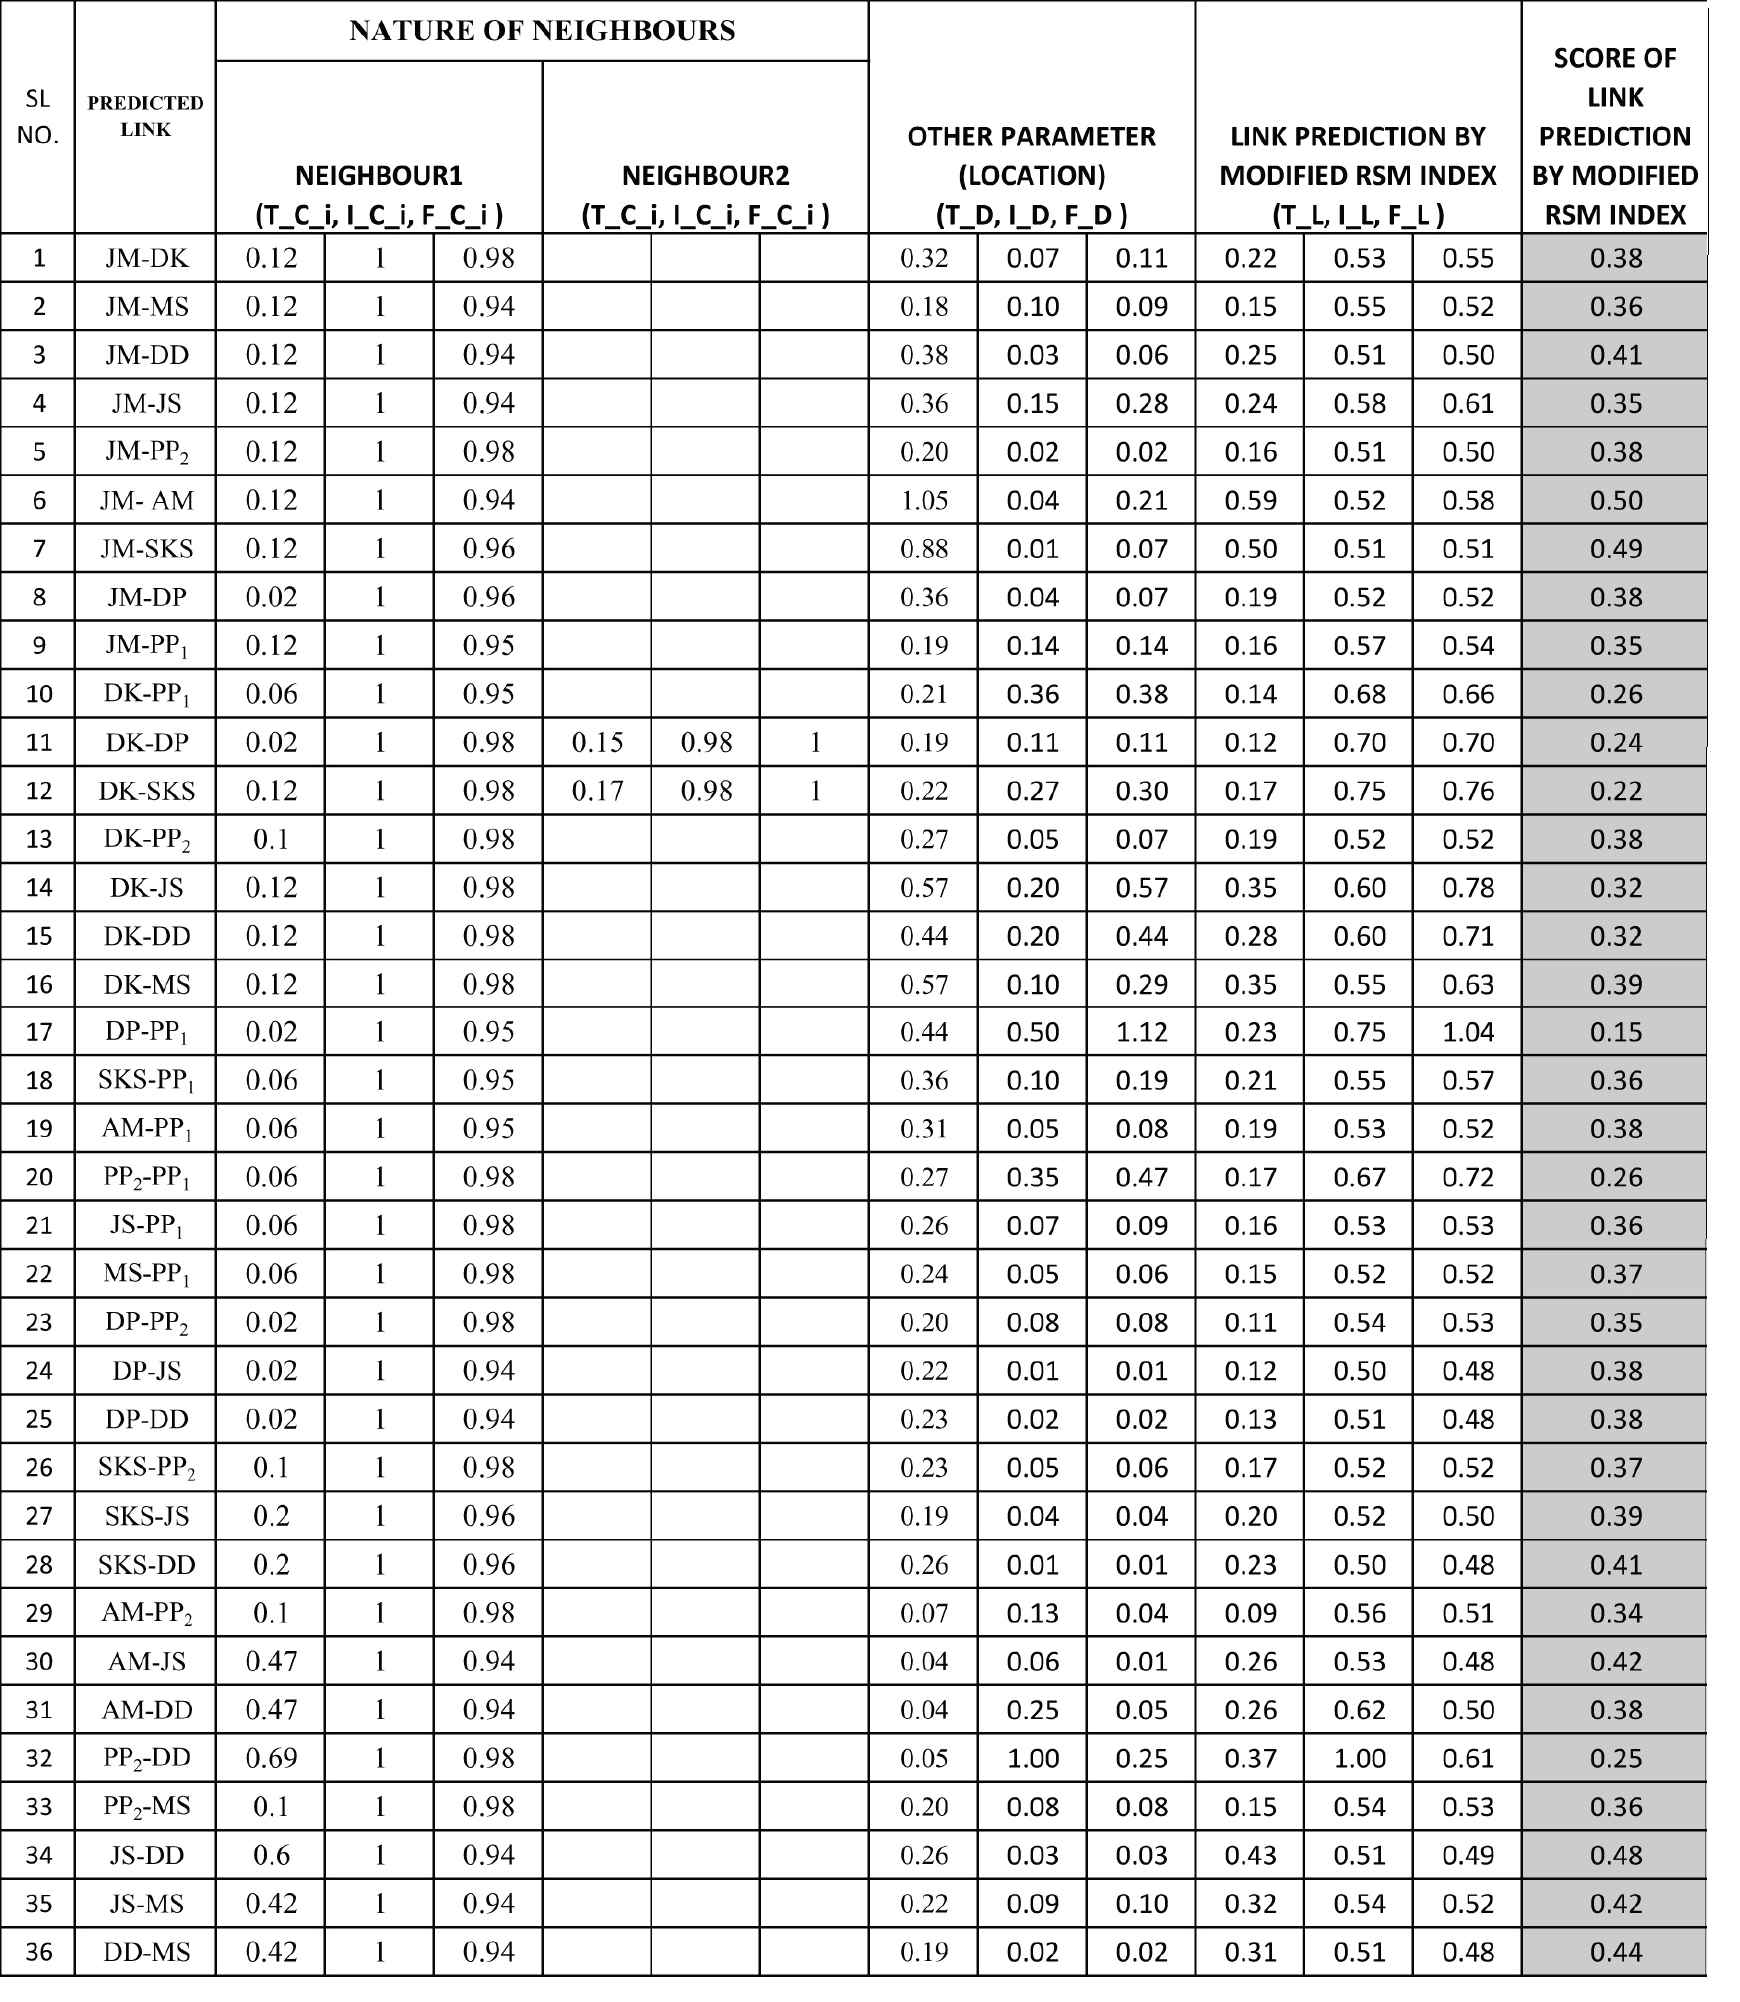
Calculation of link prediction by modified RSM index.
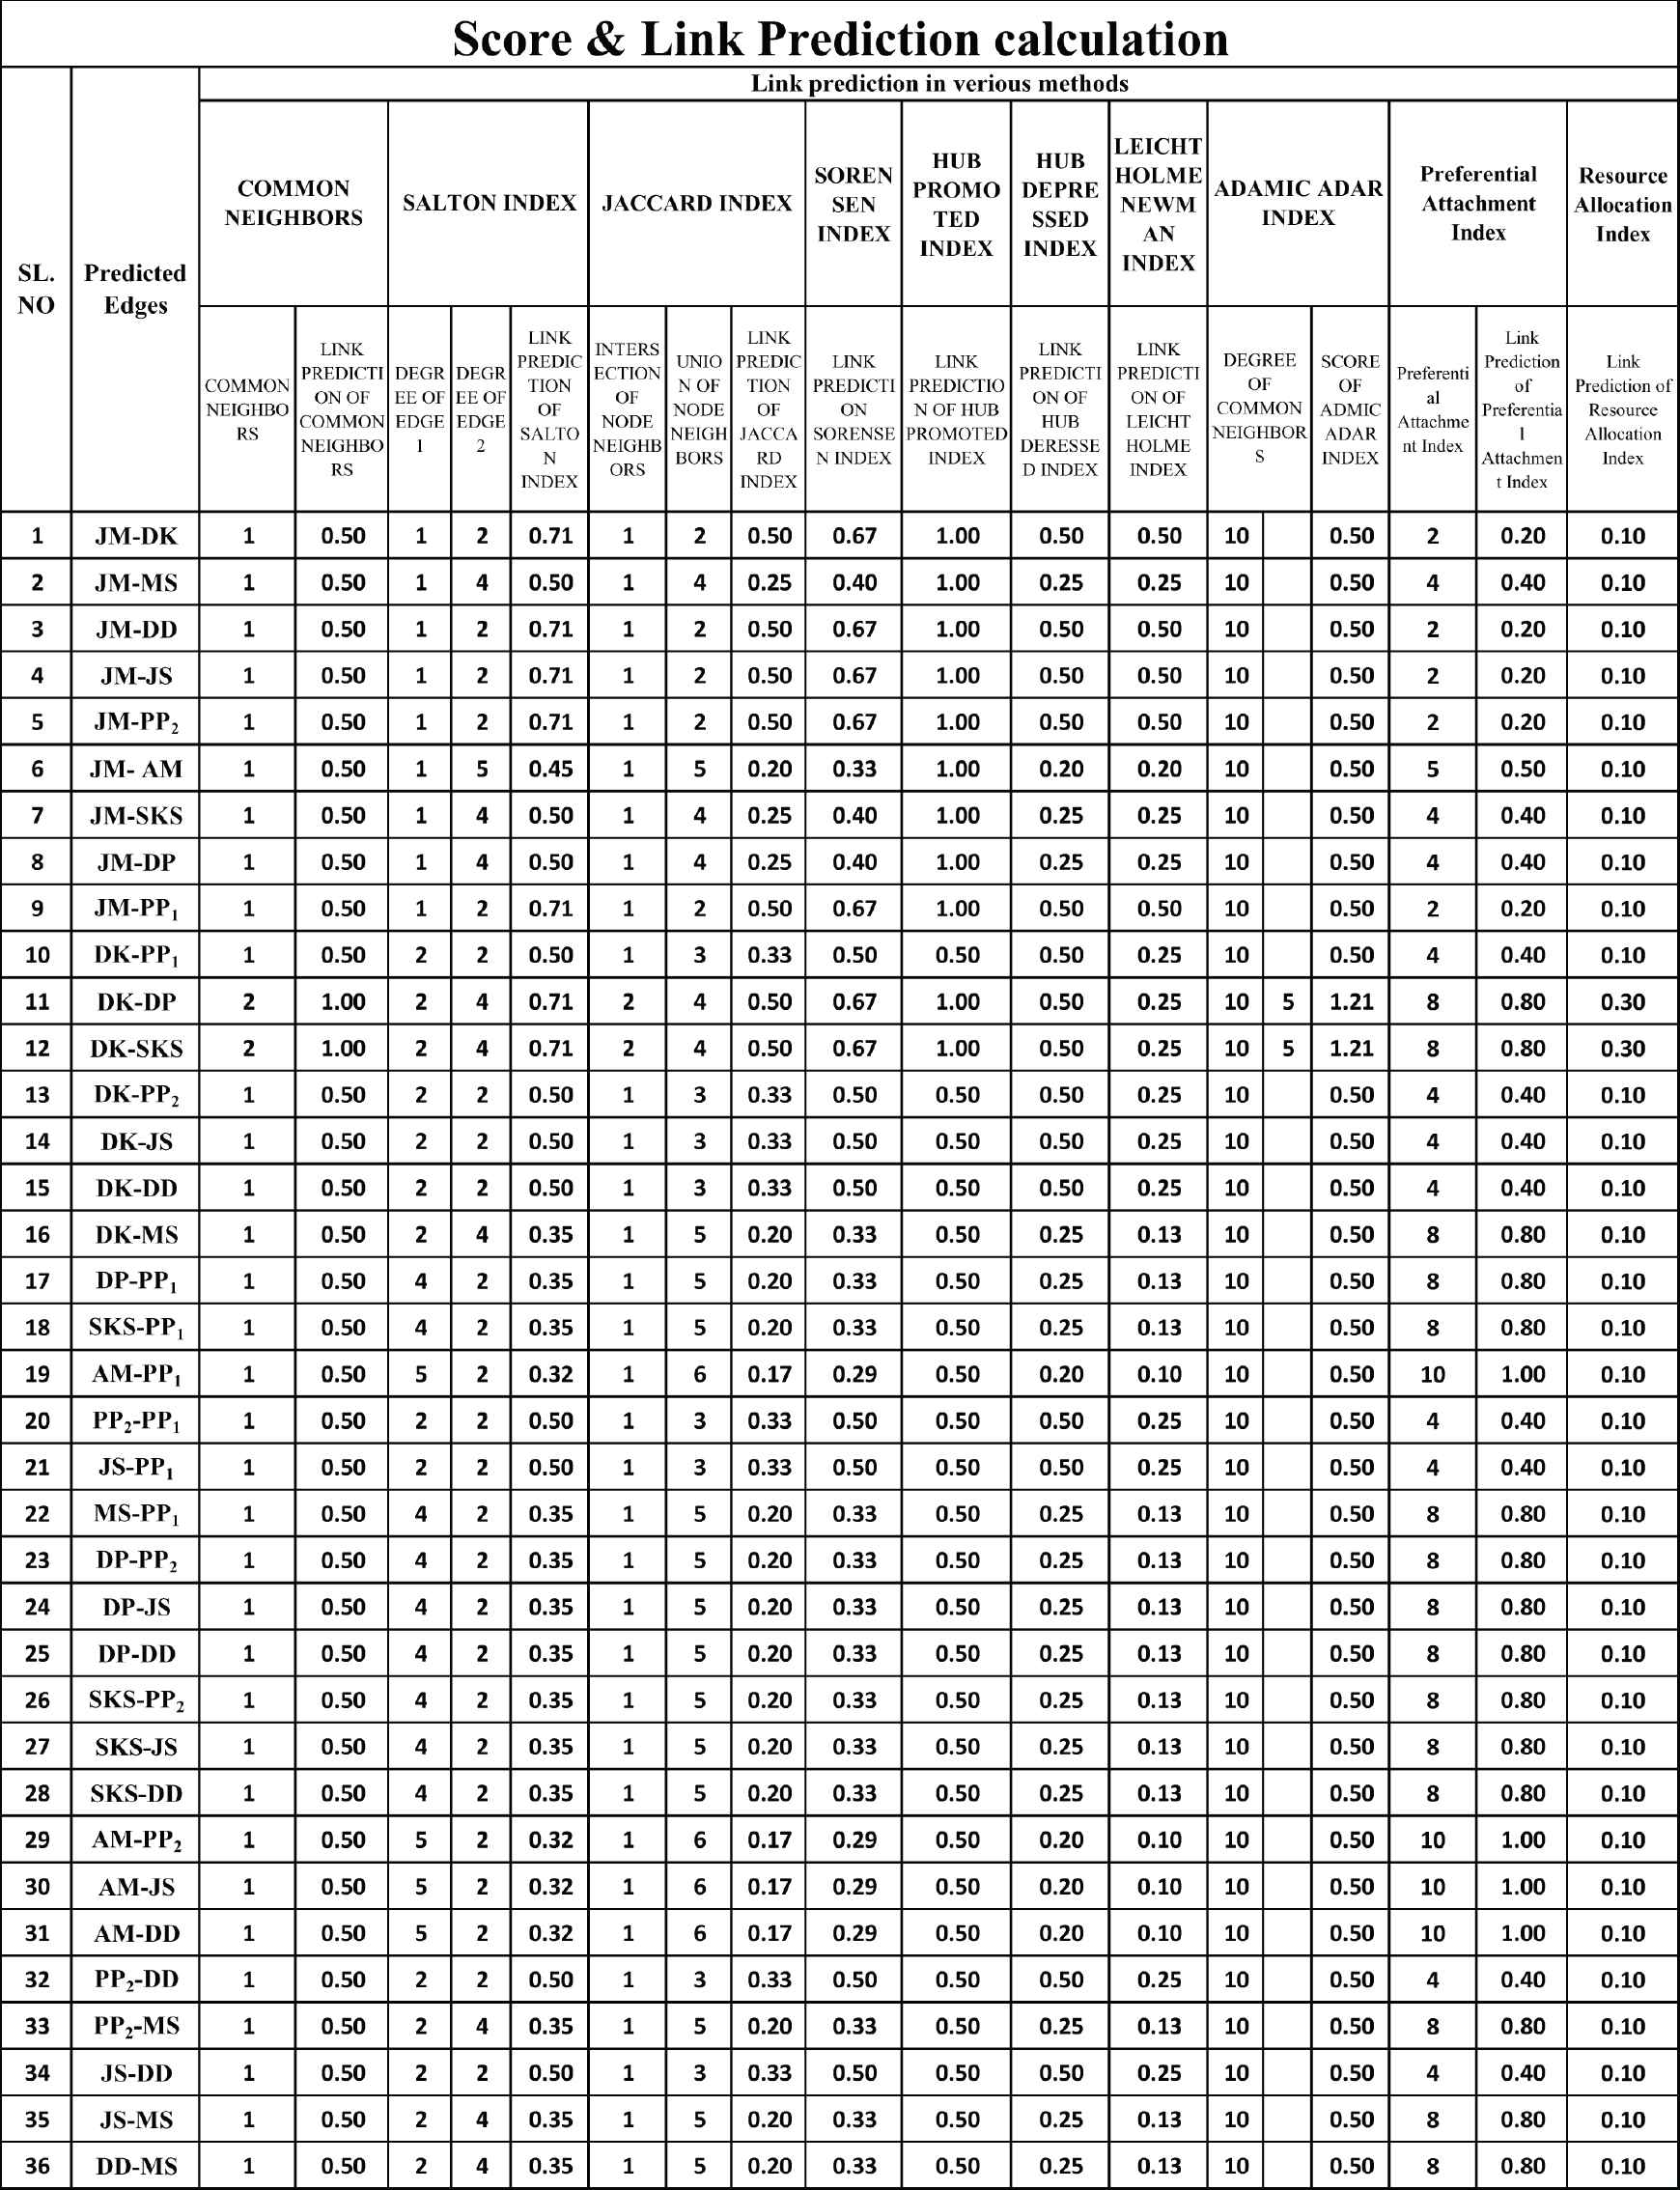
Calculation of link prediction by common neighbors, Salton Jaccard, Sorensen, Hub Promoted, Hub Depressed, Newman, Adamic-Adar, Preferential and Resource Allocation.
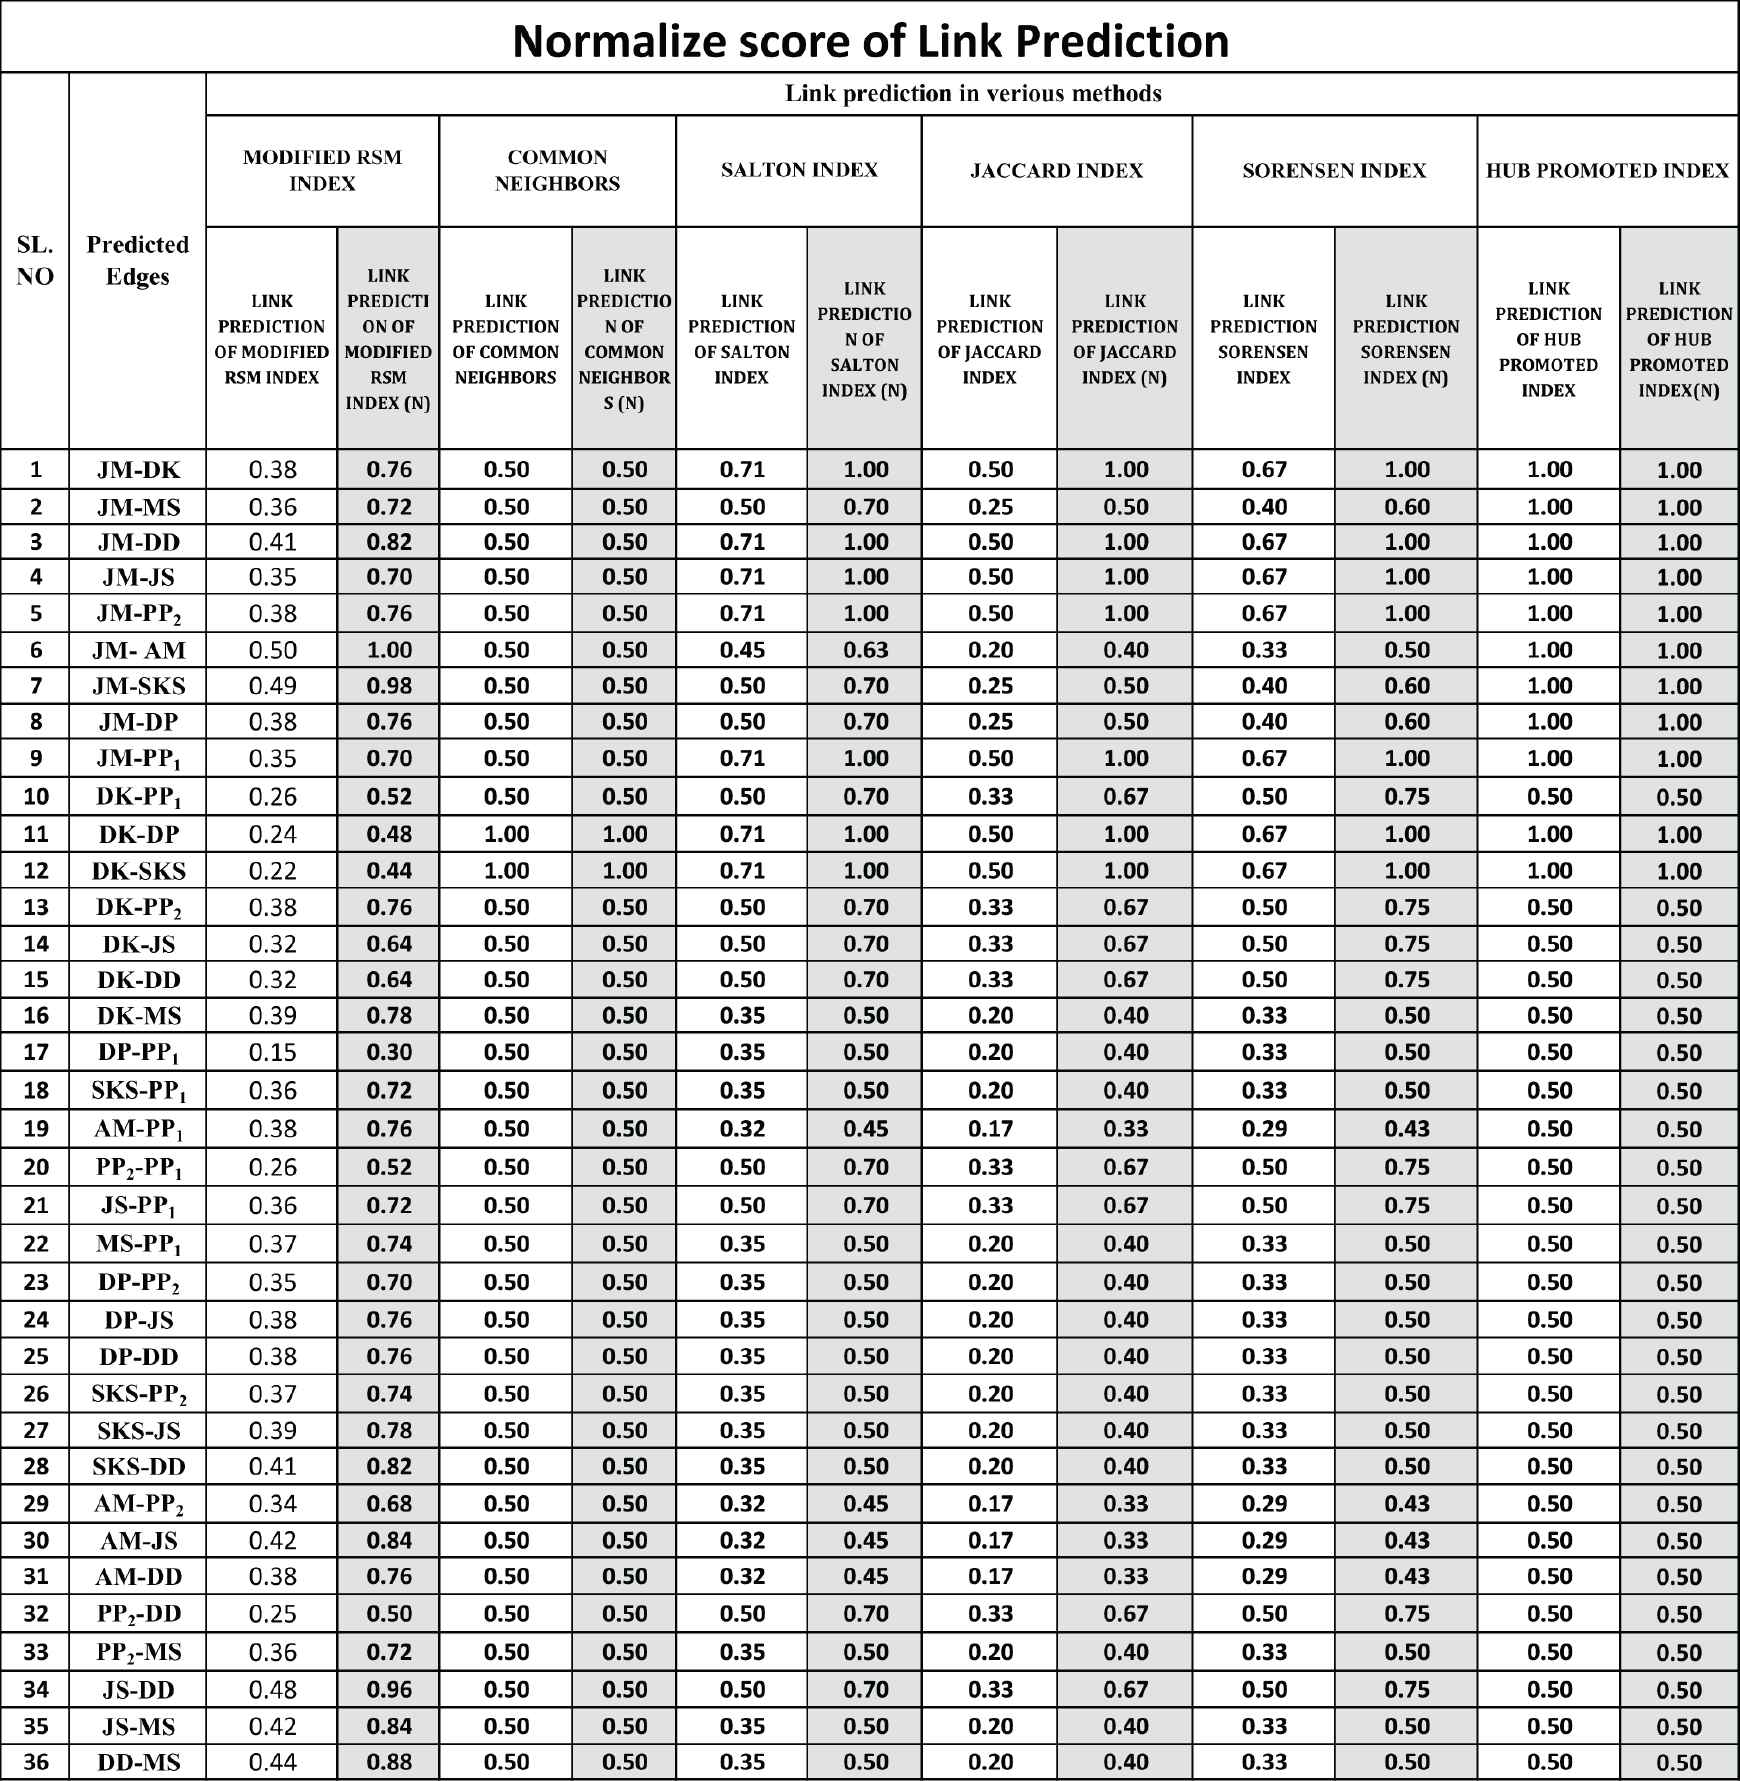
Normalized scores of modified RSM index along with common neighbors, Salton, Jaccard, Sorensen and HUB methods.
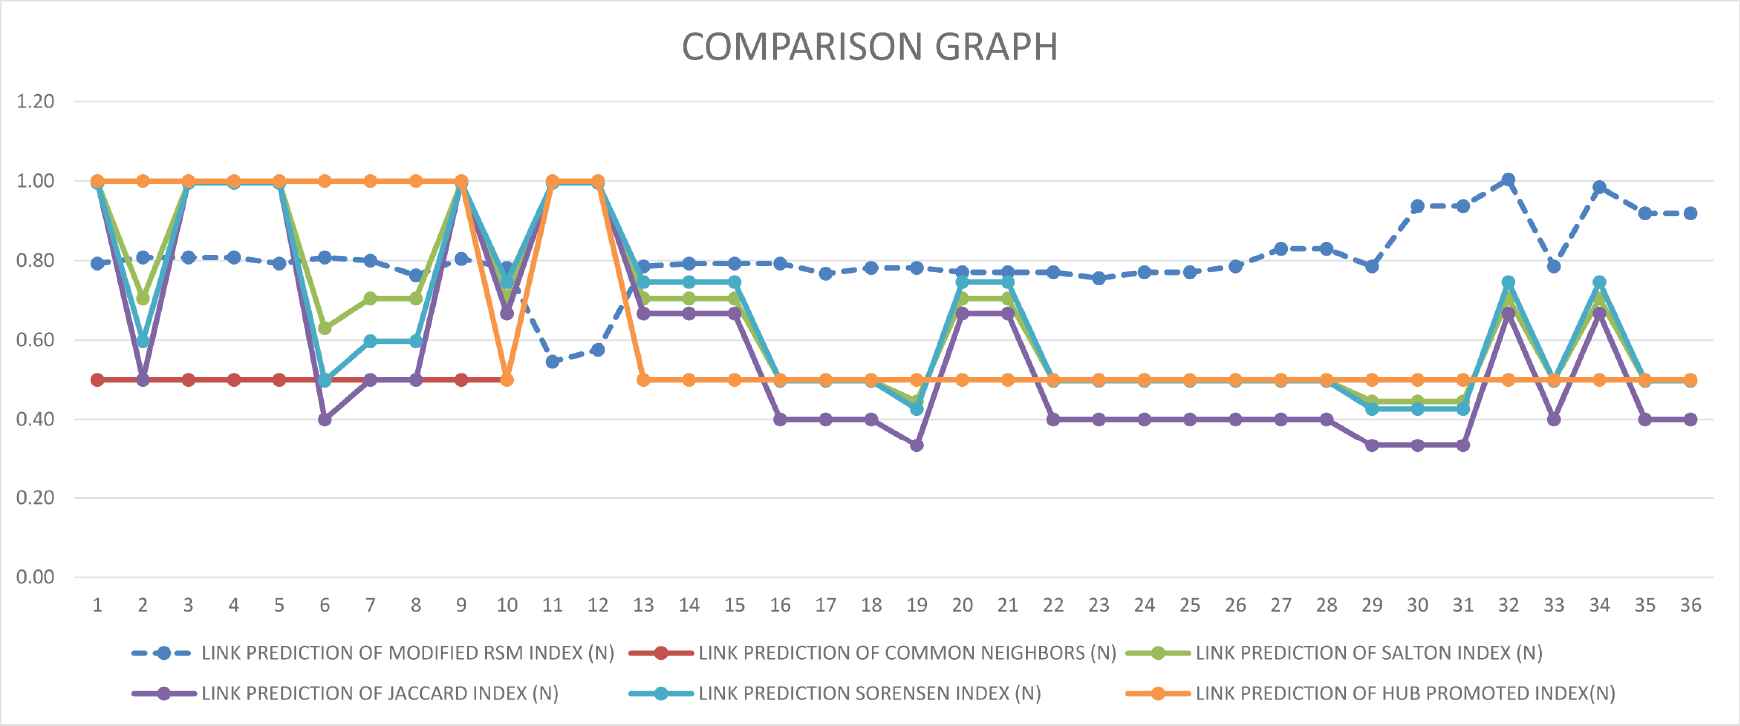
Comparison graph with common neighbors, Salton, Jaccard, Sorensen and HUB methods.
Also, calculation of the value of link prediction by another five methods of the Subsection 3 of all thirty-six predicted edges is shown in Figure 16 and the normalized score of link prediction by another five methods and modified RSM index is shown in Figure 17. Also, a comparison graph with the RSM index and another five methods is shown in Figure 10.
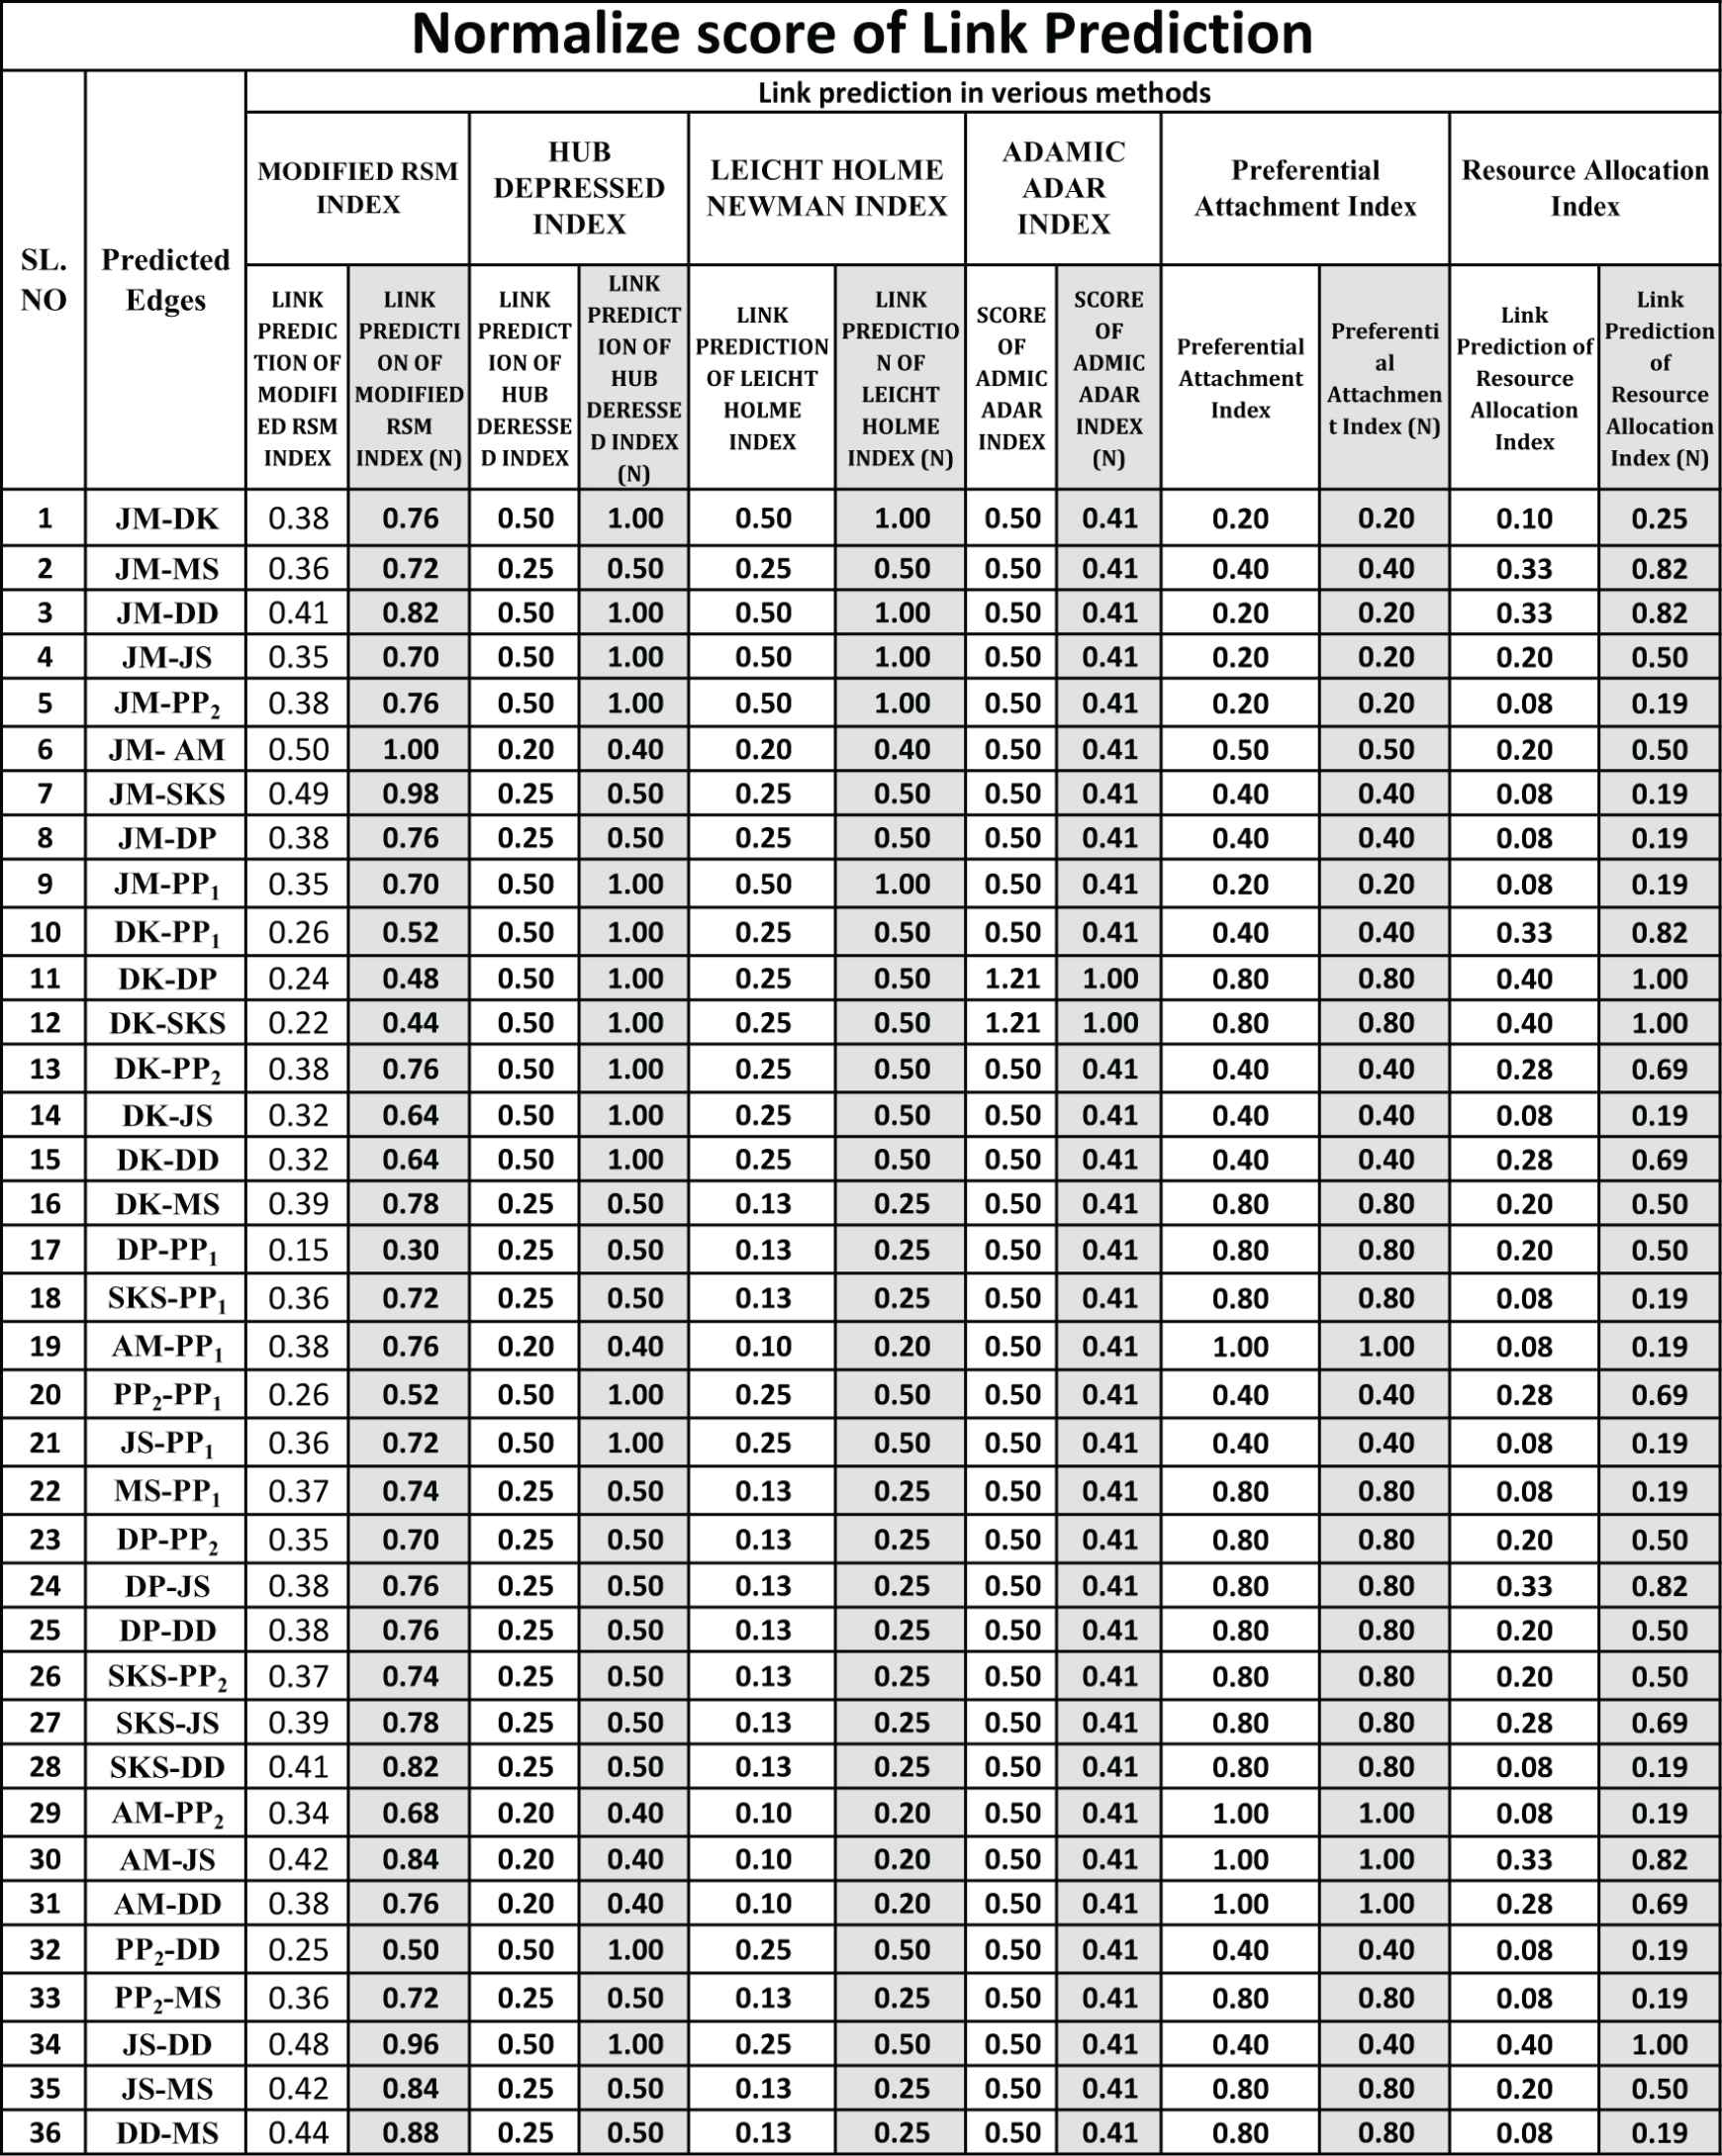
Normalized scores of modified RSM index along with HUB Depressed, Newman, Adamic-Adar, Preferential and Resource Allocation indexes.
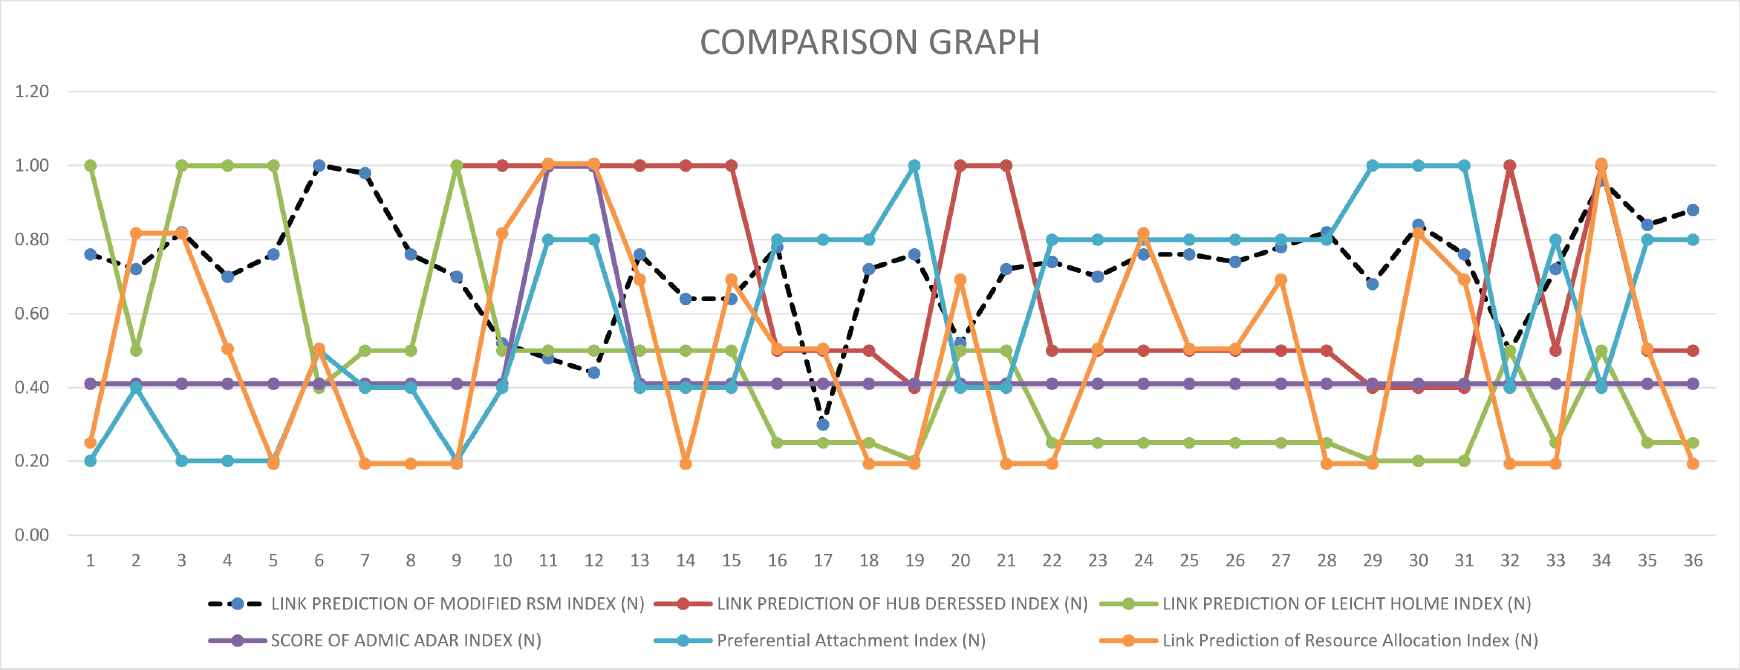
Comparison graph with HUB Depressed, Newman, Adamic-Adar, Preferential and Resource Allocation.
Here, the common neighbor method gives the same value for maximum prediction links. However, the modified RSM index gives the different value of predictions links compare to the common neighbor method. For example, consider a link in serial number
The almost similar score is given for HUB depressed and modified RSM index except for some links. Leicht-Holme-Newman index gives identical results with modified RSM index except for that specific links of serial numbers of Figure 16 are
5. CONCLUSION
In the modified RSM index, few limitations are there. Calculation of true value, falsity and indeterminacy from crisp data is not easy to capture. There are no available methods to find such data. In this study, some parameters which display the results are assumed for true value, some parameters which are taken wrongly in the displayed results are assumed as falsity, and the parameters which are neutral for showing the results are indeterminacy. Otherwise, this method captures all the notions of link prediction. This link prediction captures the nature of common neighbors as well as jobs, education and living places are assumed in the calculations.
CONFLICTS OF INTEREST
The authors do not have any kinds of conflicts of interests.
AUTHORS' CONTRIBUTIONS
Mr. Rupkumar Mahapatra, Dr. Sovan Samanta and Prof. (Dr.) Madhumangal Pal equally contributed to preparing the article. Prof.(Dr.) Qin Xin verified the results and statements and guided the work.
ACKNOWLEDGMENTS
The authors are highly thankful to the Editor-in-Chief, guest editor of the special issue and reviewers of the paper. The authors are also grateful to Mr Rajib Dolai, Assistant Professor, Economics, Tamralipta Mahavidyalaya for helping in data collection.
REFERENCES
Cite this article
TY  - JOUR
AU  - Rupkumar Mahapatra
AU  - Sovan Samanta
AU  - Madhumangal Pal
AU  - Qin Xin
PY  - 2020
DA  - 2020/10/24
TI  - Link Prediction in Social Networks by Neutrosophic Graph
JO  - International Journal of Computational Intelligence Systems
SP  - 1699
EP  - 1713
VL  - 13
IS  - 1
SN  - 1875-6883
UR  - https://doi.org/10.2991/ijcis.d.201015.002
DO  - 10.2991/ijcis.d.201015.002
ID  - Mahapatra2020
ER  -