
Deep Learning-Based Short-Term Load Forecasting for Transformers in Distribution Grid
 , Jing Zhao2,
 - DOI
- 10.2991/ijcis.d.201027.001How to use a DOI?
- Keywords
- Load forecasting; convolutional neural network (CNN); Long short-term memory (LSTM); Inception structure; Residual connection
- Abstract
Load of transformer in distribution grid fluctuates according to many factors, resulting in overload frequently which affects the safety of power grid. And short-term load forecasting is considered. To improve forecasting accuracy, the input information and the model structure are both considered. First, the multi-dimensional information containing numerical data and textual data is taken as the inputs of constructed deep learning model, and textual data is encoded by one-hot method. Then, for the purpose of mining the features of data better, based on the framework composed of convolutional neural network (CNN) and long short-term memory (LSTM), the modified inception structure is introduced to extract more detailed features and adaptive residual connection is added to settle the problem of gradient diffusion when the layers of model grow more. At last, the comparison is carried out and the improvements are presented after the textual data is added and the structure of model is modified. And the forecasting error is reduced, especially when the load is heavy, which is beneficial for the prevention of overload of transformer in distribution gird.
- Copyright
- © 2021 The Authors. Published by Atlantis Press B.V.
- Open Access
- This is an open access article distributed under the CC BY-NC 4.0 license (http://creativecommons.org/licenses/by-nc/4.0/).
1. INTRODUCTION
Power load forecasting is important for the effective management of modern power grids. The accurate load forecasting can improve the real-time scheduling and operation planning of power system, reducing the excessive consumption of energy, increasing the operation security level and contributing for the promotion of economic and social development [1–3]. There have been many load forecasting methods, which can be classified into long-term, medium-term, short-term, ultra-short-term according to the forecasting periods. Among these methods, the short-term forecasting method predicts the load of the power system in hours or weeks, which is the basis for dispatching center to formulate power generation plans and power plant quotations. And it is also important for the operation, control and planning of power system [4,5].
The transformer in distribution grid plays an important role in power supply. And the overload of transformer should be avoided as possible, which will not only cause the increasement of power loss, even compromise the security operation of distribution network. However, the load of transformer fluctuates according to many factors, such as weather condition, utilizer, festival, and so on. For example, in Fujian area, there are more than 200 transformers overloading during the National Day in 2019. For overload will lead to unstable power supply or even burning down of transformer, the overload rate has been a key assessment index of the operation of distribution grid. So, it's necessary to forecast the load for transformers in distribution grid, especially the short-term load forecasting, taking early measures to reduce the probability of overload. However, the accuracy of short-term load is impacted by lots of factors, especially the transformer in distribution grid is more vulnerable to the factors for its limited capacity [6,7]. So, the short-term load forecasting of transformer in distribution network is difficult but significant.
Lots of scholars have conducted extensive explorations, and proposed various prediction methods to improve the accuracy of short-term load forecasting, including time series method [8], wavelet analysis [9], regression analysis [10], Kalman filter [11], neural network [12], and so on. In these methods, the forecasting models are constructed reasonably based on complicated theories, but some parts of parameters or weights in the proposed model are chosen according to experience, resulting in the incomplete feature extraction, or the model is suitable for some specific conditions.
To further settle the forecasting error caused by subjective factor in the feature extraction, the deep learning methods are considered for its outstanding performance of feature extraction. There have been many types of deep learning models according to the composition structures and calculation methods, such as convolutional neural network (CNN), recursive neural network (RNN), long-term and short-term memory neural network (LSTM), and so on. And the application of deep learning used for forecasting has been a trend. In paper [13], a short-term power load prediction method based on LSTM is proposed to reduce the dimensionality of the data volume required by the load prediction model, having higher prediction accuracy than traditional BP neural network algorithm. In paper [14], the model with the main framework of stacked LSTM are applied for the load forecasting. In paper [15], aiming at the characteristics of time series and nonlinearity of load data, a mixed model short-term load forecasting method based on CNN and LSTM is proposed with the input of historical load data, weather data, date information and electricity price data. In paper [16], a deep residual network is modified and a two-stage ensemble strategy is constructed to enhance the generalization capability of the proposed model and improve the forecast results. In the existing research, the deep learning methods have shown better performance than other methods.
In this paper, based on the existing research results, CNN and LSTM can be adopted as the foundation for forecasting model. Besides that, the multi-dimensional information of numerical data in hour (containing historical load, meteorological data, electricity price) and textual data (containing date type, states of distribution lines) are both taken as input to increase the prediction precision. Meanwhile, the framework optimization for forecasting model is also considered. At last, the comparison of forecasting results are presented.
2. RELATED WORK AND BASIC PRINCIPLE
In traditional methods, the load forecasting is mainly decided on the numerical data, such as historical load, electricity price, population, meteorological data, and so on [8–12]. In these methods, the correlation analysis methods mainly based on the probability theory, such as canonical correlation analysis. The consensus is that the accuracy of the short-term load forecasting depends on the performance of mining associations among related data to a large extent. In these methods, for there are some parameters decided subjectively or empirically and the association of different variables is uncertain, the accuracy of forecasting model may also be unstable.
Take the relationship between load and temperature, for example, which is also the most often considered relation in load forecasting. In Figure 1, the load and temperature of every day from January to December are presented. The maximum load occurs when the temperature also stays high in the summer season. However, in December, the temperature decreases but the load grows higher.
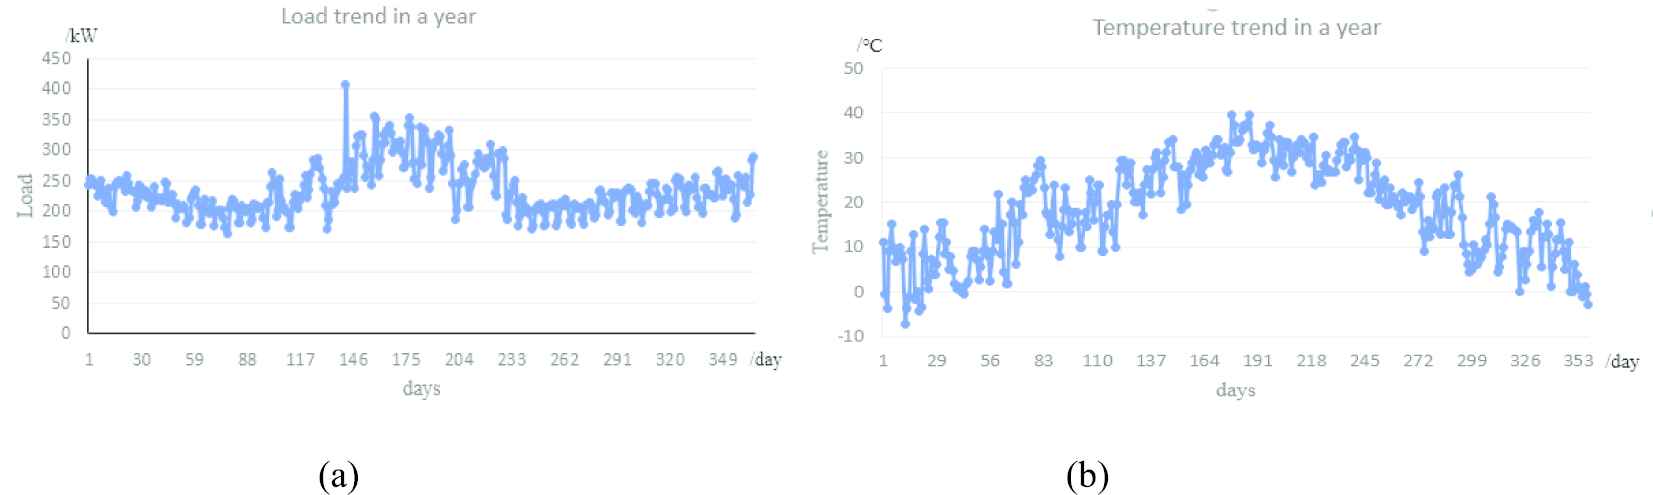
The trends of load and temperature in a year: (a) load trend in a year and (b) temperature trend in a year.
In Figure 2, trend 1 is collected on the day in winter, trend 2 in spring, trend 3 in summer and trend 4 in autumn. It can be found that transformer loads are inconsistent with temperatures and the relationship between load and temperature varies with time. It means that temperature is some part related to load trend and other influence factors need to be taken into consideration in short-term load forecasting. Such as the influence of festival, the load trend 1 collected in Spring Festival is higher than trend 2 and trend 4.
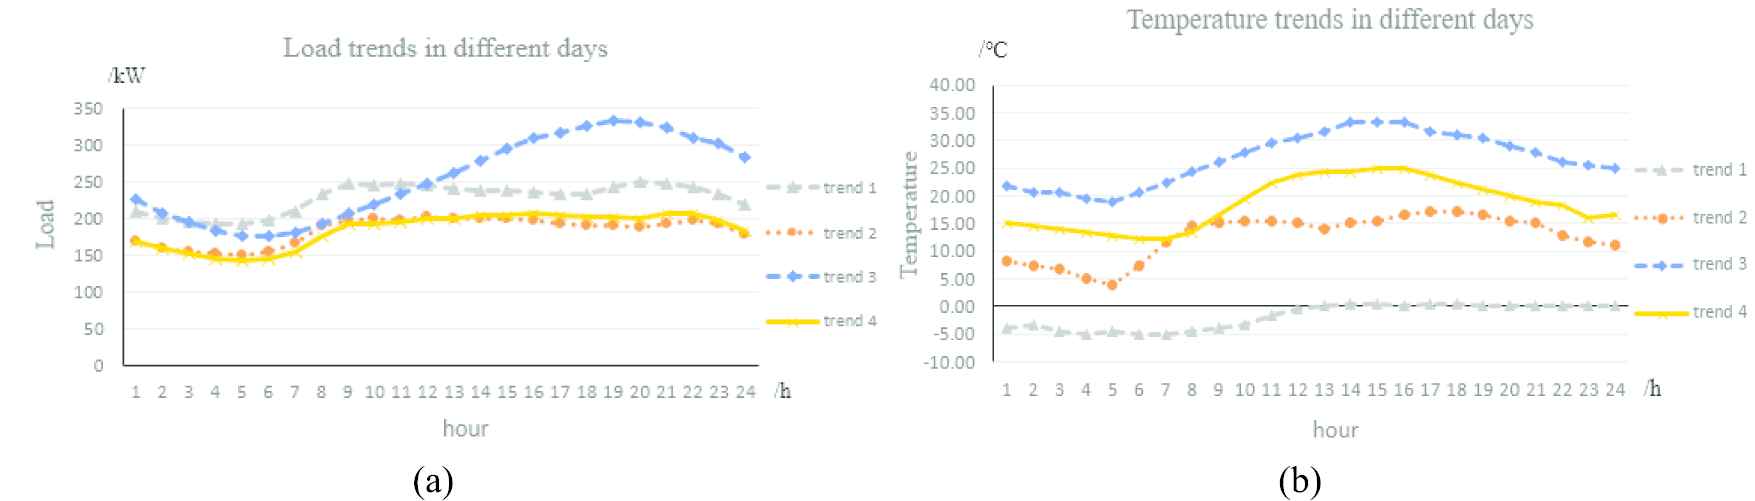
Load and temperature trends in different days from four seasons: (a) load trends in different days and (b) temperature trends in different days.
Through the review of the exiting methods, it can be found that the more effective information is considered in forecasting model, the better forecasting accuracy can be derived. To realize a better performance of load forecasting, the factors including historical load data, weather data, states of distribution lines and the day type (festival, workday or weekend) are considered. Meanwhile, with the convolution computation and word embedding of deep learning, the relationship between different kinds of factors can be modeled qualitatively. And based on the traditional methods, it is difficult to establish the quantitative and accurate model with the input information both of numerical data and textual data. So, a novel forecasting model based on deep learning is needed.
2.1. One-Dimensional (1D) CNN
CNN contains convolutional calculations and has a deep structure. It's a kind of feed forward neural networks [17,18]. CNN has the ability of representation learning and can realize shift-invariant classification of input information according to the hierarchical structure, extracting high-order features.
There are several types of CNN according to the calculation dimension, containing 1D, 2D, 3D and 4D [19]. While obtaining interested features of in shorter segments with fixed length in the overall data set, 1D CNN is effective. The process of 1D CNN is shown in Figure 3.
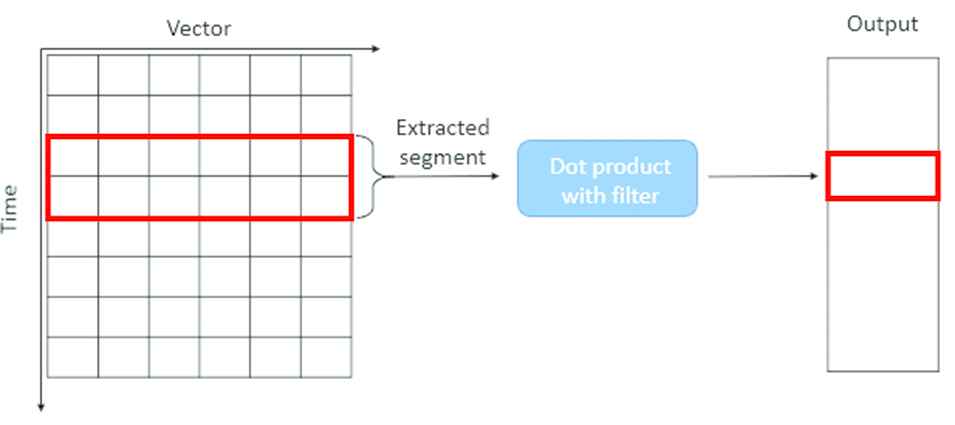
Work process of one-dimensional convolutional neural network (1D CNN).
For single filter, the mathematical expression can be described as follows:
2.2. Recursive Neural Network
For 1D CNN is not sensitive enough to the time sequence, the performance of feature extraction will decrease while settling with longer data sequence, so RNN is considered. In RNN, the modular architecture of the cyclic neural network is adopted which can better reflect the correlation between current results and historical data [20].
The core part of RNN is the directed graph and the chained elements in a directed graph expansion is called RNN cell. In general, the chain connection formed by the RNN cells can be analogous to the hidden layers in the feed forward neural network, but in different discussions, the “layer” of the RNN may refer to a single time step loop unit or all loop units [21]. The framework of RNN is shown as Figure 4.
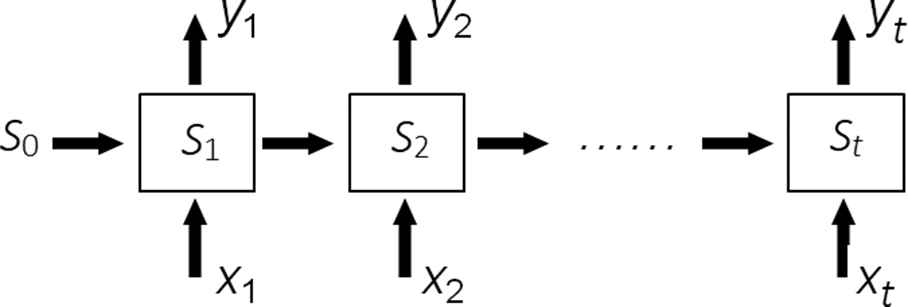
Framework of recursive neural network (RNN).
The calculation and update process of the output and state of the cyclic neural network can be described as follows:
Although RNN utilizes the history data by circulation, there is a gradient disappearance problem. When data sequence is long, the error of the backward time step cannot be propagated to the previous time step for optimization calculation, thereby causing the information before and after the certain time distance to not be correlated.
2.3. Long Short-Term Memory
To settle the problem in the processing of long data sequence, the gated algorithm is considered. Through the gating unit, the RNN controls the accumulation of internal information. When learning, it can grasp long-distance dependence and selectively forget information to prevent overload. There are also different types of LSTM. A typical framework of LSTM is show in Figure 5.
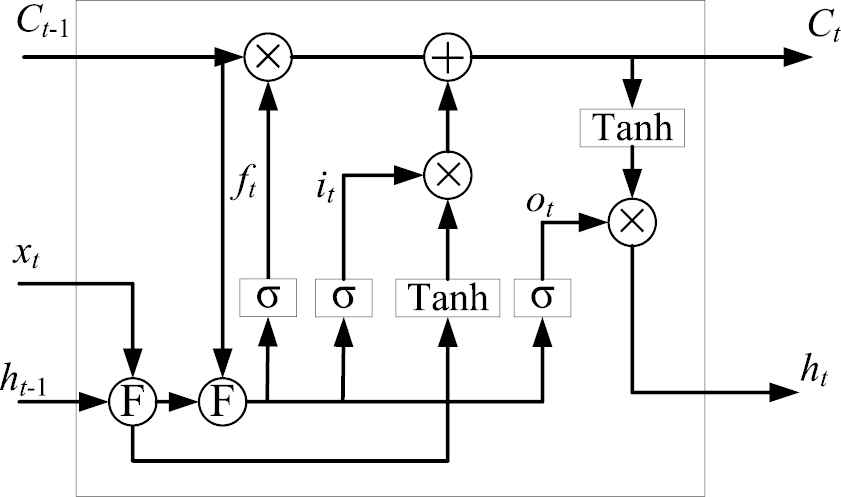
Framework of long short-term memory (LSTM).
In Figure 5, the symbol “F” means that the input data is fused into an array. In LSTM, it adds a method of carrying information across multiple time steps, allowing previous information to be re-entered in subsequent calculations, thus solving the problem of gradient vanishing [22,23]. Therefore, use LSTM to enhance the correlation analysis of historical data and improve prediction accuracy. In LSTM, there are novel designs: forget gate determines that some part of the data in the previous moment needs to be forgotten, input gate to determine that some part of the current input needs to remain in the state, and output gate to determine the system input from the current moment, the input from the previous moment. Some parts of the information combined with the status information can be used as the final output. The expressions are as follows:
3. PROPOSED METHOD
Compared with the existing load forecasting methods, the main innovations of proposed method in this research contain two aspects. First, to reduce the forecasting error, several highly associated factors are considered as inputs of the forecasting model that the numerical and textual information are both considered. Second, while constructing the deep learning model for load forecasting, the inception structure and residual connection are applied in the model modification to tackle with the numerical and textual information, improving the ability of feature extraction and the effect of backpropagation.
3.1. Textual Information Processing Method for Load Forecasting
Besides the numerical data, some text information also indicates the load trend, such as the description that which festival will come. In traditional method, the text information is quite hard quantified and used for the prediction work. With the advantage of powerful computing capability of deep learning network, the text information can be vectorized based on word embedding, which is different from the traditional model.
There are many vectorization methods. Among these methods, both consider the distinguish effect and computing workload, the one-hot coding method is adopted for there is a small amount of description words [24]. Using one-hot coding, the value of the discrete feature is extended to the European space, and a certain value of the discrete feature corresponds to a certain point in the European space. Using one-hot encoding for discrete features will make the distance calculation between features more reasonable.
According to the requirement of grid operation, the demand of the electricity utilization has been ensured during the mayor festival, such as National Day, Spring Festival. And we can have the set Dtype, containing the types of day.
And the one-hot coding of Dtype can be described as
The types of day are represented by the derived row vectors correspondingly. And similarly, the states of distribution lines can be vectorized. The states of distribution lines contain the insulation situation and the historical situation of power supply area. For example, the description is “The insulation situation is poor, the historical load varies greatly.” And all these messages are encoded for forecasting.
After the textual data is vectorized, the dimension needs to be further extended to the same dimension of the numerical data which is collected in minutes. With the branch of the text input processing added, the framework of load forecasting is presented as Figure 6.

Framework of textual data proposed model.
3.2. Inception Structure for Feature Extraction of Numerical Data
The aforementioned CNN, RNN and LSTM provide basic deep learning framework. However, the simple CNN or LSTM has a limited ability of data extraction. Meanwhile, when the CNN and LSTM are both introduced, the network grows larger, resulting in the gradient vanishing or computing efficiency decreasing. So, the performance of the model needs to be optimized for a better result.
There have been several operations for improvement of deep learning network, such as residual connection, stacking integration, inception structure, and so on. Among these improvement methods, the inception structure expands the width of model and reduces the scale of filters to get better performance, changing the thought that the network is constructed deeper by stacking convolution layers. So, for the purpose of mining the features of data better, the inception structure is also introduced [25]. Such as GoogLeNet [26], it proposed inception structure, improving the local topology, performing multiple convolution and pooling operations on the input image in parallel, and splicing all the output results into a very deep feature map. There have been several popular inception structures, known as Inception V1~V4 [27] and Inception-ResNet [28].
For the existing Inception series algorithms is suitable for the image recognition, it costs computing resource and the sizes of filters are not suitable for data prediction, so the new designed inception structure for the load forecasting is proposed. It is shown as Figure 7.
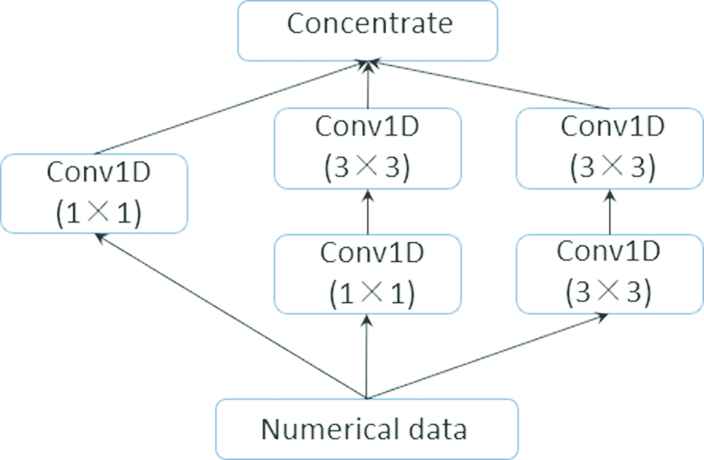
Inception structure proposed for load prediction.
The proposed inception structure makes some optimization, including factorization of kernels with small size and parallel branch computing. With the inception module introduced, the network can mine more subtle features through the 3 branches, while it also owns higher computational efficiency.
Meanwhile, in this forecasting model, the stacking integration strategy can combine deep learning networks together with the advantage of all networks. To further improve the performance of the load forecasting model, the CNN and LSTM are both considered to be applied in the new solution, meanwhile, inception structure is adopted to prevent the gradient vanishing when the network of model grows larger.
3.3. Residual Connection of Numerical and Textual Data
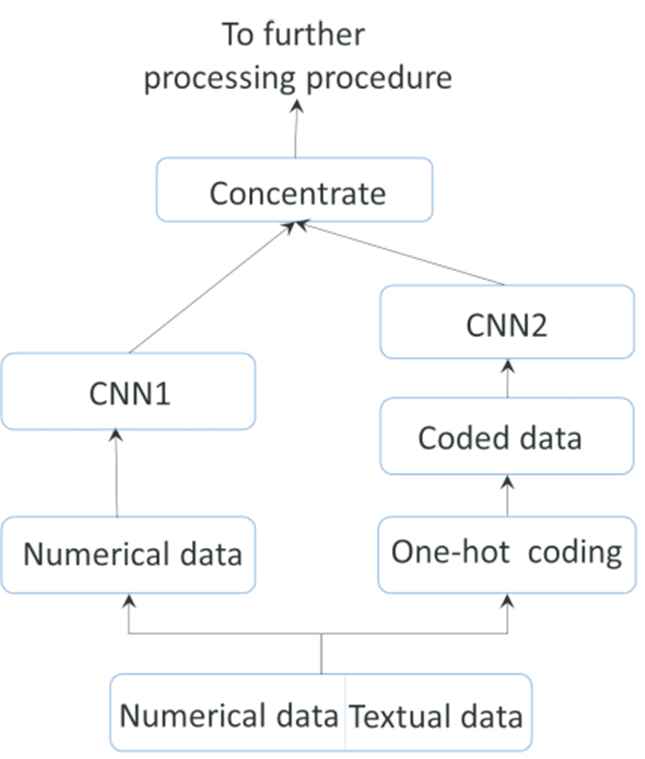
Based on the framework of inception and stacked LSTM, with the number of layers in the network increasing, there may be the problem of gradient diffusion [29,30]. In Figure 8, it shows that the original data are decomposed into the numerical and textual data, and then both of data are concentrated after the feature extraction in each branch for further calculation. In the deep learning process, attenuation of the backpropagation of textual data and numerical data will occur.
Framework of the data processing.
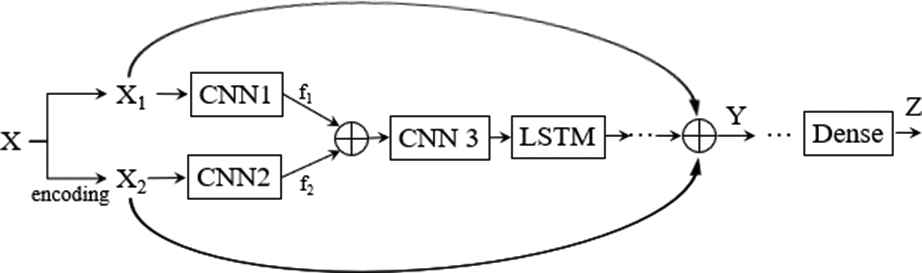
The topology of the deep learning framework can be described as Figure 9. CNN1 is the CNN with inception structure. CNN2 and CNN3 are the convolution layers with different number of filters and different sizes of kernel.
Main procedure of the forecasting without residual connection.
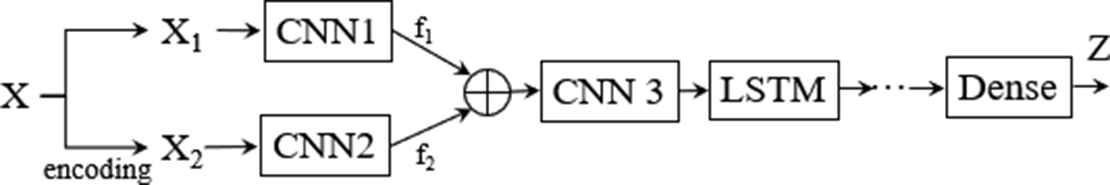
The input of x is decomposed into x1 and x2. The deep learning model can be recognized as that it has two input. To settle the gradient diffusion, two bypass residual connection structure in Figure 10.
Main procedure of the forecasting with residual connection.
Suppose that L(.) is the loss function, there are m layers in the model, Zm is the corresponding output and Y is the input of the nth layers. With the residual connection added, Y is
And the derivation of loss function to input x1 can be derived as
Similarly, the derivation to input x2 is
For the exiting of activation function attached to convolutional layer, such as Relu function, the derivation to input x1 and x2 will not be negative number, which improves the effect of backpropagation.
Summarizing the above method, first the numerical data and textual information on the time axis are adopted to predict the future load, then the modified inception structure extracts essential features from high-dimensional features for prediction and improves feature expression ability. Meanwhile, the residual connection is introduced to tackle with the problem of gradient diffusion, with the inputs of numerical and textual data considered.
4. MAIN IMPLEMENTATION PROCESS
In this part some key implementation program is introduced to realize the proposed framework based on the deep learning framework, such as Tensorflow. And the main process is shown in Figure 11.
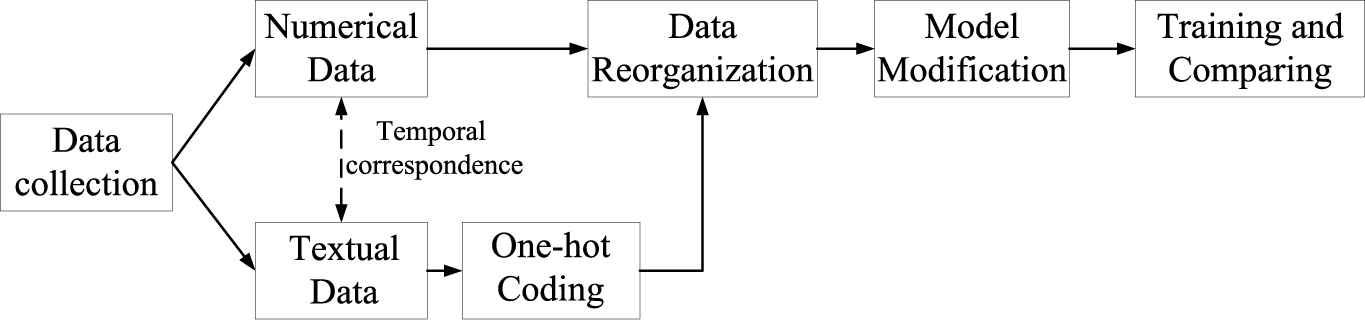
Main implementation of load forecasting.
First, the data has to be collected. load data, date and the states of distribution lines are extracted from the related monitoring system of distribution network. And different types of data are processed with the same dimension and every record has temporal correspondence.
Then, the textual data is vectorized by one-hot coding and all data should be reorganized. In this procedure, a data generator is constructed to realize the reorganization (seen in Appendix A). The benefits of constructed generator include (1) The generator can generate the historical data containing textual and numerical data, based on which the short-term forecasting is carried out, and target load values dynamically. (2) With the generator, the training set and testing set can be generated dynamically and quickly, so the storage space occupied by the data set can be reduced. (3) In the training process, the data sets can be flexibly adjusted according to the training results.
Thirdly, based on the framework of deep learning, the proposed model is constructed. The main program of the constructed model is presented in Appendix B with the inception and residual connection. Through the above procedures, the forecasting load for transformer in distribution network can be realized based on the modified model.
5. TEST RESULTS
5.1. Training Results
To test the performance of forecasting model, the operation data of the transformer located in Fuzhou with rated capacity of 315kW is extracted with the maximum load factor 0.93, which overloaded in the period of National Day in 2019.
And the experiment is carried out based on the dataset of the collected weather, load and date type. All of the data is processed with the interval of one hour. There are 64478 records, divided into 50000 training samples and validation samples with the left records. Tensorflow and Keras are used as the program framework. The forecasting rule is using the past 168h records, predicting the load in next 6h. And the parameters are set as value of batch size is 64, number of iterations in each epoch is 100 and number of epochs is 30. The results are shown in Figure 12.
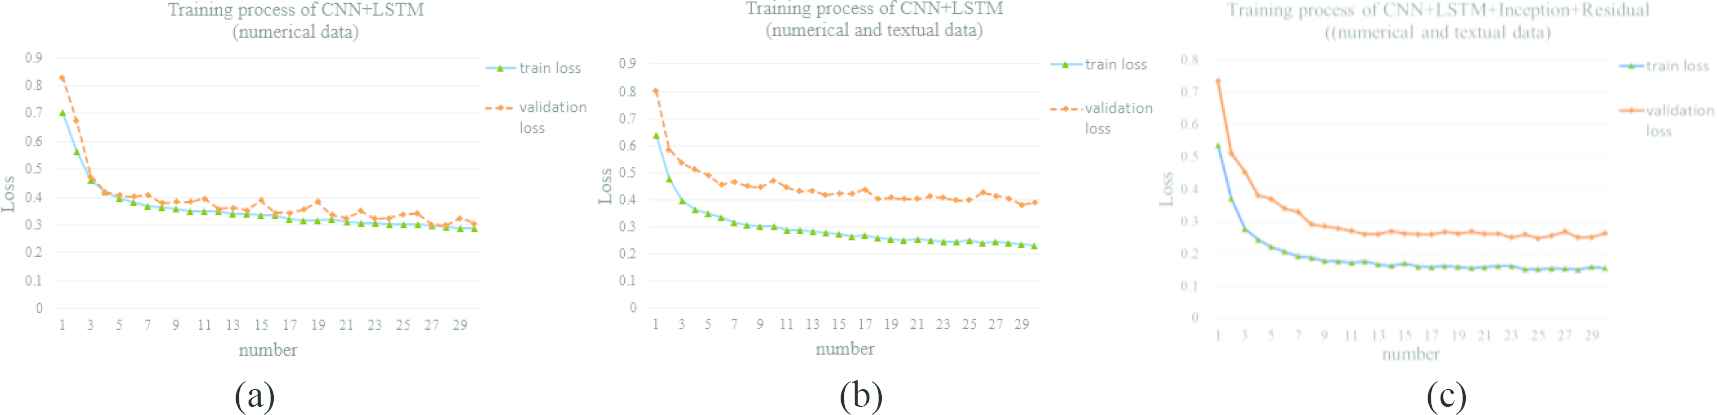
(a) Loss trends of training and validation loss in the situation that model with the input of numerical data is constructed based on convolutional neural network (CNN) and long short-term memory (LSTM); (b) is the training and validation loss trends when textual data is taken as input of CNN and LSTM and (c) the training and validation loss trends using the above proposed methods.
Through comparison, it can be found the training can be carried out but the training loss is high based on CNN and LSTM. And then the textual information added, the training loss decreases because the useful text provides other relationship for prediction, however the validation loss is still greater than training loss, even there is over-fitting phenomenon to some extent. And it is obvious that the proposed method can derive less loss performance than CNN + LSTM method. And meanwhile the validation loss and training loss are more consistent.
5.2. Forecasting Results
Further, to testify the performance of the models, the comparison of short-term load prediction is carried out. Based on the corresponding recorded data in past 168h, the forecasting load in next 72h is shown. In Figure 13, the forecasting results of the models based on LSTM [13], stacked LSTM [14], CNN-LSTM [15] with numerical data as input are presented respectively. Although in the previous published papers, it has verified the performance of the LSTM-based forecasting model is better than traditional methods, such as BP neural network, random forest model and so on, there is still room for improvement.
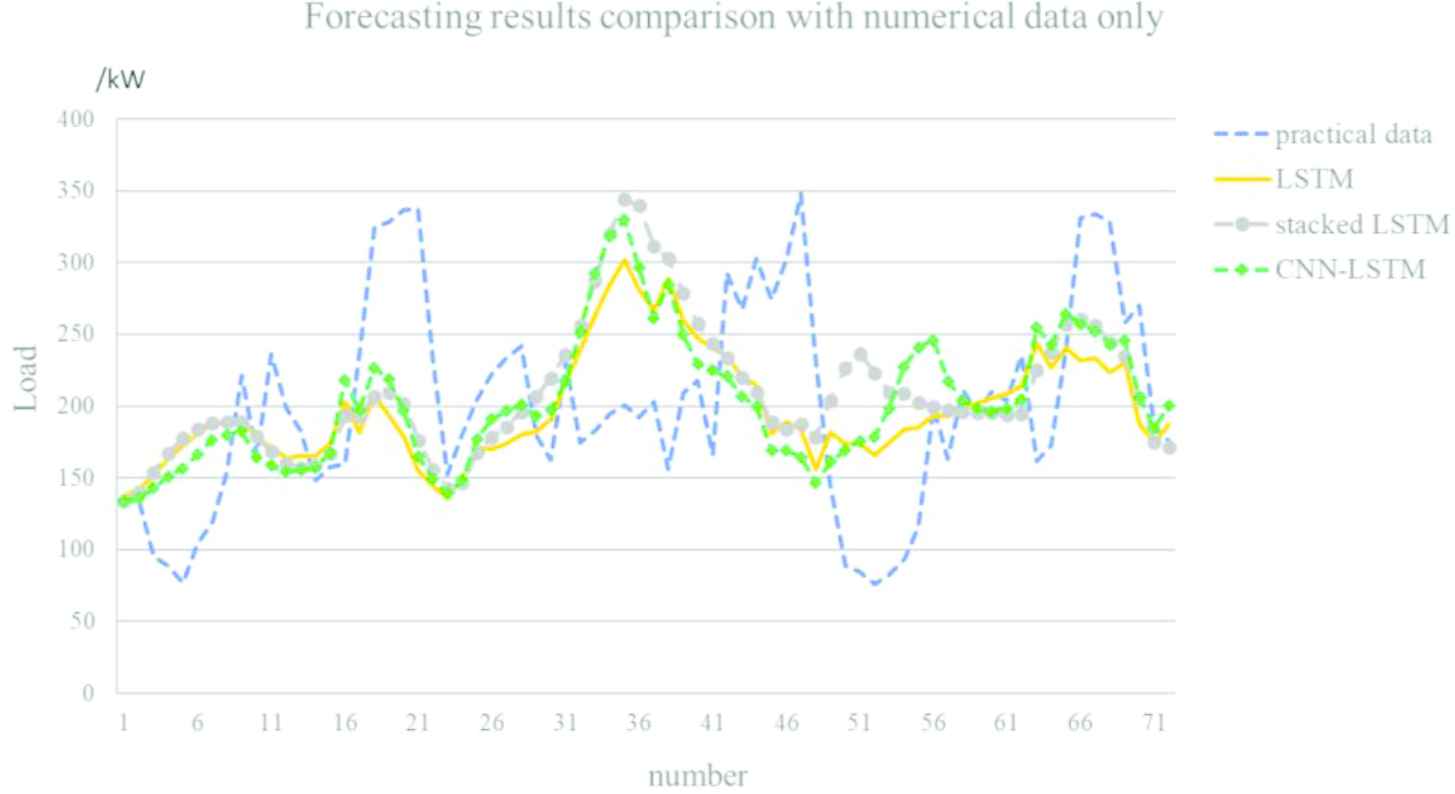
Forecasting results of the long short-term memory (LSTM)-based models.
It can be found that the errors of forecasting results are large. To further show the improved performance when the textual information and residual connection are introduced, the results predicted by the CNN-LSTM with text input and the proposed model are also presented in Figure 14.
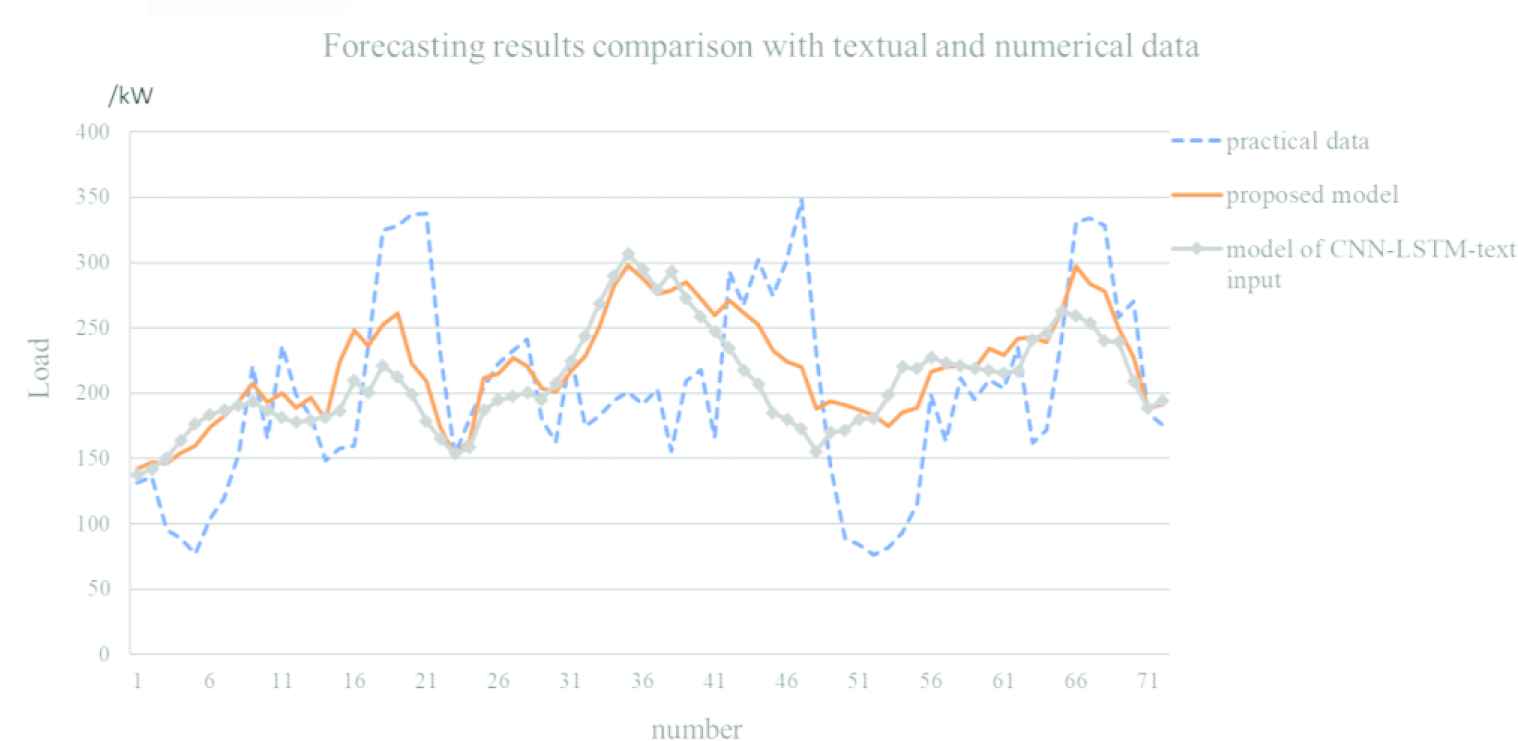
Forecasting results of the improved models.
Through Figure 14, the forecasting results are better than the results in Figure 13. Meanwhile, in this research the key point is that the situation of overload is prevented as possible. So, the forecasting results should be analyzed and there are 11 overload-points that the load of transformer is greater than 292kW, which is the approximate value derived by rated capacity timing load factor (315kW × 0.93). To quantify the errors of the above forecasting results, the relative error comparison is calculated based on the formula of
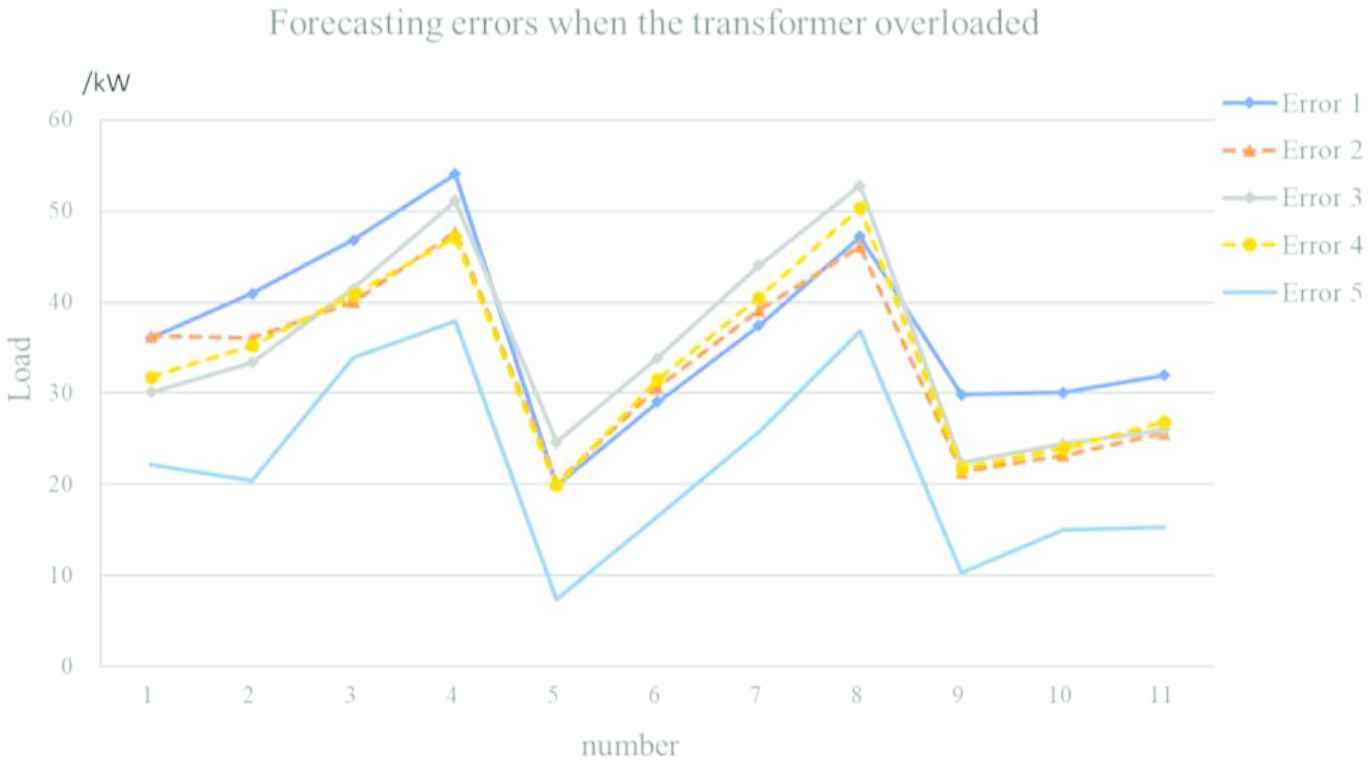
For convenience, the error of the forecasting result of LSTM is denoted as Error 1. The error of stacked LSTM is denoted as Error 2. The error of CNN-LSTM with numerical data is denoted as Error 3. The error of CNN and LSTM with textual and numerical data is denoted as Error 4. The error of the proposed model in this paper is denoted as Error 5. And the comparison of different errors when overload occurred in transformer is shown in Figure 15.
Comparison of errors of 5 models when overload occurred.
Further, the numerical comparison result is summarized in Table 1.
It shows that the Max-error of Error 1 is the smallest and the Ave-error of Error 5 is the smallest. Combined with Figures 13 and 14, it can be found that the Max-error occurs when the load is light. And it shows the overall performance of Error 5 is better than others with the smallest Ave-error. Further, for overload prevention is the main purpose, the forecasting errors are also evaluated when load is greater than 292kW.
While overloading, the Max-error of Error 5 is 37.9kW, which is nearly 20.5% smaller than the other models. And the Ave-error of Error is 21.9kW, which is 24.7% smaller than the others. So based on the proposed model, the occurrence of the overload in transformers in distribution grid can be reduced.
5.3. Limitations
In former section, the performance of the proposed model is presented. There are some still limitations of the proposed method, mainly including:
Complicated structure. For the combination of different types of structures in the model, the number of the parameters in proposed model is more than other models.
More training time. For the number of the parameters in the model is large and the no optimization of training strategy is carried out in model training yet. The training of model needs more time.
The prediction error is large when the load fluctuates greatly and there is still room for the improvement of proposed model. For the load of transformer is affected by too many random factors and fluctuates greatly in hour in practical situation, although many factors are considered in this paper, there are still some important factors, such as the usage habits of power utilizers, dispatching plan of power grid, and so on. To improve the accuracy of load forecasting, the related factors should be also considered and transformed into the input of forecasting model.
6. CONCLUSIONS
With the development of deep learning, to improve the accuracy in prediction of load, the main framework of the model consists of CNN and LSTM with the numerical data and textual information as inputs. Meanwhile, to settle the problem while the layers growing more, residual connection and inception structure are combined to improve the forecasting effect and computational efficiency. At last, the comparison is carried out and the results are presented to show the improvement. For there are too many factors influencing the variation of load and the load of transformer varies ceaselessly, the forecasting of load in hour is a hard work and there is still much further work to improve the prediction accuracy.
| NO. | Max-error | Ave-error | Max-error (load > 292kW) | Ave-error (load > 292kW) |
|---|---|---|---|---|
| Error 1 | 124.7 | 34.2 | 54.1 | 36.7 |
| Error 2 | 191.9 | 39.9 | 47.7 | 33.3 |
| Error 3 | 143.9 | 35.7 | 52.8 | 34.9 |
| Error 4 | 140.8 | 36.0 | 50.4 | 33.6 |
| Error 5 | 140.1 | 31.7 | 37.9 | 21.9 |
Numerical comparison of prediction errors (in kW).
CONFLICTS OF INTEREST
The authors declare no conflicts of interest.
AUTHORS' CONTRIBUTIONS
Methodology, Renshu Wang; software, Renshu Wang; validation, Renshu Wang, Jing Zhao; formal analysis, Renshu Wang; investigation, Renshu Wang; resources, Renshu Wang; data curation, Renshu Wang; writing—original draft preparation, Jing Zhao; writing—review and editing, Jing Zhao; visualization, Renshu Wang; supervision, Renshu Wang; project administration, Renshu Wang; funding acquisition, Renshu Wang.
Funding Statement
This research was funded by the research project of State Grid Corporation of China (Electric artificial intelligence experiment and public service platform technology), grant number 52130419000J and research project of State Grid Fujian Electric Power Co., Ltd., grant number 52130420000D.
ACKNOWLEDGMENTS
This research is supported by the research program from Postdoctoral Workstation of State Grid Fujian Electric Power Co., Ltd. and the research projects of 52130419000J and 52130420000D. Thank reviewers and editors for their helpful comments on this paper. And we also appreciate Bin Chen, Chaohui Xie, Lifang Wu, Bingqian Liu, Wuxiao Chen for their efforts on research guidance and data collection.
Appendix A
where num_data is the original numerical data, text_data is the vectorized data, onehot_dim is the dimension of the vector after one-hot coding, lookback is the range of the history data for prediction, future is the moment at which the load will be predicted, minind is the minimal index of the data set,maxind is the maximum index of the data set,bhsize is the size of the batch of samples.
Program 1: Data generator
Process: define generator(num_data, text_data, future, onehot_dim, lookback, minind, maxind,bhsize)
while 1:
if i + bhsize >= maxind:
i = minind + lookback
rows=np.arange(i, min(i+bhsize, maxind))
i += len(rows)
samples=np.zeros((len(rows),lookback//step, num_data.shape[-1]))
targets = np.zeros((len(rows),))
txtsamples=np.zeros((len(rows),lookback//step,onehot_dim))
for j, row in enumerate(rows):
indices=range(rows[j]-lookback, rows[j], step)
samples[j] = num_data[indices]
txtsamples[j]=text_data[indices]
targets[j] = data[rows[j] + future][1]
yield [samples,txtsamples], targets
Appendix B
where the num and txt represent the inputs of numerical data and textual data respectively, ki is the number of kernels in corresponding layers, t1 is the output result.
Program 2: model construction
Process:num=Input(shape=(None, num_data.shape[-1]))
txt=Input(shape=(None, onehot_dim))
t1_a=layers.Conv1D(k1,1,activation="relu', padding="same')(num)
t1_b=layers.Conv1D(k2, 1, activation="relu', padding="same')(num)
t1_b=layers.Conv1D(k3, 3, activation="relu', padding="same')(t1_b)
t1_c=layers.Conv1D(k4,3,activation="relu', padding="same')(num)
t1_c=layers.Conv1D(k5, 3, activation="relu', padding="same')(t1_c)
t1=layers.concatenate([t1_a,t1_b,t1_c], axis=-1)
txt= layers.Conv1D(k6,3,activation="relu', padding="same')(txt).
…
t1=layers.LSTM(k7, dropout=0.5)(t1)
t1=layers.Dense(1)(t1)
model=Model([num, txt], t1)
REFERENCES
Cite this article
TY  - JOUR
AU  - Renshu Wang
AU  - Jing Zhao
PY  - 2020
DA  - 2020/11/03
TI  - Deep Learning-Based Short-Term Load Forecasting for Transformers in Distribution Grid
JO  - International Journal of Computational Intelligence Systems
SP  - 1
EP  - 10
VL  - 14
IS  - 1
SN  - 1875-6883
UR  - https://doi.org/10.2991/ijcis.d.201027.001
DO  - 10.2991/ijcis.d.201027.001
ID  - Wang2020
ER  -