
Classification of Diabetic Rat Histopathology Images Using Convolutional Neural Networks
 , Hasan Erbay2, , Gökalp Çinarer1, , Hatice Baş3,
 - DOI
- 10.2991/ijcis.d.201110.001How to use a DOI?
- Keywords
- Convolutional neural networks; Transfer learning; Classification; Histopathology
- Abstract
Diabetes mellitus is a common disease worldwide. In progressive diabetes patients, deterioration of kidney histology tissue begins. Currently, the histopathologic examination of kidney tissue samples has been performed manually by pathologists. This examination process is time-consuming and requires pathologists' expertise. Thus, automatic detection methods are crucial for early detection and also treatment planning. Computer-aided diagnostic systems based on deep learning show high success rates in classifying medical images if a large and diverse image set is available during the training process. Herein, transfer learning-based convolutional neural network model was proposed for the automatic detection of diabetes mellitus using only rat kidney histopathology images. The model monitors structural changes, especially in the glomerulus and also other parts of the kidney caused by the damages of diabetes. According to the simulation results, the proposed model has reached 97.5% accuracy. As a result, the recommended model can quickly and accurately classify histopathology images and helps pathologists as the second reader in critical situations
- Copyright
- © 2021 The Authors. Published by Atlantis Press B.V.
- Open Access
- This is an open access article distributed under the CC BY-NC 4.0 license (http://creativecommons.org/licenses/by-nc/4.0/).
1. INTRODUCTION
In today's world, Diabetes Mellitus (DM) is still a worldwide chronic and metabolic disorder health problem having high morbidity and mortality rates. Between 2.5% and 3% rate of the world population suffers from the disease. In some countries, the rate might reach up to 7% and is increasing rapidly [1]. It is among the major cause of death even in most developed countries and there is concrete evidence of epidemics in many industrialized countries. According to the International Diabetes Federation (IDF), there are about 463 million people suffer from DM in the world, while this number is expected to reach about 578 million people by 2045 [2]. Hyperglycemia, caused by a disorder in insulin secretion, insulin effect, or both of these factors, characterizes this metabolic disease [3].
On the other hand, hyperglycemia may cause several organs to dysfunctions, in particular, kidneys as well as blood vessels, eyes, nerves, and heart [4]. The kidney maintains the internal environment of the living body [5] and its renal tubular system is extremely sensitive to changes in the internal environment such that change in hyperglycemia. Moreover, diabetic metabolic changes might lead to various pathologic differentiation. Despite the treatment methods available, the risk of onset and progression of diabetic kidney disease is very high [6]. Therefore, there is a vast number of studies focused on the identification effects of DM on the kidneys [1].
Histopathological images are usually evaluated by morphological measurements [7]. Diagnosis of the disease is still performed traditionally by pathologists through manual inspection of histopathological images. The diagnosis process has some drawbacks such that, in addition to the possibility of human error, it is expensive, time-consuming, and diagnosis accuracy depends on the pathologists' expertise [8]. However, computerized methods, especially based on image analysis and using machine learning methods, facilitate the identification of pathological findings, help to make the right diagnosis, and support the pathologist's workflow as a second reader [9].
Neural networks (NNs) have been used to solve various problems such as Mellin et al. [10] developed a hybrid model based on modular NNs and fuzzy systems to determine the risk of persons' hypertension, Castillo et al. [11] proposed modular NNs based multimodal biometrics system, Sánchez et al. [12] designed so-called grey wolf optimizer for modular NN to perform human recognition. Later, Sánchez et al. [13] improved their modular NN-based human recognition method by introducing dynamic parameter adjustment.
Recent improvements in information and computer technologies, as well as the existence of the vast amount of diverse digital data, lead the computerized methods to play an important role in many diverse areas including medicine and life sciences. Lately, many successful studies have been done using only digital images such that detection of breast cancer [14], diagnosis of lung lesions [15], detection of rheumatoid arthritis [16], diagnosis of lumbar spondylolisthesis [17], and brain tumor classification [18]. The common side of these studies is that they are all based on the convolutional neural network (CNN), a state-of-the-art approach in image processing. It is a deep learning method in which artificial NNs are used and is a multilayer NN structure. Nowadays, CNNs attracted many researchers with diverse approaches such as medical image analysis groups in the world are rapidly entering the field and applying CNN to classification problems, and promising results are emerging [19]. Moreover, Poma et al. [20] studied on the optimization of CNN using the fuzzy gravitational search algorithm method on MNIST database.
Typical CNN architecture for image processing consists of a series of data reduction or accumulation layers and a series of convolution filter layers. Convolution layers are used as small feature detectors to explore features. The convolution determines each local feature on the image. Before the network starts for training, some hyper parameters such that the number of layers, the number of neurons, the number of iterations, the number of samples for both training, and validating are determined.
CNNs are successful especially in feature extraction and classification problems. Compared to NNs, CNNs perform better. There are a couple of reasons behind the better performance. CNNs extract features automatically, and besides customary features, some of them are data-specific ones. Unlike NNs, CNNs use not only pixel values but also their spatial positions. To devise a successful CNN model, a diverse but labeled data corpus is required. Moreover, the quality of the images and the appropriate network design are important factors [19–22]. However, in situations where enough data is not available, data augmentation and transfer learning [23,24] can be used. Transfer learning makes use of a previously trained model on a new problem. Nowadays, it is a popular approach in deep learning because it allows training CNN with relatively little data. It is a crucial advantage of transfer learning since most real-world problems do not have millions of labeled data to train complicated models. Especially, it is difficult to get sufficient data in the life sciences fields where specialist annotations are expensive and diseases are scarce [25].
This study offers CNN based models to the DM-induced kidney damage using only histopathological images of rats. The model facilitates the researchers in the decision-making process toward the correct determination of pathologies. To attain better accuracy, the model uses state-of-art methods such as transfer learning and online data augmentation. The test results suggest that the model is promising, and can be used in laboratory environments by researchers. To the best of our knowledge, the study is unique and opens a new era for using image-based computerized methods in the decision-making process to DM-induced damages from kidney histopathology rats images. Since the kidneys are the leading organs damaged by diabetes, the kidney damage that occurs should not be left to the researcher's expertise. Our dataset is unique and is used for the first time in computer-aided diagnosis. The main contribution of this study to the literature is the classification of histopathological images that are difficult to evaluate with high accuracy of 97.5% with minimal preprocessing.
2. PROBLEM FORMULATION
Different pathological changes can be observed in the kidneys' cross-sections due to various factors. It is quite time-consuming to analyze the cross-sections. Sometimes it is also difficult for a human to identify these pathologic changes even when using a microscope. So, in this research, we aimed to answer possible usage of computerized models, especially, CNN for exhibiting differentiations between diabetic and nondiabetic in kidney histologic images. That is, after giving a set of kidney images, it was required from the system to distinguish whether the images were diabetic or nondiabetic. This is the hypothesis of the study, namely,
Computerized methods are able to differentiate diabetic and nondiabetic rat kidney images by taking the structural differences caused by diabetes.
The diabetic and nondiabetic rat kidney images are different on the light microscope. In diabetic rat kidney, dilatation of Bowman's space, glomerular lobulation, and tubular degeneration can be seen in the light microscope. The expansion of Bowman capsule is called the dilatation of Bowman's space. One of the abnormal renal glomerulus morphology is glomerular lobulation. A lobulation is an appearance resembling lobules. The degeneration is characterized by tubule cells with an eosinophilic change [26,27]. On the other side, the changes in the staining properties of diabetic rat kidney can be seen. But, these pathologic changes are not seen in the nondiabetic rat kidney. CNN learns these differences between rat kidneys' images and tells us whether the images are diabetic or nondiabetic.
3. MATERIALS AND METHODS
3.1. Image Acquisition
The dataset in this study contains the cross-sections of male Wistar rats kidney images, and it was initially formed by Baş and Kalender's and used in the research that they focused on the effects of DM on the kidneys in 2016 [1]. In obtaining images in the dataset, they followed all the procedures pointed out by international guidelines for the usage and care of laboratory animals. Prior to starting the study, the ethical protocol was received from the Gazi University Animal Experiments Local Ethics Committee, with ethical protocol number: G.Ü.ET—11.028. The protocol permitted to use only six rats in each group, so six rats had diabetes and six nondiabetes. Each rat was weighed between 200 and 250 grams. DM was induced using an intraperitoneal injection of Streptozotocin at a single dose of 55 mg/kg. After sacrificing rats, the kidneys were dissected, and paraffin blocks were prepared. Sections were taken from paraffin blocks and stained with hematoxylin and eosin (H&E). Stained kidney sections were examined by a light microscope (Olympus BX51 made in Japan) and photographed (Olympus E-330 with Olympus Optical made in Japan). From each rats' kidney, ten cross-sections were extracted. Later, some of these cross-sections with different textual regions were further split to separate these regions to obtain the final dataset of 396 rats' kidney cross-section images, of which 180 were diabetic and 216 nondiabetic.
3.2. Dataset
As noted above, the data set consisted of 396 images, 180 diabetic and 216 nondiabetic. Each image had a resolution of 453×326 and a depth of 24 bits. The dataset is fairly small in terms of size. However, recent improvements in computer science, such as transfer learning, data augmentation, allow us to develop models with high accuracy even with small datasets. Figure 1 shows some of the selected raw images in the dataset.
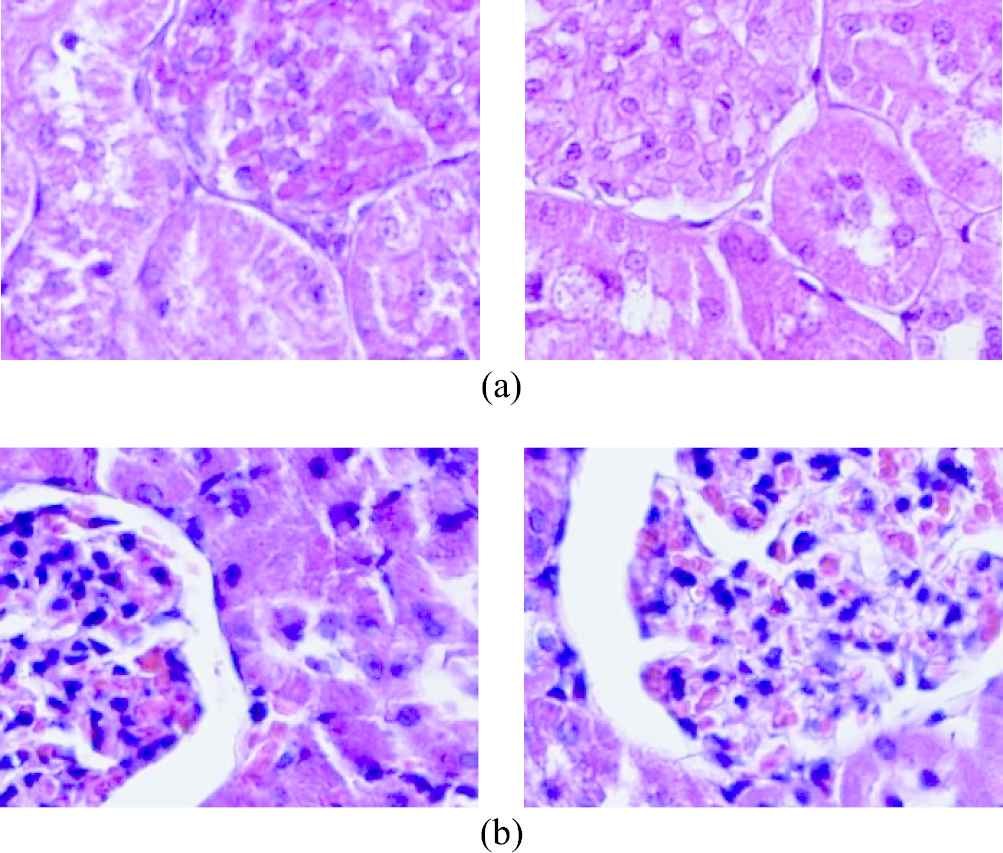
Original (a) nondiabetic and (b) diabetic raw images from the dataset.
3.3. Data Preprocessing and Splitting
Every image in the dataset was applied to a sequence of operations before supplying them to train the model. First, they were resized to 224×224. Then, each was applied a bicubic interpolation over 4×4 pixel neighborhood for smoothing the input images. Figure 2 shows some samples of final diabetic and nondiabetic images in the dataset after preprocessing.
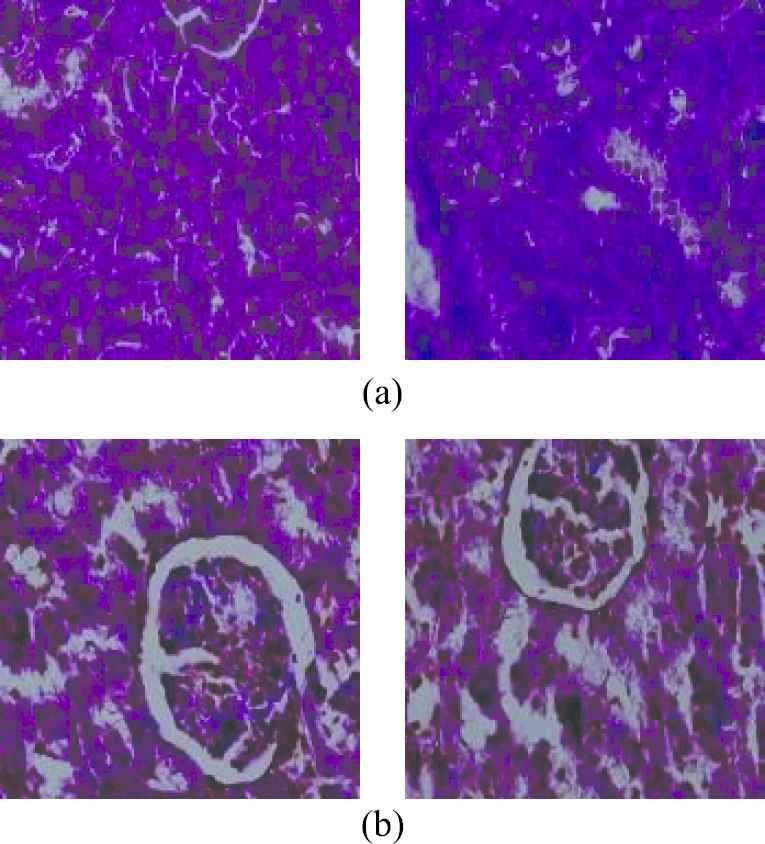
Preprocessed (a) nondiabetic and (b) diabetic images from the dataset.
Later, the dataset was randomly split into three parts. One part, 20% of the dataset was reserved for testing. The rest was set aside for training and validation purposes. Using the stratified selection strategy, 70% of the images were allocated for training and 30% for validation. Table 1 shows the number of images in training, validation, and testing sets
3.4. Data Augmentation
The performance of CNN-based methods highly depends on the amount of data otherwise training CNN using relatively small amounts of data might result in convergence and/or overfitting problems. To overcome these problems, data augmentation is a good alternative that prevents CNN from learning irrelevant patterns, overfitting, and memorizing the exact details of the training images, while boosting overall performance. Thus, online data augmentation was applied by randomly translating the images up to three pixels horizontally and vertically, and rotating the images through an angle of up to 20 degrees.
3.5. Transfer Learning
Transfer learning is an approach that allows getting the benefit of experience. Recently, it is often preferred in CNN-based tasks, especially when the dataset is small, intending to obtain the learning curve of a high starting point, high slope, and high asymptote. In this approach, a pretrained model for a task is redesigned to transfer knowledge in a second but related task [28].
On the other hand, the cumbersome of transfer learning is to determine appropriate fine-tuning parameters. There are no theoretical methods in obtaining optimum parameters. Thus, the hit and trial method using intuition is the current approach in getting these parameters, which requires a lot of computation.
3.6. Classification Model
VGG-19, one of the state-of-the-art pretrained network, was the starting point of our transfer learning-based CNN model. VGG-19 is a convolutional NN that had been trained on 1.2 million training images from the ImageNet database. The model has a total of 47 layers. There are 19 layers with learnable weights, of which 16 are convolutional layers and 3 fully connected layers. The image input size of the network is 224×224×3. The number of trainable parameters is 138.357.544 [29,30].
Herein, VGG-19 was the starting point for our model for automatic detection of DM using only rat kidney histopathology images. First, VGG-19 was adapted by removing the original classifier and placing a binary classifier. Moreover, initial convolutional layers 1 to 6 were frozen since these layers extract low level features common to almost all images. Figure 3 shows the graphical abstraction of the classification model, including these modifications.
| Groups | Diabetic | Nondiabetic | Total |
|---|---|---|---|
| Training | 101 | 120 | 221 |
| Validation | 43 | 52 | 95 |
| Testing | 36 | 44 | 80 |
| Total | 180 | 216 | 396 |
Train, validation, and test sets statistics.
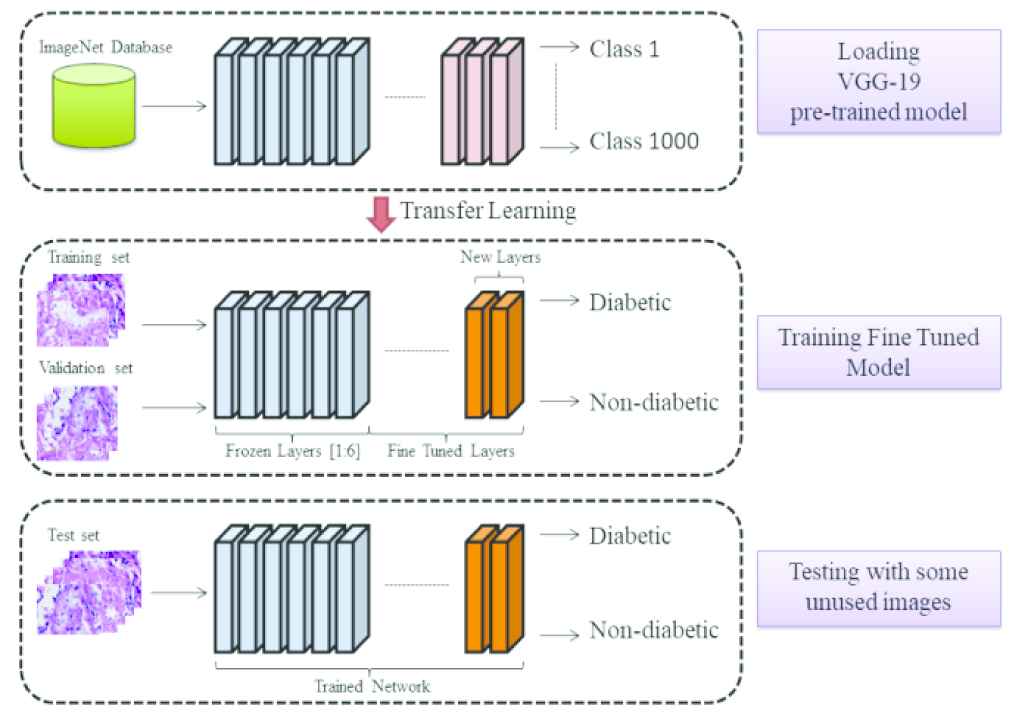
Graphical abstraction of the classification model.
After that later, layers were fine-tuned to extract our dataset dependent specific features for both diabetic and nondiabetic kidneys. Table 2 shows the final hyper parameters along with frozen weights.
Stochastic gradient descent was used in obtaining parameters during training the model. The maximum epochs were set to 30. In order to prevent overfitting, L2 regularization was used. The mini-batch size, which means how much data the model will process at the same time, was taken 16. The learning rate was 3.0000e-04.
4. SIMULATION RESULTS
The CNN-based model was implemented in MATLAB® programming environment. After that, the models were trained on a dataset containing 221 images and validated during the training using the validation dataset containing 95 images to check accuracy in between every five epochs. The model initiated with the pretrained VGG-19 network [29]. The model uses only pixel information, moreover to prevent overfitting the model dressed with online data augmentation. It is worth to mention that the model was also started via AlexNet [23] and GoogleNet [31]. Since VGG-19 performed slightly higher than the other two, only the simulation results by VGG-19 are given below.
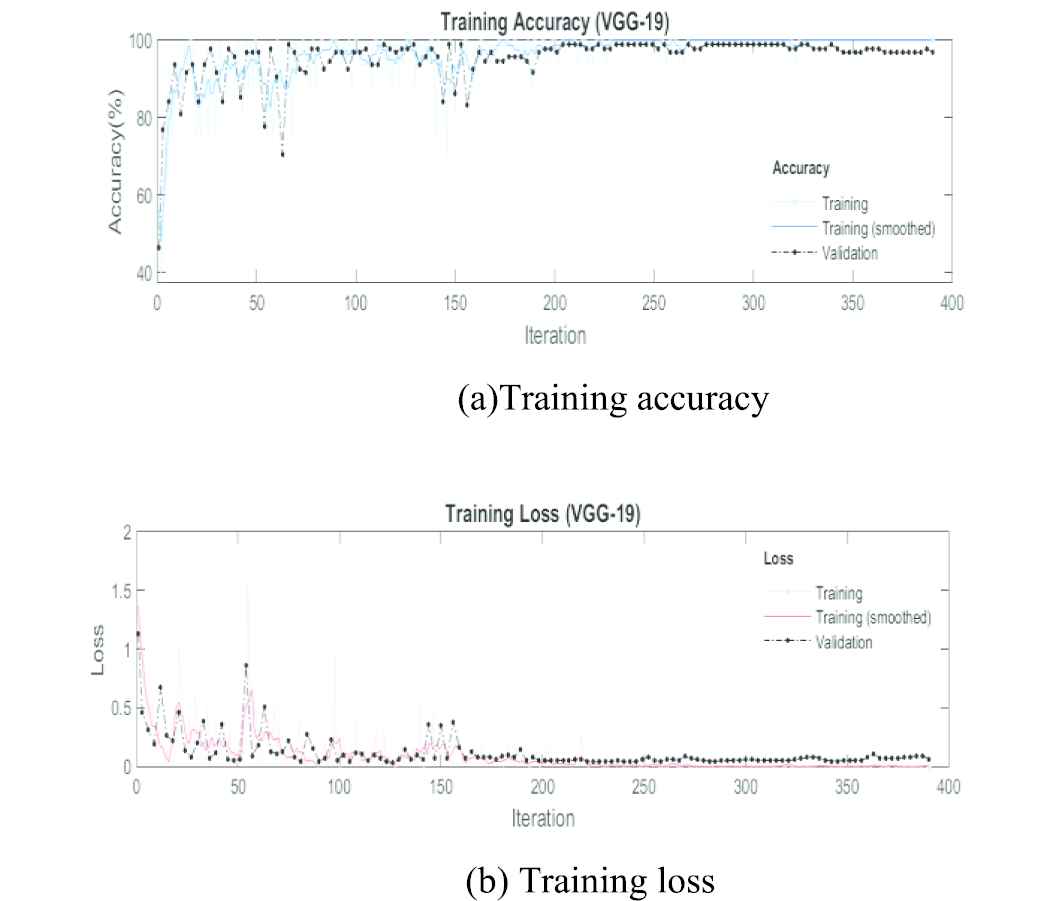
Figure 4a shows plots of accuracy over iterations for the transfer learning model initiated with VGG-19, on the other hand, Figure 4b shows the loss graph. In other words, the training accuracy (blue line) and validation accuracy (dashed black line) approach each other during the training process. It also can be seen from the loss subplots that both the training loss and validation loss are low and decrease throughout the learning process.
| Parameter | Value |
|---|---|
| Optimizer | Stochastic gradient descent |
| Momentum | 0.900 |
| Initial learning rate | 3.0000e-04 |
| L2 regularization | 1.0000e-04 |
| Gradient threshold method | L2 norm |
| Gradient threshold | Inf |
| Validation frequency | 3 |
| Validation patience | Inf |
| Maximum epochs | 30 |
| Mini batch size | 16 |
| Shuffle | Every epoch |
| Frozen weights (layers) | 1:6 |
Hyper parameters and frozen weights.
Transfer learning using pretrained VGG-19 with fine-tuning.
Figure 5 shows the confusion matrix for the validation test. It is assumed that true positive is the number of cases correctly identified as diabetes (having diabetes) and true negative the number of cases correctly identified as normal (not having diabetes).
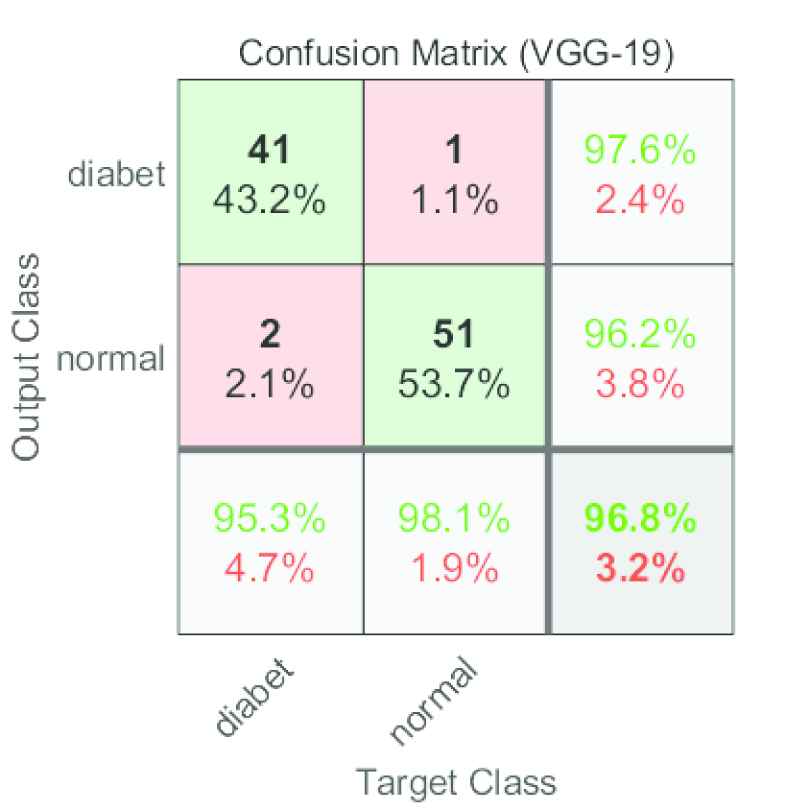
VGG-19 confusion matrix for the validation set.
Observe that the proposed model correctly predicted 92 out of 95 cases, with an estimate of two normal diabetes and one normal diabetes in the validation set.
The efficiency of the transfer learning-based model was evaluated using performance metrics such as sensitivity, specificity, precision, F1 score, false-negative rate, false discovery rate, false-positive rate, negative predictive value, classification accuracy, and Matthews correlation coefficient. These performance metrics are evaluated using the confusion matrices given in Figure 5. The accuracy of the VGG-19 based model was 96.84%. The model's sensitivity was 0.9534. The specificity value was 0.9807 whereas precision was 0.9761. Table 3 presents additional performance statistics.
| Metric | Value |
|---|---|
| Sensitivity | 0.9534 |
| Specificity | 0.9807 |
| Precision | 0.9761 |
| Negative predictive value | 0.9622 |
| False-positive rate | 0.0192 |
| False discovery rate | 0.0238 |
| False-negative rate | 0.0465 |
| Accuracy | 0.9684 |
| F1 Score | 0.9677 |
| Matthews correlation coefficient | 0.9364 |
| Critical success index | 0.9318 |
VGG-19 performance statistics for the validation set.
The model further tested with some unused images, namely, the images that had used neither training nor validating. The test set contains a total of 80 histopathologic images, of which 36 were diabetic rats' kidney images and the remaining 44 were nondiabetic images. Figure 6 shows the confusion matrix for the test set. Observe that the VGG-19-based model mispredicted two false-negative cases. The proposed method accurately predicted all nondiabetic images.
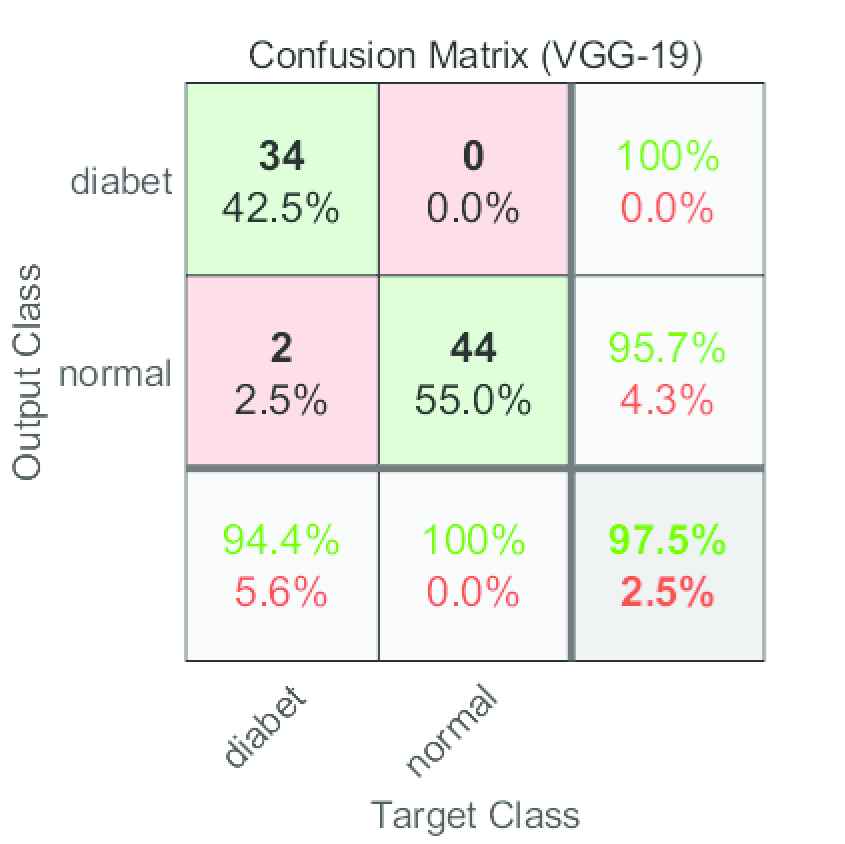
VGG-19 confusion matrix for the test set.
Moreover, the performance metric results for the test set are shown in Table 4. In testing, the accuracy of the model was 97.50%. The model's sensitivity was 0.9444. The specificity value was 1.0000 whereas precision was 1.0000.
5. DISCUSSION
Histological examination is a prevalent technique in diagnosing and grading lots of diseases. The technique is often performed by an expert through a microscope examining histopathological images. Nevertheless, the technique is slow and the results are irreproducible, also, the expert's experience and personal take can affect the results [32]. Furthermore, the agreement between experts about histopathological images range between 61% and 73% [33]. Moreover, the analysis of histological preparations is very tiring and time-consuming. These problems can be resolved by computerized methods, especially, CNNs, adjusting a well-trained network on a certain domain to another one. Recently, CNNs have been ably applied to various histological difficulties [34]. In this study, we presented an application of CNN-based transfer learning to classify kidney tissues from histological images. The technique is derived from the standard tissue histologic samples. Three recognized CNNs architectures (AlexNet, VGG-19, and GoogleNet) were trained to identify visual images for resolving the formerly mentioned problems. These approaches were used for the first time to classify diabetic and nondiabetic rat kidney images. Experimental results show that CNN architectures can significantly differentiate diabetic and nondiabetic images. The performance of VGG-19, AlexNet, and GoogleNet were very close to each other but VGG-19 had slightly higher accuracy results than both AlexNet and GoogleNet.
| Metric | Value |
|---|---|
| Sensitivity | 0.9444 |
| Specificity | 1.0000 |
| Precision | 1.0000 |
| Negative predictive value | 0.9565 |
| False-positive rate | 0.0000 |
| False discovery rate | 0.0000 |
| False-negative rate | 0.0556 |
| Accuracy | 0.9750 |
| F1 score | 0.9714 |
| Matthews correlation coefficient | 0.9505 |
| Critical success index | 0.9444 |
VGG-19 performance statistics for the test set.
Recent advances in computer technology have facilitated the acquisition and processing of high-resolution images. These advances have revolutionized the field of computerized recognition and artificial intelligence. Thus, successful studies have been performed in imaging pathology especially, CNN-based studies such as brain tumor diagnosis using MR images, interstitial lung disease diagnosis using CT images, and colon cancer diagnosis using histopathological images are some of the sounding ones [15,35,36]. However, studies on the damage caused by DM on rat kidney tissues are relatively rare. Below we briefly summarize some of these studies.
Filho et al. [37] suggested so-called SampEn2D, a two-dimensional sample entropy as a metric to classify diabetic using phrenic nerve histological rat images. A total of 44 Wistar rats from three different groups, untreated diabetic, insulin-treated diabetic, and nondiabetic were analyzed. The AUROC value was 0.96. The sensitivity was 0.87 whereas specificity was 0.82. Wang et al. [38] proposed the method based on support vector machine (SVM) with maximum relevance minimum multicollinearity feature selection. The method automatically segments the cell nucleus in histopathological images obtained from mice and extracts shape as well as statistical and textural features. Hermsen et al. [39] developed a U-Net CNN model for the segmentation of glomeruli, tubulin, and interstitium of kidney histopathologic tissue on periodic Acid–Schiff (PAS) stained sections. Gallego et al. [40] and Pedraza et al. [41] applied CNN with the pretrained AlexNet model that classifies Glomerulus and non-Glomerulus images on public AIDPATH kidney dataset. The data in the study obtained 10.600 regions of interest (ROIs) 40 whole slide images (WSIs). The difference between our study from these studies is that it distinguishes damages in the glomerulus and also other parts of the kidney.
Lately, Kato et al. [42] developed a new method called segmental histogram of oriented gradients (S-HOG) for the detection of glomeruli in kidney histologic images. F-measure, Precision, and Recall values were 0.866, 0.874, and 0.897 respectively. Simon et al. [43] used local binary patterns (LBP) image properties for glomerular detection. In addition, SVM and SVM + CNN methods were compared according to different staining methods in rat kidney histologic images. Kumar et al. [44] presented a comparative study on 960 histology images of 20 different classes on the public KIMIA Path960 dataset. As a result, 94.72% accuracy was obtained with VGG-16. Mazo et al. [34] presented CNN via transfer learning to the some CNN models (ResNet, VGG-19, VGG-16, and Inception) for automatic recognition and classification of cardiovascular tissues in histologic images. Lo et al. [45] proposed a method using automatic stain translation and glomerulus detection using Generative Adversarial Network and R-CNN. In another study, Bueno et al. [46] classified glomeruli with 98.16% accuracy on histopathology images of kidneys of 47 WSIs kidneys stained with PAS using SegNet and AlexNet.
In this study, we developed a transfer learning CNN model with online data augmentation to determine whether the histopathological images of rat kidney stained with H&E were diabetic. We used only pixel information and ignored biochemical markers. Data augmentation is used to prevent overfitting. All images were labeled by two independent biologists. Then all images were resized to fit the model. The model correctly classifies 78 of the 80 histological images not previously encountered. The accuracy, precision, sensitivity, specificity values of the network were 97.50%, 100%, 94.44%, and 100%, respectively. This study presents a fully automated and accurate system that requires minimal preprocessing for kidney tissue classification of diabetic and nondiabetic rats. The system showed high performance even in a small number of images. In other words, this method provides significantly higher performance with a small number of images. This is a very crucial point since the number of animals used in studies on living organisms is limited, so the number of images is scarce.
There are many biological similarities between animals and humans. So, the results of experimental studies on animals provide important contributions to the analysis of both physiological and pathological mechanisms in humans. For this purpose, experimental animals, especially mice and rats, are used in most of the studies. We need for animals in experiments to understand the physiological and pathological mechanisms of cells, tissues, organs, and systems, to learn the relationships between systems, to develop new diagnostic methods for diseases or functional disorders, to acquire new knowledge for the treatment of diseases and disorders, and contribute to the education of researchers [47]. In a previous study, histological changes in rat diabetic kidney tissue nearly resemble changes in human kidney tissue [48]. Thus, the proposed method can be used on human kidney tissue after retraining the model using human kidney images. It also presents a fully automated system with high accuracy and minimal preprocessing for diabetes classification using rat kidney tissue images. Moreover, the system overcame overfitting by performing well on a limited number of private dataset. In short, the proposed method is an optimum system for differentiating diabetic and nondiabetic rat kidney histopathology images.
6. CONCLUSION
Throughout this paper, a fine-tuning CNN model that is user-independent time saving was presented to characterize histopathologic rat kidney images as diabetic or nondiabetic. Performance metrics such as accuracy, sensitivity, and specificity of the model are encouraging. The model is suitable for use in the laboratory environment. As an output of this study, the usage of CNN technology can assist the pathologists in the final decision and improve the accuracy in the decision-making process.
As a future study, a hybrid classification of histopathological images obtained by the treatment of heavy metals and antioxidants to diabetic individuals will be considered with the residual NN (ResNet) and SVM algorithms.
CONFLICTS OF INTEREST
The authors have no potential conflicts of interest to disclose.
AUTHORS' CONTRIBUTIONS
All authors were fully involved in the preparation of this manuscript and approved the final version.
ACKNOWLEDGMENTS
This study was not supported by any funding source.
REFERENCES
Cite this article
TY  - JOUR
AU  - Ahmet Haşim Yurttakal
AU  - Hasan Erbay
AU  - Gökalp Çinarer
AU  - Hatice Baş
PY  - 2020
DA  - 2020/11/17
TI  - Classification of Diabetic Rat Histopathology Images Using Convolutional Neural Networks
JO  - International Journal of Computational Intelligence Systems
SP  - 715
EP  - 722
VL  - 14
IS  - 1
SN  - 1875-6883
UR  - https://doi.org/10.2991/ijcis.d.201110.001
DO  - 10.2991/ijcis.d.201110.001
ID  - Yurttakal2020
ER  -