
Research of Synergy Warning System for Gas Outburst Based on Entropy-Weight Bayesian
 , Liwen Guo, Xiao Cui
- DOI
- 10.2991/ijcis.d.201214.001How to use a DOI?
- Keywords
- Gas outburst; Characteristic values of gas emission; Entropy-Weight Bayesian; Synergy; Early warning
- Abstract
Based on the statistical analysis of coal occurrence characteristics, and dynamic phenomena of coal and rock in Qianjiaying coal mine, China, an area–local outburst early warning system based on outburst key factors and early warning indicators was constructed. Statistical analysis of anomaly features of gas emission rate prior to outburst determined that the early warning index of the heading-face featured characteristic values of gas emission rate, including variance, peak difference, and fluctuation slope. Based on the entropy-weight method, the weight of indicators in the early warning process was determined, and the membership degree of each early warning grade under the synergistic effect of multiple indicators was calculated using Bayesian theory to determine the early warning grade. An outburst early warning model for Qianjiaying coal mine was constructed. The application client for an early warning system was developed, including a real-time gas data acquisition system and a visual early warning system. During the application of the early warning system in Qianjiaying Mine, it detected abnormal early warning indicators and issued early warning signals 6 hours in advance, avoiding casualties and equipment losses.
- Copyright
- © 2021 The Authors. Published by Atlantis Press B.V.
- Open Access
- This is an open access article distributed under the CC BY-NC 4.0 license (http://creativecommons.org/licenses/by-nc/4.0/).
1. INTRODUCTION
Coal and gas outburst is a natural phenomenon that can occur during coal mining, and seriously affects coal mine safety and sustainable production of coal [1]. A widely accepted theory at present for the mechanism of coal and gas outbursts is that they arise through the combined action of ground stress, gas, and coal mechanical structure properties [2,3]. Factors affecting outburst include gas pressure, gas content, structural characteristics of coal, in situ stress, geological structure, lithology of roof and floor, and degree of variation of coal thickness [4–9]. Forecasting is the basis and premise for preventing coal and gas outburst, and can reduce casualties and property losses resulting from an outburst [10,11]. Early warning indicators are an important basis for building an effective prediction system. Common early warning indicators include characteristic values of electromagnetic radiation, temperature, characteristic values of gas emission dynamics, gas concentration, and gas emission rate, etc. [12–16]. These indicators can all be important early warning signs of coal and gas outburst.
In researching coal and gas outburst early warning systems, various systems have been formed for mine disaster prevention, evaluation, and decision-making. For example, by combining a geographic information system (GIS) system and an integrated control center, a relatively perfect early warning system has been established [17]. In another approach, the Internet is intelligently applied to a mine's early warning system, and the indicators affecting coal and gas outburst are observed in real time via the network to realize accurate risk identification and provide an early warning [18]. A dynamic safety information platform for coal mines, based on the Internet of Things, has also been developed [19].
At present, the research on the combination of Bayesian theory and information entropy has achieved certain results in various fields. In the field of hydrogeology, the uncertainty of Bayesian model is measured based on information entropy, and a rating model for water quality classification is obtained [20]. In economics, a dynamic random model is established by Bayesian estimation and information entropy to study excessive consumption [21]. Based on remote sensing technology, the spatial distribution of soil moisture was estimated by Bayesian maximum entropy method [22]. Prior to this, the combination of Bayesian theory and information entropy has not been applied to the prevention and control of coal and gas outburst in mines. Therefore, based on the previous research results, it has certain practical significance to establish a mine disaster early warning system on the basis of Bayesian theory and information entropy.
Although some achievements have been made in researching real-time monitoring and early warning technology for coal and gas outburst, work remains to be done on how to incorporate the key factors linked with outburst in early warning systems, how to combine these key factors with early warning indicators, and how to determine the grade of early warning required under the synergistic effect of multiple indicators. Taking Tangshan Qianjiaying coal mine, China, according to the change rule of dynamic data of each index before coal and gas outburst, this paper constructs an index system combining the key factors of coal and gas outburst with early warning indexes. Entropy-weight theory is used to objectively determine the index weight coefficient, Bayesian method is used to carry out probability inference of data information and the probability of coal and gas outburst is obtained. Mine coal and gas outburst data are consistent with Bayesian theory. Under the framework of conditional probability, monitoring index data in normal period is taken as prior information. Through statistical analysis of previous accident data, the prior information is modified to obtain posterior information. The weight value of each index is combined with the posterior information to construct outburst early warning model in line with the actual situation of the mine, realize the early warning classification of multi-index cooperative action of the heading face, and provide technical support for the prediction and prediction of mine coal and gas outburst. At the same time, the existing safety monitoring system of Qianjiaying coal mine of Kailuan mining area was used to collect real-time gas emission data, and a collaborative, multi-index, visual early warning system was developed to realize continuous real-time early warning monitoring for coal and gas outburst and provide guarantees for safe mine production.
2. METHOD
2.1. Principles of Early Warning
The key to coal and gas outburst warning is to scientifically determine the warning index and its critical values. According to the actual production, the area-local early warning system of Qianjiaying mining area is constructed. First of all, area early warning is carried out, with key factors relating to outburst as early warning indicators, with heading-face early warning carried out for areas with abnormal indicators. Heading-face early warning takes dynamic characteristic values of gas emission as early warning indicators. Through the combination of key outburst factors and dynamic characteristic values of gas emission, a coal and gas outburst early warning system under the synergistic effect of multiple indexes in Qianjiaying coal mine was constructed. The construction of the early warning system is shown in Figure 1.
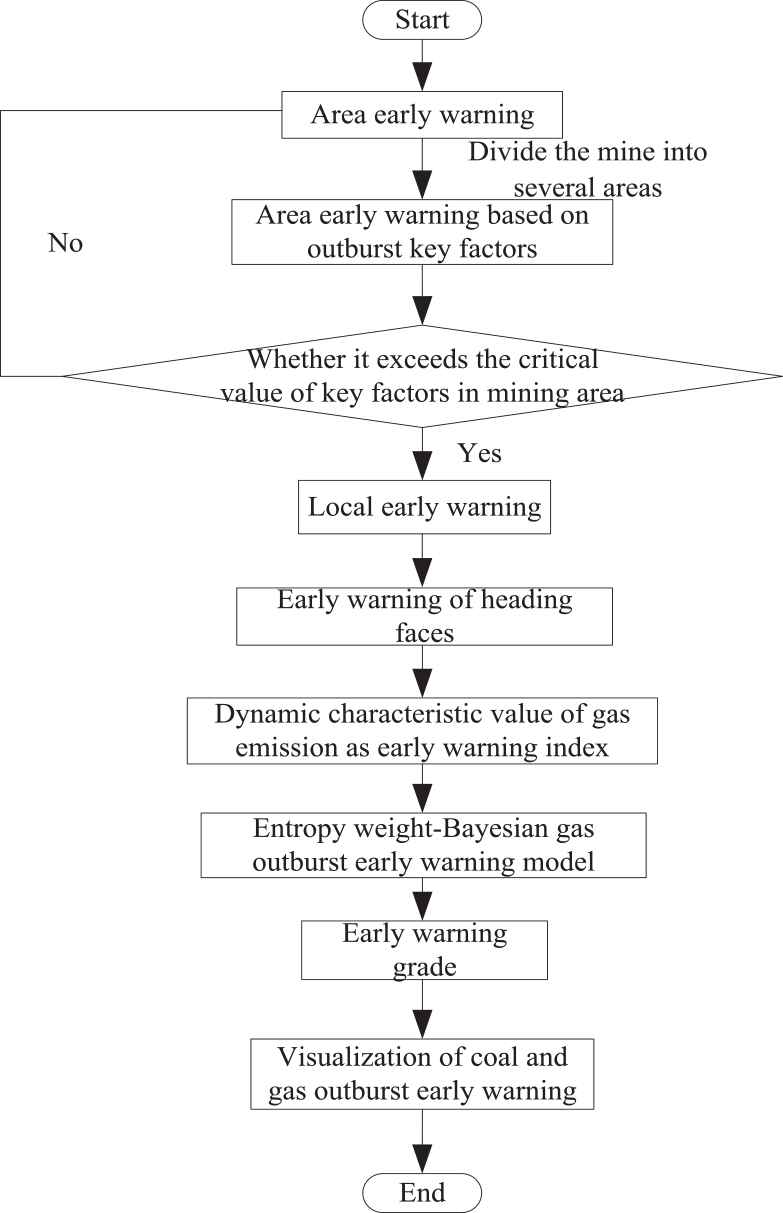
Early warning process.
2.2. Area Early Warning Method
Based on the actual situation in the field, the mine was divided into several regions, the key indicators of area early warning were selected, the critical value of early warning indicators was determined, the monitored index value was compared with the critical early warning values, and real-time early warning instructions were issued. The key factors of coal and gas outburst in Qianjiaying coal mine and the characteristics of dynamic phenomena at the −850 level areas were studied and analyzed, and the geological structure was determined as the key factor of coal and gas outburst in Qianjiaying coal mine. Data analysis showed that the geological structure of the −850 level areas in Qianjiaying coal mine is an important external constraint condition to induce outburst, and gas pressure is the key internal power source for outburst initiation. Therefore, geological structure complexity and gas pressure were taken as key indicators for area early warning. Area early warning indicators should be changed according to the actual situation of the mining area.
2.3. Local Early Warning Method
Local early warning is carried out for heading faces. The real-time warning index for coal and gas outburst in the heading face is the dynamic characteristic value of gas emission. Therefore, the dynamic phenomenon characteristics of the −850 level main crosscut area were statistically analyzed to determine the dynamic early warning index and its critical value at the heading face.
2.3.1. Outburst accident cases
Qianjiaying coal mine “12.24” outstanding accident
The −850 level main crosscut of Qianjiaying coal mine is located at the third level of the mine. The net design specification of the roadway is
Dashucun Coal mine “4.19” outstanding accident
The cross-sectional area of the 172205 material haulage roadway in Dashucun Coal mine is 10 m2, and the air supply rate of the heading face is 320 m3/min. At 00:50 on April 19, 2012, the on-duty dispatcher noted that the gas sensor installed to monitor the return air of the 172205 material haulage roadway reported a gas concentration of 0.9%, and immediately reported the gas situation. At around 01:25, the return air gas level dropped to 0.72%, then at around 01:40, the gas level at the 172205 heading face suddenly increased from 0.18% to 32%, and the return air gas sensor in the roadway stopped working after the gas level increased to 39.5%.
Case studies and relevant documents show that characteristic variations in the gas emission rate can be roughly divided into three scenarios in the period of time prior to outburst occurrence: increase, fluctuation, and first decrease and then another increase. Based on the Regulations on Prevention and Control of Coal and Gas Outbursts and the variation characteristics of gas emission at a heading face, the variance in gas emission (dispersion degree of gas emission), peak difference (abnormal difference of gas emission), and fluctuation slope (abnormal rate of gas emission) were selected as early warning indicators for a heading face.
According to the critical values of the early warning index, the grade standards of the early warning index for the heading face in Qianjiaying coal mine were established, and real-time early warning was carried out using an entropy-weight Bayesian prominent early warning model. A graded early warning method was adopted: “remind” (green), “attention” (orange), and “danger” (red).
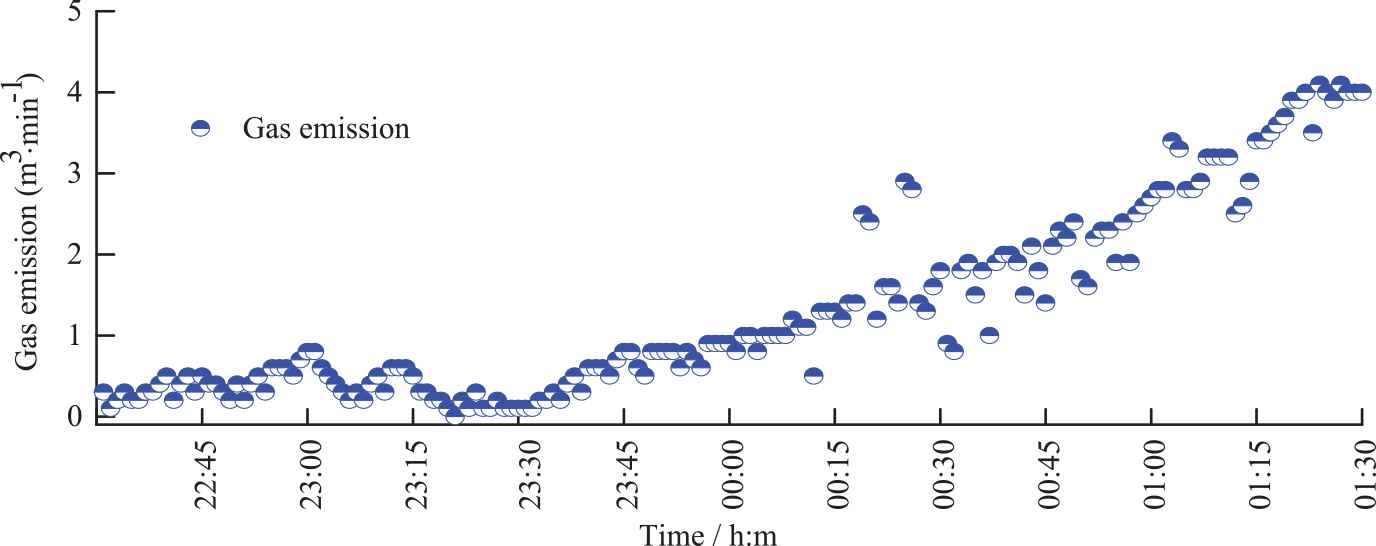
Gas emission before the “12.24” outburst accident.
2.3.2. Early warning index calculation
Suppose a set of monitoring sequences is
The variance, S, indicates the dispersion degree of the monitoring sequence, reflecting the dispersion of the data under certain conditions. If variance is larger, it indicates that the dispersion degree of gas emission is larger, indicating a trend toward coal and gas outburst. Using the variance under an unbiased estimation, the formula is as follows:
The peak difference, F, is a measure of fluctuation size in the statistical monitoring sequence. If the value of F is larger than that of the normal sequence, it indicates that the fluctuation of this monitoring sequence is larger, indicating a trend toward coal and gas outburst. The formula is as follows:
The fluctuation of the slope, K, indicates the direction and speed of the growth or decrease of the monitoring sequence. When
2.4. Critical Value of Early Warning Indexes
2.4.1. Critical value of area early warning indicators
The critical value for outburst in relation to geological structure complexity is based on statistical analysis of geological structure, combined with the numerical values of outburst indexes at the various grades, and the occurrence of gas dynamics phenomena at the −850 level in Qianjiaying coal mine, and finally obtained through analysis. At the same time, based on the production practices of Qianjiaying coal mine and the Regulations on Prevention and Control of Coal and Gas Outburst, the critical values of gas pressure can be determined.
2.4.2. Critical values of the heading-face early warning index
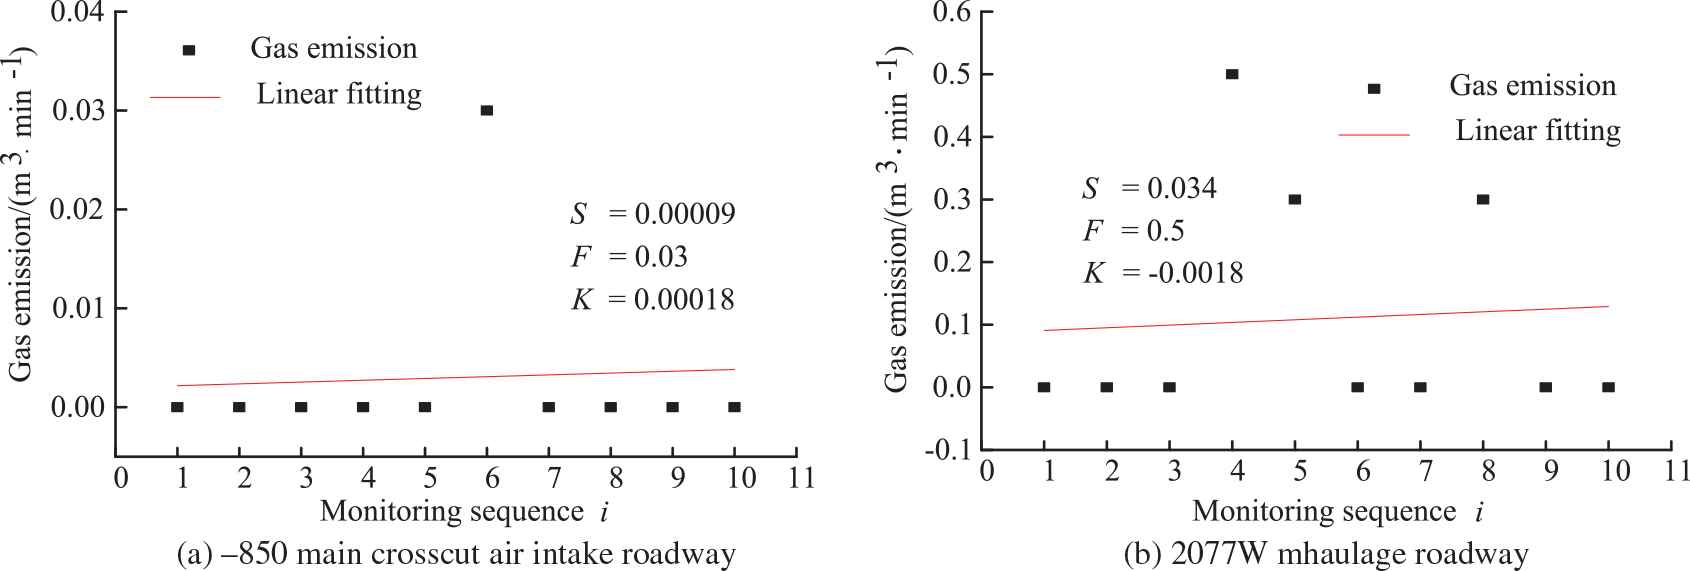
Based on gas emission data during normal production at the −850 main crosscut air-intake roadway and the 2077W haulage roadway heading face in Qianjiaying coal mine, a monitoring sequence was established. According to the mine site conditions,
Analysis sequence of gas emission during a normal period.
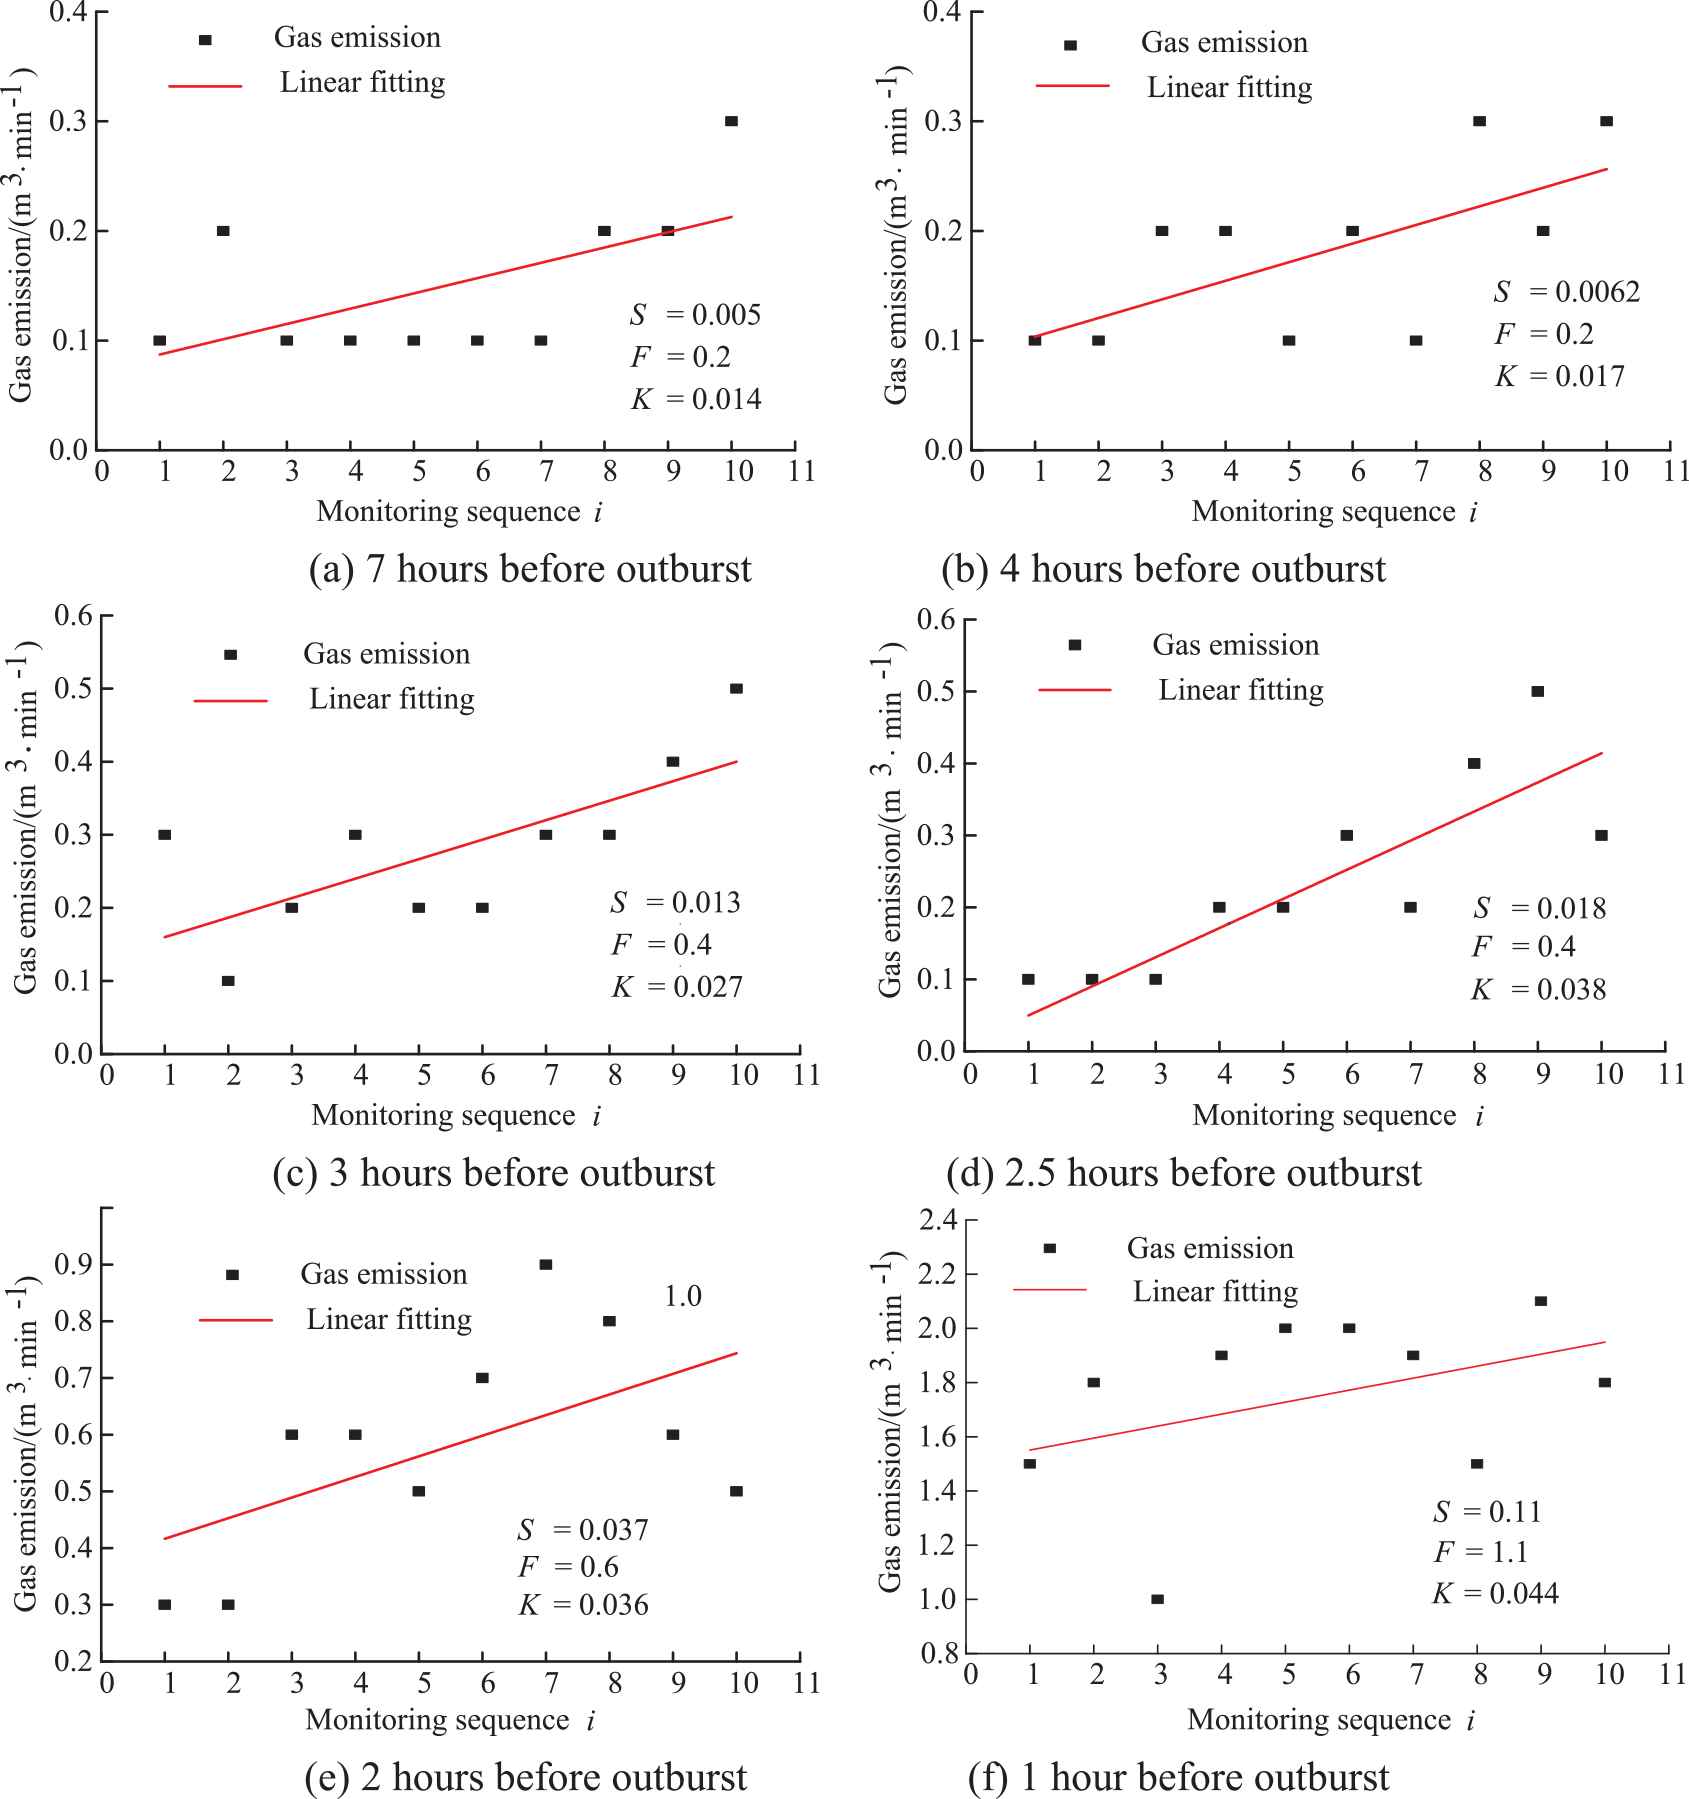
Based on the gas dynamics phenomena at the −850 level main crosscut area of Qianjiaying coal mine, the gas data of different periods were extracted to establish a monitoring sequence, and
Analysis sequence of gas emission during an abnormal period.
Through the analysis of gas emission characteristic values in Figures 3 and 4, the characteristic values of gas emission during an abnormal period and the characteristic maximum values of gas emission during a normal period were selected, a characteristic data sequence was established, and calculating an index critical value.
The normal index value is calculated based on the gas emission during the normal production period from November to December 2018 in Qianjiaying Mine. The variance value range is [0, 0.034], the peak difference value range is [0, 0.5], and the fluctuation slope value range is [0, 0.0018]. When abnormal, the gas data is obtained according to the index values of each time period before the accident in Figures 3 and 4.
Median is the representative value for determining all unit mark values, which is not affected by the maximum or minimum value of the distribution sequence, thus improving the representativeness of the distribution sequence to a certain extent. Therefore, the median value of the calculation sequence is the critical value of the early warning index for tunneling faces. Since the index value is small in normal time, the representativeness of the sequence will be affected if all values are taken for median calculation. Therefore, the maximum index value in normal time is selected, and the index value in abnormal time is combined to establish the characteristic value sequence for median calculation to obtain the index danger critical value. The maximum value of normal variance index is 0.034, combined with abnormal variance index values [0.005, 0.0062, 0.013, 0.018, 0.037, 0.11]. The median of the constituent characteristic sequences [0.005, 0.0062, 0.013, 0.018, 0.034, 0.037, 0.11] is 0.018 as the critical value of variance danger. Similarly, the peak difference critical value was calculated to be 0.41, and the fluctuation slope critical value was calculated to be 0.0271, −0.0271.
According to the abnormal gas index value and the actual situation under Qianjiaying Mine, expert opinions are adopted to determine the warning critical value and the attention critical value to be about 60% and 80% of the danger critical value respectively. In order to improve the accuracy of the early warning system, mines should re-evaluate and determine critical values of variance, peak difference, and fluctuation slopes according to the actual situation in different regions and at different coal seams, to avoid missing reports and false positives.
According to the critical value of the characteristic index of gas emission, early warning standards at all levels were determined, as shown in Table 1.
| Early Warning Indicator | Normal | Remind | Attention | Danger |
|---|---|---|---|---|
| S | [0, 0.0108) | [0.0108, 0.0144) | [0.0144, 0.0181) | [0.0181, +∞) |
| F | [0, 0.246) | [0.246, 0.328) | [0.328, 0.41) | [0.41, +∞) |
| ±K | [0, 0.0162) | [0.0162, 0.0216) | [0.0216, 0.0271) | [0.0271, +∞) |
Gas emission characteristics index grades.
2.5. Early Warning Model and System
2.5.1. Entropy-weight Bayesian principle
Based on the gas emission data from Qianjiaying coal mine, an early warning index value for the heading face was collected, and the weights of variance, peak difference, and fluctuation slope of the early warning index at the heading face in the early warning process were determined using the entropy-weight method. This was to avoid the influence of external factors on the index value as much as possible, and to provide a reasonable basis on which to judge the determination of the early warning grade. According to Bayesian theory, the membership degree of each early warning grade under multi-index cooperative action can be calculated to determine the early warning grade, so as to realize cooperative, multi-index early warning and improve the accuracy of any early warning.
2.5.2. Calculation of index entropy weight
The entropy-weight method is an objective weighting method to determine the index weight according to the information size of each index value [23]. Suppose there are m samples to be evaluated and n evaluation indexes, then an index data matrix can be constructed,
To determine the data matrix:
After normalizing the data, the proportion of the j index in the index under the i sample can be calculated by
To calculate the entropy of the j index:
In the formula:
To calculate the weight of the j index:
2.5.3. Entropy-weight Bayesian early warning model
The Bayesian method is a statistical method based on mathematical theory that can be used to carry out probability inference through data information [24]. Based on the Bayesian method, the membership degree of real-time monitoring sample indexes at each early warning grade was calculated, and the early warning grade could then be more objectively and reasonably determined by combining the entropy weight of each index determined by information entropy.
According to the Bayesian formula, the Bayesian outburst warning model was determined as follows:
According to the concept of geometric probability, the distance method was adopted, and the reciprocal of the absolute value of the difference between the measured gas emission characteristic index value and the selected warning grade standard was used for the following calculation:
The posterior probability formula for calculating coal and gas outburst under multiple indexes is
Using the principle of maximum probability to determine the early warning grade:
2.5.4. Early warning system for coal and gas outburst
The Qianjiaying coal mine was taken as the research object to build a coal and gas outburst system. The coal and gas outburst early warning system was jointly constructed using Visual Basic (VB) programming, MATLAB numerical calculation, and an SQL-server database. The entire early warning system requires less investment, is easy for field personnel to master, and can realize noncontact, real-time, continuous early warning, early warning data-storage, querying, reporting, and other functions.
The coal and gas outburst early warning system consists of two parts: a real-time data acquisition system and a visual early warning system. Its working principle involves a real-time data acquisition system established via an FTP network protocol through a local area network for data transmission; reading of gas monitoring data in the dispatch center in real time; and storage of the collected real-time gas data and other information from the mining area, the heading face, and sampling points in the early warning information database. The visual early warning system is connected to the early warning information database, analyzes real-time gas data for monitoring and early warning, and stores early warning information from regions and crosscuts in the database. The main interface of the visual early warning system displays real-time gas emission characteristic values from all sampling points, carries out cyclic continuous monitoring of the whole mine, and enters the visual early warning interface to enable viewing of early warning information when sampling points are giving abnormal results. The visual early warning interface is divided into two sections. The first layer provides area early warning, key indicators of which are selected to provide early warning for each production area. The second layer provides local early warning, including heading-face early warning. Early warning from the heading face takes absolute gas emission as monitoring data, then cyclically and continuously analyzes and calculates characteristic index values such as variance, peak difference, fluctuation slope, in a specific time sequence. It then determines the coal and gas outburst early warning grade under the synergistic effect of multiple indexes through an entropy-weight Bayesian outburst early warning model, and if the early warning grade moves above the warning grade, the early warning interface displays appropriate instructions, carries out on-site verification through an early warning release platform, and takes corresponding outburst prevention measures. A flow diagram of the early warning system is shown in Figure 5.
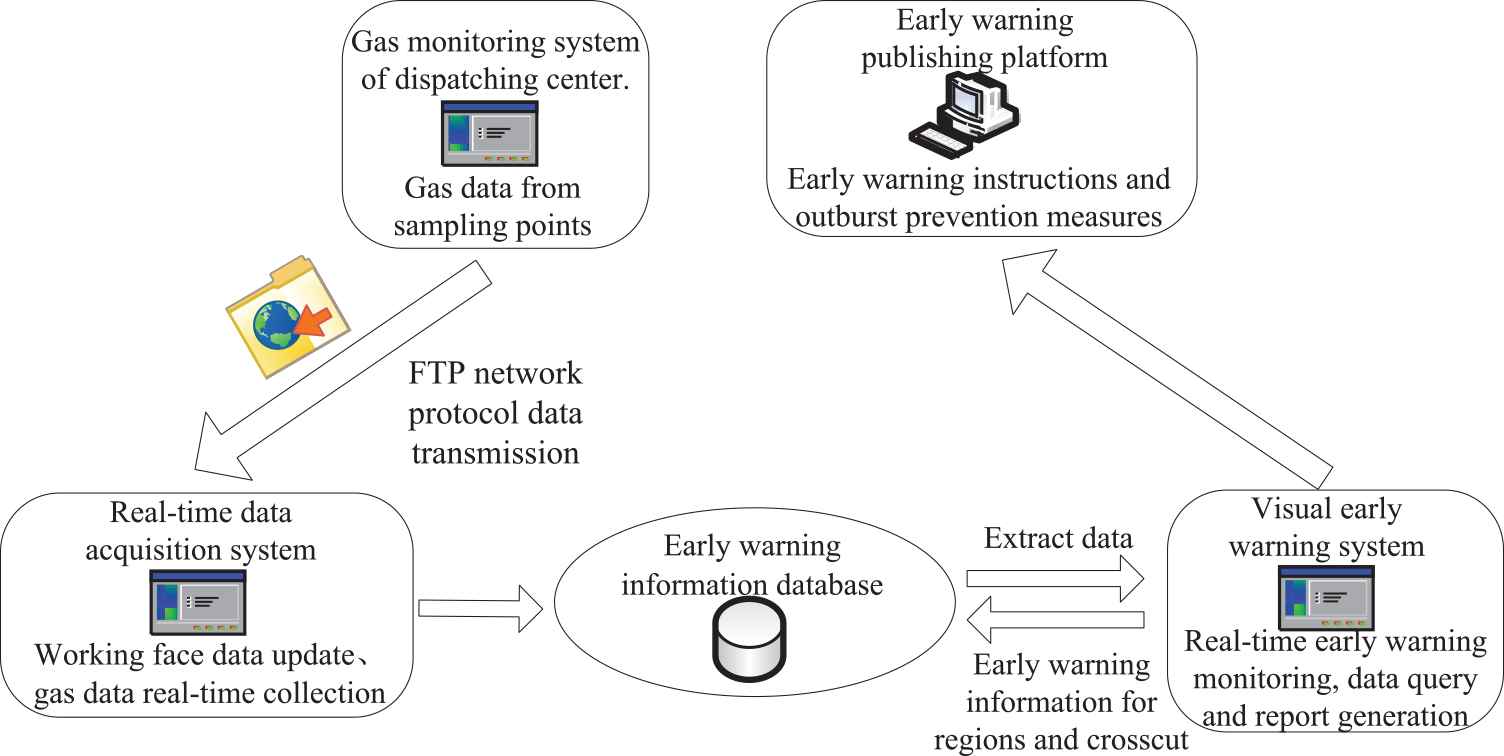
The early warning system process.
3. RESULTS AND DISCUSSION
3.1. Model Results
Based on the real-time monitoring data of gas emission from the dispatching center at three heading faces of −850 main crosscut intake roadway, 2077W haulage roadway and 2096 ventilation roadway in a certain period of time in Qianjiaying Mine, and the monitoring data of gas probes in roadways at different periods of time before the occurrence of dynamic phenomena in −850 main crosscut area, the monitoring sequence of gas emission is established. Since the updating interval of the gas data in the dispatching center is 1 min, in order to ensure the real-time performance of the early warning index value and the validity of the data, the monitoring step length is taken as
| Gas Emission Sample | Early Warning Indicator Value |
||
|---|---|---|---|
| S | F | K | |
| −850 main crosscut air-intake roadway | 0.00009 | 0.03 | 0.00018 |
| 2096 ventilation roadway | 0 | 0 | 0 |
| 2077W haulage roadway | 0.034 | 0.5 | −0.0018 |
| −850 main crosscut (7 hours before outburst) | 0.005 | 0.2 | 0.014 |
| −850 main crosscut (4 hours before outburst) | 0.0062 | 0.2 | 0.017 |
| −850 main crosscut (3 hours before outburst) | 0.013 | 0.4 | 0.027 |
| −850 main crosscut (2.5 hours before outburst) | 0.018 | 0.4 | 0.038 |
| −850 main crosscut (2 hours before outburst) | 0.037 | 0.6 | 0.036 |
| −850 main crosscut (1 hour before outburst) | 0.11 | 1.1 | 0.044 |
Warning index values of different samples.
According to the normal gas emission samples and gas emission samples prior to outburst (Table 2), the sample to be evaluated, m, and index n, were determined, where n includes variance, peak difference, and fluctuation slope. The data matrix A was determined using formula (4), and the entropy weight of each index was calculated using formulas (5–7). The variance entropy weight
The variance in the characteristic index of gas emissions on June 14, 2018, in the 2077W haulage roadway of Qianjiaying coal mine was 0.034, the peak difference was 0.5, and the fluctuation slope was −0.0018, with the peak and variance reaching the “danger” grade, while the fluctuation slope was normal. According to field verification at the mine, the 2077W haulage roadway had an anchor bolt drilling for construction between 09:00 and 10:00 during the morning shift on that day, and there was no outstanding danger. During this period, the gas data showed an increase, and the peak difference and variance indexes were abnormal. Abnormal gas data at sampling points during underground construction results in relatively large fluctuations of peak difference and variance, but relatively small fluctuation slopes. According to the entropy-weight method, the weight of each index is calculated as fluctuation slope, variance, and peak difference, from large to small. According to the weight of each index, the influence of index abnormality on the determination of the early warning grade is avoided to a certain extent, which provides a reasonable basis for judging the determination of an early warning grade.
Based on gas data from Qianjiaying coal mine during a normal period and an outburst, early warning analysis was carried out. The membership degree of each grade of coal and gas outburst in the heading face under multiple indexes was calculated using formulas (8–10), and the early warning grade was determined by formula (11), as shown in Table 3.
| Gas Emission Sample | Membership of Each Early Warning Grade |
Warning Grade | |||
|---|---|---|---|---|---|
| Normal | Remind | Attention | Danger | ||
| −850 main crosscut air-intake roadway | 0.9167 | 0.0362 | 0.0264 | 0.0207 | Normal |
| 2096 ventilation roadway | 1.0000 | 0.0000 | 0.0000 | 0.0000 | Normal |
| 2077W haulage roadway | 0.3944 | 0.1555 | 0.1848 | 0.2652 | Normal |
| −850 main crosscut (7 hours before outburst) | 0.1921 | 0.4994 | 0.1887 | 0.1198 | Remind |
| −850 main crosscut (4 hours before outburst) | 0.1402 | 0.5787 | 0.1763 | 0.1048 | Remind |
| −850 main crosscut (3 hours before outburst) | 0.0246 | 0.1218 | 0.2013 | 0.6523 | Danger |
| −850 main crosscut (2.5 hours before outburst) | 0.0535 | 0.0994 | 0.1469 | 0.7001 | Danger |
| −850 main crosscut (2 hours before outburst) | 0.1312 | 0.2121 | 0.2707 | 0.3860 | Danger |
| −850 main crosscut (1 hour before outburst) | 0.1811 | 0.2363 | 0.2676 | 0.3151 | Danger |
Warning grades for different samples.
Real-time early warning analysis was carried out based on data from the −850 main crosscut air-inlet roadway, the 2096 ventilation roadway, and the 2077W haulage roadway, based on an entropy-weight Bayesian early warning model. The results showed that the early warning grade was “normal” and this was verified to be consistent with the field situation. At the same time, the gas outburst data of the main crosscut at the −850 level were simulated, and the results showed that the warning grade increased from “remind” to “danger” between 7 to 3 h prior to the outburst, and the “danger” warning grade was obtained several times between 3 to 1 h prior to outburst. The simulated warning result was consistent with the accident, and the outburst warning grade could be determined over a long time period.
3.2. System Application
Much research has been conducted into early warning techniques for coal and gas outburst, based on outburst mechanisms, with noncontact, continuous outburst prediction showing great promise for outburst early warning and prevention. Relevant data analysis can be carried out using mine gas data monitoring systems, and early warning can be achieved by studying early warning characteristic values, with good results.
It is difficult to reflect instantaneous disturbances, area characteristics, and dynamic evolution processes of coal and gas outburst risks using conventional gas content detection methods via sampling. Therefore, it is necessary to use existing mine safety monitoring systems to collect gas emission data in real time, combine key outburst factors with gas emission characteristic values, and build an early warning system based on an entropy-weight Bayesian outburst early warning model.
The coal and gas outburst early warning system was commissioning and operation in Qianjiaying Mine. During this period, the system detected abnormalities in the early warning indicators of the 2172 return air roadway and issued an early warning signal. During the morning shift on November 13, 2019, the 2172 return air roadway worked normally. The early warning system issued an early warning signal at 11:30, and the early warning grade was reminder (green), as shown in Figure 6. Immediately notify the underground staff to conduct on-site inspections and confirm that the coal seam is seen at the end of the heading face during this period. According to the statistical results of previous accident cases, the probability of coal and gas outbursts is the highest in the process of uncovering coal at the working face [4]. Therefore, emergency prevention measures were taken immediately, and the relevant workers were evacuated. At 18:15 on November 13, a micro gas outburst accident occurred in the 2172 return air roadway, causing no personal injury or equipment loss.
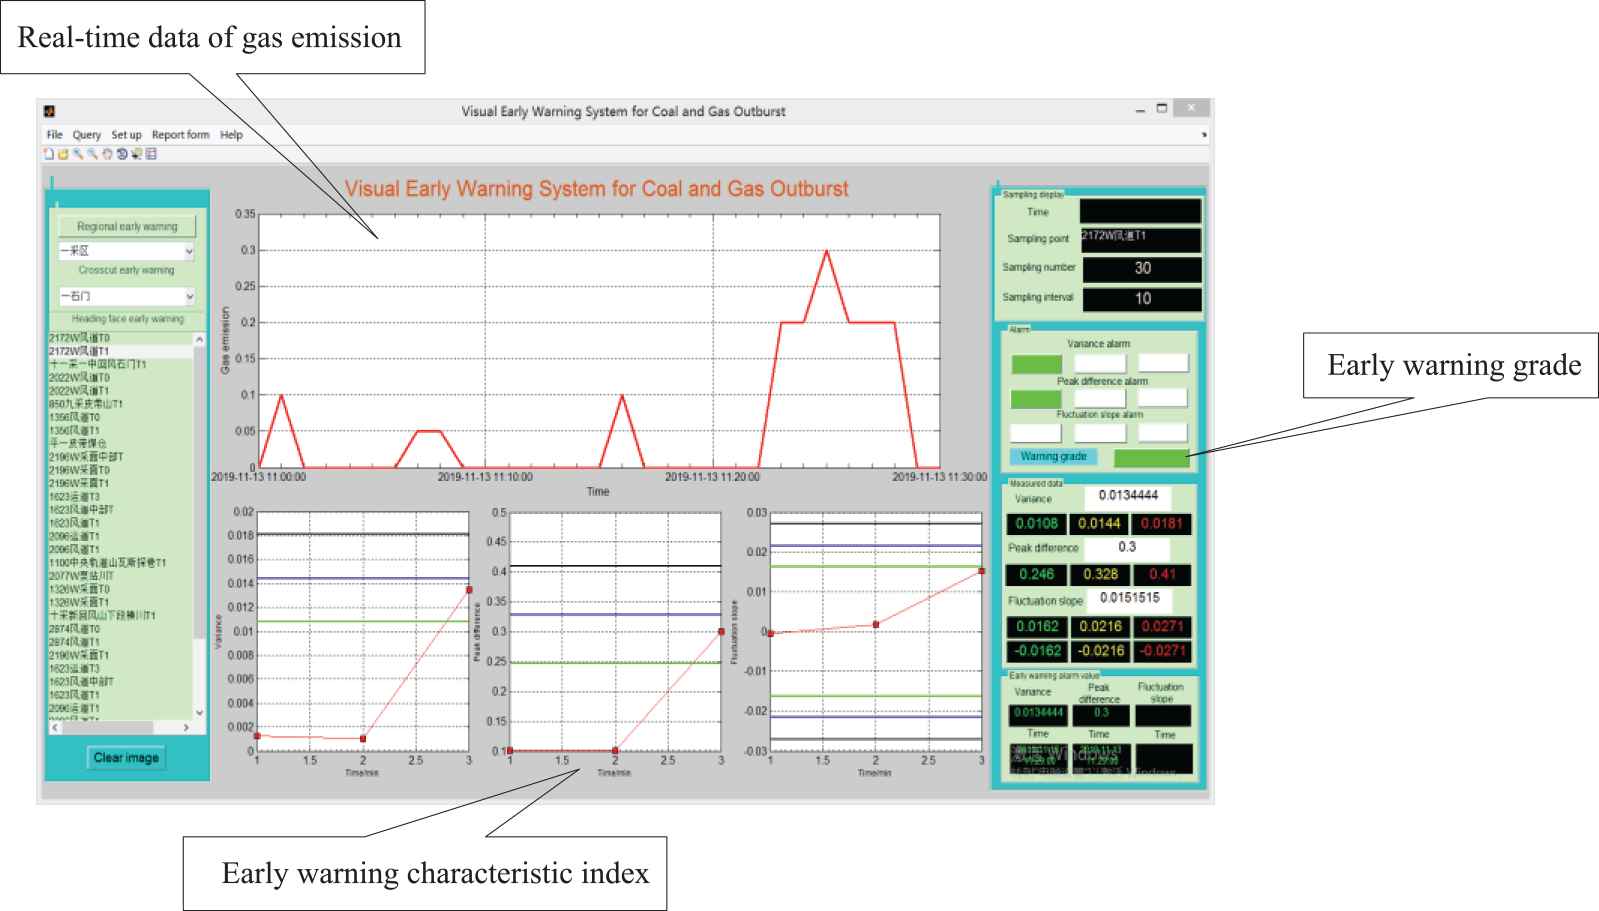
System application visual interface.
The system issued an early warning signal 6 hours before the accident, which not only ensured the safety of on-site staff, but also reduced unnecessary losses. At the same time, after the system sends out an early warning signal, it should immediately notify the downhole to conduct on-site verification to check whether there are abnormal indicators caused by human factors such as underground construction to avoid early warning errors.
4. CONCLUSIONS
Coal and gas outburst is a natural phenomenon that can occur in coal mining and production. Effective prevention of outburst accidents can ensure the personal safety of workers and improve the production efficiency of a mine. Taking Qianjiaying coal mine as the research object, this paper constructed a coal and gas outburst early warning system based on multi-index synergy, and achieved a good early warning effect.
Based on the key factors linked to gas outburst, and early warning indicators, an area–local outburst early warning system in the Qianjiaying coal mine area was established. The area early warning indexes were determined to be geological structure complexity and gas pressure. Early warning indicators at heading faces were variance, peak difference, and fluctuation slope of gas emission.
A comprehensive analysis of the gas dynamic phenomenon in the −850 level main crosscut area of Qianjiaying coal mine, as well as the characteristic values of gas emission in normal and abnormal periods, was carried out. The variance in “danger” critical values was 0.0181, the peak difference “danger” critical value was 0.41, and the fluctuation slope “danger” critical values were 0.0271, −0.0271. The “remind” and “attention” critical values were about 60% and 80% of the “danger” critical values, respectively.
An entropy-weight Bayesian coal and gas outburst early warning model was established to carry out coordinated, multi-index early warning for a heading face. Early warning results were classified into three grades: “remind” (green), “attention” (orange), and “danger” (red). Through field verification in Qianjiaying coal mine, the early warning results were found to be consistent with an actual situation.
Based on VB and MATLAB data analysis, a coal and gas outburst early warning system for Qianjiaying coal mine was compiled, including a real-time gas data acquisition system and a visual early warning system. The gas data real-time acquisition system can read gas monitoring data from a mine in real time, while the visual early warning system can monitor gas data for real-time early warning. Through the application in Qiangjiaying mine, a gas outburst was detected by the warning system, and an early warning was issued 6 hours before the accident.
Further research will improve the data acquisition of the gas outburst warning system. On the basis of real-time monitoring of gas emission, the abnormal value of gas emission is collected, the characteristic values of early warning indicators are evaluated in real time, and the critical values of indicators are updated and corrected to ensure the real-time accuracy of the early warning results. At the same time, after the system sends out the outburst warning signal, how to take effective emergency prevention measures to avoid coal and gas outburst accidents and to achieve the combination of early warning and outburst prevention is also the focus of future work.
CONFLICT OF INTEREST
The authors declare that there are no conflicts of interest.
AUTHORS' CONTRIBUTIONS
All authors of this research paper have directly participated in the planning, execution, analysis of this study and approved the final version.
ACKNOWLEDGMENTS
This research work was supported by the National Key Research and Development Plan of China (2018YFC0808100), the National Natural Science Foundation Fund of China (51874012). We would like to thank Qianjiaying Coal mine and Dashucun Coal mine for providing data and on-site research opportunities.
REFERENCES
Cite this article
TY  - JOUR
AU  - Jiayong Zhang
AU  - Zibo Ai
AU  - Liwen Guo
AU  - Xiao Cui
PY  - 2020
DA  - 2020/12/18
TI  - Research of Synergy Warning System for Gas Outburst Based on Entropy-Weight Bayesian
JO  - International Journal of Computational Intelligence Systems
SP  - 376
EP  - 385
VL  - 14
IS  - 1
SN  - 1875-6883
UR  - https://doi.org/10.2991/ijcis.d.201214.001
DO  - 10.2991/ijcis.d.201214.001
ID  - Zhang2020
ER  -