
An Intuitionistic Fuzzy Time Series Model Based on New Data Transformation Method
 , Mu-Yen Chen2, Jing-Rong Chang3, *, , Pei-Yu Yu4
- DOI
- 10.2991/ijcis.d.210106.002How to use a DOI?
- Keywords
- Intuitionistic fuzzy sets (IFS); Intuitionistic fuzzy time series (IFTS); Nth quantile discretization approach (NQDA); Forecasting
- Abstract
Traditional time series methods can predict seasonal problems, but not problems with transferred linguistic data. Thus, a forecasting method for such problems is required. However, existing intuitionistic fuzzy time series forecasting methods lack persuasiveness in determining the degree of hesitation and the lengths of intervals. Hence, this research is mainly to explore how to decide the degree of hesitation for each interval for intuitionistic fuzzy time series. This paper proposes the weighted intuitionistic fuzzy time series model based on the Nth quantile discretization approach (NQDA). The proposed model can decide the appropriate number, interval length, degree of hesitation, and membership and nonmembership functions of linguistic values on the basis of the training data. In the experimental section, the forecasts of several data sets are made for model validation. Results indicate that the proposed model can be used to obtain forecasts for other time-related data sets.
- Copyright
- © 2021 The Authors. Published by Atlantis Press B.V.
- Open Access
- This is an open access article distributed under the CC BY-NC 4.0 license (http://creativecommons.org/licenses/by-nc/4.0/).
1. INTRODUCTION
Trend forecasting plays an important role in many fields, such as decision-making, health, economics, and commerce [1]. Therefore, numerous fuzzy time series (FTS) models have been proposed to deal with forecasting problems [2–5]. In these studies, granular computing plays an important role in data fuzzification process [6,7]. Previously proposed methods usually lack persuasiveness in determining the universe of discourse and the lengths of intervals [2,4,8]. Moreover, these methods do not consider the strength of the fuzzy relation when making forecasts [9].
Huarng [10] pointed out that the length of the interval affects the prediction performance. Chen [11] proposed the high-order FTS model, focusing on three main issues: (1) fuzzification, (2) fuzzy logic relations, and (3) defuzzification. In the study proposed by Mahua and Kalyani [12], the forecasting accuracy depends on two key points: (1) effective division of data and (2) establishment of fuzzy logic relationships and use in forecast [13]. On the basis of the above research, the width and number of intervals and the method of fuzzification influence the prediction performance.
Most previous experiments of fuzzy sets used a single value to express human opinions. However, ambiguous blurring is hard to express in a single value. In 1986, Atanassov [14] extended the fuzzy theory and proved that the intuitionistic fuzzy set (IFS) theory can improve the defect of a single value. The IFS is an extension of the fuzzy set, which has a certain effect on handling uncertain problems. Castillo et al. [15] incorporated the IFS theory into time series analysis. Its main purpose is to improve the prediction accuracy of the model. Their experimental results confirmed that the intuitionistic fuzzy time series (IFTS) is another way to make forecasts.
After the work by Castillo et al. [15], an increasing number of studies in recent years have extended FTS to IFTS [16–20]. However, most of these studies focused on improving prediction results and did not consider uncertainty or hesitation when facing forecasting problems. For example, Egrioglu et al. [19] integrated particle swarm optimization into the process of IFTS to improve the weights of rules. In 2018, Danish Lohani et al. [18] adopted the intuitionistic fuzzy C-means to obtain reasonable IFS. Luo et al. [20] proposed the integration with IFS and neural networks to enhance prediction performance. Most of these studies also prove that IFTS has better prediction results than traditional FTS.
Most IFTS models only consider the influence of the degree of attribution on the predicted value and ignore the degree of non-attribution and the degree of hesitation. In addition, most studies used subjective opinions to calculate the degree of hesitation, and some of them set the degree of hesitation to “0.” Moreover, even though several approaches did not set the degree of hesitation to “0,” they set a default value and a consistent degree of hesitation of each interval. It will let the degree of hesitation having no effect when establishing the intuitionistic fuzzy rules.
To solve the aforementioned limitations for previous models, this study proposes an IFTS model based on the Nth quantile discretization approach (NQDA) [8]. The functions of the proposed model are as follows: (1) it can obtain IFS in accordance with the extension from fuzzy sets. The degrees of memberships and nonmembership of IFS are considered in calculating the average membership values and minimum degrees of training data. (2) The degrees of memberships and nonmembership of IFS are also integrated when obtaining intuitionistic fuzzy rules and then obtain reasonable and precise forecasting results. (3) In the determination of interval length, the logarithm value of the number of data is calculated for obtaining the number of intervals. The coverage of granular computing is reasonable, and the numbers of data of the linguistic values are similar. (4) The transformation equation from fuzzy sets to IFSs is developed for the forecasting of time series data. NQDA calculates the cut point by the observation value of each interval and thus is more objective than the conventional method.
In the experimental section, the yearly data on enrollments at the University of Alabama comprise the first dataset. The seasonal data of Taiwan's total electricity consumption for the past 22 years are used and compared with the previously proposed FTS to verify the advantages and disadvantages of the improved model. The 2000–2004 data of Taiwan Stock Exchange Capitalization Weighted Stock Index (TAIEX) are used to evaluate the performance of the proposed IFTS model. The expenditure in information technology maintenance by an optoelectronics company in Taiwan is also adopted for verification.
The remainder of this paper is organized as follows: The related literature is briefly reviewed in Section 2. The IFTS model and its step-by-step procedure are presented in Section 3 and the experiments are described in Section 4. The conclusions, implications, and limitations of this research are presented in Section 5.
2. RELATED LITERATURE
In this section, the literature related to IFTS and NQDA is briefly reviewed.
2.1. IFS and IFTS
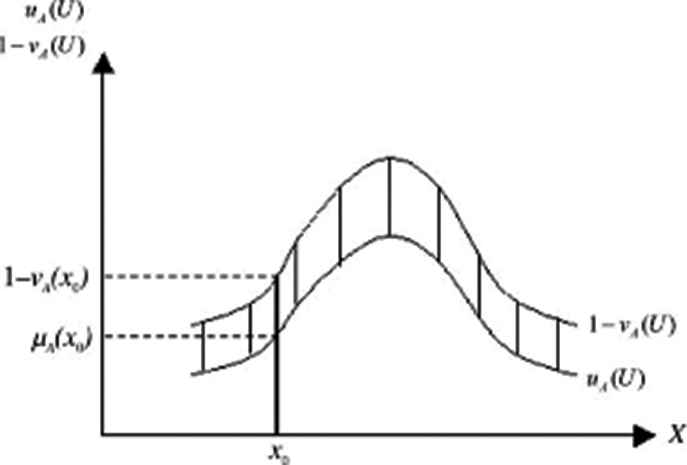
Zadeh [21] proposed fuzzy sets to describe situations in which the data are imprecise or vague. Fuzzy set theory is a useful tool to handle such situations by attributing a degree to which a certain object belongs to a set. In real life, a person may assume that an object belongs to a set to a certain degree, but he may be unsure about it. In other words, the membership degree of in A may have hesitation or uncertainty. Fuzzy set theory does not consider hesitation in the membership degrees [22]. A possible solution is to use IFSs, defined by Atanassov in 1983 [23]. IFSs use a degree of truth membership function
Intuitionistic fuzzy sets of real number R [24].
Definition 2.1.
Assume A is the subset of universal of discourse. Then, an IFS A is defined as
Definition 2.2.
Let x and y are two intuitionistic fuzzy sets over U and V, respectively. Then, the intuitionistic fuzzy relation between x and y is defined as
Song and Chissom [25,26] proposed a FTS model that uses linguistic values for forecasting data. They executed experiments on the enrollment data of the University of Alabama to determine the differences between traditional time series and FTS models. Chen [27] proposed a simplified arithmetic operations model with max–min composition operations to improve the approach of Song and Chissom [28]. In both aforementioned studies, the enrollment data of the University of Alabama were used to make forecasts.
Based on the concepts of FTS, Castillo et al. [15] proposed the IFTS model to improve the prediction accuracy and experimental results of the study. Tian and Wang [29] also proposed their definition of IFTS and improved the FTS prediction model, which included a weighting function to make the model applicable for the IFS. In the following, some basic concepts of IFTS are briefly reviewed.
Definition 2.3.
Assume that
Definition 2.4.
If there is a intuitionistic fuzzy relationship
When
Many studies about IFTS have been focused on dealing with the time series problems. Xu [30] defined the score and accuracy functions of interval-valued intuitionistic fuzzy number. A method for ranking interval-valued intuitionistic fuzzy numbers is presented based on these two functions, and then the method is applied for forecasting temperature. Kumar and Gangwar [31] proposed a novel IFTS model to forecast the enrollment of Alabama University. They also adopted the model to make forecasts about the stock index of SBI. Abhishekh and Kumar [16] proposed a new high-order IFTS model by transforming FTS data into intuitionistic FTS data by defining their appropriate membership and nonmembership grades. The fuzzification of time series data is intuitionistic fuzzification, which is based on the maximum score degree of intuitionistic fuzzy numbers. This method has been implemented on the prediction for historical data of rice production.
2.2. Nth Quantile Discretization Approach: NQDA [8]
In recent years, several FTS models that integrate new fuzzified methods have been proposed to improve forecasting accuracy levels. In this study, we adopt a relative objective method, namely NQDA. The detailed description of this method is provided in the following text:
Constructing the length of interval using the NQDA
- Step 1.
Define the universe of discourse U. Let
- Step 2.
Assume we want to partition the universe of discourse into m linguistic values. Then, we need to calculate
where m denotes the total number of linguistic values. The cut point is computed bywhere
- Step 1.
3. PROPOSED IFTS MODEL
Most FTS models have two major limitations [2,4]: (1) they lack persuasiveness in determining the universe of discourse and the lengths of intervals and (2) they do not appropriately consider the weights of fuzzy relations. Above limitations are also existed in the IFTS models. The degrees of nonmembership and uncertainty are not considered when making forecasts. Nevertheless, some IFTS approaches can be used to make forecasts according to the degrees of membership, nonmembership, and uncertainty. However, they set the same degrees of uncertainty for each set. In addition, the degrees of uncertainty are zero values or decide it subjectively.
To overcome these limitations, a weighted intuitionistic fuzzy relations time series model using the NQDA method is proposed to improve membership and non-membership functions. However, most of previous FTS and IFTS models did not suggest a feasible number of linguistic values. The logarithm value of the number of data is calculated to determine the number of linguistic values on the basis of the number of training data. The concept of weighted intuitionistic fuzzy relations is also integrated into the proposed procedure to improve forecasting accuracy levels. The weight of each intuitionistic fuzzy relation is calculated according to the sum of cardinalities in the training data set.
The steps of this paper can be divided into four steps: (1) obtain the number and intervals of linguistic values, (2) intuitional fuzzify the historical data, (3) develop the weighting intuitionistic fuzzy rules, and (4) defuzzification and making the forecasts. The output of the first step is mainly executed by NQDA. In the second step, a transformation equation is proposed in this research to obtain membership and nonmembership functions. The nonmembership value of each data points is the inverse of its membership value; thus, the maximal degree of membership function is calculated by the averaged membership values of data with positive membership values in the interval of each linguistic value.
- Step 1.
To obtain the number and intervals of linguistic values.
- Step 1.1.
Define the universe of discourse U. Let
- Step 1.2.
Determine the number of linguistic values by Equation (7). The Lagrange function is adopted to make the number of linguistic values reasonable and at least one data fuzzified in each interval. If the base of this Lagrange function is larger, the length of interval will be larger and the number of linguistic values will be less. After some pretest experiments, we found that the number of linguistic values and the root mean square errors (RMSEs) for several data sets are converged and stable when the bases approximate
where l is the number of interval and n is the number of training data. - Step 1.3.
Assume we want to partition the universe of discourse into m linguistic values. Then, we need to calculate
Before calculating the degree of nonmembership, the average degree of membership and the highest degree of membership for each interval must first be calculated. The operation steps are as follows:
- Step 1.1.
- Step 2.
To develop the weighting intuitionistic fuzzy rules
- Step 2.1.
Calculate the average degree of membership for linguistic value i (i.e.,
where a, b, and c are left, highest, and right of IFS, and - Step 2.2.
Calculate the height of membership function for IFS. The average degrees of membership values for each linguistic value are calculated.
- Step 2.3.
Calculate the degree of uncertainty of IFS. To determine the uncertainty of each IFS, we determine the uncertainty (i.e.,
where i denotes the ith linguistic value and min(mem(i)) is the minimum nonzero membership value for training data in linguistic value i.According to the outputs of Steps 2.1 to 2.3, each training data can be intuitionistic fuzzified, and its degree of membership and nonmembership of each linguistic value can be expressed as (11) and (12). Hence, the intuitionistic fuzzy relationship can be obtained, and then the weighted intuitionistic fuzzy rules are established. The steps are as follows:
where
- Step 2.1.
- Step 3.
To develop the weighting intuitionistic fuzzy rules
- Step 3.1.
Establishing an intuitionistic fuzzy relationship. The output values of each training data for Equations (11) and (12) are calculated. The intuitionistic fuzzy relationship will be obtained according to Definition 2.4.
- Step 3.2.
Calculating intuitionistic cardinality weights for membership and nonmembership relations. The outputs can be shown as Equations (13) and (14) by calculating the sum of cardinalities for each intuitionistic fuzzy relationship.
where - Step 3.3.
Establishing weighted intuitionistic fuzzy rule matrix. After the integration for all the intuitionistic fuzzy relation matrix is finished, the weighted intuitionistic fuzzy rule matrix is made.
- Step 3.1.
- Step 4.
To intuitionistically defuzzification and make the forecasts. This step calculates the intuitionistic defuzzified values of linguistic values using Equation (15). Then, the forecasting value of
where
4. COMPARISON AND VERIFICATION
Experiments were performed on four data sets in this study by using the proposed models. The results and comparisons are provided in Sections 4.1, 4.2, 4.3, and 4.4.
4.1. Data Set One: Enrollments at the University of Alabama
The numerical data is the yearly data on enrollments at the University of Alabama, which has been adopted in many FTS models [2,4,25,28]. The original data are listed in Table 1.
| Year | Enrollments | Year | Enrollments |
|---|---|---|---|
| 1971 | 13055 | 1982 | 15433 |
| 1972 | 13563 | 1983 | 15497 |
| 1973 | 13867 | 1984 | 15145 |
| 1974 | 14696 | 1985 | 15163 |
| 1975 | 15460 | 1986 | 15984 |
| 1976 | 15311 | 1987 | 16859 |
| 1977 | 15603 | 1988 | 18150 |
| 1978 | 15861 | 1989 | 18970 |
| 1979 | 16807 | 1990 | 19328 |
| 1980 | 16919 | 1991 | 19337 |
| 1981 | 16388 | 1992 | 18876 |
Eight IFSs were obtained after data transformation, and their heights of linguistic values are listed in Table 2 and shown in Figure 2. Then, following Step 2.3, the training data are subjected to intuitionistic fuzzification and listed in Table 3. The intuitionistic fuzzy relations can be obtained according to Table 3 and some of them are listed in Table 4.
| Interval | Height (Li) |
|---|---|
| 0.48 | |
| 0.44 | |
| 0.73 | |
| 0.38 | |
| 0.27 | |
| 0.82 | |
| 0.12 | |
| 1.00 |
The height for each intuitionistic fuzzy set (IFS).
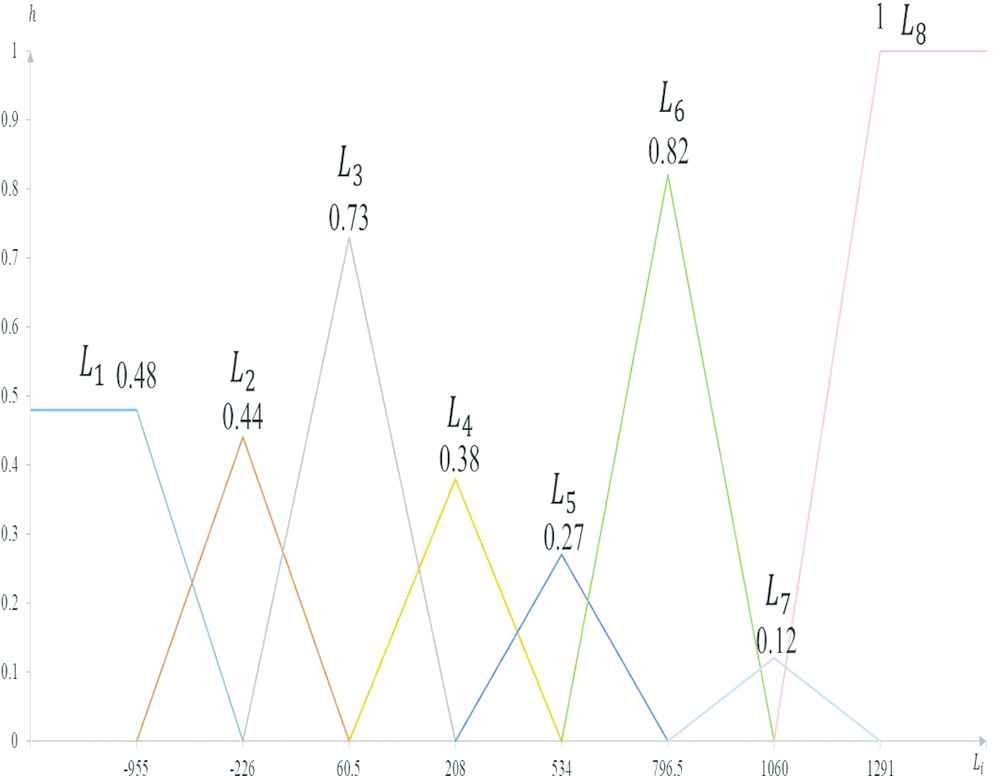
The graph of height for each intuitionistic fuzzy set (IFS).
| Date | Momentum | Linguistic Value |
|---|---|---|
| 1971 | * | * |
| 1972 | 508 | |
| 1973 | 304 | |
| 1974 | 829 | |
| 1975 | 764 | |
| 1976 | −149 | |
| 1977 | 292 | |
| 1978 | 258 | |
| 1979 | 946 | |
| 1980 | 112 | |
| 1981 | −531 | |
| 1982 | −955 | |
| 1983 | 64 | |
| 1984 | −352 | |
| 1985 | 18 | |
| 1986 | 821 | |
| 1987 | 875 | |
| 1988 | 1291 | |
| 1989 | 820 | |
| 1990 | 358 | |
| 1991 | 9 | |
| 1992 | −461 |
*: doesn't exist
The outputs of intuitionistic fuzzification for training data.
| Momentum(t) | Relation No. | One Period Intuitionistic Fuzzy Relation |
|
|---|---|---|---|
| 1 | |||
| 2 | |||
| 3 | |||
| 4 | |||
| 5 | |||
| 6 | |||
| 7 | |||
| 8 | |||
| 9 | |||
| 10 | |||
| 11 | |||
| 12 | |||
| 77 | |||
| 78 | |||
| 79 | |||
| 80 |
The one period intuitionistic fuzzy relation by proposed model.
Then, the membership and nonmembership value can be calculated by Equations (8–10). The intuitionistic fuzzy relations can be obtained according to Table 3 and Definition 2.4, and some of them are listed in Table 4. In Table 4, the number of intuitionistic fuzzy relations for each nearby years is four
The intuitionistic cardinality weights for membership and nonmembership relations in Table 4 can be calculated using Step 3.2. The outputs of Step 3.2 are shown in Equations (18) and (19), which are the intuitionistic fuzzy rules for forecasting.
Then, the forecasted results of proposed model for data set one are calculated, which are provided to make comparisons with Tian and Wang's model [29]. In Tian and Wang's approach, a method of transferring FS to IFS is proposed, and then several previous FTS models are transferred to IFTS models (e.g., Chen [27], Cheng et al. [4], and Chang and Huang [32]). Besides, the results of one recent FTS [33] and one IFTS [17] approaches are also adopted for comparison in Table 5. The direction accuracy (DA) and RMSE obtained with these models of and the forecasts obtained with the proposed model are listed in Table 5. The proposed models with
| Methods | Discretization Method | RMSE | DA (%) | |
|---|---|---|---|---|
| Tian and Wang [29] | Song and Chissom [25] | IFTS | 638.91 | 76.19 |
| Weighted IFTS | 521.95 | 80.95 | ||
| Chen [27] | IFTS | 634.75 | 71.43 | |
| Weighted IFTS | 516.94 | 76.19 | ||
| Lee et al. [34] | IFTS | 621.78 | 71.43 | |
| Weighted IFTS | 505.45 | 76.19 | ||
| Jiang et al. [33] | Harmony search intelligence algorithm | 395.88 | 77.78 | |
| Abhishekh et al. [17] | Maximum degree of score function | 382.03 | 66.67 | |
| Proposed model | NQDA (7 intervals) [8] | 346.60 | 95.24 | |
| 348.56 | 95.24 | |||
DA, direction accuracy; RMSE, root mean square error; IFTS, intuitionistic fuzzy time series; NQDA, Nth quantile discretization approach.
Comparisons of forecasting performance (enrollments at the University of Alabama).
4.2. Data Set Two: Seasonal Total Electricity Consumption in Taiwan
The second experimental data in this study are the seasonal total electricity consumption in Taiwan from 1996 to 2017, which are introduced by Chang et al. [35]. The NQDA is firstly adapted to performed fuzzification (i.e., Step 1). Then, the degrees of membership and nonmembership are calculated according to Step 3.
The NQDA-based FTS model is included for comparisons to verify the model proposed in this study. The original data and their momentums are presented in Table 6.
| Year(Season) | Total Electricity Consumption | Momentum |
|---|---|---|
| 1996 (one) | 28909.04 | * |
| 1996 (two) | 32,354.14 | 3,445.10 |
| 1996 (three) | 37,954.53 | 5,600.39 |
| 1996 (four) | 35,089.06 | −2,865.46 |
| 1997 (one) | 30,993.07 | −4,096.00 |
| 2017 (one) | 58,118.15 | −7,249.80 |
| 2017 (two) | 63,514.35 | 5,396.20 |
| 2017 (three) | 72,377.75 | 8,863.40 |
| 2017 (four) | 67,382.55 | −4,995.20 |
*: doesn't exist
The seasonal total electricity consumption in Taiwan [35].
The experimental results are shown in Table 7. The RMSE and prediction of the correct direction rate (DA) with 5, 7, and 9 linguistic values are calculated and compared with those obtained by Chang et al. [35]. This study has lower RMSE and higher DA than the FTS model under the same number of linguistic values. The results in Table 7 show that proposed IFTS model is mostly superior to the FTS model under the same number of intervals (fuzzify by NQDA).
| Methods | No. of Linguistic Values | RMSE | DA (%) |
|---|---|---|---|
| Chang et al. [35] | 5 | 8382.72 | 33 |
| 7 | 8614.59 | 61 | |
| 9 | 8334.11 | 41 | |
| Proposed IFTS model | 5 | 5956.24 | 78 |
| 7 | 6168.62 | 63 | |
| 9 | 6306.73 | 49 |
DA, direction accuracy; RMSE, root mean square error; IFTS, intuitionistic fuzzy time series.
Comparison of Taiwan's total electricity consumption performance.
4.3. Data Set Three: TAIEX
The third data set is the daily closing price of TAIEX from 2000 to 2004. Considering that some previous FTS methods have been applied to make forecasts for data set three, this paper also make forecasts for comparing the performance via RMSE and DA. The main objectives of this experiment include the testing of forecasting performance and the feasibility of the number of linguistic values calculated using Step 1.2 and Equation (7). Thus, the closing price of TAIEX will be intuitionistically fuzzified to 16 linguistic values. Finally, the forecasting results of RMSE from 2000 to 2004 obtained by the proposed model and some previous FTA models are listed in Table 8. In Table 8, the best RMSE can be obtained under 16 IFSs when forecasting the data of different years. The proposed model has better forecasting performance in 2001 and 2003, and its average RMSE is lower than those of the other models, while the DA is an important judgemnt for the stock trading strategy.
| Methods | Parameter | Years |
|||||
|---|---|---|---|---|---|---|---|
| 2000 | 2001 | 2002 | 2003 | 2004 | Avg. | ||
| Chang and Liu [8] | 1-order | 129.70 | 120.62 | 70.84 | 60.39 | 56.71 | 87.65 |
| 2-order | 123.19 | 119.05 | 67.94 | 57.43 | 56.25 | 84.77 | |
| 3-order | 120.03 | 124.73 | 63.83 | 51.97 | 54.19 | 82.95 | |
| Cai et al. [36] | 131.53 | 112.59 | 60.33 | 51.54 | 50.33 | 81.26 | |
| Ye et al. [37] | 125.42 | 113.22 | 63.99 | 52.99 | 52.40 | 81.60 | |
| Su and Cheng [38] | 132.19 | 113.23 | 65.83 | 57.62 | 54.33 | 84.64 | |
| Proposed model | 16 interval ans |
127.96 | 106.57 | 64.29 | 49.05 | 54.52 | 80.48 |
RMSE, root mean square error; TAIEX, Taiwan Stock Exchange Capitalization Weighted Stock Index.
The RMSE of TAIEX from 2000 to 2004 by different models.
4.4. Data Set Four: IT Project Expenditure Data
The data set four was illustrated by Cheng et al. [4], which is expenditure in information technology maintenance by an optoelectronics company involved in the production and marketing of fiber optic communication devices. The monthly data of project expenditures on information technology maintenance are presented in Table 10. The number of intervals is 11, which is calculating by Equation (7). After executing proposed forecasting process, the RMSE and DA by different models are listed in Table 11
5. CONCLUSION
Relative objective fuzzification was adopted to improve persuasiveness in determining the lengths of intervals and MFs and non-MFs. The step-by-step procedures of the proposed weighted ITFS model are provided in Section 3. The main differences between previous models and the proposed model is that the proposed model integrates the concepts of average fuzzified values to determine the membership and nonmembership and calculates the number of linguistic values on the basis of the number of training data. The main characteristic is that the transformation equation from fuzzy sets to IFSs is developed based on the training data for the forecasting of time series data. NQDA calculates the cut point by the observation value of each interval and thus is more objective than the conventional method. The forecasting results of three data sets indicate that the proposed model provides accuracy levels superior to those of other methods.
In the experimental section, the Tables 3 and 4 illustrates the outputs of dataset one according to Steps 2.1–2.3. Then, the forecasting performances of four datasets are listed in Tables 5, 7–9, and 11. In Tables 5, 7, and 11, the RMSE and DA are both better than comparison models. It may reveals that the proposed model has outstanding forecasting ability in the small sample prediction. Besides, from Tables 8 and 9, the proposed model has lower average RMSE, and the DA is mostly higher than previous models for TAIEX forecasting. The forecasting results of dataset three indicate that the proposed models provide accuracy levels superior to those of other methods. Besides, we suppose that the higher DA can help people have better profit for stock trading.
| Methods | Parameter | Years |
|||||
|---|---|---|---|---|---|---|---|
| 2000 (%) | 2001 (%) | 2002 (%) | 2003 (%) | 2004 (%) | Avg. | ||
| Ismail and Efendi [39] | 45.65 | 50.00 | 50.00 | 38.10 | 52.27 | 47.20 | |
| Joshi and Kumar [40] | 45.65 | 54.76 | 50.00 | 40.48 | 36.36 | 45.45 | |
| Chang and Liu [8] | 1-order | 68.89 | 43.90 | 51.22 | 46.34 | 51.16 | 52.30 |
| 2-order | 70.45 | 42.50 | 55.00 | 47.50 | 47.62 | 52.61 | |
| 3-order | 72.10 | 43.59 | 53.85 | 46.15 | 51.22 | 53.38 | |
| Proposed model | 16 intervals and |
63.83 | 65.12 | 69.77 | 58.14 | 60.00 | 63.37 |
TAIEX, Taiwan Stock Exchange Capitalization Weighted Stock Index; DA, direction accuracy.
The DA of TAIEX from 2000 to 2004 by different models.
| Month | Expenditure | Month | Expenditure |
|---|---|---|---|
| 2000/6 | 184000 | 2001/9 | 230000 |
| 2000/7 | 195000 | 2001/10 | 227000 |
| 2000/8 | 191000 | 2001/11 | 225000 |
| 2000/9 | 210000 | 2001/12 | 223000 |
| 2000/10 | 209000 | 2002/1 | 218000 |
| 2000/11 | 210000 | 2002/2 | 205000 |
| 2000/12 | 223000 | 2002/3 | 215000 |
| 2001/1 | 238000 | 2002/4 | 196000 |
| 2001/2 | 229000 | 2002/5 | 188000 |
| 2001/3 | 250000 | 2002/6 | 176000 |
| 2001/4 | 248000 | 2002/7 | 189000 |
| 2001/5 | 235000 | 2002/8 | 193000 |
| 2001/6 | 248000 | 2002/9 | 172000 |
| 2001/7 | 244000 | 2002/10 | 179000 |
| 2001/8 | 237000 |
Monthly data of project expenditures [4].
| Methods | Discretization method | RMSE | DA (%) |
|---|---|---|---|
| Cheng et al. [4] | Trapezoid Fuzzification Approach (TFA) | 10612.06 | 71.43 |
| Minimize Entropy Principle Approach (MEPA) | 10099.35 | 71.43 | |
| Chang and Yu [9] | Weighted Cumulative Probability Distribution Approach (CPDA) | 10678.43 | 60.71 |
| Weighted Minimize Entropy Principle Approach (MEPA) | 9850.63 | 67.86 | |
| Proposed model | NQDA (11 intervals) and |
9787.56 | 77.78 |
DA, direction accuracy; RMSE, root mean square error; IFTS, intuitionistic fuzzy time series; NQDA, Nth quantile discretization approach.
Comparisons of forecasting performance (IT project expenditure).
In future studies, the proposed IFTS model can be applied to obtain forecasts for other time-related data sets, such as project expenditures, stock indexes, exchange rates, number of tourists, or number of hospital outpatients. The integration of discretization approaches with the proposed models is an interesting research topic. According to Liu et al. [41], the development of high-order IFTS model and integration with other aggregation operators is also an interesting direction. Furthermore, determining the degree of nonmembership in more reasonable ways is still an unsolved problem.
CONFLICTS OF INTEREST
Long-Sheng Chen declares that he has no conflict of interest. Mu-Yen Chen declares that he has no conflict of interest. Jing-Rong Chang declares that he has no conflict of interest. Pei-Yu Yu declares that she has no conflict of interest.
AUTHORS' CONTRIBUTIONS
L.-S. Chen contributed substantially to the conception and design of this study, supervised the research, and co-wrote the paper. M.-Y. Chen developed the theory, analyzed data and drafted this study. J.-R. Chang designed experiments, supervised the findings of this work, and provided critical revision and final approval of the version to publish. P.-Y. Yu performed the analytic calculations and performed the numerical simulations, and co-wrote the paper.
Funding Statement
This study was funded the Ministry of Science and Technology of Taiwan (R.O.C) (grant number MOST 108-2410-H-324-049-).
ETHICAL APPROVAL
This article does not contain any studies with human participants or animals performed by any of the authors.
ACKNOWLEDGEMENTS
The authors thank the partially support sponsored by the Ministry of Science and Technology of Taiwan (R.O.C) under the Grants MOST 108-2410-H-324-049-. The authors thank the comments of anonymous reviewers. The authors also thank the www.enago.tw for providing professional English editing service.
REFERENCES
Cite this article
TY  - JOUR
AU  - Long-Sheng Chen
AU  - Mu-Yen Chen
AU  - Jing-Rong Chang
AU  - Pei-Yu Yu
PY  - 2021
DA  - 2021/01/12
TI  - An Intuitionistic Fuzzy Time Series Model Based on New Data Transformation Method
JO  - International Journal of Computational Intelligence Systems
SP  - 550
EP  - 559
VL  - 14
IS  - 1
SN  - 1875-6883
UR  - https://doi.org/10.2991/ijcis.d.210106.002
DO  - 10.2991/ijcis.d.210106.002
ID  - Chen2021
ER  -