
Comparing performances and effectiveness of machine learning classifiers in detecting financial accounting fraud for Turkish SMEs
 , Ozlem Senvar*
- DOI
- 10.2991/ijcis.d.210203.007How to use a DOI?
- Keywords
- Financial accounting fraud; SMEs; Machine learning classifiers; Sampling methods; SMOTE; Feature selection
- Abstract
Turkish small- and medium-sized enterprises (SMEs) are exposed to fraud risks and creditor banks are facing big challenges to deal with financial accounting fraud. This study explores effectiveness of machine learning classifiers in detecting financial accounting fraud assessing financial statements of 341 Turkish SMEs from 2013 to 2017. The data are obtained from one of the leading creditor banks of Turkey. Highly imbalanced classes of 1384 nonfraudulent cases and 321 fraudulent cases (by 122 firms) are detected thus sampling techniques are used to mitigate class imbalance problem. Research methodology consists of two stages. First stage is data preprocessing wherein financial ratio calculation, feature selection methods for defining financial ratios with the greatest impact on fraudulent financial statements and two sampling methods of Synthetic Minority Oversampling Technique (SMOTE) as oversampling and undersampling are performed, respectively. Second stage is performance evaluation and comparison of classifiers wherein seven different classifiers (support vector machine, Naive Bayes, artificial neural network, K-nearest neighbor, random forest, logistic regression, and bagging) are executed and compared by using performance metrics. Classifiers are also compared without using any feature selection and/or sampling techniques. Results reveal that random forest-without feature selection-oversampling model outperforms all other models.
- Copyright
- © 2021 The Authors. Published by Atlantis Press B.V.
- Open Access
- This is an open access article distributed under the CC BY-NC 4.0 license (http://creativecommons.org/licenses/by-nc/4.0/).
1. INTRODUCTION
According to the Association of Certified Fraud Examiners (ACFE), which is the world's largest anti-fraud organization, companies lost 5% of their annual revenues through fraud in 2020. ACFE also stated that the total loss at 2,504 cases was $ 3.6 billion, with an average loss per case of $1.51 million [1]. Beyond these losses, financial accounting fraud leads to comprehensive negative consequences on investors, employees, suppliers, and other stakeholders of the enterprise [2]. It disturbs trust between trade-related institutions and market participants [3]. Ngai et al. [4] emphasized the importance of financial fraud detection for the prevention of these destructive consequences.
Previous studies have focused mainly on publicly listed companies or large capitalization companies [5,6,7,8,9,10,11]. In comparison to these studies, there have been fewer researchers which have focused on fraud risks for small- and medium-sized enterprises (SMEs) [12,13,14]. This study extends the existing literature by examining Turkish SMEs' financial statements. Further, to the best of our knowledge, this paper is the first work considering creditor banking to deal with financial accounting fraud detection for Turkish SMEs. SMEs play pivotal roles in the economy. SMEs may commit frauds to induce banks and financial institutions to provide credit facilities beyond the actual borrowing capacities [15].
Detecting fraudulent financial statements requires sophisticated analytical tools and techniques rather than traditional methods for decision makers like auditors. However, there is no common approach used for detecting financial accounting fraud in the literature. Previously statistical models such as Altman Z-score [16], Beneish model [17], and financial ratio [18] are used. Afterward, researchers used data mining techniques to detect the occurrence of fraud in financial statements. Some of the used data mining algorithms are logistic regression, decision trees, and artificial neural networks [5,12,19,20]. In recent years, some researches in the area of financial accounting fraud detection have focused on hybrid methods combining of data mining techniques [6,7,8,21]. All these studies indicate that methods regarding financial statement information extraction is useful for financial accounting fraud detection. Especially, a careful examination of financial ratios can reveal the signs of fraudulent behaviors. Therefore, it is important to understand which financial ratios are mostly used for detecting financial accounting fraud. In addition, using different financial ratios for detecting financial accounting fraud may cause detection faults.
The purpose of this study is to shed light on financial accounting fraud detection for Turkish SMEs. Notably, 99.8% of all enterprises operating in Turkey are SMEs, and these SMEs cover 76.7% of total employment [22]. The implementation of auditing is not obligatory for these SMEs in Turkey. Companies, which are subject to audit, are specified by the Cabinet Decree, and most of the SMEs do not comply regulations which are determined by the Cabinet Decree [23]. For these reasons, Turkish SMEs are greatly exposed to fraud risks and creditor banks are facing big challenges to deal with financial accounting fraud.
This study aims to explore the effectiveness of machine learning classifiers for financial accounting fraud detection. Our research methodology consists of two stages. First stage is data preprocessing. Second stage is performance evaluation and comparison of classifiers. In the first stage of data preprocessing; financial ratio calculation, feature selection methods for financial ratios, and sampling methods are carried out, respectively. In this study, T test and genetic search are employed as feature selection methods to determine the financial ratios with the greatest impact on fraudulent financial statements. After selection of the best features, two sampling methods of oversampling and undersampling are performed. In second stage of performance evaluation and comparison of classifiers; seven different classifiers, which are support vector machine (SVM), Naive Bayes, artificial neural network (ANN), K-nearest neighbor (kNN), random forest, logistic regression, and bagging, are executed and compared by using performance metrics. Classifiers are also compared without using any feature selection and/or sampling techniques.
For the application and assessments of our proposed research methodology, data collection is performed from one of the leading creditor banks in Turkey. In this regard, 341 Turkish SMEs are examined considering their particular financial statements covering five-year period from 2013 to 2017. Among 1705 cases (341 SMEsX5 years) comprising 1384 nonfraudulent cases and 321 fraudulent cases (by 122 firms) are detected. Since two classes are highly imbalanced, sampling techniques are notably considered to be utilized in order to mitigate class imbalance problem.
To the best of our knowledge, prior studies have not effectively solved class imbalance problem, yet. Most of researchers studied on balanced sample [5,8,11,20,24] or matched fraudulent firms with nonfraudulent firms at different ratios [7,9,12,18]. As it can be seen in Table 1, few reseachers have used sampling methods in financial fraud detection models [21,25]. The originality of this study relies on extension of the existing literature by using sampling methods for solving class imbalance problem in financial fraud detection.
| Research | Studied Data | Used Feature Selection Method | Utilized Sampling Approaches | Used Classifiers | Performance Metrics |
|---|---|---|---|---|---|
| Spathis [5] | Athens Stock Exchange | – | – | Logistic Regression | Accuracy |
| Kaminski et al. [18] | U.S SEC's listed companies (AAERs) | – | – | Resubstitution, Cross-validation method | Accuracy |
| Kotsiantis et al. [9] | Athens Stock Exchange manufacturing firms | ReliefF | – | Decision Tree, ANN, Bayesian Networks, kNN, Rule-learners, SVM, Stacking | Accuracy |
| Kirkos et al. [24] | Athens Stock Exchange | ANOVA | – | Decision Trees, Neural Networks, Bayesian Belief Networks | Accuracy, Type I, and Type II error |
| Liou [27] | Taiwan Economic Journal data bank and Taiwan Stock Exchange Corporation | Stepwise Logistic Regression | – | Logistic Regression, ANN, Decision Tree | Accuracy |
| Persons [19] | U.S SEC's listed companies (AAERs) and COMPUSTAT database | – | – | Logistic Regression | Type I and Type II error |
| Ravisankar et al. [21] | Chinese listed companies | T test | – | Genetic Programming, SVM, Group Method of Data Handling, Multi-layer Feedforward Neural Network, Probabilistic Neural Network, Logistic regression | Accuracy, Sensitivity, Specificity, AUC |
| Huang [28] | Taiwan Economic Journal data bank, Financial Supervisory Commission, the Securities, and Futures Investors Protection Center | T test | – | SVM, Logistic Regression | Accuracy, Type I and Type II error |
| Chen [7] | Taiwan's listed and OTC companies | DT-CART and CHAID algorithm | – | CART, CHAID, BBN, SVM, ANN | Accuracy, Type I and Type II error |
| Özdağoğlu et al. [20] | Turkish listed companies | – | – | Decision Tree, Logistic Regression, ANN | Accuracy, Precision, Recall, F-Measure, AUC |
| Omar et al. [12] | Malaysian small market capitalization companies | – | – | ANN | Accuracy |
| Dutta et al. [21] | Audit Analytics and COMPUSTAT database | Stepwise Forward Selection | Over Sampling (SMOTE) | Decision Tree, ANN, Naïve Bayes, SVM, Bayesian Belief Network | Accuracy, False positive rate, Precision, Recall, Specificity, F-Measure, AUC |
| Yao et al. [8] | Chinese listed companies | Principal component analysis, Xgboost | - | Random Forest, ANN, Logistic Regression, SVM, Decision Tree | Accuracy |
| Ye et al. [25] | Chinese listed companies | Chi-square | Over Sampling (SMOTE) | Random Forest, ANN, Logistic Regression, SVM, CART, Decision Tree, BBN, Bagging, Stacking, Adaboost | Precision, Recall, F-Measure, AUC, Kappa statistic |
| This study | Turkish SMEs | T-test and Genetic Search | Over Sampling (SMOTE), Under Sampling | Random Forest, ANN, Logistic Regression, SVM, kNN, Naive Bayes, Bagging | Accuracy, True positive rate, Precision, G-Measure, AUC |
Some of studies that examine financial accounting fraud detection.
The remainder of this study is organized as follows: Section 2 reviews the relevant literature. Section 3 explains research methodology used in this study. Section 4 presents application study and results of analyses. Section 5 provides conclusion along with recommendations for further directions.
2. LITERATURE REVIEW
Financial accounting fraud involves intentional misstatements including omissions of amounts or disclosures in financial statements. Overstatement of assets, understatement of expenses or liabilities, misappropriation of assets, inappropriate disclosure, and other miscellaneous techniques are used to deceive financial statement users [26].
Researchers have used various techniques and models for detecting financial accounting fraud. Table 1. presents some of studies that examine financial accounting fraud detection.
Spathis [5] used the logistic regression method for detecting financial accounting fraud. The researcher did not used any feature selection method for selecting financial ratios. Ten financial ratios based on previous researches were used to detect financial accounting fraud. The study used balanced sample which contains 38 fraud companies and 38 nonfraud companies, and obtained accuracy rates at 84%.
Kaminski et al. [18] analyzed the success of financial ratios for detecting financial accounting fraud. Fraudulent firms with nonfraudulent firms were matched and 21 financial ratios of two groups were compared by using univariate analysis (paired sample T test) for seven years. The results of the study showed that 16 of the 21 financial ratios were found to be statistically significant at a level of 0.10 or less for the seven-year time period. Nine ratios were significant for only one time period and four were significant for two time periods. Three ratios were significant for three time periods. Discriminant analysis was also used for detecting financial accounting fraud, and it was found that misclassifications for fraud firms ranged from 58% to 98%. It was concluded that selected financial ratios have limited ability to detect financial accounting fraud.
Kotsiantis et al. [9] used machine learning techniques such as decision trees, ANNs, Bayesian network, logistic regression, kNN, and SVM technique to create a hybrid decision system. They used imbalanced sample contained 164 Greek manufacturing firms listed on the Athens Stock Exchange. Of these, 41 firms were fraudulent and 123 were nonraudulent firms. The fraudulent firms were matched with nonfraudulent firms. A statistical measure—ReliefF was used for selecting features. The results indicates that a relatively small list of financial ratios largely determines the classification results.
Kirkos et al. [24] compared three data mining methods in terms of their performance for detecting fraudulent financial statements. These methods are decision trees, neural networks, and Bayesian belief networks. The researcher studied on balanced sample including 76 Greek manufacturing firms (38 fraud and 38 nonfraud firms). The results show that the Bayesian belief networks have higher accuracy compared to decision trees and neural networks in terms of performance.
Liou [27] compared three data mining algorithms including logistic regression, ANN, and decision tree model in detecting fraudulent financial statements and business failure prediction. In total, 52 financial ratios were selected from previous studies. By using stepwise logistic regression, 25 out of the 52 were found to have significant detection power in detecting fraudulent financial statements. Using the same method, 19 out of 52 variables were also found to have significant predictive power in business failure prediction. The results of the study indicate that logistic regression outperforms the other two algorithms in terms of overall accuracy for detecting fraudulent financial reporting, and a decision tree achieves higher percentage in business failure prediction.
Persons [19] used stepwise-logistic model for predicting fraudulent financial reporting. A sample of 103 fraud firms for the fraud year and 100 firms for the preceding fraud year was used in the study. Each fraud firm was matched with a nonfraud firm on the basis of industry and time period. The findings of the study show that the model correctly identifies a large percentage of fraud firms and misclassifies a relatively small percentage of nonfraud firms.
Ravisankar et al. [11] employed data mining techniques such as multilayer feed forward neural network, SVMs, genetic programming, group method of data handling, logistic regression, andprobabilistic neural network to detect financial statement fraud. Each of these techniques is compared with and without feature selection. T test is used as a feature selection method. The dataset used in this study was obtained from 202 companies that were listed in various Chinese stock exchanges, of which 101 were fraudulent and 101 were nonfraudulent companies. It was found that probabilistic neural network outperforms all the techniques without feature selection, and genetic programming and probabilistic neural network outperform others with feature selection.
Huang [28] used SVM and logistic regression to develop fraud detection models. The samples used in this study were obtained from public offering companies and were selected in a “1:4” mix of those in the same sector and being prosecuted in the same year with those not being prosecuted. T test was used for variables selection. The results showed that the logistic regression with selected variables can correctly predict financial statement fraud one year before the fraud year, and the correct rate reaches 91%. In addition, SVM with all variables has 82% correct rate for the two years before the fraud.
Chen [7] improved a two-stage model for detecting fraudulent financial statement. In the first stage, two decision tree algorithms, including the classification and regression trees (CART) and the Chi-squared automatic interaction detector (CHAID) were applied for variable selection. In the second stage, CART, CHAID, Bayesian belief network, SVM, and artificial neural network were used in order to construct fraudulent financial statement detection models. The results showed that the detection performance of the CHAID–CART model is the most effective, with an overall accuracy of 87.97%.
Özdağoğlu et al. [20] employed decision tree, logistic regression, and ANN to develop a decision support system to classify firms. The dataset was selected from financial statements of Turkish firms listed on Borsa İstanbul. The study used balanced sample which contains 110 records classified in the fraud class and 114 records classified in the nonfraud class. The results showed that the artificial neural network had the highest prediction accuracy.
Omar et al. [12] used ANN in predicting fraudulent financial reporting in small market capitalization companies in Malaysia. Ten financial ratios were used as fraud risk indicators to predict fraudulent financial reporting. In addition, each of fraud companies was matched with approximately six nonfraud companies. The results of this study indicate that the proposed ANN methodology give a higher prediction result (94.87%) on fraudulent financial reporting model compared to traditional statistic, linear regression and other techniques as in previous studies.
Dutta et al. [8] employed decision tree, ANN, Naive Bayes, SVM, and Bayesian belief network for developing predictive models based on both intentional and unintentional financial restatements using a comprehensive real dataset that includes 3513 restatement cases over a period of 2001 to 2014. Their dataset contains 3513 cases with restatement category and 60720 cases with non-restatement category. As the two classes are highly imbalanced in the dataset, oversampling technique (i.e., Synthetic Minority Oversampling Technique [SMOTE]) has been used in order to mitigate class imbalance problem. In the study, a feature selection method using stepwise forward selection has also been used to remove less significant or redundant attributes. The results indicate that ANN outperforms other data mining algorithms in terms of accuracy and area under the receiver operating characteristic (ROC) curve.
Yao et al. [16] proposed an optimized financial fraud detection model combining feature selection and machine learning classification. Random forest, ANN, logistic regression, SVM, anddecision tree were used as classification methods. Principal component analysis and Xgboost were used as feature selection methods. The results showed that random forest outperformed the other four methods. With respect to two feature selection methods, Xgboost performed better.
Ye et al. [25] compared various classification models such as random forest, ANN, logistics regression, SVMs, CART, decision trees, Bayesian networks, bagging, stacking, and Adaboost in detecting fraudulent financial statements. The used dataset contains 2011 Chinese companies' publicly available financial disclosures from 2007 to 2017, of which 1314 were fraudulent and 10412 were nonfraudulent. Due to the high-class imbalance in the dataset, SMOTE was employed. In the study, chi-square test was used as feature selection method to reduce dimensionality. The results found that random forest outperformed the other nine methods.
3. RESEARCH METHODOLOGY AND APPLICATION
This study consists of two stages. The first stage includes data preprocessing. In the data preprocessing stage, financial ratio calculation, feature selection methods for financial ratios, and sampling methods are carried out, respectively. The second stage is performance evaluation and comparison of classifiers.
In the second stage, seven different classifiers, which are SVM, Naive Bayes, ANN, kNN, random forest, logistic regression, and bagging, are compared by using performance metrics. In addition, models created without using sampling and feature selection techniques are compared. A schematic diagram of this research method is shown in Figure 1.
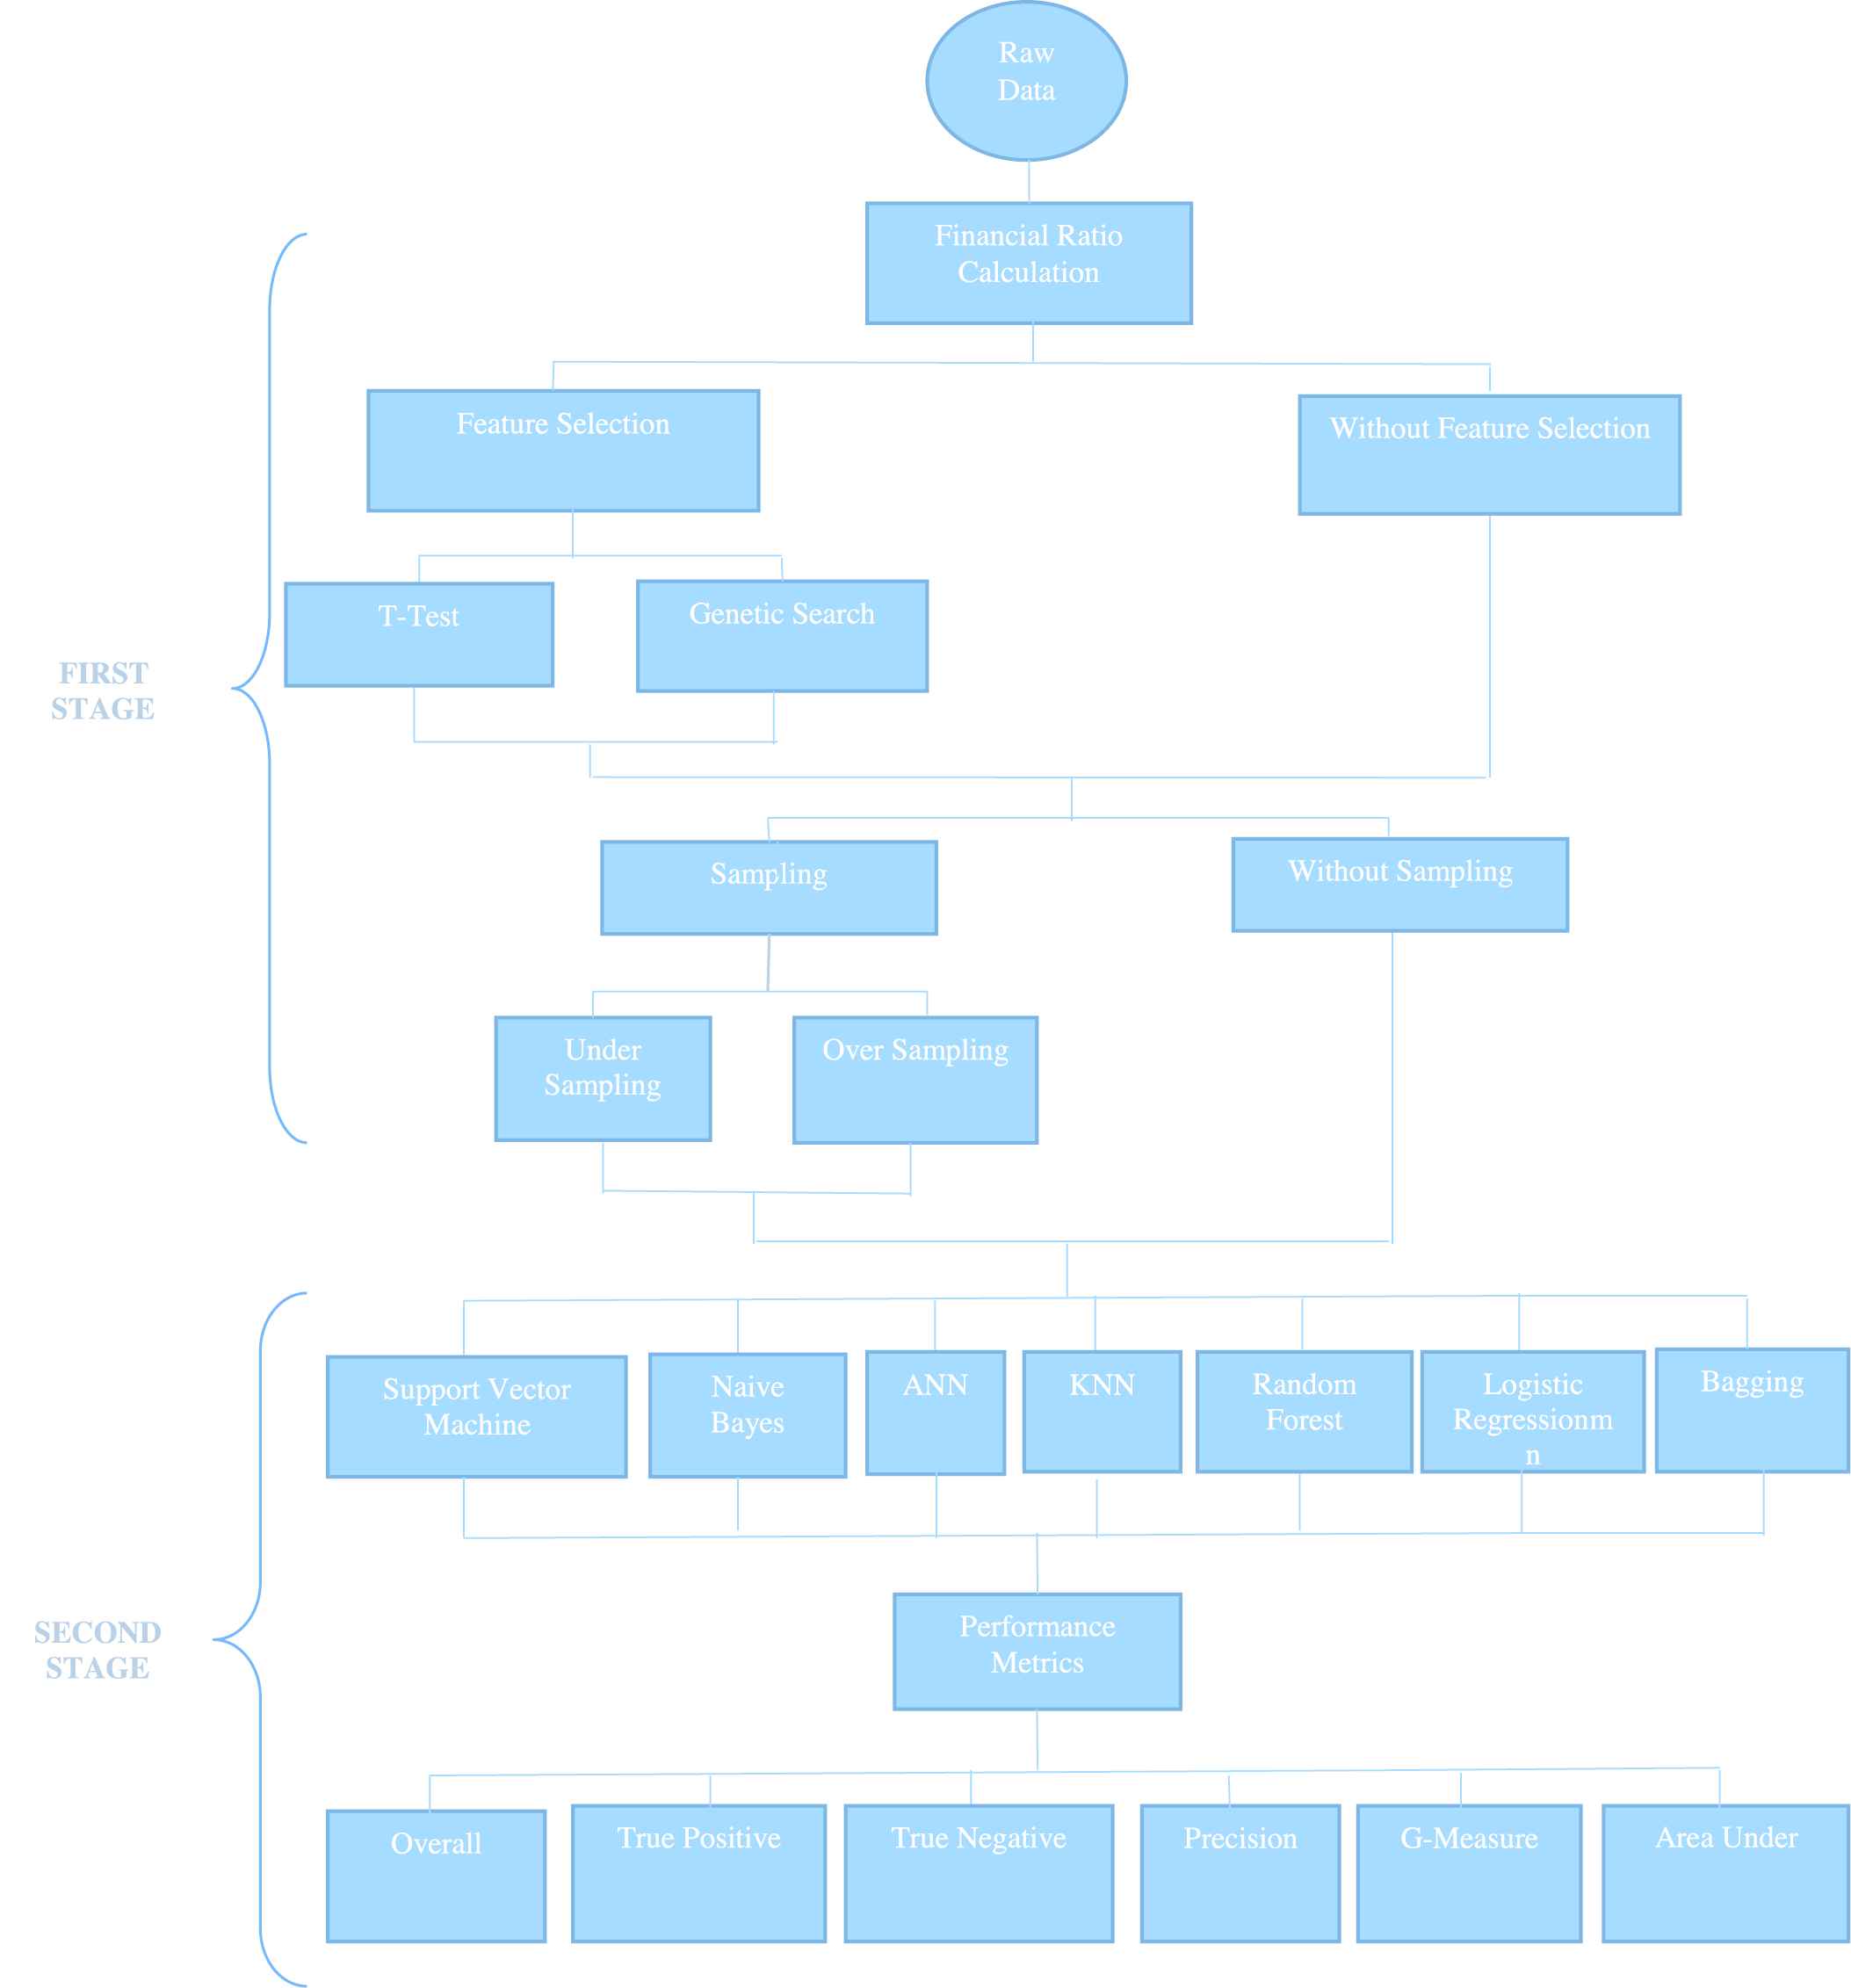
A schematic diagram of the our proposed research methodology of this study.
3.1. Data Collection
This study focuses on fraud detection in financial statements of 341 Turkish SMEs from different sectors in which credit demands are intense from one of the leading creditor banks in Turkey. 341 Turkish SMEs have been examined using their particular financial statements for a five-year period from 2013 to 2017.
A firm may commit fraud over only one year, nonconsecutive years, or consecutive years. The sample comprises 321 fraud cases by 122 firms for a five-year period from 2013 to 2017. In total, this dataset includes 1384 cases with nonfraudulent category and 321 cases with fraudulent category (Figure 2). As the two classes are highly imbalanced in the dataset, sampling techniques have been used in order to mitigate class imbalance problem.
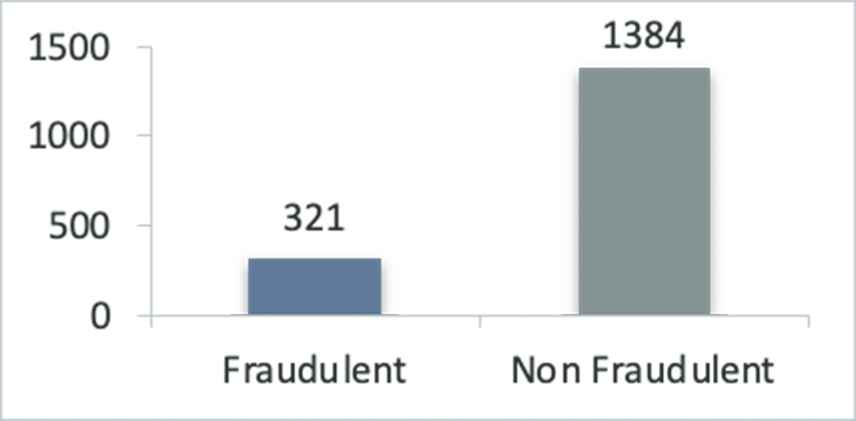
Distribution of cases.
3.2. Financial Ratios
If a fraudulent activity is carried out, financial ratios associated with the manipulated accounts will deviate from the normal behavior and will show signs of accounting fraud, appropriately [29]. Therefore, financial ratios were in widespread use as fraud risk indicators in the existing literature.
Zhou and Kapoor [30] proposed an adaptive learning framework that is based on the response surface method in order to improve the efficiency of the traditional data mining techniques. In this context, they proposed the inclusion of many external and internal variables, such as capital structure, choices, management attitudes that contribute toward the financial fraud detection techniques. However, ratios using external and internal operational-type measures are excluded in this study, since financial statements are the data source. Table 2 lists 32 financial ratios used in this study.
| Category | Financial Ratios | References |
|---|---|---|
| Liquidity ratios | Current ratio (V1) | [6,7,9,11,18,24,31,32] |
| Quick ratio (V2) | [7,8,24,32] | |
| Cash ratio (V3) | NA in literature | |
| Leverage ratios | Debt ratio (V4) | [5,6,7,9,12,18,19,24,31,32] |
| Debt-to-equity ratio (V5) | [5,6,7,18,32] | |
| Efficiency ratios | Inventory turnover (V6) | [7,9,18,27] |
| Accounts Payable to Cost of Good Sold (V7) | [29] | |
| Total asset turnover (V8) | [5,7,9,12,19,24,31,33] | |
| Accounts receivable turnover (V9) | [7,34] | |
| Cash Conversion Cycle ratio (V10) | NA in literature | |
| Accounts Receivable to Sales (V11) | [5,6,7,12,24,33,35] | |
| Accounts Receivable to Total Assets (V12) | [7,9,18,19,33] | |
| Inventory to Sales (V13) | [6,8,12,18,24,33] | |
| Inventory to Total Assets (V14) | [5,6,11,18,19,24,32,33] | |
| Inventory to Current Assets (V15) | [18,29] | |
| Profitability ratios | Return on Assets ratio (V16) | [5,6,7,8,11,12,18,19,31,32] |
| Net profit margin ratio (V17) | [5,6,12,18] | |
| EBIT to Total Assets (V18) | [9] | |
| Return on Equity ratio (V19) | [34] | |
| Growth ratios | Growth of accounts receivables (V20) | [32] |
| Growth of Inventory (V21) | [32] | |
| Growth of income from principal business operations (V22) | [32] | |
| Growth of sales (V23) | [7,8,24,33] | |
| Other ratios | Cash to Total Assets (V24) | NA in literature |
| Due from Shareholders to Total Assets (V25) | NA in literature | |
| Due to Shareholders to Total Liabilities (V26) | NA in literature | |
| Other Fixed Assets to Total Assets (V27) | NA in literature | |
| Other Extraordinary Expenses and Losses to Net Sales (V28) | NA in literature | |
| Due to Shareholders to Average Inventory (V29) | NA in literature | |
| Doubtful Trade Receivables to Total Assets (V30) | NA in literature | |
| Prepaid Expenses for Future Months to Total Assets (V31) | NA in literature | |
| Prepaid Expenses for Future Years to Total Assets (V32) | NA in literature |
Financial ratios which are examined for financial fraud detection.
Most of the selected financial ratios are based on previous studies and related to variables of liquidity, leverage, efficiency, profitability, and growth. However, to the best of our knowledge Cash ratio and Cash Conversion Cycle ratio have not been considered in the literature for financial accounting fraud detection. We also examine financial ratios, which are not considered in the literature, but mostly manipulated by companies in practice. These financial ratios are classified in “Other Ratios” group.
3.3. Feature Selection
In order to reduce dimensionality, two selection methods were used: T test and genetic algorithm.
3.3.1. T test
T test has been used as a feature selection method in many studies [11,28,36,37,38]. In this study, T test is also employed as the first feature selection method.
The t test is used to examine whether the means of fraudulent firms and nonfraudulent firms are statistically different from each other. The t-statistic values are computed for each financial ratio. Table 3 depicts the means, standard deviations, t values, and p values for each financial ratio used in this study. As can be seen in Table 3, 15 variables presented low p values (p ≤ 0.05).
| Fraudulent Firms |
Nonfraudulent Firms |
t statistic |
|||||
|---|---|---|---|---|---|---|---|
| Category | Financial Ratios | Mean | Standard Deviation | Mean | Standard Deviation | t value | p value |
| Liquidity ratios | Current ratio | 2.43 | 6.6 | 2.23 | 6.37 | −0.53 | 0.599 |
| Quick ratio | 1.78 | 5.92 | 1.37 | 3.06 | −1.73 | 0.085 | |
| Cash ratio | 0.62 | 4.34 | 0.26 | 1.14 | −1.5 | 0.135 | |
| Leverage ratios | Debt ratio | 0.723 | 0.373 | 0.669 | 0.221 | −2.48 | 0.013 |
| Debt-to-equity ratio | 4.69 | 9.63 | 3.5 | 24.3 | −0.87 | 0.386 | |
| Efficiency ratios | Inventory turnover | 104 | 912 | 214 | 1955 | 0.98 | 0.325 |
| Accounts Payable to Cost of Good Sold | 0.319 | 0.413 | 0.243 | 0.235 | −3.2 | 0.002 | |
| Total asset turnover | 1.205 | 0.814 | 1.57 | 1.02 | 6.84 | 0.000 | |
| Accounts receivable turnover | 61 | 260 | 36 | 604 | −0.73 | 0.466 | |
| Cash Conversion Cycle ratio | 126 | 217 | 93 | 124 | −2.63 | 0.009 | |
| Accounts Receivable to Sales | 0.277 | 0.301 | 0.258 | 0.209 | −1.12 | 0.262 | |
| Accounts Receivable to Total Assets | 0.264 | 0.223 | 0.333 | 0.221 | 5.04 | 0.000 | |
| Inventory to Sales | 0.294 | 0.424 | 0.224 | 0.277 | −2.79 | 0.006 | |
| Inventory to Total Assets | 0.225 | 0.238 | 0.244 | 0.200 | 1.35 | 0.178 | |
| Inventory to Current Assets | 0.300 | 0.290 | 0.345 | 0.250 | 2.58 | 0.010 | |
| Profitability ratios | Return on Assets ratio | 0.0215 | 0.0925 | 0.0346 | 0.0605 | 2.42 | 0.016 |
| Net profit margin ratio | 0.012 | 0.133 | 0.023 | 0.072 | 1.43 | 0.154 | |
| EBIT to Total Assets | 0.076 | 0.105 | 0.0835 | 0.0804 | 1.27 | 0.203 | |
| Return on Equity ratio | 0.031 | 0.886 | 0.098 | 0.700 | 1.46 | 0.144 | |
| Growth ratios | Growth of accounts receivables | 1.3 | 10.6 | 2.7 | 65.5 | 0.38 | 0.702 |
| Growth of Inventory | 0.63 | 2.48 | 4 | 55.7 | 1.07 | 0.286 | |
| Growth of income from principalbusiness operations | 0.2 | 21.3 | −0.7 | 19.6 | −0.72 | 0.472 | |
| Growth of sales | 0.181 | 0.500 | 0.59 | 9.00 | 0.82 | 0.415 | |
| Other ratios | Cash to Total Assets | 0.0405 | 0.0765 | 0.0061 | 0.0217 | −7.96 | 0.000 |
| Due from Shareholders to Total Assets | 0.0447 | 0.0978 | 0.0021 | 0.0153 | −7.79 | 0.000 | |
| Due to Shareholders to Total Liabilities | 0.097 | 0.191 | 0.083 | 0.166 | −1.26 | 0.209 | |
| Other Fixed Assets to Total Assets | 0.0076 | 0.0410 | 0.0004 | 0.0062 | −3.14 | 0.002 | |
| Other Extraordinary Expenses and Losses to Net Sales | 0.0198 | 0.0574 | 0.0050 | 0.0160 | −4.58 | 0.000 | |
| Due to Shareholders to Average Inventory | 2.9 | 10.5 | 17 | 300 | 0.84 | 0.403 | |
| Doubtful Trade Receivables to Total Assets | 0.0112 | 0.0768 | 0.0009 | 0.0037 | −2.43 | 0.016 | |
| Prepaid Expenses for Future Months to Total Assets | 0.011 | 0.030 | 0.0027 | 0.0108 | −4.92 | 0.000 | |
| Prepaid Expenses for Future Years to Total Assets | 0.0190 | 0.0422 | 0.0056 | 0.0133 | −5.62 | 0.000 | |
The means, standard deviations, T-values and P-values for each financial ratio.
The selected variables are Debt ratio, Accounts Payable to Cost of Good Sold, Total asset turnover, Cash Conversion Cycle ratio, Accounts Receivable to Total Assets, Inventory to Sales, Inventory to Current Assets, Return on Assets ratio, Cash to Total Assets, Due from Shareholders to Total Assets, Other Fixed Assets to Total Assets, Other Extraordinary Expenses and Losses to Net Sales, Doubtful Trade Receivables to Total Assets, Prepaid Expenses for Future Months to Total Assets and Prepaid Expenses for Future Years to Total Assets.
3.3.2. Genetic search
Genetic Search, which is a search based on a genetic algorithm, is used as the second feature selection method. This method is capable of effectively exploring large search spaces, which is usually required in case of attribute selection. The selected features by Genetic Search consist of “Accounts receivable turnover,” “Inventory to Total Assets,” “Cash to Total Assets,” “Due from Shareholders to Total Assets,” “Other Fixed Assets to Total Assets,” “Other Extraordinary Expenses and Losses to Net Sales,” “Doubtful Trade Receivables to Total Assets,” “Prepaid Expenses for Future Months to Total Assets” and “Prepaid Expenses for Future Years to Total Assets.” Table 4 shows that the selected features by two feature selection methods.
| Methods | Selected Financial Ratios |
|---|---|
| T test | V4, V7, V8, V10, V12, V13, V15, V16, V24, V25, V27, V28, V30, V31, V32 |
| Genetic search | V9, V14, V24, V25, V27, V28, V30, V31, V32 |
Selected financial ratios by two feature selection methods.
3.4. Sampling Methods
After the selection of the best features, two sampling methods were employed for seven different machine learning classifiers. The first method is oversampling. SMOTE, which generates new synthetics data for the minority class, was used as oversampling method. The second method is undersampling, which consists of dropping data randomly from the majority class.
3.4.1. Oversampling
SMOTE was introduced as an oversampling method by Chawla et al. [39]. This method generates random synthetic instances of the minority class rather than replicating the existing instances of the minority sample. SMOTE algorithm uses kNN technique to create these synthetic minority examples. Neighbors are randomly chosen from the kNNs depending upon the amount of oversampling required. Then the difference between the feature vector (minority class sample) and its nearest neighbor is taken. This difference is multiplied by a random number between 0 and 1, and then it is added to the feature vector. Thus a new feature vector is created [39].
Different amount of synthetic oversampling may be needed to create a balanced dataset. In this study, the percentage of SMOTE instances to create is 300 as the prior imbalance ratio is 1:4.31.
3.4.2. Undersampling
In this study, random undersampling was selected among undersampling methods. This method randomly selects a set of majority class instances and remove these instances to mitigate class imbalance problem [40]. However, randomization can be problematic when balancing datasets by undersampling. In this approach, the split is completely random and maintains only a fraction of the data. Because of this randomness, very good (clean) sampled instances, which could increase model performance or noisy instances, which may degrade model performance can be generated [41]. Therefore, there is no clear consensus about which method better results [42,43]. It should be noted here that, “without sampling” approach is also employed for comparing the success of classifiers.
3.5. Classifiers
In this study, the first stage is data preprocessing stage with feature selection and sampling techniques, the second stage is performance evaluation and comparison of seven classifiers employed for financial account fraud detection.
Ngai et al. [4] presented a comprehensive literature review on the data mining techniques and found that logistic regression and neural networks are the main data mining techniques that are commonly used in financial accounting fraud detection. Besides these commonly used data mining techniques, in this study SVM, Naive Bayes, kNN, random forest, and bagging were also used for financial account fraud detection.
Theoretical background of the classifiers used in this study are summarized in the following subsections.
3.5.1. Support vector machines
SVM, which was introduced by Vapnik [44], is a machine learning method based on statistical learning theory and structural risk minimization. SVM finds an optimal separating hyperplane to classify two or more class of data through the learning mechanism. SVM can be classified into linear divisibility where the dataset is linearly separable or linear nondivisibility where a linear hyperplane does not exists that will clearly separate the dataset [7]. Most of the real world problems falls into the linear nondivisibility category. In such cases, the nonlinear SVM method is kernelized to define a separating hyperplane [21]. Vapnik [44] considers three types of learning machines: polynomial learning, radial basis functions, and two-layer neural networks. In this study, the polynomial kernel, which is a kernel function commonly used with SVMs, is employed for detecting financial accounting fraud.
3.5.2. Naive Bayes
A Naive Bayes classifier is based on Bayes' theorem. According to the Bayes theorem, the conditional probability P (A\B), can be determined in terms of P(A), P(B), and P(B\A).
Naive Bayes classifier has disadvantage owing to inaccuracies in the assumptions made for its use, such as class-conditional independence, and the lack of available probability data. However, this method only needs small portion of training data in order to estimate the parameters. This classification technique has also advantage when input dimensionality is high [45]. Naive Bayes classifier is widely used for detecting financial accounting fraud [22,46,47,48].
3.5.3. Artificial neural network
ANN is a supervised machine learning algorithm which is inspired by biological neural networks. ANN gains powerful computational capabilities through learning procedure. A neural network consists of large number of interconnected artificial neurons. Each of these neurons has its own memory, and ability of transferring the information to other neurons through one-way signal channels [12]. The neurons are arranged into layers. There are mainly two layers: input layer and output layer. There may exist one or more hidden layers between the input and output layer. Neural networks generate their own rules by training examples. First, the network is trained on a set of paired data. Then the weights of the connections between the neurons are fixed and the network is used for classifying a new dataset [9]. In recent years, ANN has been used in many studies to develop models for financial accounting fraud detection [8,12,20,25].
3.5.4. K-nearest neighbor
K-nearest neighbor (KNN) method uses geographic neighborhood of a sample to predict its classification. This method assumes that the instances in a dataset will generally be close to other instances in the similar class. Therefore, a new sample is predicted by using the k-closest instances from the training set. Euclidean distance is generally used as a distance metric for determining the measure of closeness. As an alternative to the Euclidean distance, Manhattan, Minkowski and Mahalanobis distances can also be used. The choice of metric depends on characteristics of the variables [47]. After determining the measure of closeness, a new instance is assigned to the appropriate class. The kNN method is widely used for financial accounting fraud detection [9,47,49,50].
3.5.5. Random forest
A random forest is an ensemble method consisting of a collection of multiple decision tree. Each decision tree is generated by using a random selection of attributes at each node to determine the split. Each tree depends on the values of a random vector sampled independently and with the same distribution for all trees in the forest [45,51]. After each tree is constructed, the classified sample is entered and each tree gives a classification, which is called voting. Then all classifiers determine the classification result according to the majority rule [8].
In recent years, some researches in the area of fraudulent financial reporting detection have used this method [8,25,52], and these studies have found that the random forest has some advantages: it is good at processing high-dimensional data; it may avoid overfitting to some extent; it has good robustness and stable results; it has good performance in terms of accuracy.
3.5.6. Logistic regression
Logistic regression is a commonly used approach for binary classification problems where the classifying variable can only have two values such as true/false or success/failure. It learns a set of parameters, that maximizes the likelihood of the class labels for a given set of training data [11,53]. After learning parameters, these parameters are used to predict the values of the class in testing dataset.
Logistic regression model has following formula:
Logistic regression is quite simple and easy to understand. Its computational cost is relatively low [8]. Therefore, most of existing studies on financial accounting fraud detection employ logistic regression [5,8,11,19,20,25,27].
3.5.7. Bagging
Bagging is an ensemble method, made up of a combination of classifiers. This composite model is proposed by Breiman [55] for increasing classification accuracy of class-imbalanced data.
Bagging works as follows. For iteration
Bagging tends to be more accurate than its base classifiers since the composite model reduces the variance of the individual classifiers. It is also more robust to the effects of noisy data and overfitting [45]. In this study, bagging classifier with the decision tree algorithm J48, which is based on the C4.5 model, is used to construct the ensemble model. Since our dataset is highly imbalanced, decision tree is selected as a single classifier for the ensemble model. Decision tree algorithm presents a very good behavior by weighting the results of the trees and reducing the variance of the dataset [56].
3.6. Performance Metrics
After preprocessing data with feature selection and sampling techniques, seven different classifiers were compared by using performance metrics. The performance metrics used in this study, are overall accuracy, TP rate (Sensitivity-Recall), TN rate (Specificity), Precision, G-measure, and ROC curve. They are calculated as follows:
Table 5 presents the confusion matrix, which describes the variables in the equations of (4), (5), (6), (7) and (8). True positive (TP) represents the number of samples that are actually positive and correctly classified as positive. True negative (TN) represents the number of samples that are actually negative and correctly classified as negative. False positive (FP) represents the number of samples that are actually negative and misclassified as positive. False negative (FN) represents the number of samples that are actually positive and misclassified as negative [57].
| Predicted Positive | Predicted Negative | |
|---|---|---|
| Actual Positive | True Positive (TP) | False Negative (FN) |
| Actual Negative | False Positive (FP) | True Negative (TN) |
Confusion matrix.
Overall accuracy represents proportion of the total numberof predictions that are correct, TP rate represents proportion of correctly detected fraudulent cases, TN rate represents percentage of correctly detected nonfraudulent cases, precision represents proportion of the predicted fraudulent cases that are correct.
G measure is the geometric mean of true positive rate and TN rate. ROC curve is obtained by plotting the TP rate against FP rate at different settings of the threshold. ROC curve has been widely used to evaluate the performances of classifiers in the skewed and overlapping datasets [58].
4. RESULTS AND DISCUSSION
The software package Waikato Environment for Knowledge Analysis (WEKA) was used to conduct the study. To evaluate the classification algorithms, ten-fold cross validation was used in the experiments. Most of the parameters of the functions were chosen as default values.
Tables 6–11 summarize performance measures of classifiers under different sampling and feature selection techniques. In total, 63 model including 7 classifiers were built and compared with respect to performance measures. The best value for each performance metric is in bold and the worst value for each performance metric is underlined.
| Feature Selection Methods |
Without Feature Selection | ||||||||
|---|---|---|---|---|---|---|---|---|---|
| T Test |
Genetic Search |
||||||||
| Without Sampling | Over Sampling | Under Sampling | Without Sampling | Over Sampling | Under Sampling | Without Sampling | Over Sampling | Under Sampling | |
| SVM | 0.8710 | 0.8579 | 0.8022 | 0.8721 | 0.8111 | 0.7726 | 0.8704 | 0.8587 | 0.8131 |
| Naive Bayes | 0.8856 | 0.7999 | 0.7726 | 0.8868 | 0.7882 | 0.7648 | 0.8211 | 0.5881 | 0.7695 |
| ANN | 0.8897 | 0.8726 | 0.8364 | 0.8938 | 0.8546 | 0.8069 | 0.8979 | 0.8834 | 0.8287 |
| KNN | 0.8938 | 0.8849 | 0.7928 | 0.8774 | 0.8370 | 0.7648 | 0.8944 | 0.8992 | 0.7882 |
| Random Forest | 0.9196 | 0.9292 | 0.8707 | 0.9161 | 0.9284 | 0.8723 | 0.9179 | 0.9374 | 0.8707 |
| Logistic Regression | 0.9003 | 0.8733 | 0.8380 | 0.8944 | 0.8489 | 0.8411 | 0.8956 | 0.8808 | 0.8536 |
| Bagging | 0.9150 | 0.9037 | 0.8442 | 0.9079 | 0.9055 | 0.8364 | 0.9138 | 0.9127 | 0.8614 |
Overall accuracy of classifiers under different sampling and feature selection techniques.
| Feature Selection Methods |
Without Feature Selection | ||||||||
|---|---|---|---|---|---|---|---|---|---|
| T Test |
Genetic Search |
||||||||
| Without Sampling | Over Sampling | Under Sampling | Without Sampling | Over Sampling | Under Sampling | Without Sampling | Over Sampling | Under Sampling | |
| SVM | 0.3710 | 0.7840 | 0.6730 | 0.3740 | 0.6750 | 0.6010 | 0.3710 | 0.7830 | 0.7040 |
| Naive Bayes | 0.6320 | 0.6560 | 0.6200 | 0.6320 | 0.6280 | 0.6110 | 0.7880 | 0.9380 | 0.6950 |
| ANN | 0.6140 | 0.8290 | 0.8040 | 0.5950 | 0.7990 | 0.7320 | 0.6230 | 0.8790 | 0.8350 |
| KNN | 0.6570 | 0.8700 | 0.7910 | 0.6290 | 0.8200 | 0.7660 | 0.6570 | 0.8930 | 0.7690 |
| Random Forest | 0.6920 | 0.9280 | 0.8720 | 0.7230 | 0.9390 | 0.8690 | 0.6600 | 0.9470 | 0.8820 |
| Logistic Regression | 0.5950 | 0.8240 | 0.7730 | 0.5610 | 0.7810 | 0.7760 | 0.5860 | 0.8440 | 0.810 |
| Bagging | 0.7130 | 0.9060 | 0.8440 | 0.7070 | 0.9140 | 0.8260 | 0.7200 | 0.9170 | 0.8540 |
True positive rates of classifiers under different sampling and feature selection techniques.
| Feature Selection Methods |
Without Feature Selection | ||||||||
|---|---|---|---|---|---|---|---|---|---|
| T Test |
Genetic Search |
||||||||
| Without Sampling | Over Sampling | Under Sampling | Without Sampling | Over Sampling | Under Sampling | Without Sampling | Over Sampling | Under Sampling | |
| SVM | 0.9870 | 0.9260 | 0.9310 | 0.9880 | 0.9370 | 0.9440 | 0.9860 | 0.9280 | 0.9220 |
| Naive Bayes | 0.9440 | 0.9340 | 0.9250 | 0.9460 | 0.9370 | 0.9190 | 0.8290 | 0.2640 | 0.8440 |
| ANN | 0.9540 | 0.9130 | 0.8690 | 0.9630 | 0.9060 | 0.8820 | 0.9620 | 0.8880 | 0.8220 |
| KNN | 0.9490 | 0.8990 | 0.7940 | 0.9350 | 0.8530 | 0.7630 | 0.9490 | 0.9050 | 0.8070 |
| Random Forest | 0.9730 | 0.9300 | 0.8690 | 0.9610 | 0.9180 | 0.8750 | 0.9780 | 0.9280 | 0.8600 |
| Logistic Regression | 0.9710 | 0.9190 | 0.9030 | 0.9720 | 0.9120 | 0.9070 | 0.9670 | 0.9150 | 0.8970 |
| Bagging | 0.9620 | 0.9020 | 0.8440 | 0.9540 | 0.8980 | 0.8470 | 0.9590 | 0.9080 | 0.8690 |
True negative rates of classifiers under different sampling and feature selection techniques.
| Feature Selection Methods |
Without Feature Selection | ||||||||
|---|---|---|---|---|---|---|---|---|---|
| T Test |
Genetic Search |
||||||||
| Without Sampling | Over Sampling | Under Sampling | Without Sampling | Over Sampling | Under Sampling | Without Sampling | Over Sampling | Under Sampling | |
| SVM | 0.8690 | 0.9080 | 0.9080 | 0.8760 | 0.9090 | 0.9150 | 0.8620 | 0.9100 | 0.9000 |
| Naive Bayes | 0.7250 | 0.9010 | 0.8920 | 0.7300 | 0.9030 | 0.8830 | 0.5160 | 0.5420 | 0.8170 |
| ANN | 0.7550 | 0.8980 | 0.8600 | 0.7890 | 0.8880 | 0.8610 | 0.7910 | 0.8790 | 0.8250 |
| KNN | 0.7480 | 0.8890 | 0.7940 | 0.6920 | 0.8380 | 0.7640 | 0.7510 | 0.8970 | 0.7990 |
| Random Forest | 0.8540 | 0.9250 | 0.8700 | 0.8110 | 0.9140 | 0.8750 | 0.8720 | 0.9250 | 0.8630 |
| Logistic Regression | 0.8270 | 0.9040 | 0.8890 | 0.8220 | 0.8920 | 0.8920 | 0.8070 | 0.9020 | 0.8870 |
| Bagging | 0.8120 | 0.8950 | 0.8440 | 0.7830 | 0.8930 | 0.8440 | 0.8020 | 0.9030 | 0.8670 |
Precision of classifiers under different sampling and feature selection techniques.
| Feature Selection Methods |
Without Feature Selection | ||||||||
|---|---|---|---|---|---|---|---|---|---|
| T Test |
Genetic Search |
||||||||
| Without Sampling | Over Sampling | Under Sampling | Without Sampling | Over Sampling | Under Sampling | Without Sampling | Over Sampling | Under Sampling | |
| SVM | 0.6051 | 0.8520 | 0.7916 | 0.6079 | 0.7953 | 0.7532 | 0.6048 | 0.8524 | 0.8057 |
| Naive Bayes | 0.7724 | 0.7828 | 0.7573 | 0.7732 | 0.7671 | 0.7493 | 0.8082 | 0.4976 | 0.7659 |
| ANN | 0.7653 | 0.8700 | 0.8359 | 0.7570 | 0.8508 | 0.8035 | 0.7742 | 0.8835 | 0.8285 |
| KNN | 0.7896 | 0.8844 | 0.7925 | 0.7669 | 0.8363 | 0.7645 | 0.7896 | 0.8990 | 0.7878 |
| Random Forest | 0.8206 | 0.9290 | 0.8705 | 0.8335 | 0.9284 | 0.8720 | 0.8034 | 0.9375 | 0.8709 |
| Logistic Regression | 0.7601 | 0.8702 | 0.8355 | 0.7384 | 0.8440 | 0.8389 | 0.7528 | 0.8788 | 0.8524 |
| Bagging | 0.8282 | 0.9040 | 0.8440 | 0.8213 | 0.9060 | 0.8364 | 0.8310 | 0.9125 | 0.8615 |
G-measure of classifiers under different sampling and feature selection techniques.
| Feature Selection Methods |
Without Feature Selection | ||||||||
|---|---|---|---|---|---|---|---|---|---|
| T Test |
Genetic Search |
||||||||
| Without Sampling | Over Sampling | Under Sampling | Without Sampling | Over Sampling | Under Sampling | Without Sampling | Over Sampling | Under Sampling | |
| SVM | 0.6790 | 0.8550 | 0.8020 | 0.6810 | 0.8060 | 0.7730 | 0.6780 | 0.8560 | 0.8130 |
| Naive Bayes | 0.8910 | 0.9080 | 0.8790 | 0.8470 | 0.8660 | 0.8420 | 0.8390 | 0.8580 | 0.8110 |
| ANN | 0.8630 | 0.9290 | 0.9060 | 0.8570 | 0.9070 | 0.8680 | 0.8890 | 0.9390 | 0.8980 |
| KNN | 0.8050 | 0.8880 | 0.8050 | 0.7850 | 0.8380 | 0.7620 | 0.7980 | 0.8980 | 0.7890 |
| Random Forest | 0.9470 | 0.9780 | 0.9230 | 0.9300 | 0.9700 | 0.9240 | 0.9490 | 0.9840 | 0.9190 |
| Logistic Regression | 0.9040 | 0.9400 | 0.9040 | 0.8850 | 0.9110 | 0.8810 | 0.9130 | 0.9380 | 0.9050 |
| Bagging | 0.9360 | 0.9610 | 0.9060 | 0.9280 | 0.9510 | 0.8970 | 0.9280 | 0.9690 | 0.9080 |
Area under ROC curve of classifiers under different sampling and feature selection techniques.
As seen from Tables 6–11, Random Forest classifier always performs the best or the second best among the seven classifiers in terms of all the performance metrics.
Especially, Random Forest-without feature selection-oversampling model outperforms all other models. However, SVMs obtains better performance than the Random Forest classifier in terms of TN rate. SVMs-Genetic Search-Without Sampling model is the best at 98.80% in terms of TN rate (Table 8).
As shown in Table 6, overall accuracy of the Random Forest-without feature selection-oversampling model is the highest at 93.74%. Naive Bayes-Genetic Search-Under Sampling model and KNN-Genetic Search-Under Sampling model perform the worst at 76.48% among all other models.
As shown in Table 7, in terms of TP Rate, Random Forest-without feature selection-oversampling model is the highest at 94.70%.
Table 9 presents precision of models, and it is seen that Random Forest-without feature selection-oversampling model and Random Forest-T test-oversampling model have highest values at 92.50%. Tables 10 and 11 indicate that Random Forest-without feature selection-oversampling model outperforms all other models in terms of the G-measure and ROC curve, relatively.
Another finding of the study is that the Bagging classifier is the second best classifier among all other classifiers in terms of overall accuracy, G-measure, and ROC curve. It is clear that Random Forest and Bagging classifiers, which are known as ensemble methods, have better performance than other classifiers in financial accounting fraud detection.
Each financial ratio may have different impact on fraudulent financial statements. This study have used two different feature selection methods in order to determine the financial ratios with the greatest impact on fraudulent financial statements. Different financial ratios have been selected by two methods (as can be seen in Table 5). However, the results show that feature selection methods couldn't improve the performances of the machine learning classifiers for the dataset considered for this study. Due to the consideration of characteristics of different datasets making each financial ratio with certain impacts on detection of financial accounting fraud.
Oversampling technique (SMOTE) mostly produce better TP rates, Precision, G-measure, and ROC curve than other sampling techniques (“without sampling” and “undersampling”) for all the classifiers. In addition, SMOTE increases the overall accuracy of Random Forest classifier. However, SMOTE and undersampling technique reduce the performances of other classifiers in terms of overall accuracy and TN rate.
5. CONCLUSION
Since the role of SMEs in the global economy is vital, more researches should focus on financial accounting fraud detection for SMEs. This study considers class imbalance problem because considered dataset comprises 1384 cases with nonfraudulent class and 321 cases with fraudulent class. In order to mitigate class imbalance problem, sampling methods are employed. Sampling methods are highly recommended with provision of more insights for detecting financial accounting fraud. Hence, for future studies, SMOTE method is highly recommended to deal with imbalanced problems.
The results of this study show that Random Forest and Bagging classifiers, which are known as ensemble methods, have better performance than other classifiers in financial accounting fraud detection for SMEs. Especially, Random Forest-without feature selection-oversampling model outperforms all other models. It is also found that feature selection methods couldn't improve the performances of the machine learning classifiers. Another finding of the study is that SMOTE as oversampling method generally improves the performance of all the classifiers in terms of TP rates, Precision, G-measure, and ROC curve. It has to be emphasized that SMOTE increases the overall accuracy of Random Forest classifier.
Ensemble methods improve the classification accuracy of class-imbalanced data. Random Forest, which is known as an ensemble method, outperforms all other classifiers in this study. However, it has to be taken into account that different classifiers may give better results for different datasets. Since the performance of all classifiers depends on the dataset at hand, it is has to be emphasized that random forest may or may not be effective for different datasets. Other machine learning techniques rather than random forest may be effective for different datasets in detection of financial accounting fraud.
For further directions, proposition of different fraud risk indicators can be considered. In addition, different feature selection methods can be utilized in order to determine the fraud risk indicators with the greatest impact on fraudulent financial statements.
CONFLICTS OF INTEREST
The authors declare no potential conflicts of interest to disclose.
AUTHORS' CONTRIBUTIONS
Conceptualization and research topic, Ozlem Senvar; literature search, Serhan Hamal and Ozlem Senvar; writing—original draft preparation, Serhan Hamal; writing—review and editing, Ozlem Senvar.
ACKNOWLEDGMENTS
Corresponding author Ozlem Senvar (Assoc. Prof. at Marmara University) would like to express appreciations to Mete Turkyilmaz (Finance Director and Controller) and Can Tansel Kaya (Assoc. Prof. at Yeditepe University) for introducing topics of financial accounting and auditing along with fraudulent financial statements.
REFERENCES
Cite this article
TY  - JOUR
AU  - Serhan Hamal
AU  - Ozlem Senvar
PY  - 2021
DA  - 2021/02/10
TI  - Comparing performances and effectiveness of machine learning classifiers in detecting financial accounting fraud for Turkish SMEs
JO  - International Journal of Computational Intelligence Systems
SP  - 769
EP  - 782
VL  - 14
IS  - 1
SN  - 1875-6883
UR  - https://doi.org/10.2991/ijcis.d.210203.007
DO  - 10.2991/ijcis.d.210203.007
ID  - Hamal2021
ER  -