
A Doctor Recommendation Based on Graph Computing and LDA Topic Model
 , Huixiang Xiong1
- DOI
- 10.2991/ijcis.d.210205.002How to use a DOI?
- Keywords
- Doctor recommendation; LDA topic model; Eigenvector centrality; Graph computing; Word2vec
- Abstract
Doctor recommendation technology can help patients filter out large number of irrelevant doctors and find doctors who meet their actual needs quickly and accurately, helping patients gain access to helpful personalized online healthcare services. To address the problems with the existing recommendation methods, this paper proposes a hybrid doctor recommendation model based on online healthcare platform, which utilizes the word2vec model, latent Dirichlet allocation (LDA) topic model, and other methods to find doctors who best suit patients' needs with the information obtained from consultations between doctors and patients. Then, the model treats these doctors as nodes in order to construct a doctor tag cooccurrence network and recommends the most important doctors in the network via an eigenvector centrality calculation model on the graph. This method identifies the important nodes in the entire effective doctor network to support the recommendation from a new graph computing perspective. An experiment conducted on the Chinese healthcare website
Chunyuyisheng.com proves that the proposed method a good recommendation performance.- Copyright
- © 2021 The Authors. Published by Atlantis Press B.V.
- Open Access
- This is an open access article distributed under the CC BY-NC 4.0 license (http://creativecommons.org/licenses/by-nc/4.0/).
1. INTRODUCTION
The rapid development of Internet and information technology has made accessing healthcare information on the Internet increasingly convenient for patients [1]. In China, the emergence of healthcare websites enables users to find doctors through the Internet, participate in online consultations, and obtain treatment advice in recent years. Such applications simplify the medical treatment process, save time, and reduce the information asymmetry between doctors and patients [2]. In particular, the role of online healthcare websites was underscored during the COVID-19 [3] outbreak in early 2020. A large number of patients have chosen the online consultation service of healthcare websites during the epidemic. This service can decrease the gathering of patients in the hospital, reduce the risk of cross-infection, and alleviate the pressure of hospital admissions. The general process by which patients seek medical treatment in a healthcare websites is as follows: patients accessing a healthcare website generally select a corresponding hospital, department, and disease category based on their personal experience; then, they select a doctor by looking at doctor information for their specific disease category. However, there are some problems in this process. First, due to the explosive growth of online medical resource information, it is extremely time consuming for users to check doctors' pages individually according to the hierarchical hospital/department/disease relationship. Second, users do not necessarily have the corresponding medical expertise to make decisions, and not all of them are confident about which disease they have or which department their symptoms are associated with. For example, suppose a patient has a cough or headache, but is unaware of the precise problem or which department to consult. To address the above problems, doctor recommendations can be regarded as an effective solution. Using personalized recommendation technology, users can find the doctors that best meet their needs and filter out a large number of irrelevant doctors. In other words, doctor recommendation technology improve both users' online medical consultation experiences and the service quality of healthcare websites.
Recommendation systems have been widely applied in fields such as e-commerce, books, pictures, and films [4], and they are gradually gaining traction in the field of Internet healthcare. In healthcare domain research, scholars have employed a variety of techniques and methods to solve similar problems. Zaman and Li [5] proposed a recommendation system based on semantic web technology and medical social networking to speed up patient recovery and improve the healthcare effect. Huang et al. [6] proposed a collaboration-based medical knowledge recommendation approach to suggest information of interest to clinicians. This method generates a clinician trust profile based on a measure of implicit trust factors from clinicians' past ratings of knowledge items and integrates it into a collaborative filtering algorithm to improve the quality of medical knowledge recommendations. Kim et al. [7] proposed a context-aware model by integrating context-aware technology into a collaborative filtering algorithm to make recommendations based on the patient's personal situation and individual health condition; this recommendation method was applied to menu services in ubiquitous healthcare services. Chen et al. [8] proposed a disease diagnosis and treatment recommendation system and recommended appropriate diagnosis and treatment options to patients and inexperienced physicians. Schaferet al. [9] evaluated the effectiveness of recommendation systems in the medical field, investigated the progress of recommendation systems in finding appropriate healthcare and medical assistance interventions, and analyzed the future prospects and corresponding challenges of recommendation systems in the medical field.
An important part of doctor recommended research is finding online users with a particular health problem who are similar to the prospective patient; these similar patients can serve as an important basis for making doctor recommendations. The patent proposed by Blue and OPTUM [10] suggest ways to find similar patients to patient X. The recommendations were generated for similar top-ranked patients. The proposed system are also used to recommend treatments based on a patient's symptoms. Ceyhan et al. [11] proposed an algorithm that recommends medical tests based on an analysis of the patient's symptoms and anamneses. Huang et al. [12] proposed a doctor recommendation algorithm based on a doctor performances model and a patient preferences model to help patients schedule an appointment effectively. The algorithm established the doctor performance model using the analytic hierarchy process and included patient preference characteristics in the model to alleviate the problem of doctor information overload and alleviate appointment imbalances on the Shanghai Medical League Appointment Platform. Makowski et al. [13] proposed a decision-making algorithm for doctor to assist in clinical practice and provide treatment advice in emergency care. Yang et al. [2] proposed a doctor recommendation method based on a systematic decision support model that considered patient preferences and comments. The experiment found that the method performed with regard to coverage and diversity indicators by conducting empirical studies on medical websites. However, users' comments are relatively subjective, and their emotional ratings or evaluations may not be reliable. In addition, the variations in the design quality of evaluation modules among websites in practical applications fail to clearly reflect the evaluation accuracy.
Some prior research has been conducted on doctor recommendation systems. Waqar et al. [1] proposed a hybrid doctor recommendation system that combined content base, collaborative filtering, demographic filtering, and other recommendation methods that effectively improved the accuracy of doctor recommendation. However, this method requires users to submit additional interactive data. A doctor recommendation system proposed by Narducci et al. [14] can find patients similar to target patients by matching the semantic relationship between patients' symptoms and prospective treatments and can then recommend doctors who received high ratings from the similar patients. However, how patients evaluate a particular doctor has not been mentioned. The recommender system presented by Salunke and Kasar [15] generates recommendations based on user ratings. The proposed method used natural language processing and user ratings to construct a doctor profiler. However, which specific types of factors affected patients' ratings for doctors was not reported. Guo et al. [16] proposed a doctor recommender system to identify key opinion leaders. The proposed approach used coauthorship and citation relation data to identify doctors who are experts in a particular disease. This system has already been applied to a Chinese Internet technology site, and patients using the system can find leading experts in various diseases. However, this method requires large amounts of specialized external data.
Doctor recommendations are special and differ from traditional recommendation scenarios, such as electronic commerce or book recommendations. The privacy feedback and historical data of patients who consult on the healthcare website may not offer any help in making a recommendation. Therefore, the traditional recommendation methods for determining user preferences based on historical behavior data are not feasible for doctor recommendation systems, that is why doctor recommendation systems require more targeted recommendation strategies. Only limited work has been conducted in the doctor recommendation domain. The existing strategies for doctor recommendations can be divided into two categories: static recommendations, such as the algorithm proposed by Guo et al. [16], which essentially gives doctors a stable authoritative ranking and then recommends doctors to patients based on that ranking, and dynamic recommendations, such as the algorithm proposed by Yang et al. [2], that uses patient preferences to provide them with personalized recommendations. The existing research methods have the following shortcomings: (1) static doctor recommendations cannot be personalized to match the user's personal preference; (2) textual information that records the consultations between doctors and patients and reflects a great amount of semantic information is ignored; (3) the existing research has focused on recommendation technology but rely on recommendation strategy concepts that are relatively simple and that are not comprehensive; (4) the importance of the recommended doctors within their professional networks fails to be considered.
In response to the above problems, a hybrid doctor recommendation algorithm is designed which uses natural language processing, machine learning, topic mining, and other technologies to analyze the consultation textual information between doctors and patients in order to find a group of doctors suitable for the patients' symptoms and conditions. With the help of graph theory and doctor tags, a doctor tag cooccurrence network is constructed and functions to recommend the most important doctor in the network to the patients through a graph computing model. This study explored doctors who are suitable and hold important positions in the doctor network from the new perspective of graph computing. The main contributions of this research are as follows:
This paper proposed a doctor recommendation method based on online healthcare platform. This approach, via graph computing model, considered recommendations from a new perspective: ranking doctors according to their importance in their network.
The proposed algorithm uses consulting textual information between doctors and patients that are ignored in the existing algorithms, uses the latent Dirichlet allocation (LDA) topic model to find hidden topics in large volumes of data consisting of actual consultations, and then finds similar doctors based on the hidden topic. This approach helps to substantially reduce the data dimension, improve the retrieval efficiency, and mine the relationships of doctors from a semantic level.
We construct a doctor tag cooccurrence network using data from real healthcare websites. The network reflects the similar relationships between all of the doctors suitable for the target patient, based on the disease of the doctors' expertise. The construction process, which is based on graph theory and tag cooccurrence knowledge, demonstrates the feasibility of locating the suitable doctors in the doctor network.
The proposed recommend model does not require official external medical data but only requires the textual data of user questions; no user history or additional data is required as input; thus, it is simple and easy to use.
2. PRELIMINARIES
2.1. Eigenvector Centrality of Graph
A graph consists a set of a number of given nodes and a set of edges that connect two nodes. Graphs can be used to describe relationships between objects: the nodes represent the objects, and the edges represent the relationships between objects. In mathematics, a graph can be described as
Undirected weighted graph.
In this study, the goal is to construct a doctor network based on the cooccurrence of doctor labels. A doctor network can be represented by a graph structure. We take doctors as the nodes in the graph and the relationships between doctors and other doctors as the edges in the graph. To recommend suitable doctors to patients, it is necessary to find the important nodes in the doctor network. One measure of the important nodes in the network is network centrality. From the perspective of individual actions, the node centrality indicators that reflect the status and influence of nodes in the network include degree centrality, closeness centrality, betweenness centrality, and eigenvector centrality. Degree centrality refers to the sum of the direct connections between a node and other nodes in the network, this value reflects the importance of a node's position in the cooperative network. Betweenness centrality calculates the number of shortest paths passing through a node, which indicates the node's ability to control the communication and transmission of information throughout the entire network. Closeness centrality is the reciprocal of the sum of the distances from a certain node to all other nodes; it reflects the closeness of a node's connections with other nodes and its influence on other nodes. Eigenvector centrality calculates the importance of a node depending on the number of neighboring nodes and their importance. In contrast to the centrality of eigenvectors, the degree, betweenness, and closeness centralities are defined only for classically simple graphs with strict binary relations between their nodes. In addition, compared with graph theory measures such as degree, betweenness, and closeness centralities, eigenvector centrality has the advantage that it can be used for valued graphs.
Eigenvector centrality was first introduced by Bonacich [17,18]. The eigenvector centrality of a node is proportional to the sum of the centralities of the nodes to which it is connected. A graphG(N, E) consists of nodes N and edges E. A is the adjacency matrix for this graph;
A variant of eigenvector centrality is a central part of Google's PageRank algorithm [20], which is used to evaluate the relevance of web pages based on the idea that web pages referenced by a large number of high-quality web pages are themselves considered high quality. Based on this thought, we can use eigenvector centrality to evaluate the importance and authority of a node in a weighted graph.
2.2. LDA Topic Model
The LDA model [21] is a document-level probabilistic model with unsupervised machine learning, and it is the most popular method used for topic modeling [22]. Topic modeling assumes that a document is a random mixture of topics. Each topic can be regarded as a specific probability distribution of words. By using the topic model, hidden topics can be found in textual data, and the potential semantic relationships between documents can be explored. The LDA algorithm simultaneously estimates topics and assigns topic weights to each document based on the cooccurrences of words in a large corpus. The LDA algorithm can significantly reduce the data dimensionality of large-scale documents, thereby facilitating the extraction of potential subject terms containing various aspects and opinions.
The LDA modeling process can be described as finding a mixture of topics for each resource, i.e., P(z|d), where each topic is described by terms following another probability distribution, i.e., P(t|z). This can be formalized as shown in [23]
In this paper, the LDA topic model is applied to the doctor recommendation algorithm to find the hidden topics in the answering documents of doctors and then searching for similar doctors in the specific topic.
2.3. Word2vec
Word2vec is a neural network-based model developed by Mikolov and other researchers at Google. It represents words in corpus as a vector with contextual comprehension [24]. Word2vec can turn words into a low-dimensional real number vector, each dimension of which represents a potential word feature, it distributes the different syntactic and semantic characteristics of the word to each of its dimensions. Word2vec can process large text corpora and generates a vector space model in which words share common contexts in the corpus. In the vector space, the closer two vectors are, the greater the similarity between the two words. The word2vec results depend on two user-defined parameters: the dimensionality of the vector representation (m) and the maximum distance between a word and the words around the word in a sentence (δ).
Two different approaches exist for word2vec, called the skip-gram and the continuous bag of words (CBOW). The skip-gram model predicts surrounding words by inputting the reference word, while the CBOW model predicts the current word by using the surrounding context words.
3. PROPOSED METHODOLOGY
3.1. Outline of the Doctor Recommendation Model
Figure 2 shows the doctor recommendation model proposed in this paper, which consists of four modules. The first module (Section 3.2) generates a candidate set of recommended doctors. After finding consulting questions similar to the target patient's consulting question through similarity calculations, the doctors who answered those similar questions are regarded as recommendation candidates and are placed into a candidate set of recommended doctors, noted as A. In this module, the similarity calculation between consulting questions is based on the word2vec model. Module 2 (Section 3.3) expands the doctor recommendation set A to doctor recommendation set B. This module identifies the topics that doctors are good at answering from archived doctor answers through the LDA topic model, it identifies doctors with similar diagnosis and treatment experience from the specific topic. Finally, it joins these similar doctors into candidate set B. Module 3 (Section 3.4) uses the doctors in set B as nodes to construct a doctor tag cooccurrence network. The final module (Section 3.5) firstly calculates the eigenvector centrality of each node in the doctor label cooccurrence network, then ranks the nodes by fusing the supporting information of doctors' professional level, finally recommends the top-n doctors in the ranking.
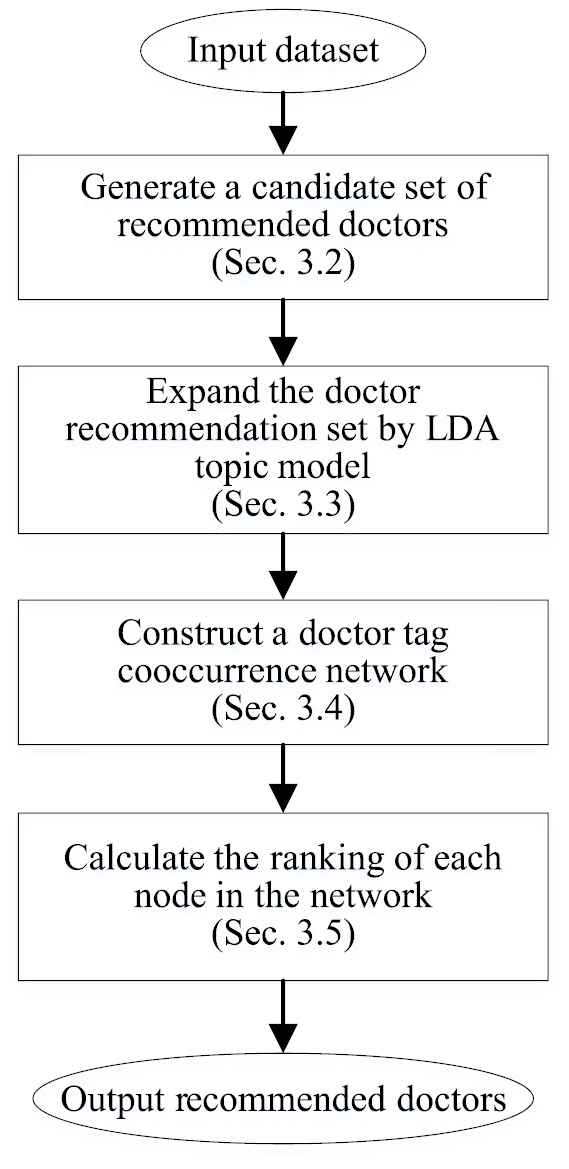
The structure of the doctor recommender model.
3.2. Generating a Candidate Set of Recommended Doctors
Because many doctors exist, we first want to identify the doctors who best fit the patient's condition to build a candidate set of recommended doctors. This task involves finding patients similar to the target patient and then adding the doctors consulted by these similar patients to the candidate set of recommended doctors, denoted as set A. The specific steps are as follows:
Step 1: Vectorize the consulting question texts of all patients based on the word2vec model. First the question text for each patient is transformed into a feature word set composed of n words by word segmentation. Then, the vector of each keyword in the consulting question is calculated by the word2vec model, and finally, the sum of these word vectors is averaged to represent the final vector of the consulting question text.
Step 2: Calculate the similarity between the vectors of consulting question texts for the target patient and all other patients using cosine similarity. The consulting question texts most similar to those of the target patient are obtained.
Cosine similarity [25] is one of the simplest and most effective vector similarity calculation methods. The cosine similarity calculation between vector a and vector b is shown in Eq. (3).
where n is the dimensionality of vectors a and b, and ai and bi are the vector values of a and b, respectively, in each dimension.Step 3: Add the doctor who answered the consulting question similar to that of the target patient to doctor set A.
3.3. Extension of the Doctor Set Based on the LDA Topic Model
To find additional doctors who might be suitable for treating a patient's disease, we hope to find doctors who have similar professions among the doctors in doctor set A. Here, we conduct LDA topic model training on the diagnosis texts of all doctors to find n hidden topics, which represent n categories of diseases. Each candidate doctor belongs to 1 or n hidden topics. The hidden topic model is shown in Figure 3. We find doctors with similar diagnosis and treatment experience for the candidate doctor in the same topic, then, we join these similar doctors into doctor set B, thereby expanding the candidate set of recommended doctors. The specific algorithm steps are as follows:
Step 1: Using LDA topic model training, a document-topic distribution is generated for each doctor's answering text. The answering texts of all doctors are used as the LDA training corpus.
Step 2: Find the topic for each candidate doctor in set A through the document-topic distribution obtained in the previous step based on the assumption that the topic with the largest probability distribution can be used as the topic of a given answering text.
Step 3: For each doctor in set A, the other answering texts in the doctor's topic that is most similar to the doctor's answering text can be found by calculating the similarity of the document-topic distributions.
Step 4: Add the answering doctors of these similar answering texts to candidate doctor set B.
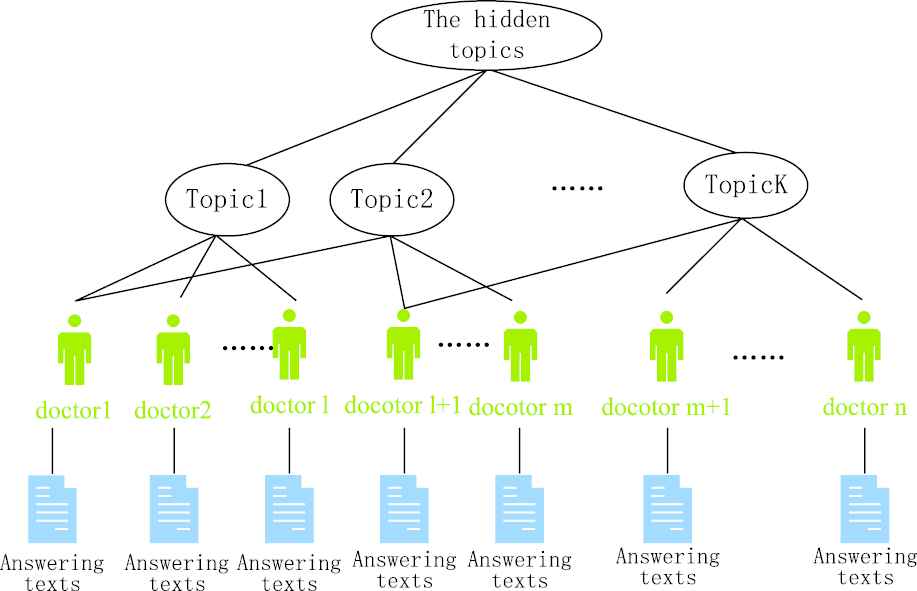
The hidden topic model.
The similarity calculation for the document-topic distribution vector utilizes the Kullback–Leibler (KL) divergence [26], also known as relative entropy, as a way to quantify the difference between two probability distributions. The KL divergence formula for two distributions (P and Q) is shown in Eq. (4):
However, KL divergence cannot be used as a distance measurement because it's not symmetrical; that is, the calculated values of
To facilitate the similarity calculation, the JS divergence value needs to be converted. The conversion formula is as follows:
Compared with calculating the similarity of all texts singly, the LDA topic model can effectively identify doctors who are good at diagnosis and treatment of similar diseases from the semantic level, greatly reducing the scale and time cost of finding similar doctors.
3.4. Construction of a Cooccurrence Network of Doctor Labels
In most current Chinese healthcare websites, each doctor is assigned several labels that reflect his or her consultation scope. These labels reflect the diseases or disease symptoms that a doctor is good at treating. Therefore, we use these doctor tags to build a doctor tag cooccurrence network that better reflects the relationships and commonality between doctors in their profession.
To construct the doctor tag cooccurrence network, first, the doctors in the recommended candidate lists obtained in the previous step are taken as the nodes of the graph. When the labels of two doctors have a cooccurrence relationship, an edge is drawn between those two doctor nodes. Finally, when two doctor nodes have an edge, the weight of that edge is measured by the Jaccard similarity coefficient of the labels of the two doctors.
The Jaccard similarity coefficient is used to compare the similarity and difference between limited sample sets. The larger the Jaccard coefficient value is, the higher the sample similarity. The Jaccard similarity coefficients for sets A and B are calculated as follows:
3.5. Doctor Recommendation Based on Graph Computing
3.5.1. Computing of the eigenvector centrality
All the nodes in the doctor network constructed above represent the found doctors that should be suitable for the target patient's condition. All these doctors have some professional experience for treating the target patient—but among so many doctors, which should be the ones preferentially recommended to the patient? This paper makes recommendations from the perspective of importance node in the doctor network. Because the importance of the nodes in a weighted graph can be measured by eigenvector centrality, we calculate the eigenvector centrality of each node in the doctor network and generate the recommender list based on eigenvector centrality order, as shown in Eq.(1). The constructed doctor network is an undirected weighted graph, A is the adjacency matrix for this graph, aij is the value of columns i and j in A, and
3.5.2. Computing of final ranking
In the previous step, we got the weights of the doctor nodes by calculating the centralities of the eigenvectors of each node in the doctor network. In order to represent the professional level of doctor better, the weights of doctors' nodes are adjusted by integrating 5 indicators, namely doctors' professional titles, number of consultation, praise rates, peer evaluations, and patient recognition, then generating a new doctor ranking. The data of these 5 indicators of all doctors in the data set are first normalized, then factor analysis [28] is performed. The final comprehensive factor α of each doctor is calculated by weighted summing the characteristic values of each factor. Donating α as the adjustment parameter of the doctor node. The final weight of each doctor node in the network is shown in Eq. (8):
4. EVALUATION: A CASE STUDY
This section presents a case study to validate the proposed doctor recommendation method using the data from a healthcare website:
4.1. Description of Dataset
The dataset includes 15315 consultation textual information between doctors and their patients. In the dataset, a specific patient consulting text (i.e., a question) corresponds to a specific patient, the corresponding doctor's answering text, as well as the corresponding doctor who answered this consulting question. Among the 15315 consultation information, 138 doctors are represented from 15 different departments. Our case study dataset includes several fields such as patient number, patient name, patient question, doctor answer, doctor name, doctor labels, and disease. For example, one record (1, Liu, department of gastroenterology, “What is going on when there is blood in the stool?,” “you should check it with an anal mirror, hemorrhoids are most likely.” Wang, “indigestion, stomach ache, gastroenteritis,” hematochezia) selected from the dataset. In this record, “1” is a patient number, “Liu” is a patient name, “department of gastroenterology” is a clinical department, “What is going on when there is blood in the stool?” is Liu's question, “you should check it with an anal mirror, hemorrhoids are most likely.” is a doctor's answer, “Wang” is the name of the doctor who answered the question, and “indigestion, stomach ache, gastroenteritis” are Wang's labels, and “hematochezia” is the disease category of the consulting question.
Our dataset also contains the 138 doctors' assessment informations, such as doctors' professional titles, number of consultation, praise rates, peer evaluations, and patient recognition.
Because the textual information directly obtained from the website are relatively crude, data preprocessing is necessary. First, synonymous disease names should be replaced with specific terms from the medical field. Second, Chinese word segmentation [29] should be performed on the question-and-answer text. This paper uses the Jieba package in Python to perform Chinese word segmentation. Finally, to identify professional medical vocabulary during word segmentation processing, we employ the Chinese medical thesaurus of Sogou Input [30].
Additionally, we trained the word2vec model from the training corpus containing 160191 consultation records collected from various healthcare websites to support the text vectorization.
4.2. Experiment
We selected a specific patient (No. 1) from the dataset and made a doctor recommendation to view the performance of the recommended method proposed in this paper.
We vectorized the target patient's question and all the patient questions in the dataset and calculated the similarity between the vectors of questions of the target patient those of and other patients. The calculation result is shown in Table 1.
| No. | Ques.# | Similarity | Doctor.# |
|---|---|---|---|
| 1 | 4256 | 1 | 52 |
| 2 | 5481 | 0.9131 | 79 |
| 3 | 2076 | 0.9131 | 79 |
| 4 | 9970 | 0.9131 | 45 |
| 5 | 13889 | 0.9131 | 79 |
| 6 | 9918 | 0.8970 | 91 |
| 7 | 6677 | 0.8970 | 91 |
| 8 | 9980 | 0.8970 | 91 |
| 9 | 1933 | 0.8970 | 91 |
| 10 | 4766 | 0.8925 | 71 |
Similarity of the target patient.
The doctors who answered similar questions of target patient and whose similarity in top 10, are added to candidate doctor set A. Therefore, the doctors in set A are 52,79,45,91,71.
The LDA topic model is trained using all doctors' answers in the dataset. Setting topics = 10 and iterations = 500, the high-frequency words (top 10) in the topic-word distribution of each topic are shown in Table 2. The document-topic distribution generated by LDA is shown in Table 3.
| Topic | 10 Top Topic Words |
|---|---|
| 1 | Menstruation, pregnancy, contraceptive, exclusion, bleeding, B-ultrasound, miscarriage, ectopic pregnancy, postponement, ovulation |
| 2 | Vaginitis, vagina, medication, leucorrhea, intercourse, vulva, mycotic, inflammation, symptoms, cleaning |
| 3 | Infection, surgery, treatment, impact, time, recovery, foreskin, edema, wound, medication |
| 4 | Reexamination, nodules, color ultrasound, surgery, regular reexamination, thyroid, observation, breast hyperplasia, thyroid function, pain |
| 5 | lithiasis, prostatitis, urine routine, symptoms, urinary tract infection, medication, drink water, food, prostate, masturbation |
| 6 | Anus, hemorrhoids, topical, stool, oral, sitz bath, food, surgery, maintenance, effect, |
| 7 | Cervix, bleeding, review, menstruation, B-ultrasound, observation, inflammation, clean, uterus, ultrasound |
| 8 | Symptoms, heart, electrocardiogram, anxiety, premature beats, coronary heart disease, mood, tension, exclusion, exercise |
| 9 | Symptoms, tuberculosis, cold, cough, infection, inflammation, medication, asthma, hepatitis B, lung function |
| 10 | Blood pressure, control, medication, taking medicine, treatment, diet, blood glucose, hypertension, adjustment, exercise |
Topic words.
| Ques.# | Topic1 | Topic2 | Topic3 | …… | Topic10 |
|---|---|---|---|---|---|
| 1 | 0.0029 | 0.0029 | 0.0029 | …… | 0.0029 |
| 2 | 0.0019 | 0.0212 | 0.2712 | …… | 0.0212 |
| 3 | 0.0059 | 0.0059 | 0.0647 | …… | 0.0059 |
| 4 | 0.0053 | 0.9526 | 0.0053 | …… | 0.0053 |
| 5 | 0.1550 | 0.5550 | 0.0050 | …… | 0.0050 |
| 6 | 0.5400 | 0.0067 | 0.0067 | …… | 0.0067 |
| 7 | 0.0024 | 0.5738 | 0.0024 | …… | 0.0024 |
| 8 | 0.0029 | 0.9735 | 0.0029 | …… | 0.0029 |
| 9 | 0.0050 | 0.4050 | 0.2550 | …… | 0.0050 |
| 10 | 0.0488 | 0.0023 | 0.0023 | …… | 0.0023 |
| …… | …… | …… | …… | …… | …… |
Distribution of document topic.
The answers of each doctor in set A are categorized into a specific topic by the document-topic distribution. For example, for the No. 52 doctor in set A, the document-topic distribution shows that his corresponding No. 4256 answer belongs to topic 7. Therefore, the JS similarity between No. 52 doctor and other doctors' answering texts in topic 7 is calculated by Eq. (6), and the resulting list of doctors similar to No. 52 doctor is shown in Table 4.
| No. | Ans. # | Similarity | Doctor. # |
|---|---|---|---|
| 1 | 4256 | 1 | 52 |
| 2 | 4128 | 0.999722 | 52 |
| 3 | 4244 | 0.999607 | 71 |
| 4 | 4085 | 0.99944 | 52 |
| 5 | 4061 | 0.9987 | 12 |
| 6 | 4350 | 0.998387 | 79 |
| 7 | 4170 | 0.998322 | 14 |
| 8 | 4513 | 0.997717 | 12 |
| 9 | 4378 | 0.997428 | 106 |
| 10 | 4495 | 0.997306 | 52 |
Similar doctors of No. 52 doctor.
We added the doctors whose similarity are top 10 to doctor candidate set B, and continued to find doctors similar to the rest doctors in set A using the algorithm in Section 3.3, added them all to set B. At last, we obtained 22 doctors in set B.
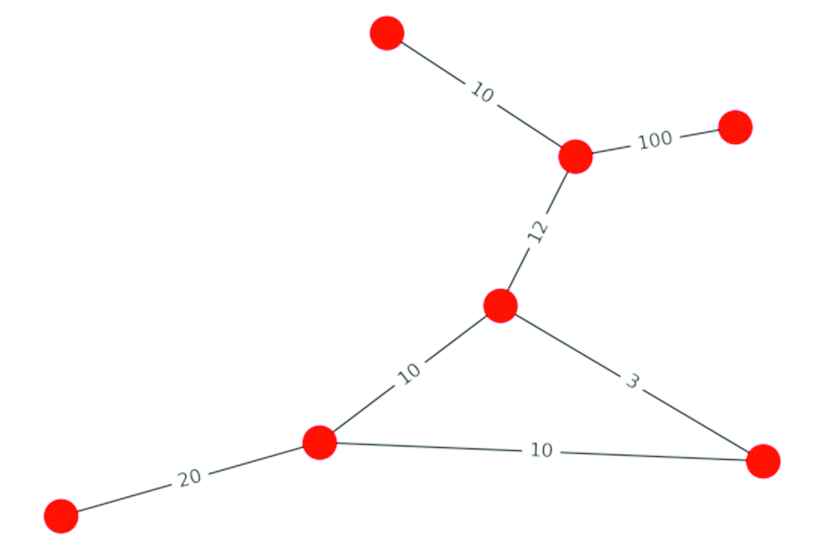
Using the final obtained doctors in set B we constructed the doctor network according to the algorithm in Section 4.4, as shown in Figure 4. Figure 5 shows the weight of each doctor's edge.
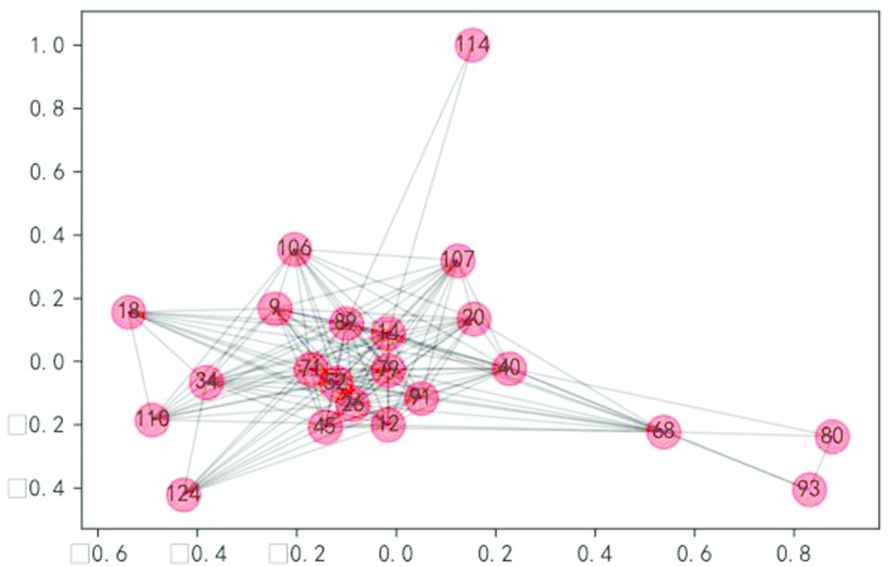
The doctor network.
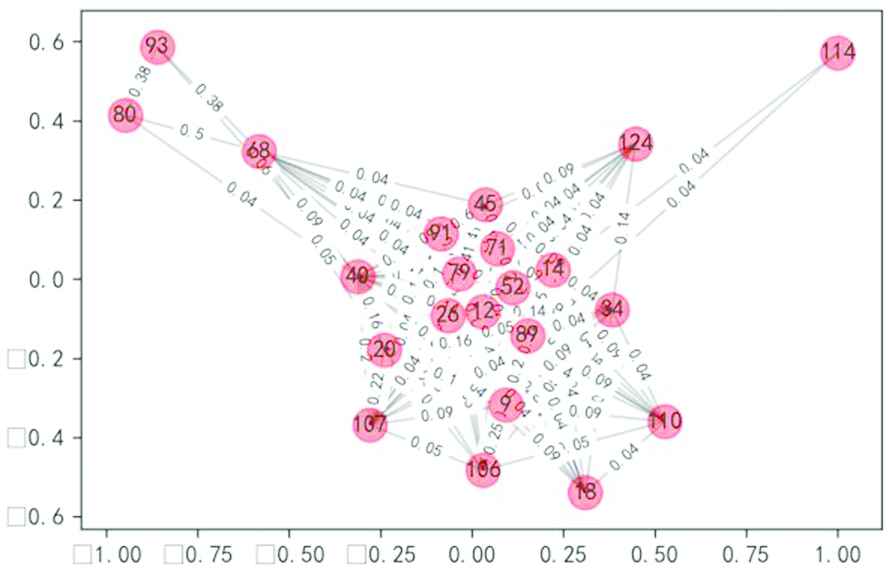
The weighted doctor network.
We calculated the eigenvector centrality value of each node in the constructed doctor label cooccurrence network, and sorted the values in descending order. The calculated eigenvector centrality list appears in Table 5. The final ranking was calculated after adjusting doctors' nodes by integrating indicators: Doctors' professional titles, number of consultation, praise rates, peer evaluations, and patient recognition. The final ranking list shown in Table 6.
| No. | Doctor.# | Eigenvector Centrality |
|---|---|---|
| 1 | 71 | 0.3706 |
| 2 | 52 | 0.3624 |
| 3 | 45 | 0.3392 |
| 4 | 12 | 0.3385 |
| 5 | 79 | 0.3364 |
| 6 | 91 | 0.3356 |
| 7 | 26 | 0.3309 |
| 8 | 14 | 0.2425 |
| 9 | 89 | 0.2361 |
| 10 | 9 | 0.1111 |
Eigenvector centrality list.
| No. | Doctor.# | Final Weight |
|---|---|---|
| 1 | 52 | 0.4991 |
| 2 | 26 | 0.4736 |
| 3 | 45 | 0.4698 |
| 4 | 14 | 0.4012 |
| 5 | 91 | 0.3908 |
| 6 | 12 | 0.3859 |
| 7 | 79 | 0.3837 |
| 8 | 71 | 0.3731 |
| 9 | 89 | 0.3231 |
| 10 | 110 | 0.2673 |
Final ranking list.
Finally, we recommended the top 10 doctors in the list to the target patient. In this case, the final recommended doctors are: LIU, HONG, LI, FU, WANG, FENG, SUN, NIE, WANG, YANG.
4.3. Results Analysis
In this experiment, we successfully recommended 10 doctors to the target patient. They all have rich experiences in treating cardiovascular diseases, obviously they can answer the questions of the target patient well. The first doctor on the recommended list is LIU.C, he is a chief physician and he has been a doctor for more than 30 years. Doctor LIU's labels are: Hypertension, colds, chest distress, diabetes, myocardial enzymes, heart disease, coronary heart disease, gastritis, premature beats, myocardial ischemia, expectoration. These labels reflect the diseases or symptoms that doctor LIU specializes in treating in the medical field. Doctor LIU's homepage shows that he have answered 21331 patient questions related to cardiovascular disease and he has good user feedback, that means he has strong professional experience in the cardiovasology treatment field. Specifically, LIU is the most important node among all the doctors in the constructed network, which is evaluated based on the eigenvector centrality of the doctor network and the doctors' professional level supporting data. Note that in our proposed recommendation model, each of the doctors in the constructed doctor network is professionally capable of diagnosing and treating the target patient; however, our goal is to recommend the most important doctors in this doctor network to patients.
5. DISCUSSION
Some traditional recommendation methods mostly used similarity comparison to rank doctors according to similarity calculation result; some methods used analytic hierarchy process to obtain the weights of doctor characteristics, and then ranked the doctors based on these weights; and some methods used doctor profiles and academic publications as the basis for ranking doctors, and recommendations are produced according to the ranking results. This paper recommends from the perspective of graph computing on the basis of similarity comparison. First, all suitable doctors for recommendation are found based on the comparison of consultation text similarity, then a doctor network is constructed using above doctors as nodes, and the doctor at the center position of the network is calculated. The labels of the found target doctor appear more frequently in the network. The recommended doctor, who's expertise has a strong connection with diseases that other doctors are good at, is the doctor who at the core of this network. In addition, this paper uses the LDA topic model to mine the question-and-answer information between doctors and patients from the consultation text, so that the doctors suitable for the patient's condition can be found more accurately. Among the existing evaluation methods of recommendation algorithms, the most widely used are accuracy, recall, and F-measure [31]. The three evaluation indicators are calculated as shown in formulas (9–11).
The performance of the proposed recommendation method was measured via the above three evaluation indicators. 10% records in the dataset are randomly selected as target patients and recommend to these patients with suitable doctors who came from different departments. The recommendation is judged to be correct if the disease classification of the patient's consultation question belongs to the disease that the recommended doctors excel in. Table 7 shows the evaluation results for the 5 representative departments and the last line represents the total evaluation result of all test data. Due to the different situations for the doctor recommendation methods, different application scenarios and the data sources vary greatly, there is no standard data set for testing and evaluation at present yet. Therefore, it should not be just a simple comparison of the evaluation values. Our experimental results are shown here for the reference of scholars.
| Department | Precision | Recall | F |
|---|---|---|---|
| Gynecology department | 0.91 | 0.33 | 0.48 |
| Infectious disease department | 0.98 | 0.36 | 0.53 |
| Respiratory medicine department | 0.91 | 0.60 | 0.72 |
| Nephrology department | 0.86 | 0.40 | 0.55 |
| Cardiovascular medicine department | 0.88 | 0.58 | 0.69 |
| All data | 0.90 | 0.42 | 0.57 |
Evaluation result.
As can be seen from the experimental results, the method proposed in this paper displays a high recommendation accuracy rate. However, due to the fact that just 10 doctors are recommended, the recall rate is relatively low. In general, the proposed method has a good recommendation effect.
6. CONCLUSIONS
Doctor recommendation can solve information overload problem that occurs on online healthcare platform. By filtering out large numbers of less relevant doctors, doctor recommendation helps users find the doctors that best meet their actual medical needs, and providing an intelligent personalized service. This paper presents a hybrid doctor recommendation model of that uses natural language processing, machine learning, and other methods to find a set of doctors capable of serving patients. The model uses these doctors as nodes to build a cooccurrence network based on doctors' associated labels. The most important doctors in the network are then recommended to the patients by calculating the eigenvector centrality of the network. The algorithm makes doctor recommendations from the new perspective of graph computing. The experiment using data from
DATA AVAILABILITY STATEMENT
All the data referred in this article will not be shared as there are some sensitive information (such as patients' healthy data, and doctors' real full name) in the dataset.
CONFLICTS OF INTEREST
None of the authors has any conflicts of interest or potential conflicts of interest.
AUTHORS' CONTRIBUTIONS
Qiuqing Meng contributed research ideas, conducted experiments, wrote and revised the paper. Huixiang Xiong contributed the research direction and made revise suggestions. All authors have agreed to the final version of the contribution.
ACKNOWLEDGMENTS
This work was supported by the National Social Science Foundation of China (19BTQ005); Scientific research projects Foundation of Financial and Economics of Guizhou University (2019XYB03).
REFERENCES
Cite this article
TY  - JOUR
AU  - Qiuqing Meng
AU  - Huixiang Xiong
PY  - 2021
DA  - 2021/02/12
TI  - A Doctor Recommendation Based on Graph Computing and LDA Topic Model
JO  - International Journal of Computational Intelligence Systems
SP  - 808
EP  - 817
VL  - 14
IS  - 1
SN  - 1875-6883
UR  - https://doi.org/10.2991/ijcis.d.210205.002
DO  - 10.2991/ijcis.d.210205.002
ID  - Meng2021
ER  -