
Wood Species Recognition with Small Data: A Deep Learning Approach

- DOI
- 10.2991/ijcis.d.210423.001How to use a DOI?
- Keywords
- Wood recognition; Transfer learning; Generalization performance; Feature extraction; ResNet50; Linear discriminant analysis; KNN
- Abstract
Wood species recognition is an important work in the wood trade and wood commercial activities. Although many recognition methods were presented in recent years, the existing wood species recognition methods mainly use shallow recognition models with low accuracy and are still unsatisfying for many real-world applications. Besides, their generalization ability is not strong. In this paper, a novel deep-learning-based wood species recognition method was proposed, which improved the accuracy and generalization greatly. The method uses 20X amplifying glass to acquire wood images, extracts the image features with ResNet50 neural network, refines the features with linear discriminant analysis (LDA), and recognizes the wood species with a KNN classifier. Our data was small, but we adopted transfer learning to improve our method. About 3000 wood images were used in our wood species recognition experiments and our method was executed in 25 rare wood species and the results showed our method had better generalization performance and accuracy. Compared with traditional deep learning our results were obtained from a small amount of data, which just confirmed the effectiveness of our method.
- Copyright
- © 2021 The Authors. Published by Atlantis Press B.V.
- Open Access
- This is an open access article distributed under the CC BY-NC 4.0 license (http://creativecommons.org/licenses/by-nc/4.0/).
1. INTRODUCTION
Wood species identification is an important work needed by most wood transaction activities, such as wood trad and wood import and export. It is used to evaluate the price of the wood in the trade, and check the wood at customs to monitor the wood smuggle and prevent the illegal wood trade, and it is helpful for plant protecting [1]
However, most of the experiment's data sets come from the microcopy glass. They are hard to be acquired because they need lots of preparation works, such as immersion and cutting which will take more than one week. Furthermore, the microcopy glass device is a delicate instrument that is not portable and cannot be used outside. In order to solve these difficulties, we attempt to find out a new method that can be adopted outside with 20X magnifying glass which is small and easy to carry.
The generalization performance is very important in the real application, but the accuracy in the cross-section validation method cannot indicate the generalization of the model. For example, our previous classification model [2] has a bad performance when be used to predict the new sample. In this work, half of the validation images that come from new wood samples which never used in the training data set will be used to verify the generalization capability of our method.
Convolutional neural network (CNN) is one of the most commonly used methods in object image classification. Deep learning belongs to machine learning and it needs large data sets, but this requirement is not easy to satisfy. The implementation of transfer learning can apply domain-specific models to multiple target domains, and it can promote the learning growth of target domain models. The transfer learning can reduce the amount and type of data required in the target area and it uses the prior information to optimize the model learning content. Transfer learning can transfer the knowledge learned in the case of sufficient data to a new environment with a small amount of data, and it can find the relationship between big data and small data, and transfer knowledge from big data to small data. Transfer learning has broad application space and prospects in a small data environment and intelligent terminal. Through the training and learning of image data (ImageNet data sets), we established a good deep learning framework and then transferred it to wood image recognition. In this way, we can realize the accurate identification of wood species based on the wood image in the case of a small amount of data.
2. PROBLEM DEFINITION AND RELATED WORK
The goal of wood species recognition is the automatic assignment of wood images to a fixed number of categories. Given the correct classification function that showed as formula (1).
Using a multi-classifier for these categories is a machine learning problem. Given a training samples Mn, defined as formula (2).
In such situations
The accuracy of the classification prediction criteria (h : X → Y) is defined as formula (4).
Namely the accuracy of h is probability of h(x) = f(x) and x is selected randomly.
At the end of the last century and the beginning of this century, the traditional identification work is slow and costly, and the experts need to find up many special features through using the microscope to identify the cross section of the wood [3]. These works are usually done by experts manually. Firstly, they need to collect the discrimination features of the wood, such as the arrangement of the vessel, the orientation of the pores, ray's parenchyma, fibers, and other information presented on the surface. Next, they will identify the species according to the standard of the wood species identification which defined by the IAWA list [4]. Unfortunately, these are time-consuming works and they probably take up more than one week.
In recent years, researchers attempt to improve the efficiency of wood identification. The wood image recognition methods are more and more based on computer algorithms instead of human work. A widely used technique to the problem of wood species recognition is using shallow recognition models based on texture features. Most computer-identification methods contain two important steps which are feature extraction and classification. The feature extraction methods contain border detection algorithm, Gray Level Co-occurrence Matrix [5,6], and color hist statistical method [7], etc. The classification methods contain support vector machine (SVM) [2,8], KNN [9–11], neural network [12–14], etc.
Silvana et al. presented a method using neural network and SIMCA to identify some Brazilian wood species and they used the principal component analysis (PCA) to extract the core feature data and a neural network to classify the wood species [15]. DUO Huayu used the SCN-MSE method to enhance the details of the digital image from Mongolica wood [16]. Zhao provided a robust wood species classification scheme by using color wood surface images [7], which can efficiently discriminate the intraspecific color and the interspecific color variation. Hangjun Wang et al. identified 8 wood species and the correct rate reached 86% in their experiments. They extracted the features from Mask Matching Image (MMI) by using a Fisher-Tree method and classified the species by SVM [17]. Kayoko et al. identified 8 Japanese wood species by using the tomography images [10]. They extracted 16 features and combined a k-nearest-neighbor classifier, and the accuracy reached 98% in experiments. But it is not very convenient because it uses the X-ray which is complicated and costly. Sun et al. compared 3 different image features of the wood image and classified 10 Chinese wood species [2]. In literature [18] 77 commercial Central-African timber species were tested a new classification model, and the accuracy was improved. The above methods have improved efficiency and accuracy to some extent. However, their generalization performance is not strong and the identification accuracy is low especially in new samples.
Deep CNNs achieve better than human level visual recognition accuracy, at the cost of high computational complexity. Due to the nonlinear nature of texture features, the researchers have paid attention to deep recognition models based on CNN. Deep learning can learn the representation features of raw data automatically and it has been widely recognized as the representative advances of machine learning or artificial intelligence in general nowadays. This can be attributed to the recent breakthroughs made by deep learning on a series of challenging applications. It can be seen from the literature that deep learning can improve the generalization ability of image recognition [19–21].
For a small data set, it is hard to train deep CNN models without a large amount of well-organized training data set like ImageNet with ten million annotated images. To deal with this challenge some researchers trained a deep CNN model on ImageNet and then applied the trained CNN model as the feature extractor to small data set by combining it with the transfer learning technique and they had obtained good results [22]. Motivated by this, at this time ResNet50 namely the depth of 50 residual convolutional layers is also a good choice for image recognition. Since ResNet50 has a very good performance on image classification [23], it can extract high-quality features of images.
3. OUR PROPOSED APPROACH
In this section, we propose a new and generalization approach to classify the wood species, as known as RLK (ResNet50, LDA, and KNN), based on the ResNet50 network, the LDA feature extraction method, and the KNN classifier.
As illustrated by Figure 1, the RLK contains three steps. The first step is image acquisition, in which we acquire the wood image using a 20X magnifying glass and crop the clear area of the image. The second step is feature extraction, in which we use a pretrained ResNet50 model to extract features, and then use the LDA method to reduce the dimension and refine the key features. The final step is classification, in which we train a KNN model to classify the wood species.
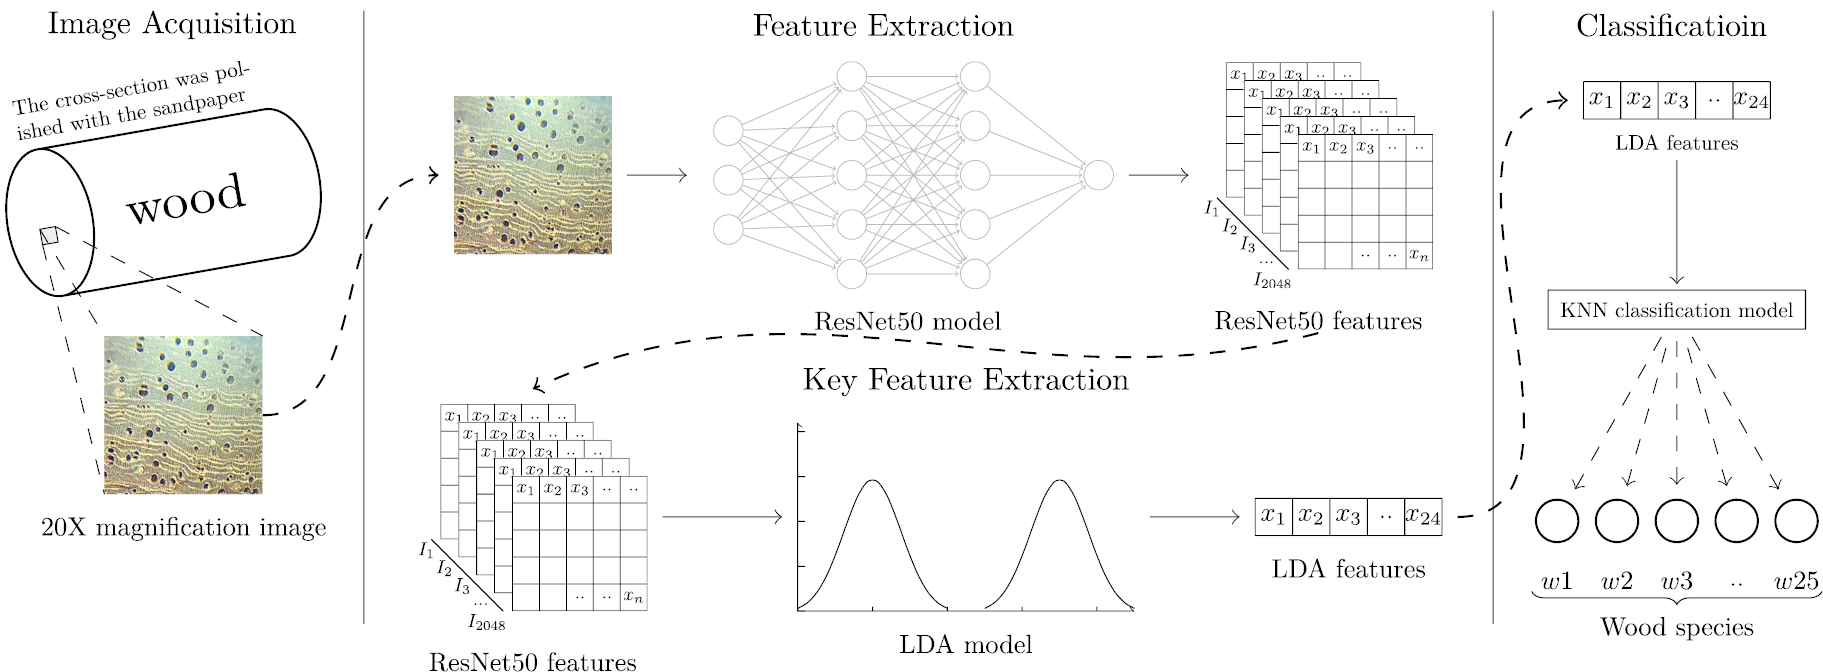
Overview of the proposed approach.
3.1. Image Acquisition
The woodblocks were cut by an electric moto saw, and flattened with sandpaper (400 grit, 800 grit, 1000 grit) one by one. Next, the surfaces are polished by the emery paper further. A mobile phone (model: OnePlus 3, China) was used to take the image through a 20X magnifying glass as Figure 1, and the original image size is 2048 × 1024 pixels. The middle area 300 × 300 pixels are cropped as the experiment materials because the middle area is more clear and less fuzzy than the other areas. The data set was separated into two parts, one for training the model and the other for testing. This testing is more effective than cross-validation testing because there are fewer cross-images from the same block between the test data set and the training data set.
3.2. Feature Extraction
Feature extraction is an important step in the image classification. Many deep neural networks are used to extract the features for wood recognition. In the experiment, we compared the five neural networks such as Inception-V3, Xception, VGG16, VGG19 ResNet50, and another method named LPQ. Although LPQ is not a kind of neural network, it got a good performance in the [18]. All the models using the pretrained weights to extract the wood image features, and some outputs from the neural network are too large to the classifier. Fox example the Inception-V3 output reached to 51200 dimensions.
Because CNN finally converts the input image into a small but deep feature map. The general method is to use a unified and relatively small kernel (e.g., VGG uses 3 * 3 as convolution kernel). But with the increase of network depth, the channel of output also increases (learning is becoming more and more complex). ResNet uses two basic blocks, one is identity block of which the input and output dimensions are the same and multiply identity blocks can be connected in series. Another basic block is conv block of which the input and output dimensions are different and these blocks can't be connected in series. Its purpose is to change the dimension of the eigenvector. Therefore, it is necessary to use conv block to transform image dimensions before entering identity block, so that identity block can be connected continuously later.
ResNet50 was chosen to execute transfer learning. ResNet50 is a residual deep learning network (with 50 layers), which attempts to address the problem of vanishing gradients that occur during back-propagation of CNN. The reason for choosing 50 layers is that although increasing the depth of the network can increase the accuracy of the network, as long as over-fitting is considered (in this case, the total number of layers is not over 50). The ResNet50 model were pretrained in ImageNet data sets. The features from the ResNet50 model contain some noise for recognizing the wood species because this pre-trained model is not for wood classification. Because we use the pretrained weights, and there are most features have few relations with wood recognition. So, we need to refine the useful key features for wood recognition further.
3.3. Key Feature Extraction
Key feature extraction methods mainly include linear discriminant analysis (LDA), PCA, principal component regression (PCR), partial least-squares regression (PLSR). In previous researches, LDA and PCA have better performance than the other methods [24–26]. Therefore, we compare LDA and PCA in our experiments to find the best key feature extraction method.
LDA [27] is a linear feature extracting method using Fisher's criterion (it works well when the data are linear separable) and it was used to reduce the redundant data of features. LDA has continuous independent variables and a categorical dependent variable, and it can execute feature selection namely sift the key variables which can best represent the data like PCA [19,20].
LDA is a traditional statistical technique that reduces dimensionality while preserving as much of the class discriminatory information as possible. For the purpose to reducing the data size and refining the key features, an LDA model was trained and used to extract the key features. The model can generate 24 a key feature sequence with 24 data.
3.4. Classification
The ResNet50's own classifier could not meet our requirements of classification. We adopted KNN classifier to replace the ResNet50's own classifier. K-nearest neighbor classifier (KNN) is simple to use and has little design time like finding k values in KNN classifier, hence these are suitable to work with dynamically varying data sets. Our proposed method uses the KNN classifier to classify the wood species, which is a supervised machine learning algorithm [28–30].
The parameter k = 1 was used because of its good application results in classifying wood species. SVC (C-Support Vector) is a kind of SVM method contained in the Sklearn library and default the parameters were used. RFC also contained in the Sklearn library and use the default parameters. Two efficient classification methods which are decision tree (DT) classifier and gradient boosting were compared in the experiments, these classifiers get a better result in the previous researches [31,32].
4. EXPERIMENTS
Our experiments use the Inception-V3, the VGG16, the VGG19, the Xception, and the ResNet50 to extract the features first, which are contained in a python library named Keras. The LPQ features algorithm comes from [33], and it extracts the key features using the LDA method. The performance is evaluated by the accuracy, precision, recall rate and the F1 score, and the generalization performance is evaluated by the difference of these four criteria indexes. For better performance, we also optimize the parameters of our proposed method.
4.1. Data Description
A total of 25 wood species were selected for training and testing as shown in Figure 2. The woodblocks of these species collected in two kinds of ways. Most of the woodblocks come from the wood factories in Yunnan Province, China, the others were obtained from the Wood Herbarium of Southwest Forestry University (SWFU). 120 images for each species were chosen, and over 3000 images for 25 species were obtained. We separate the wood images into two parts training data set and testing data set manually, the training data set has 2498 images and the testing data set has 502 images. The purpose is making sure that the testing data set has almost no cross with the training data set. The training data set is used to train the models in our proposed method, and the testing data set is used for testing.
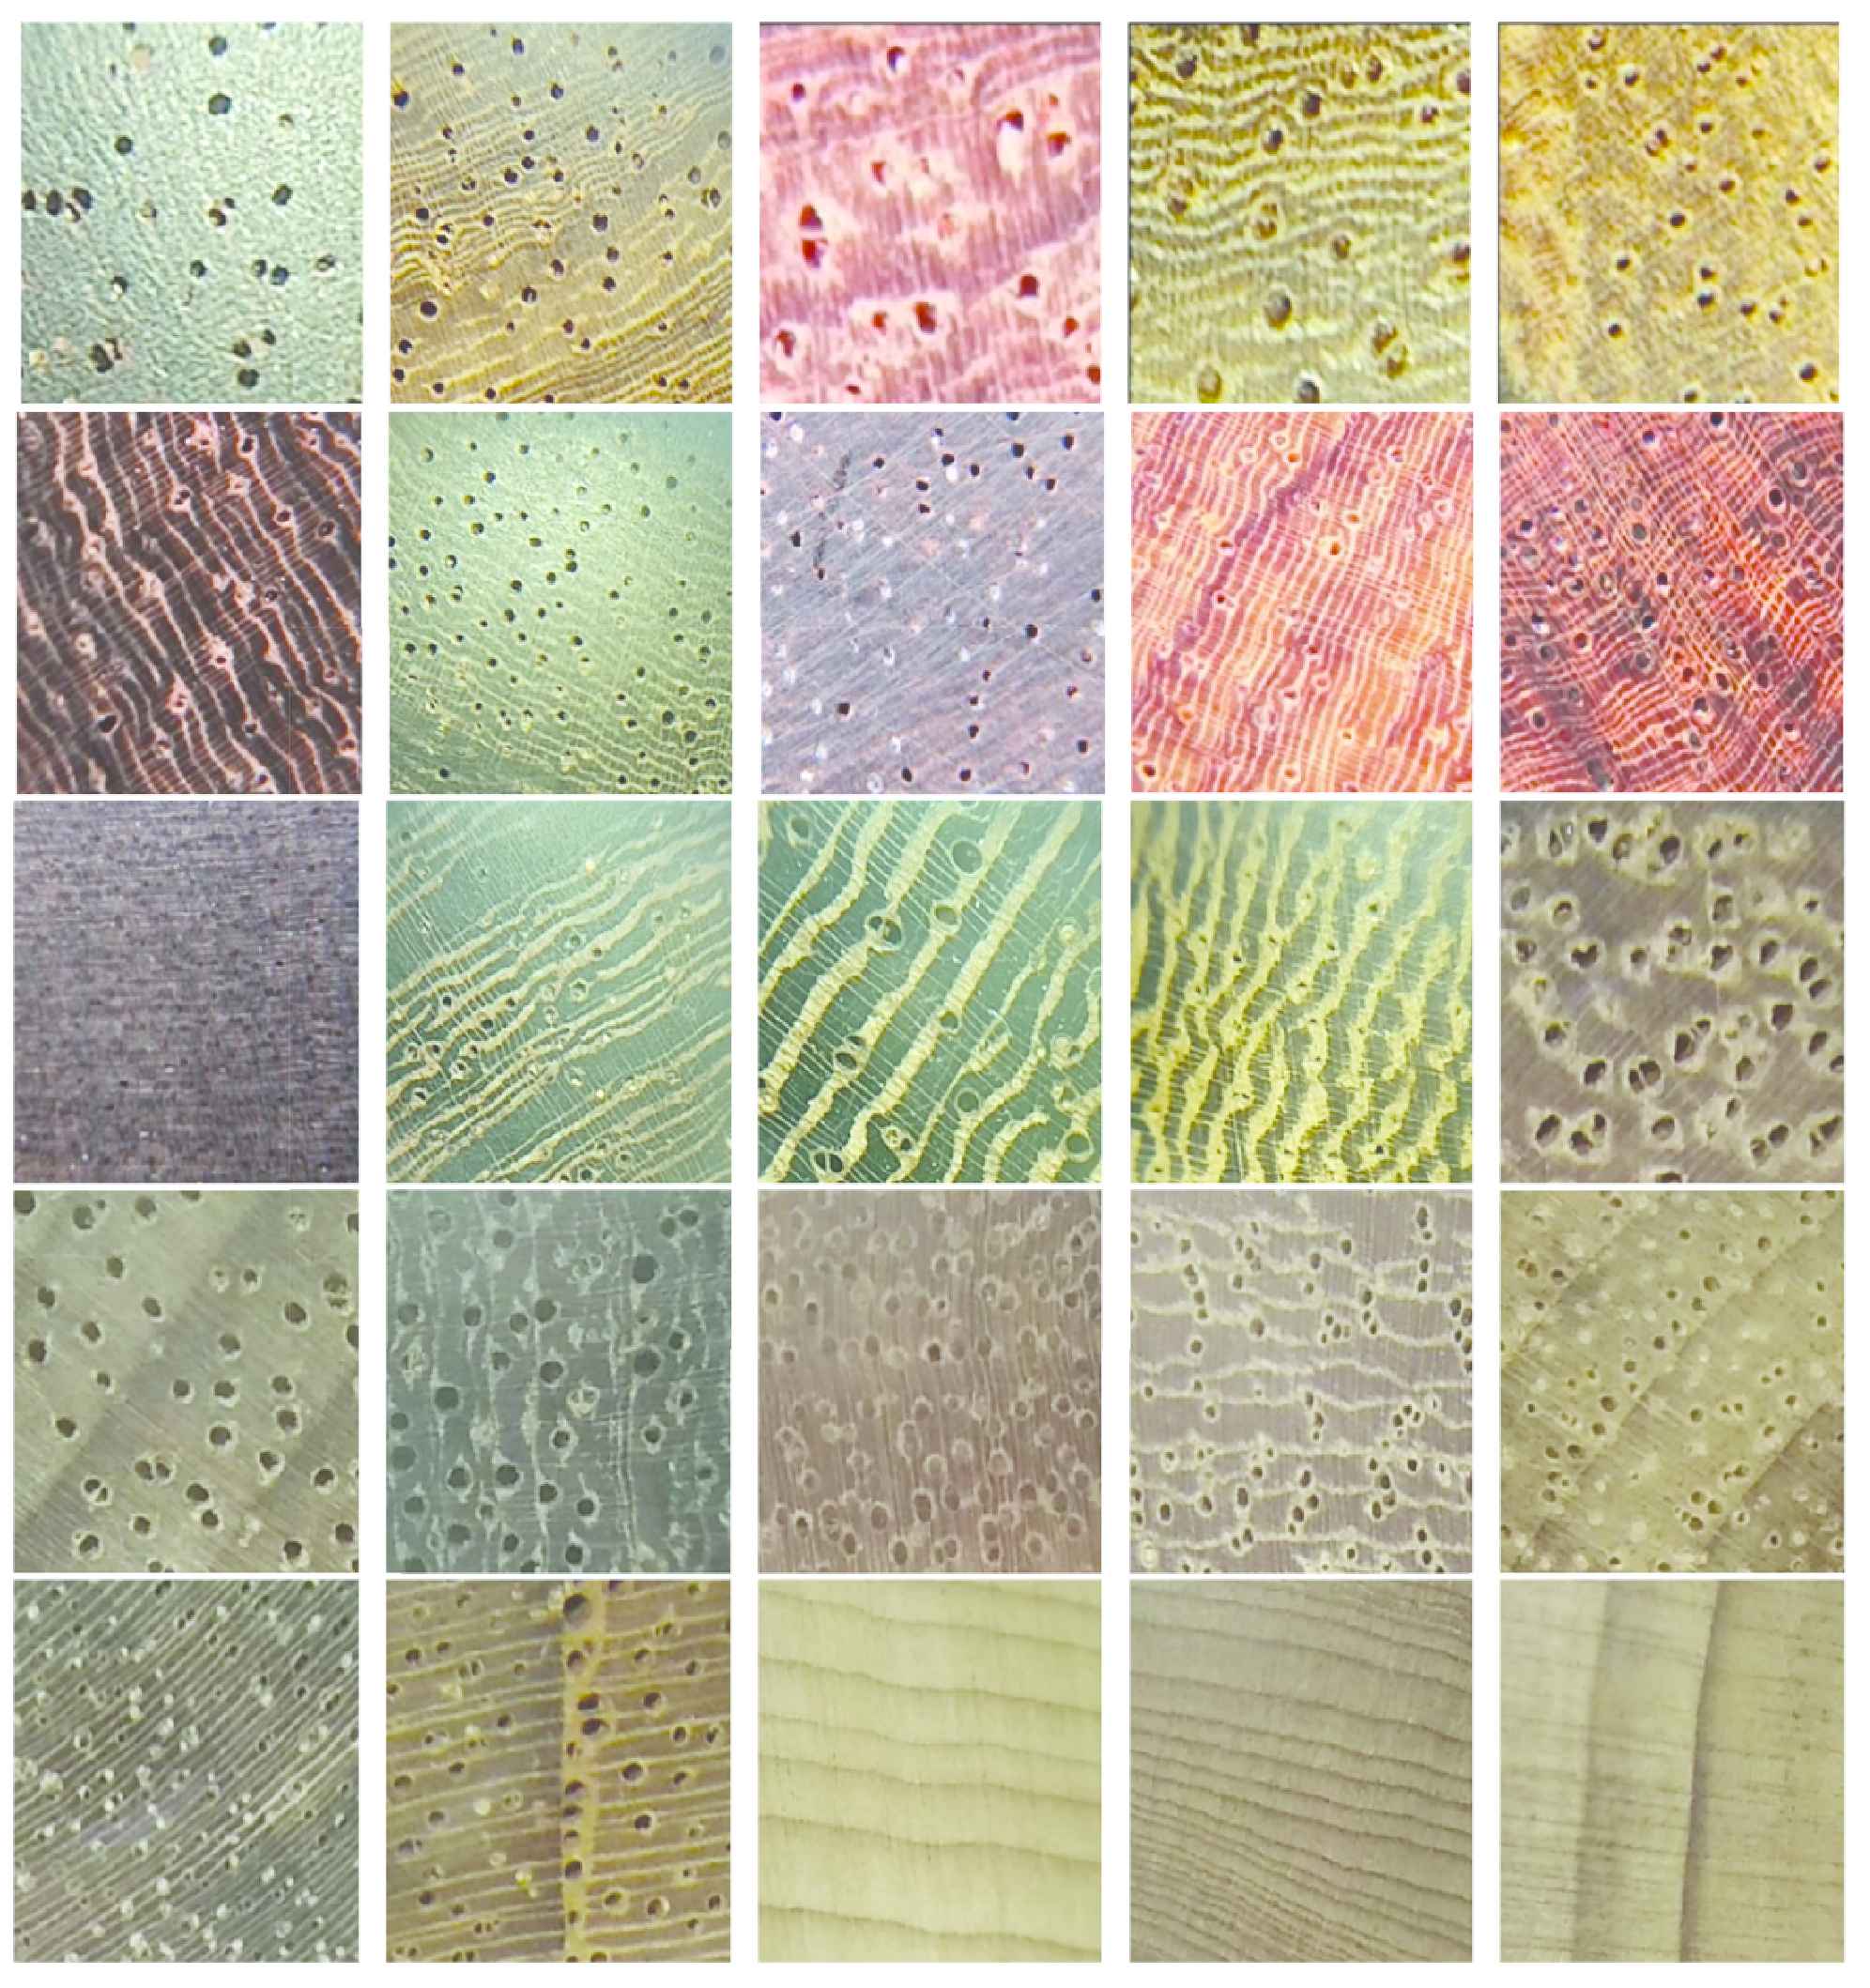
Examples of cross-section images of wood images from 20X magnifying glass. From left to right is Pterocarpus santalinus L.f., Pterocarpus indicus Willd., Pterocarpus macrocarpus Kurz, Pterocarpus erinaceus Poir., Dalbergia odorifera T.C. Chen, Dalbergia fusca Pierre, Dalbergia latifolia Roxb., Dalbergia cochinchinensis Pierre, Dalbergia oliveri Gamb., Dalbergin bariensis Pierre, Diospyros ebenum Koenig, Millettia leucantha Kurz (M. pendula Bak.), Millettia laurentii De Wild, Senna siamea (Lam.) H. S. Irwin et Barneby, Intsia.spp, Terminalia myriocarpa Vaniot Huerck et Muell.-Arg., Terminalia tomentosa, Xylia dolabriformis Benth., Mesua ferrea L., Cinnamomum camphorz (Linn) Presl, Excentrodendron hsienmu (Chun et How) H. T. Chang et R. H., Tectona grandis L. f., Torreya fargesii Franch. var. yunnanensis (C. Y. Cheng et L. K. Fu) N. Kang).
4.2. Evaluate Criteria
In the multi-classification algorithm, the accuracy, precision, recall rate, and F1 score are often used to evaluate the classification performance. However, these indexes cannot indicate the generalization performance, and we defined new criteria to evaluate the generalization performance as shown in formula
According to the formula (5), four difference was used in our experiments defined as formula (10).
The smaller DiffP, the more similar performance of the training data set and the testing data set. If the DiffP values are big, and these mean the testing performance is not good as the training performance. This time the model is over fitted and has bad generalization performance. The average data were computed in the results.
5. RESULTS AND DISCUSSIONS
We analyzed all the combinations of six feature-extract methods and three classifiers statistically. The results were summarized as Table 1 shown, in which the average of the accuracy, precision, recall rate, and F1 score which were statistics from the experiment results were listed in Table 1. All measurement metric results come from the cross-validation experiment method, and all the feature data were reduced by the LDA method before the classification step. The KNN classifier has better performance than other classifiers in different feature data.
| Classifier | Feature | Precision | Recall | F1 |
|---|---|---|---|---|
| InceptionV3 | 0.942 | 0.932 | 0.931 | |
| LPQ | 0.780 | 0.771 | 0.768 | |
| ResNet50 | 0.980 | 0.978 | 0.978 | |
| DT | VGG16 | 0.939 | 0.931 | 0.929 |
| VGG19 | 0.951 | 0.944 | 0.944 | |
| Xception | 0.939 | 0.932 | 0.930 | |
| InceptionV3 | 0.918 | 0.913 | 0.912 | |
| LPQ | 0.708 | 0.700 | 0.698 | |
| ResNet50 | 0.978 | 0.966 | 0.970 | |
| GB | VGG16 | 0.910 | 0.894 | 0.893 |
| VGG19 | 0.926 | 0.911 | 0.911 | |
| Xception | 0.916 | 0.907 | 0.906 | |
| InceptionV3 | 0.964 | 0.960 | 0.960 | |
| LPQ | 0.891 | 0.883 | 0.881 | |
| ResNet50 | 0.997 | 0.994 | 0.994 | |
| KNN | VGG16 | 0.964 | 0.962 | 0.961 |
| VGG19 | 0.976 | 0.973 | 0.973 | |
| Xception | 0.962 | 0.959 | 0.959 | |
| InceptionV3 | 0.955 | 0.950 | 0.949 | |
| LPQ | 0.806 | 0.796 | 0.796 | |
| ResNet50 | 0.989 | 0.989 | 0.989 | |
| RFC | VGG16 | 0.950 | 0.945 | 0.943 |
| VGG19 | 0.964 | 0.960 | 0.960 | |
| Xception | 0.946 | 0.942 | 0.940 | |
| InceptionV3 | 0.957 | 0.950 | 0.950 | |
| LPQ | 0.913 | 0.909 | 0.909 | |
| ResNet50 | 0.976 | 0.942 | 0.943 | |
| SVM | VGG16 | 0.961 | 0.949 | 0.949 |
| VGG19 | 0.968 | 0.949 | 0.953 | |
| Xception | 0.957 | 0.953 | 0.951 |
DT is the decision tree classifier, GB is the gradient boosting classifier, RFC is the random forest classifier.
Performance comparison of the KNN, the RFC, and the SVM classifiers.
Figure 3 shows the precision-recall (PR) performance of each feature extraction method in the testing data set. The area under the curve indicates the performance of each method, and the bigger area means the better recognition. Compared to these curves, it is clearly found that the best method which using the ResNet50 to extract the feature.
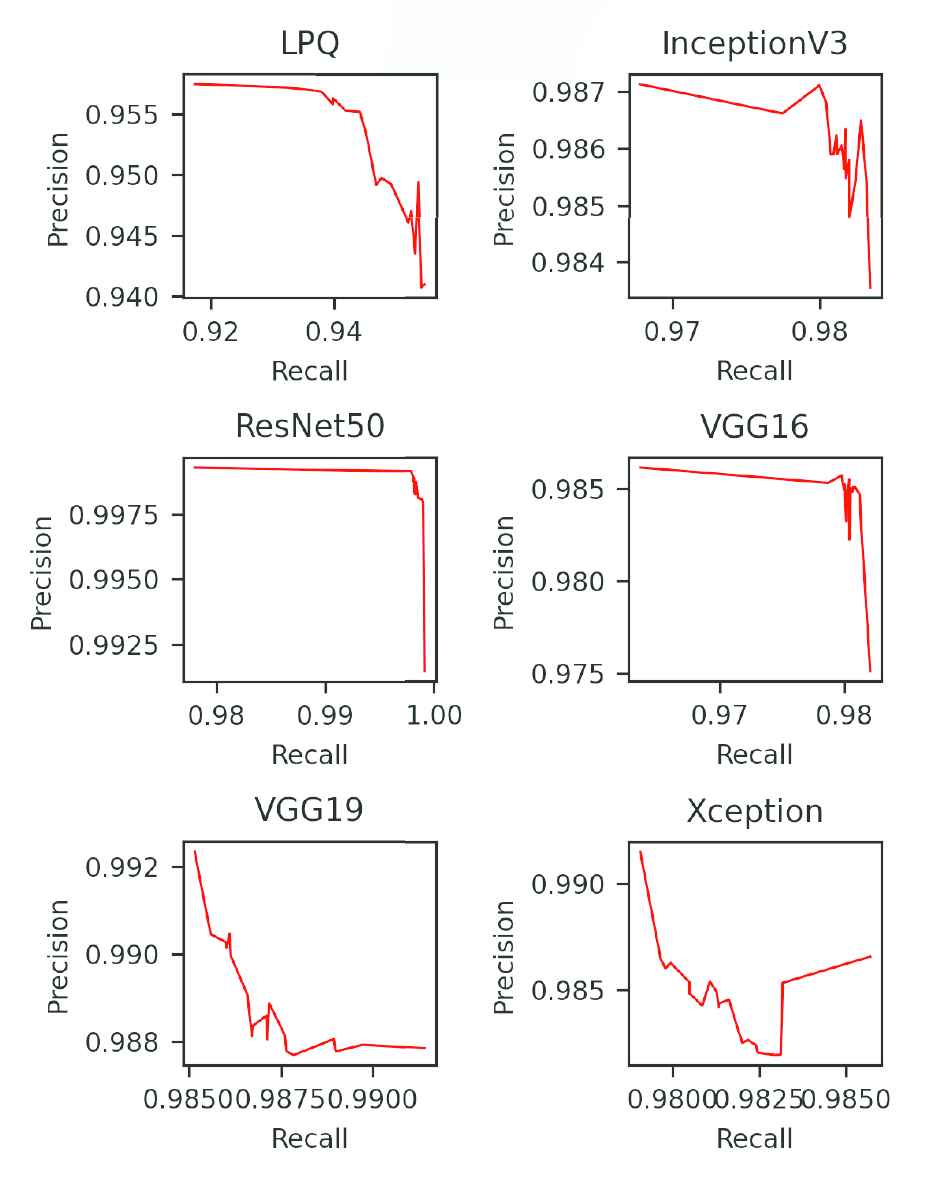
PR curves of each feature extraction method. The recall and precision come from different training.
The classifier influenced the recognition performance. Figure 4 illustrate the PR curves of each classifier, in which, the curve of the KNN method is smooth and has the biggest area under the line. By contrast, the curve of the RFC is not smooth and the area is smaller than that one the KNN has. The SVM classifier has high recall and precision, but the curve is not smooth, which means the accuracy is not stable. Moreover, the area under this curve is not the biggest among these classifiers. The curves of the gradient boosting classifier and DT classifier are below of KNN significantly, it means these two methods are not good as the KNN method. Therefore, the results show that ResNet50 has better accuracy and generalization.
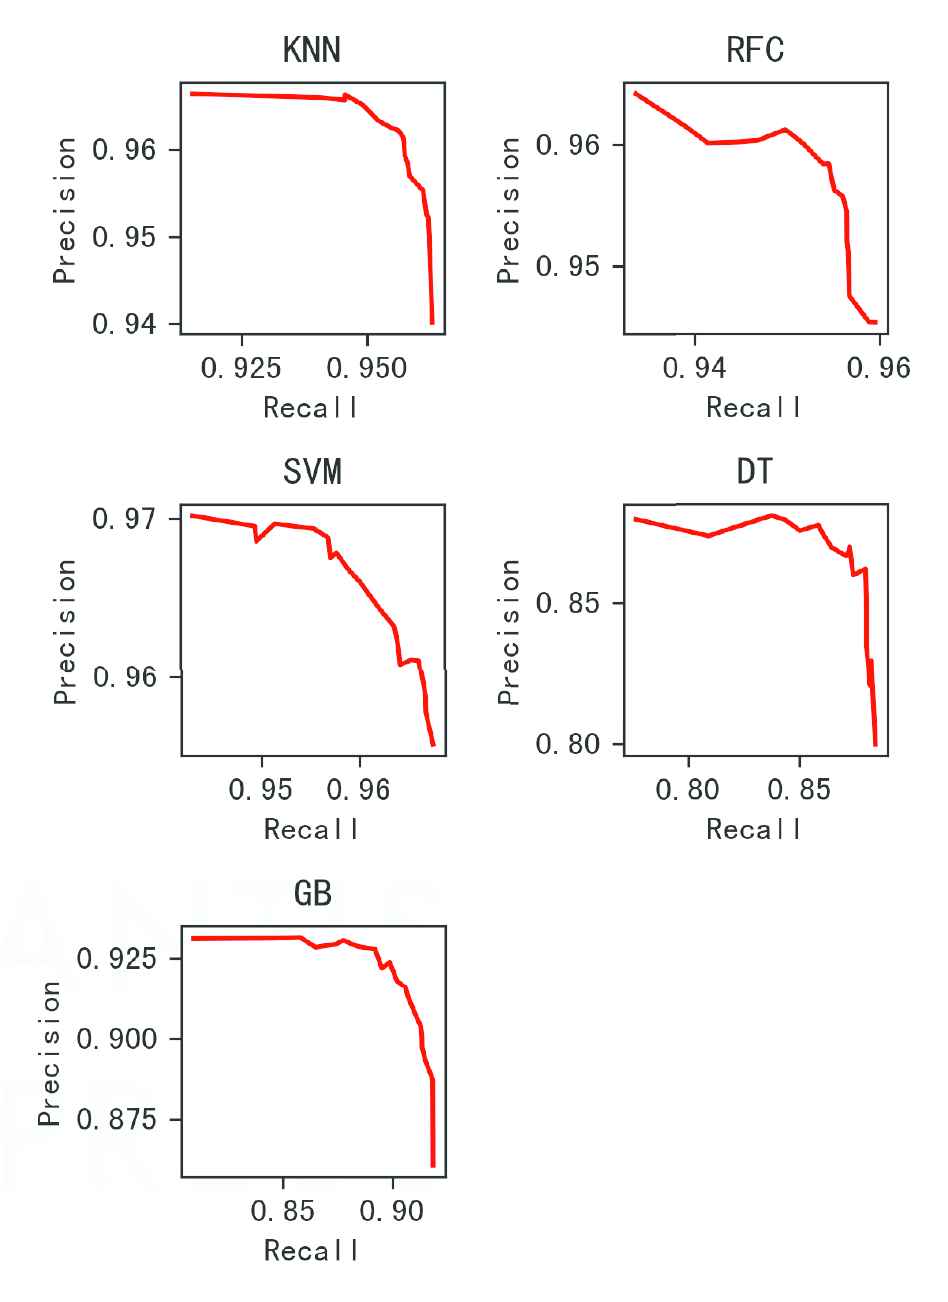
PR curves of each classification method. The average of the evaluate indexes with different classifiers. DT is the decision tree classifier, GB is the gradient boosting classifier, RFC is the random forest classifier.
We compared the all combination of the feature extraction and the classifiers, the results showed in Figure 5. The method based on the ResNet50 with KNN method has better performance in accuracy, recall, precision, and F1 score. The LPQ-based method has low F1 score than others, the biggest difference between them is that other methods belong to deep learning while the LPQ is a statistical method.
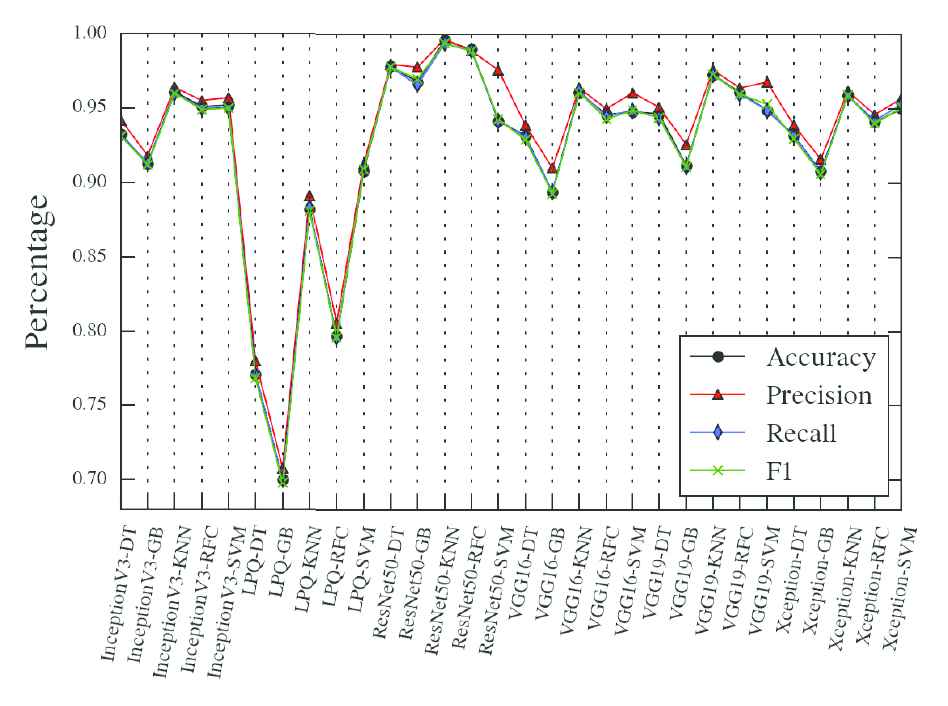
Accuracy compares between the training data set and the testing data set. The x-axis is the combination of the feature extraction and classifier. DT is the decision tree classifier, GB is the gradient boosting classifier, RFC is the random forest classifier.
The methods based on the deep learning have good performance in F1 score. The proper reason is that the deep learning models have better ability extracting abstract features from images.
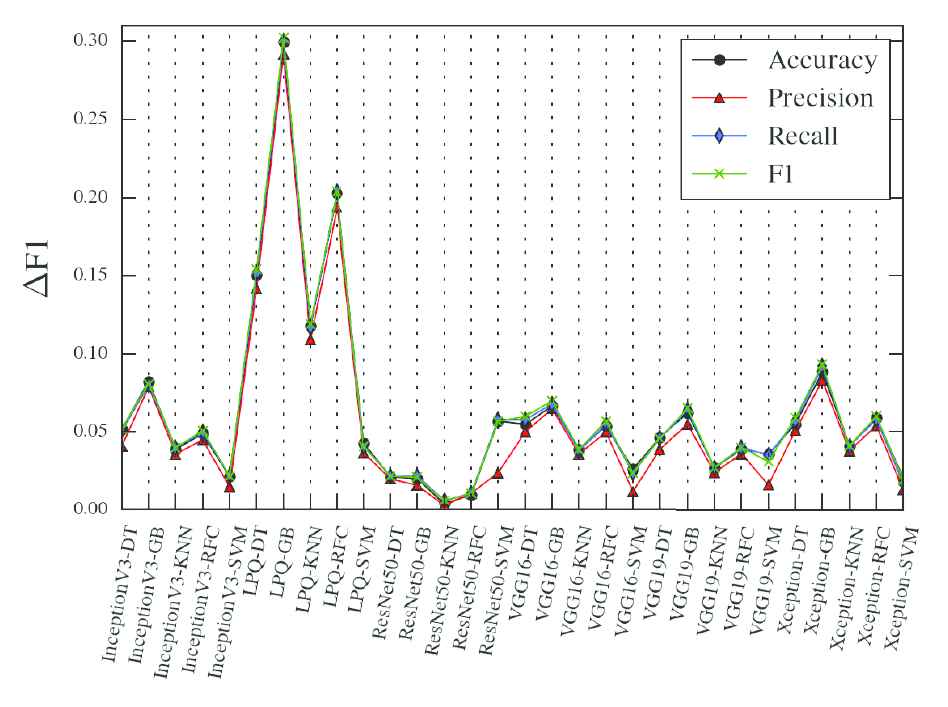
Generalization performance is an important criterion for the classification system. We calculate the difference of each criterion in the training data set and the testing data set, the result showed in Figure 6, in which, the lowest difference belongs to the ResNet50-KNN method, and it indicated that the method based on the ResNet50-KNN has the best generalization performance.
Precision compare between the training data set and the testing data set. The x-axis is the combination of the feature extraction and classifier. DT is the decision tree classifier, GB is the gradient boosting classifier, RFC is the random forest classifier.
Based on the analysis above, the method based on the ResNet50-KNN is the best one in our experiments. The images we used have not involved in the pretraining process, but the result is good. It informed that the deep learning models have better transfer ability. Our proposed model has good generalization performance because it has small difference between the training data set and the testing data set.
5.1. Parameter Studies
The accuracy of the KNN with different parameter K displayed in Figure 7, in which the green curve come from the training data set and the blue one come from the testing data set. The training accuracy decreased with the increase of the K, while the testing accuracy increased conversely.
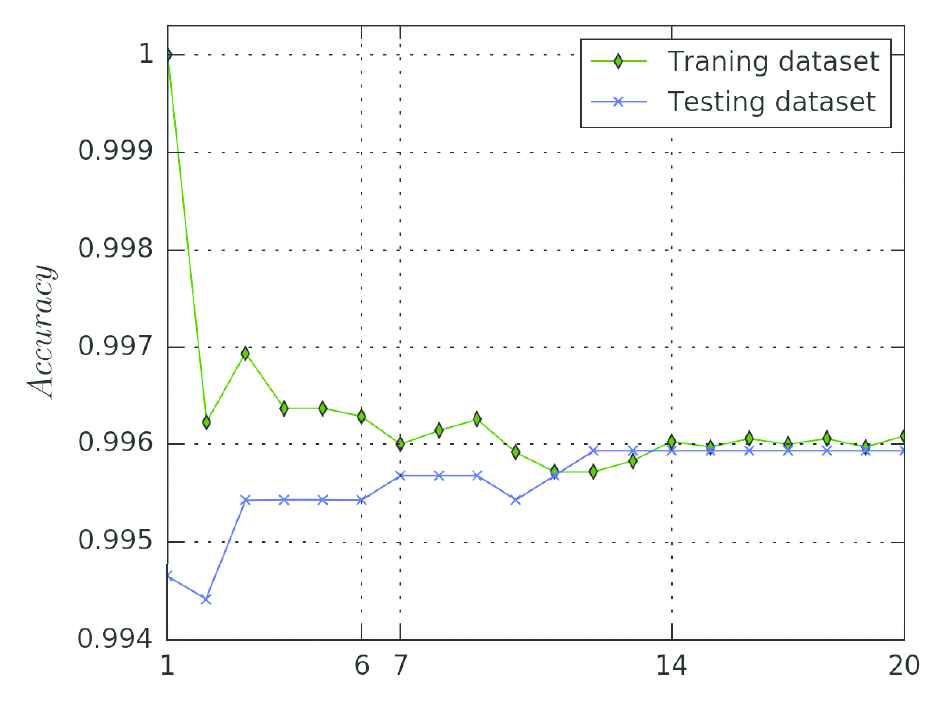
Accuracy compare in the training data set and the testing data set, the x-axis is the parameter K.
The difference between the training data set with the testing data set indicates the generalization performance. The best K for the generalization is what the testing curve close to the training curve at. When the K > = 14, the gap between these two lines is small, it means the difference is small. Considered the accuracy and the generalization, the best parameter is K = 14.
The difference of the accuracy is small when K > 14, it also means the model has better generalization ability. But the big K need more computing time. For saving the time-costing, the bigger K than 14 are not considered.
5.2. Comparison of the Complete Deep Learning Models
Normally, people use the transfer learning method to classify the images, e.g., Xiaoling used a transfer learning mode based on the Incetipn-V3 to classify the flowers, and the accuracy of the validation data set reached 98% [21]. But the complete deep learning models has not got good results in ours experiments. The deep learning models we employed using pretrained weights with the softmax classifier. We froze the weights and trained the classifier for 25 wood species.
The F1 scores of these deep learning models showed in Figure 8(a), in which, the highest F1 score is 0.92 when using the VGG16 transfer learning method. This result still below our proposed method.
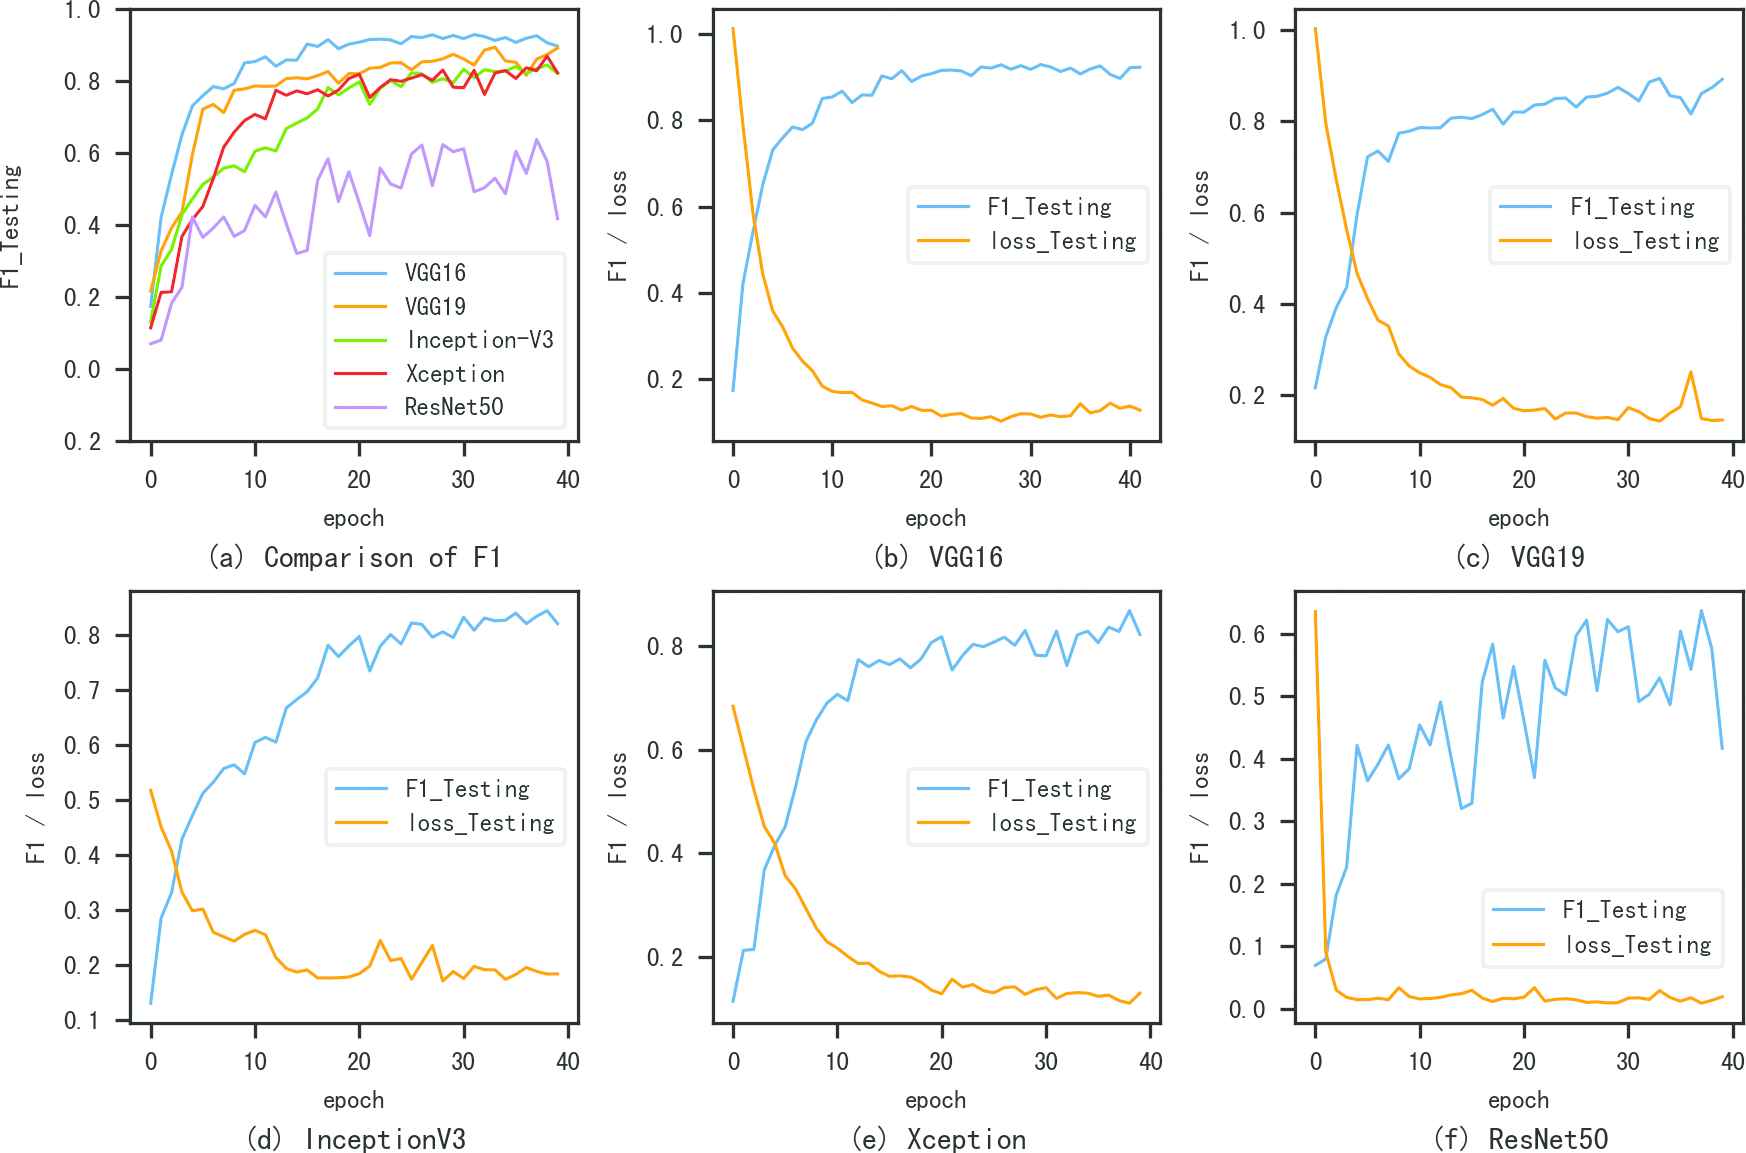
F1 score of the transfer learning methods. The x-axis is epoch, the y-axis is the F1 score/loss of the testing data set.
Figure 8(b)–8(f) illustrated the F1 score and loss of each method. The F1 score increased with the training epoch. These phenomenons also indicated that the deep learning models have the transferring ability. However, the F1 scores have significant fluctuation.
According to the F1 scores, the classifier results of the complete deep learning models were not as good as our proposed method.
5.3. Comparison of the Different Dimension Reduction Methods
The LDA method is a dimension reduce method which can extract the main features from the raw data. It is similar with the PCA method. These two methods are frequently used in the image classification.
An experiment designed to compare the LDA and PCA in wood image, the process worked as follows. First, used the pre-trained deep learning models to extract the raw data from images. Second, adopted the PCA and the LDA to reduce the dimension of the raw data. Finally, evaluated the performance of the PCA and LDA in different classifiers.
Figure 9 displayed the F1 scores of each method between the LDA and the PCA, and it clearly showed that the F1 score of the LDA was above the PCA. This informed the key features refined from the LDA was better than PCA when used to classify. Figure 10 is the F1 difference between the training data set and the testing data set, in which, the small difference ∆F means the better generalization performance.
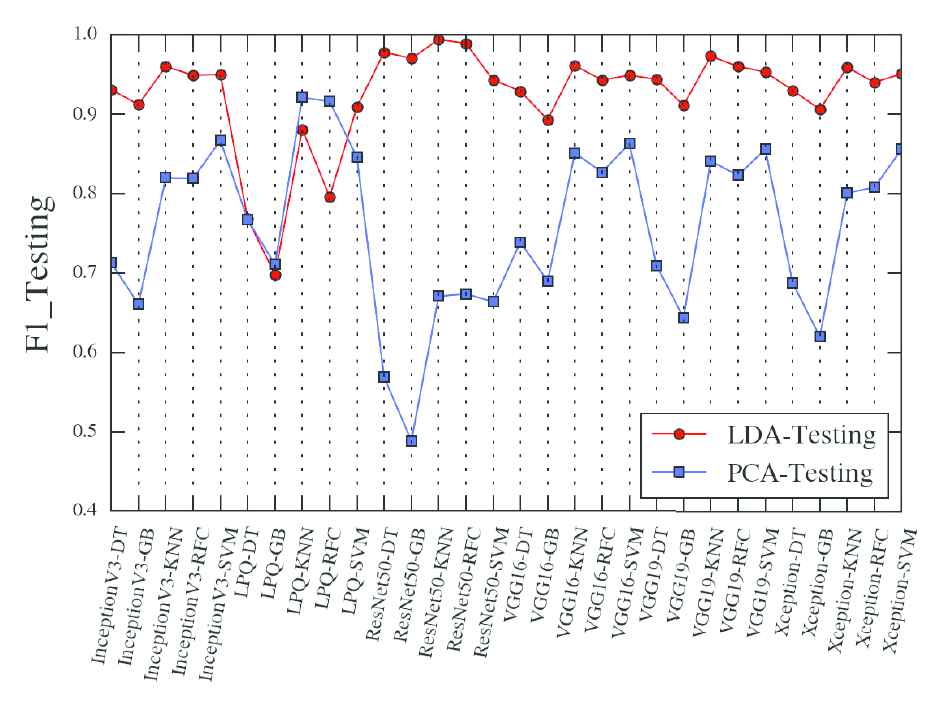
Comparison of the F1 on the testing data set when using LDA and PCA. The x-axis is the combination of the feature extraction and classifier. DT is the decision tree classifier, GB is the gradient boosting classifier, RFC is the random forest classifier.
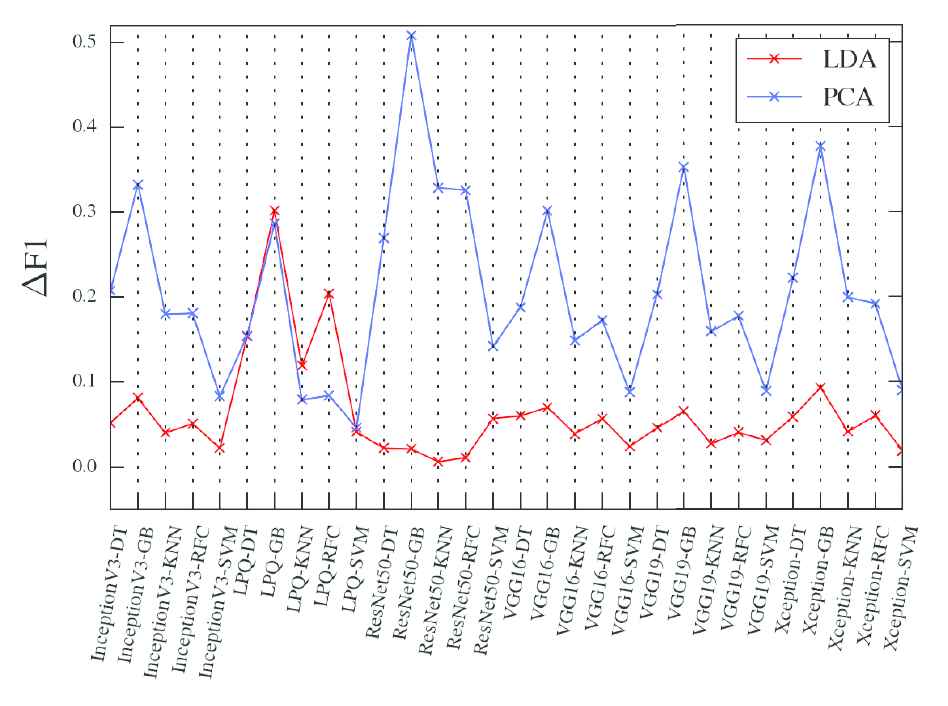
Difference of the F1 between LDA and PCA. DT is decision tree classifier, GB is gradient boosting classifier, RFC is random forest classifier.
The comparison represented that the LDA method was used in our proposed method not only has better dimension reduce ability but also has better generalization performance.
6. CONCLUSIONS
Wood is one of the most valuable forest resources and needed by humans. The wood image recognition is necessary and useful in many places, but it is difficult to training a deep learning model because it is hard to acquire enough images. In this paper, we proposed a transferring learning method based on a small data set to recognize the wood species. This method uses ResNet50 feature extraction, LDA key feature refinement, and KNN classifier.
The testing accuracy reached to 0.996, and the F1 score reached 0.994. Furthermore, the generalization performance also was good, the difference of the F1 score was small to 0.006, and the difference of the accuracy was small to 0.0009.
We also studied the affection of the parameter K in the KNN classifier and got the best K = 14 parameter in the experiments. Contrasting to the complete deep learning methods, our proposed method has better accuracy and generalization.
In the future, we plan to apply this method in more wood species to improve the classification performance.
CONFLICTS OF INTEREST
The authors declare they have no conflicts of interest.
AUTHOR'S CONTRIBUTIONS
Yongke Sun: Wrote the origin article and executed the experiments; Zhao Lin: Collected the samples; Xin He: Prepared the materials; Youjie Zhao: Analyzed the data; Fei Dai: Reviewed the article; Jian Qiu: Guided the experiments; Yong Cao: Took part in the experiments and reviewed the article.
ACKNOWLEDGMENTS
This work was supported by Project of National Natural Science Foundation (61962055 and 31960142), and the Major Project of Science and Technology of Yunnan Province (Grant No. 202002AD080002 and No. 2019ZE005).
REFERENCES
Cite this article
TY  - JOUR
AU  - Yongke Sun
AU  - Qizhao Lin
AU  - Xin He
AU  - Youjie Zhao
AU  - Fei Dai
AU  - Jian Qiu
AU  - Yong Cao
PY  - 2021
DA  - 2021/04/30
TI  - Wood Species Recognition with Small Data: A Deep Learning Approach
JO  - International Journal of Computational Intelligence Systems
SP  - 1451
EP  - 1460
VL  - 14
IS  - 1
SN  - 1875-6883
UR  - https://doi.org/10.2991/ijcis.d.210423.001
DO  - 10.2991/ijcis.d.210423.001
ID  - Sun2021
ER  -