
A Novel Model for Assessing e-Government Websites Using Hybrid Fuzzy Decision-Making Methods
- DOI
- 10.2991/ijcis.d.210423.002How to use a DOI?
- Keywords
- E-government; Website; Analytic hierarchy process; PROMETHEE; Fuzzy sets theory; Municipality
- Abstract
Websites are considered as the core infrastructure of e-government, so evaluating the quality of websites assists organizations to provide high-quality online services to citizens. For this purpose, this paper is seeking to design a model that enables any organization to evaluate the quality of its websites and identify its strengths and weaknesses. The proposed model includes nine main indexes including “website design,” “responsiveness quality,” “security,” “content and information quality,” “participation,” “trust,” “maintenance and support,” “services” and “usability,” alongside with 85 indicators. Since some of indexes and indicators possess intrinsic uncertainties so “fuzzy set theory” was applied to model the problem's ambiguity. “Analytic hierarchy process” and “PROMETHEE” methods were applied to weigh and rank indexes and indicators respectively. After designing the model, it was used for assessing the websites of five metropolitan municipalities of Iranian cities to spot their strengths and weaknesses.
- Copyright
- © 2021 The Authors. Published by Atlantis Press B.V.
- Open Access
- This is an open access article distributed under the CC BY-NC 4.0 license (http://creativecommons.org/licenses/by-nc/4.0/).
1. INTRODUCTION
The development of information and communication technology (ICT) has enabled governments to increase their communication with citizens and their participation in public and governmental processes. e-Government refers to the use of ICTs by government agencies and institutions to make a communication between citizens and corporations and various forms of government agencies [1–3]. e-Government is one of the most effective ways to reduce costs while improving the performance of government more transparently, effectively as well as providing cheaper and faster services to citizens [4–8]. The goal of e-government is to optimize government interactions, increase transparency, and eliminate the spatial and temporal distance between the people and the state agencies as well as increasing public participation in political processes [1,5,9].
e-Government development is an evolutionary process which means that development of services takes place in different stages [10]. e-Government development models include five main stages: (a) providing unilateral services over the Internet, (b) bilateral communications between citizens and government, (c) service and financial transactions, (d) vertical integration (integration of a service at different geographical levels) and horizontal (integration between several services and providing a uniform platform for information exchange), and (e) electronic democracy [11,12].
As far as it regard the evolutionary e-government development, the first and second stages concentrates on creation of a website and its interaction with citizens. The features of these two stages are directly relevant to “technical” and “content” features of website which are summarized below [13–15]:
The first step in the development of e-government services is creation of a website on the Internet. The organization puts different information on the website. Citizens can reach the information and fulfill their requirement. The most pivotal point is that citizen can make unilateral communication with website which means that citizens can only observe the information.
In the second step, communication takes place in bilateral way. It means that users can get their required information as well as uploading their information on the website.
Thus, the initiating point for e-government development is creating an enterprise website as a “gateway” to make a communication with users and provide their required services [16]. Therefore, assessing websites as a tool to recognize current status of e-government development is so essential to improve website quality and delivering high quality online services to citizens.
Different studies have been conducted for assessing e-government websites in various countries. Table 1 shows the most important studies.
| No. | Model Name | Indexes | Model's Objective (Case Study) | Reference |
|---|---|---|---|---|
| 1 | e-Government website assessment in subnational level | -Technology -Content -Service -Participation |
The model is designed for assessing e-government website in subnational level (e-government website in 40 mega cities' municipalities) | [1] |
| 2 | e-Government website assessment in Indonesia | -Web design -Reliability -Responsiveness -Privacy and security -Personalization -Information -Ease of Use |
-The model is designed for assessing quality of e-government website (e-registration organization in Kesehatan) | [17] |
| 3 | e-Government website quality assessment in African countries | -Accessibility -Citizen engagement -Transparency and Openness -Security and Privacy -Dialogue -Quality of information and services |
The model is designed for assessing quality of e-government website for African countries (280 websites from 31 African countries) | [6] |
| 4 | e-Government websites usability assessment in African countries | -Online services -Accessibility Accommodations -Information architecture -Legitimacy -Navigation -User-help |
The model is designed to assess usability of African countries (280 websites from 31 African countries) | [18] |
| 5 | e-Government website assessment in Europe | -E-democracy -E-service -Website design |
The model is designed for assessing European e-government website (the evaluated websites are England, Ireland, Sweden, Germany, Denmark) | [19] |
| 6 | e-Government website assessment in Malaysia | -Compatibility -Consistency -Error prevention & Correction -Explicitness -Flexibility & Control -Functionality -Informative feedback -Language and content -Navigation -Privacy -User guidance and support -Visual clarity |
The model is designed for assessing e-government website usability in Malaysia (agriculture organization website in Malaysia) | [20] |
| 7 | e-Government website assessment in Asian countries | -Response time -Load time -Size -Number of items -Markup validation -Broken link |
The model is designed for assessing quality of responsiveness in Asian countries (e-government websites of Singapore, South Korea, Japan, Hong Kong, Malaysia) | [21] |
| 8 | e-Government website assessment in Vietnam | -Usability -Service -Citizen participation -Content |
The model is designed for assessing efficiency of e-government website in Vietnam (e-government website of municipalities in 54 metropolitan cities) | [22] |
| 9 | e-Government websites assessment in China | -Content Information -Website design -Website function -Website influence -Network security |
-The model is designed for assessing e-government website in China (Ministry of culture, General administration of quality supervision, Administration commission, National council, National Natural science, State Bureau, Official website of Tianjing, Official website of Shangxi, Official website of Shanghai, Official website of Zhejiang) | [23] |
Assessing e-government services in the previous studies.
As it is shown in Table 1, each study intended to consider restricted number of indexes for assessment. Such issue leads to decreasing accuracy of final outcome and avoid presenting a complete result for assessing e-government websites. Moreover, each study has been carried out in specific countries or territories which cannot be extended for another countries. Therefore the two main research gaps based on in previous studies are:
Absence of a model being comprised of a comprehensive set of indexes for assessing wider aspects of e-government websites.
There is no studies conducted for assessing e-government services of Islamic Republic of Iran.
Since assessing e-government website is carried out based on different criteria and sub-criteria, therefore multi-criteria decision-making methods are the best and suitable way to model the problem and conduct e-government website assessment. There are numerous MCDM methods exist which can be applied for recognizing the preference of indexes and indicators. As one of the objectives of the paper is assigning weight to indices, there are two common MCDM methods including analytical hierarchy process (AHP) and analytical network process (ANP) for assigning weight to indices. As there is no any dependencies between indexes so AHP method was selected because AHP method does not consider the dependency between indices (while ANP method considers the dependency).
Moreover, recognizing the preference and ranking of the indicators were the second research objective which can be solved by MCDM methods. There are different methods for recognizing the indicators' ranking. The most common methods are TOPSIS, DEMATEL, VIKOR, and PROMETHE. Due to dependency between indexes and high precision in measurement (pairwise comparison between indexes rather than comparing with the ideal and the worst point), PROEMTHEE was selected to recognize the preference of indexes.
The main research contribution is proposing a model which is comprised of various indexes and indicators for evaluating wider aspects of e-government websites comparing to previous studies. Moreover, no studies have been conducted for assessing e-government websites of Islamic Republic of Iran which is considered as the second paper's contribution.
In the second section, various effective indexes for assessing e-government website were extracted. The third section presented the three methods of “fuzzy set theory” “fuzzy AHP,” and “fuzzy PROMETHEE,” respectively. In the fourth section the proposed model indexes and indicators and parameters were presented based on previous studies. In the fifth section, the proposed model's indexes and indicators were assigned weight and ranked using “fuzzy AHP” and “fuzzy PROMETHEE” methods respectively. In the seventh section, the designed model was applied to assess the readiness levels of five metropolitan municipalities' e-government websites of Iran. Following that some suggestions and recommendations were proposed to improve website quality. The last section was devoted to research's conclusion.
2. RECOGNITION OF e-GOVERNMENT WEBSITE INDEXES
Various studies have been carried out to evaluate e-government websites. Each model considered different aspects of e-government websites considering different indexes. Each of these studies have been applied to assess e-government websites in different countries or continents. Having meticulously reviewed e-government websites' research over the past ten years, the most important indexes were extracted as “website design,” “responsiveness quality,” “security,” “trust,” “content information quality,” “participation,” “maintenance and support,” “service” and “usability” [1,6,15, 17–19,24,25]. Taking these indexes into account, wider dimensions of e-government websites are assessed in comparison with previous studies. Definition of each indexes are presented as follows:
Website Design: Website Design Index is considered in the e-government website assessment study of Indonesia, Central America, China, and Europe. This index evaluates websites in two dimensions: “appearance beauty” and “technical features of website.” The website's “appearance beauty” assesses “color,” “font,” “page uniformity,” and “simple design.” In the “technical features” section, website's compatibility with various “systems” and “browsers” and presentation of personalized services are assessed [17,19,21,23,24,26,27].
Responsiveness Quality: The index is considered in the e-government website evaluation models of Indonesia and African Countries. The Index measures the speed of server response to user's requests on the website. This index also considers “site response time after each click,” “required time to download documents” and “use of wide bandwidth between server and user's browser.” Due to the widespread development of “social networks” among the public, “compatibility of website with social networks” is considered in order to increase the responsiveness of user requests [1,6,17,28,29].
Security: The Index is taken into account in the e-government assessment models of Indonesia, China, and Australia. The index assesses the website's ability to resist against cyberattacks. The index measures website security in two dimensions: “backend” and “frontend.” The “backend” dimension assesses the existence of a “secure platform for transferring data between user's browser and server” provided through use of “secure protocols such as HTTPS and SSL” and “data encryption.” In the “frontend” dimension the security level is assessed in the “user interface” of website. Security in user interface is achieved through the use of “virtual keyboard for entering password,” “presence of security image code after entering password,” and “sending alert messages to users when anonymous users enter user's account” [6,17,18,23–25,27–29].
Trust: Trust is another index of e-government website assessment. Due to its high importance, many studies have investigated it separately. The index is considered in African countries model. It assesses users' trust about the provided services and organization. The index considers three dimensions of “risk,” “characteristic of government agency,” and “social characteristic of citizens.” The “risk” dimension refers to the assessment of “privacy” of users by following indicators such as “avoiding abusing user's information and sharing with other organizations.” “Characteristic of government agency” dimension is comprised of “organization credentials” and “user experience” sections. The first section deals with the assessment of “citizens' interests” and “integrity of the organization in service delivery.” The second section assesses citizens' satisfaction and service effectiveness. “Social characteristic of citizens” examines the extent to which citizens' willingness to trust third party. Citizens' familiarity with the internet is also measured [6,17,24,30,31].
Content and Information Quality: The index is considered in e-government website evaluation models of Indonesia, Central America, China, Vietnam, and the UN model. The index measures the degree of “updating,” “accuracy,” and “precision” of information. Owing to differences in the level of education of users, “providing information in a simple language and without any complexity” is another given indicator. Due to available variety of software for viewing information, providing information in different formats (such as HTTPS and PDF) increases the efficiency of information usage. “Restricting advertisement” and “providing important information at the outset of a paragraph” are also important indicators to evaluate the quality of information [1,27,32].
Participation: The index is applied in the models of Vietnam, Australia, Africa, Central America, China, and the UN model. The index assesses features such as “online polling,” “providing frequent answer and question (FAQ)” and “the ability to record citizen's objections and criticisms” on the website aimed at increase citizens' engagement. “Holding online meetings helps users to be aware of the latest developments in service delivery and providing contact information to communicate with other organizations” are the other important indicators [1,6,18,22,23,26,29,33].
Maintenance and Support: The index is included in the assessment models of e-government websites in Malaysia, African countries, and the United Nations model. The index assesses the possibilities of providing citizens with guidance on how to make better use of the website and services. The most important indicators of the index are “online help,” “online support system,” and “website user manual.” “Sending emails about the latest status of citizen requests” helps to inform users about their requests. Due to different processes on the website, displaying different messages (such as error messages) plays a vital role in assisting users for better usage of services [1,6,20].
Services: The index is considered in the e-government assessment models of Vietnam, Australia, China, Africa, and Europe as well as the United Nations Model. It assesses the diversity of services provided to users. One of the most basic services is the online payment which allows users to pay their bills without going to banks. Due to the various services, downloadable applications are considered as other commonly used services of websites. Other widely used website services include downloadable tender documents and finally to be able to participate in online tender [6,18,19,22,23,25].
Usability: The Index is considered in the e-government assessment model of Vietnam, England, and African countries. It measures “ease of use” of provided services and website. The presence of search engine, site map, and simple menus help to make the services and information available to users “faster” and “easier.” “Ability to go back to the previous stage” and “cancel operations during transactions” can facilitate use of website. Given the high number of web pages, keeping links active to each page is taken into account as another indicator [6,22–24].
Table 2 indicates the extracted indexes and indicators regarding e-government assessment website based on previous studies.
| No. | Index | Indicators | References |
|---|---|---|---|
| 1 | Website design | -Web page color -Web page font -Same font in all pages -Simple and same design -Simple pictures compatible with text -Title pages -Compatibility with different browser -Compatibility with different system (e.g., mobile phone) -Presenting personalized services -Write-in personal information by users -Time, date, and weather display |
[6,17,19–21,23,24,26–28] |
| 2 | Responsiveness quality | -Speed of servers' responsiveness after each click -Document downloading time -Wide bandwidth between server and user's browser -Compatibility with social networks -Low size file -Low size pictures -Server deployment inside country |
[1,17,18,28,29] |
| 3 | Security | -Data encryption between server and user's browser -Supporting HTTPS protocol for enhancing security between server and user's browser -Improving transaction security by supporting SSL protocol -Security image after entering password -Virtual keyboard for entering password -Sending alert message after anonymous user's log-in |
[6,17,18,23,24,27,29,34] |
| 4 | Trust | -Disposition to trust -Familiarity with the internet -Avoidance of sharing personal information with other agencies -Avoidance of unauthorized user to access personal information -Avoidance of personal information abuse -High speed of online transaction -Error avoidance in financial transaction -User satisfaction with services in past experiences -Efficiency and effectiveness of services -User's benefit consideration in services by agencies -Organization's honesty in delivering services -Message display after completing procedures -Display of organization's logo in all pages |
[6,17,18,24,30,31,35] |
| 5 | Content and information quality | -Data precision -Updated data -Data presentation in different formats such as HTML, PDF -Data accuracy -Service and information delivery based on user's requirements -Date indication of latest update -Avoidance of using complicated langue in presenting information -Presenting important information at the outset of paragraphs -Restricting advertisement content |
[6,17,18,20,22–24,27,28,34] |
| 6 | Participation | -Online survey -Frequent answer and question (FAQ) -Publishing weekly news letter -Online weekly meeting (e.g., Webinar) for increasing people's awareness -Online voting -Online complaint and criticism -Contact information |
[1,6,18,19,22,23,29] |
| 7 | Maintenance and support | -Online supporting services for guiding users while using services -Online maintenance services -Error message display during transaction -Sending email for informing users about latest request status -user manual |
[1,6,20] |
| 8 | Services | -Downloadable forms for registering requests -Online payment -Downloadable documents -Online tender participation -Online license -Variety of specialized services |
[1,6,18,19,22,23] |
| 9 | Usability | -Supporting multi languages -Search engine -Simple menu for better navigation -Website map for faster access to information -Ability to return to previous step -Ability to cancel operation -Links management -Links for connecting to other organizations -Accessibility 24×7 |
[6,22–24] |
Indexes and indicators of e-government website assessment.
Based on Table 2, the most important indexes and indicators for assessing e-government websites are identified as “website design,” “responsiveness quality,” “services,” “usability,” “maintenance and support,” “participation,” “content and information quality,” “usability,” and “security.” The recognized Indexes and indicators are considered as main indexes and indicators of the proposed model which is able to evaluate more aspects of e-government websites whose final assessment results are more accurate and precise than previous studies. In the next section “fuzzy set theory,” “fuzzy AHP,” and “fuzzy PROMETHEE” methods were applied for modeling existed uncertainty, assigning weight to indexes and Indicator's ranking respectively.
3. METHODOLOGY
Assessing e-government website is done based on different indexes whose preference and importance should be obtained by mathematical method. Multi-criteria decision -making methods are mathematical-based methods to denote the preference of indexes in different case studies [36]. Since the first objective of the current paper is assigning weight to indexes, there are the two most common MCDM methods which can be used for assigning weight to indices including AHP and ANP [37]. Table 3 shows the main methods features.
| No. | Method | Description | Features |
|---|---|---|---|
| 1 | AHP | The method recognizes the preference of indexes by converting hierarchical complicated problem into simple problem by applying pairwise comparison | -Pairwise comparison -Absence of dependency between indices -Using Likert linguistic variables for pairwise comparison |
| 2 | ANP | The method recognizes the importance of indexes by creating a network rather than hierarchical structure. The model can also model the interdependency between elements. | -Pairwise comparison -Presence of dependency between indexes -Using Likert linguistic variables for doing pairwise comparison |
Comparing AHP and ANP methods.
As shown in Table 3, ANP method can recognize the preference of indexes by modeling the interdependency of indices while AHP method does not consider any dependency of indexes. Since there is no any dependency between indexes, therefore, ANP method is not suitable method for the research problem and instead AHP was selected for determining the importance of indexes.
As the number of indicators are much more than indexes, applying AHP method is impossible and making the pairwise comparison of indicators so time-consuming and complicated for experts. Therefore, other MCDM methods should be applied which are used for ranking and determining preference of indicators. The most common MCDM methods for ranking indicators are ELECRE, TOPSIS, PROEMTHEE, and VIKOR [38]. Table 4 shows the methods' description and their features.
| No. | Method | Description | Features |
|---|---|---|---|
| 1 | TOPISS | -Choosing the best indicator based on shortest distance from ideal solution and longest distance from negative ideal solution. | -Less accurate than other MCDM methods -Not useful for having a lot of indicators |
| 2 | ELECTRE | -It is an outranking and noncompensatory method which needs to have less inputs. It is useful for large number of indicators. The method enables users to reach the best solution by removing the rest of alternatives | -Non compensatory method -Useful for having large number of indicators -Reaching to the best indicator by omitting the rest of indicators -Inability to present the preference of all alternatives together |
| 3 | PROMETHEE | -It is an outranking method and the operation is based on pairwise comparison between indicators. The method can do alternative's ranking regardless of indicator's dependency | -It is compensatory method -Ranking indicators altogether -Not sensitive to dependency of indicators -Useful for having large number of indicators |
| 4 | VIKOR | -It is selecting based on the best solution which has the shortest distance from ideal solution | -Less accurate than other MCDM method -Not useful for having too many indicators |
The most common MCDM methods comparison.
As it is shown in Table 4, due to having too many indicators for making comparison, applying VIKOR and TOPSIS methods are not recommended. Moreover, ELECTRE method intends to introduce the best indicator rather than ranking all indicators together. Therefore, PROMETHEE is the best method which can be applied for the current research paper. PROEMTHEE method is recommended for problems with having too many indicators. The method can provide preference of indicators all together regardless of their dependency.
Since there is high inherent ambiguity in some of the indexes and indicators, it is highly required to capture existed uncertainty. There are different ways highlighted in researches for modeling the problem's ambiguity such as linguistic assessment models and fuzzy sets theory. Zhang et al. [39,40] have applied linguistics assessment approach in order to model the expert's opinion and judgment for personalized individual semantics. Fuzzy sets theory is another common use approach for modeling existed ambiguity in any research problem. The fuzzy sets theory have been widely used for capturing expert's judgment and opinion as well as modeling the subjective concept of any research problem. Fuzzy sets theory with the Likert linguistic variables model the judgment's linguistic variables in an interval [0, 1] which can greatly model the research problem. In this research, fuzzy sets theory alongside Likert linguistic variables were applied together for modeling the expert's judgment ambiguity and existed uncertainty in the subjective concept of the problem [41–43].
3.1. Fuzzy Sets Theory
Fuzzy sets theory was proposed by Lotfiizadeh in 1965 [44]. This theory is used for mathematical modeling of uncertainties in real-world phenomena in various spheres such as “Multi-criteria decision-making,” “pattern classification,” and “time series” [44–47].
“Fuzzy set theory” defines membership degree for each member that is represented as a “membership function” µ (x). This function takes a value between zero and one. The greater the value is, the stronger degree of belonging to the set [48,49].
Fuzzy numbers are subsets of real numbers that each have a membership function. Triangular fuzzy numbers are one of the most commonly used fuzzy numbers having three bands, lower (l), median (m), and upper (u) [50,51]:
The most important operations of two positive triangular fuzzy numbers
| No | Operation | Result |
|---|---|---|
| 1 | Sum | |
| 2 | Subtraction | |
| 3 | Multiple | |
| 4 | Multiply a positive crisp number (k) in the fuzzy number | |
| 5 | Multiply a negative crisp number (k) in the fuzzy number |
Main fuzzy triangular operations.
3.2. Fuzzy AHP
The AHP method was first introduced by Thomas Satty in 1970 [54]. This method is very popular because of the ease of use and conversion of complex multi-criteria decision-making problems into simple problems. Due to the uncertainty in some of the proposed model's indexes (such as trust and web site design), the AHP method with crisp numbers is not capable of modeling existed ambiguity, so fuzzy set theory is used to overcome the existed constraints [49,50,53,55–57]:
First step (pairwise comparison of indexes): Each index is compared in pairs via the linguistic variables presented in Table 6 and then the linguistic variables are converted into triangular fuzzy numbers. The resulting values are put in the decision matrix.
Based on the decision matrix,
Second step (aggregation of experts' judgments): Since the quantity of experts are more than one person so their judgments must be integrated and converted into a single decision matrix:
Third step (consistency ratio): In order to compute the consistency ratio (CR), fuzzy comparison matrix should be deffuzified by equitation (7) and (8) to convert fuzzy numbers into crisp numbers. CR is calculated by
In relations (7) and (8),
Fourth step (fuzzy weight of Indexes): The fuzzy weight value of indexes is obtained by calculating “fuzzy synthetic extent”:
In the above equations,
Fifth step (degree of possibility calculation): The fuzzy values obtained in the preceding step are converted to crisp numbers by the calculation of the “degree of possibility”:
Given the above relations, the fuzzy weight values of each indexes are compared through a relation of (13) and (14) then the result of comparing each index with other indexes is obtained by the relation (15) which is represented by the variable
Sixth step (normalization): The crisp weight of indexes obtained from the previous stage is normalized through the (18) and (19) relations:
Based on the above relations, the standardized value of the crisp weight of the indexes
| No | Linguistic Variables | Likert Number | Triangular Fuzzy Number |
|---|---|---|---|
| 1 | Equal Preference | 1 | (1, 1, 1) |
| 2 | Weak preference | 2 | (1, 3, 5) |
| 3 | Strong preference | 3 | (3, 5, 7) |
| 4 | Very strong preference | 4 | (5, 7, 9) |
| 5 | Extremely preferred | 5 | (7, 9, 9) |
Linguistic variables and triangular fuzzy numbers.
| Number of Criteria | 1 | 2 | 3 | 4 | 5 | 6 | 7 | 8 |
| Ration Consistency | 0 | 0 | 0.52 | 0.89 | 1.11 | 1.25 | 1.35 | 1.40 |
Value of ration consistency (
3.3. Fuzzy PROMETHEE
The “PROMETHEE” method was proposed in 1986 by Brans [41]. This method is considered as one of the outranking models. Due to its ease of use and high accuracy in the ranking of alternatives, the method is well-considered by researchers [58,59]. Given the uncertainties in some of the proposed model indicators (such as color, font, and citizen's willingness to trust against other side), the PROMTHEE method with crisp number cannot model the inherent ambiguity in the problem, so triangular fuzzy numbers is applied for modeling existed uncertainties in indicators [60,61]:
First step (pairwise comparison of indicators): Each indicator is compared pairwisely using the linguistic variables of Likert spectrum shown in Table 3. The linguistic variable are turned into triangular fuzzy numbers which are put into decision matrix.
Second step (experts' judgments aggregation): Since there are more than one expert to assess indicators, their judgments should be combined and formed into single square decision matrix:
In the above relations
Third step (calculation of each indicator's preference over other indicator): The fuzzy difference value of both indicators is calculated and put into the preference function:
In the above equations,
Fourth Step (calculation of each indicator preference over all indicators): Each indicators' preference over all indicators is obtained by calculating the net flow:
In the above relations, the variable
Fifth step (defuzzification and normalization operations): In order to compare the indicators preference against each other, the fuzzy value of each indicator's net flow is defuzzified and normalized:
In order to normalize the crisp value of indicator's net flow, Firstly, the maximum value of absolute indicators' value are obtained (which represented by
4. DESIGNING A MODEL FOR ASSESSING e-GOVERNMENT WEBSITES IN IRAN
The purpose of this study is to provide a model for assessing e-government websites. Indexes and indicators of the proposed model are introduced based on previous studies in Section 2. The AHP method was applied to assign weight of the indexes and the “PROMETHEE” method was used to rank the indicators. Due to existed inherent ambiguity in some of indexes (such as website design and trust) and indicators (such as color and font) “fuzzy set theory” was used to model existed uncertainty in the proposed model. The proposed method for obtaining e-government assessment model is illustrated in Figure 1.
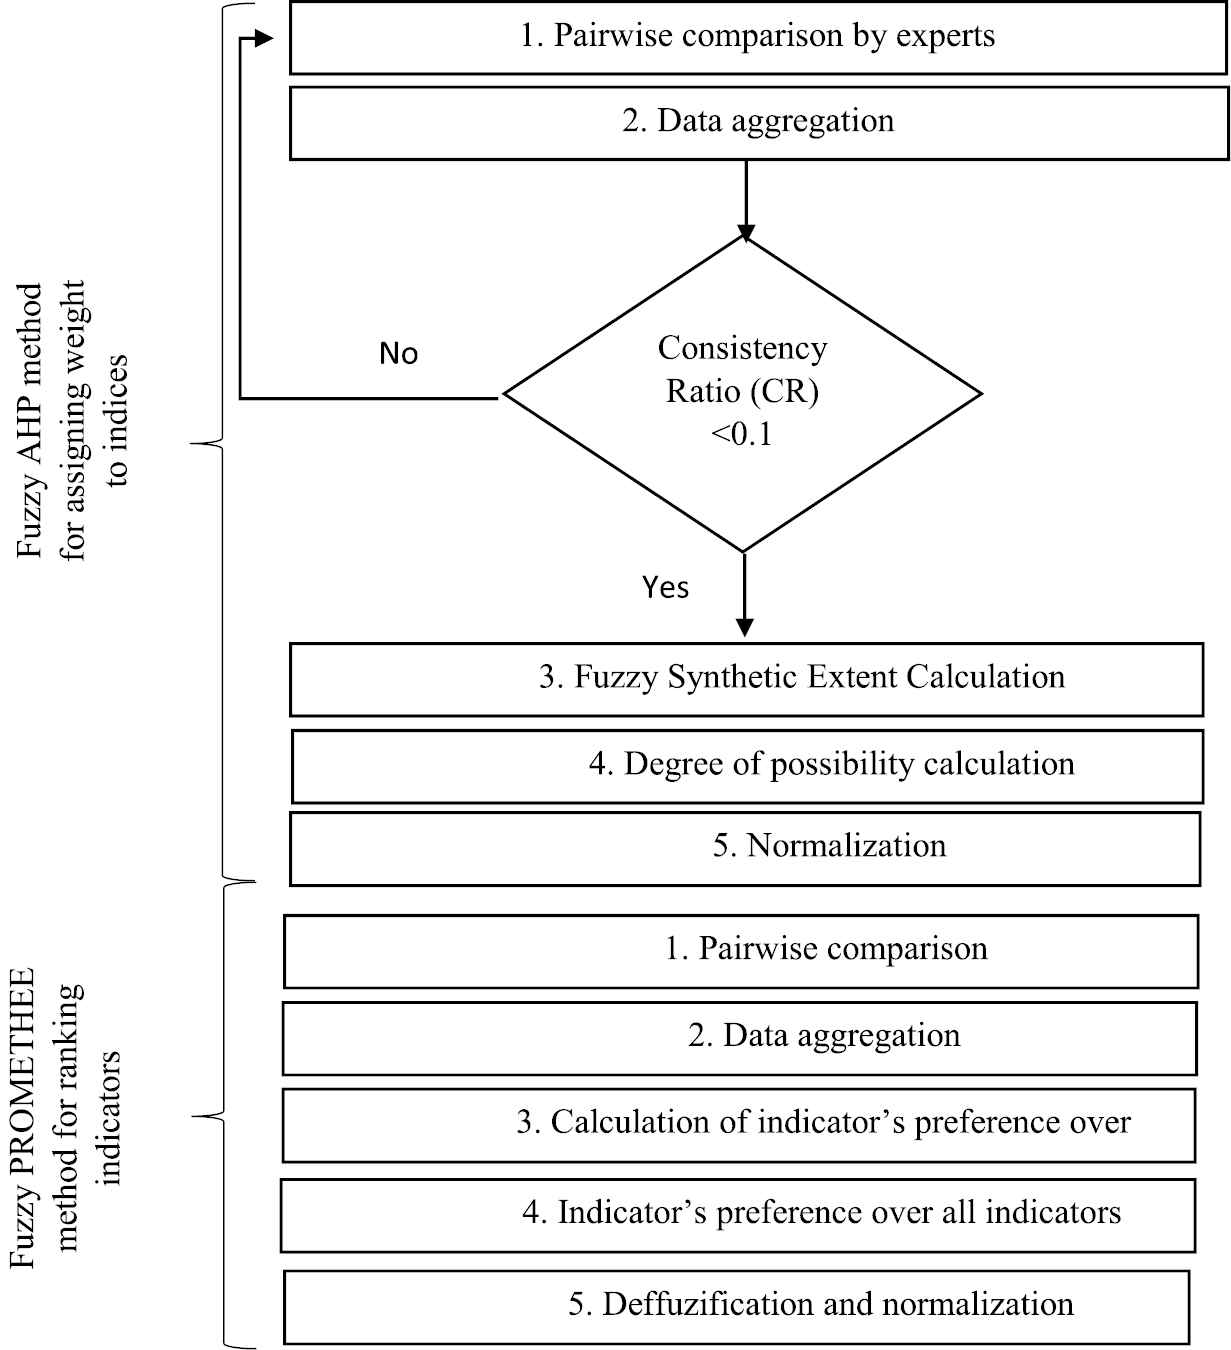
e-Government websites assessment steps.
As it is shown in Figure 1, the first step of proposed model is assigning weight to the indexes through Fuzzy AHP method. In the second step, indicators were ranked by fuzzy PROMETHEE method. In the next section, the demographic information of respondents are presented then each index and indicator was weighed and ranked based on expert's judgments respectively.
5. DATA COLLECTION AND MODEL EXECUTION
5.1. Research Statistical Society
A questionnaire was prepared to collect data from 60 experts. The questionnaire was designed based on Likert spectrum to exercise pairwise comparison between indexes and indictors. The demographic information of respondents is shown in Table 8.
| Sex | Female | 27 Persons | 45% |
| Male | 33 Persons | 55% | |
| Education | Bachelor | 14 Persons | 33% |
| Master | 35 Persons | 58% | |
| Phd | 11 Persons | 18% | |
| Age | Less than 30 years | 9 Persons | 15% |
| Between 30 and 40 years | 29 Persons | 48% | |
| Between 40 and 50 years | 14 Persons | 23% | |
| More than 50 years | 8 Persons | 13% | |
| Work experience | Less than 5 years | 14 Persons | 23% |
| Between 5 and 10 years | 27 Persons | 45% | |
| More than 10 years | 19 Persons | 31% | |
| Career | Member of scientific committee | 17 Persons | 30% |
| Expert | 31 Persons | 53% | |
| Manager | 12 Persons | 17% |
Demographic information respondents.
5.2. Obtaining e-Government Website Assessment Model
After collecting the data, each indexes and indicators are assigned weight and ranked using “fuzzy AHP” and “fuzzy PROMETHEE” respectively:
5.2.1. Assigning weight to the indexes
Aggregated Matrix
After pairwise comparison of the indexes by the experts' judgments, their judgments were aggregated based on relations (3) to (6). Table 9 indicates the aggregated information.
Consistency Ration
After deffuzifying the decision matrix, the fuzzy numbers were deffuzified and the CR is computed by equations (7) to (8). CR was calculated as 0.075 which is less than 0.1 and denotes high decision matrix consistency and stability.
Fuzzy Synthetic Extent Calculation
Fuzzy weight of indexes was calculated through the relations (9) to (12) as shown in Table 10.
Degree of possibility calculation
Fuzzy weight of indexes is converted to crisp weight by equation (13) to (17) which is presented in Table 11.
Normalization
In the last step, the crisp weight of indexes were normalized through relations (16) and (17) which is presented in Table 12.
As it is noted in Table 12, the most important indexes of e-government website assessment are “security,” “trust,” and “content and information quality.” The value of indexes shown in Figure 2.
| Index | Website Design | Responsiveness Quality | Security | Content and Information Quality | Participation | Trust | Maintenance and Support | Services | Usability |
|---|---|---|---|---|---|---|---|---|---|
| Website design | (1, 1, 1) | (0.746, 0.452, 0.452) | (0.6140, 0.7767, 0.0481) | (0.5771, 0.7114, 0.9340) | (0.9476, 1.2282, 1.5205) | (0.5833, 0.7457, 1.0216) | (0.9299, 1.1638, 1.5182) | (0.7489, 0.9387, 1.1643) | (0.8572, 1.1202, 1.5015) |
| Responsiveness quality | (0.8003, 1.0633, 1.3405) | (1, 1, 1) | (0.5516, 0.6405, 0.7555) | (0.8572, 0.9969, 1.1587) | (1.4325, 1.7149, 2.0049) | (0.5426, 0.6512, 0.8003) | (1.2983, 1.4520, 1.6076) | (1.2393, 1.4520, 1.6076) | (1.3573, 1.6212, 1.8910) |
| Security | (0.9541, 1.2875, 1.6287) | (1.3237, 1.5613, 1.8128) | (1, 1, 1) | (1.2599, 1.4566, 1.6678) | (1.6398, 2.0240, 2.4560) | (0.9961, 1.1266, 1.2599) | (1.5675, 1.8827, 2.1833) | (1.2907, 1.5412, 1.7745) | (1.2907, 1.4248, 1.6430) |
| Content and information quality | (1.0707, 1.4057, 1.7329) | (0.8631, 1.0032, 1.1665) | (0.5996, 0.6865, 0.7937) | (1, 1, 1) | (1.1038, 1.4108, 1.6996) | (0.6037, 0.7193, 0.8535) | (1.2846, 1.5265, 1.7591) | (1.4192, 1.8303, 2.2163) | (1.1370, 1.3172, 1.4920) |
| Participation | (0.6577, 0.8142, 1.0552) | (0.4988, 0.5831, 0.6981) | (0.4072, 0.4941, 0.6098) | (0.5884, 0.7088, 0.9059) | (1, 1, 1) | (0.5261, 0.6207, 0.7537) | (0.9277, 1.1087, 1.3478) | (0.9099, 1.0972, 1.2915) | (1.0869, 1.1768, 1.2729) |
| Trust | (0.9789, 1.3409, 1.7145) | (1.2496, 1.5357, 1.8429) | (0.7937, 0.8876, 1.0039) | (1.1716, 1.3902, 1.6566) | (1.3269, 1.6110, 1.9009) | (1, 1, 1) | (1.3411, 1.6354, 1.9157) | (1.1065, 1.4610, 1.8321) | (1.3760, 1.6929, 2.0087) |
| Maintenance and support | (0.6587, 0.8593, 1.0754) | (0.6221, 0.6887, 0.7702) | (0.4580, 0.5311, 0.6379) | (0.5685, 0.6551, 0.7785) | (0.7419, 0.9020, 1.0780) | (0.5220, 0.6115, 0.7456) | (1, 1, 1) | (0.8820, 1.0755, 1.3180) | (0.9781, 1.1394, 1.3375) |
| Services | (0.8589, 1.0653, 1.3353) | (0.5085, 0.6270, 0.8069) | (0.5635, 0.6488, 0.7748) | (0.4512, 0.5464, 0.7064) | (0.7743, 0.9114, 1.0991) | (0.5458, 0.6845, 0.9038) | (0.7587, 0.9298, 1.1337) | (1, 1, 1) | (0.7691, 0.8655, 0.9734) |
| Usability | (0.6660, 0.8927, 1.1665) | (0.5288, 0.6168, 0.7368) | (0.6087, 0.7018, 0.8267) | (0.7856, 0.8498, 0.9201) | (0.4978, 0.5907, 0.7267) | (0.7477, 0.8776, 1.0224) | (0.7477, 0.8776, 1.0224) | (1.0274, 1.1554, 1.3003) | (1, 1, 1) |
Aggregated decision matrix based on fuzzy AHP.
| No. | Index | Fuzzy Weight |
|---|---|---|
| 1 | Website design | (0.069, 0.1004, 0.1510) |
| 2 | Responsiveness quality | (0.0895, 0.1250, 0.1726) |
| 3 | Security | (0.1108, 0.1549, 0.2126) |
| 4 | Content and information | (0.895, 0.1269, 0.1752) |
| 5 | Participation | (0.0651, 0.0885, 0.1232) |
| 6 | Trust | (0.1019, 0.1461, 0.2050) |
| 7 | Maintenance and support | (0.0634, 0.0869, 0.1205) |
| 8 | Services | (0.0614, 0.0847, 0.1204) |
| 9 | Usability | (0.0644, 0.0867, 0.1183) |
Fuzzy weight of indexes.
| No. | Index | Crisp Weight of Indexes (Degree of Possibility) |
|---|---|---|
| 1 | Website design | 0.425 |
| 2 | Quality of responsiveness | 0.674 |
| 3 | Security | 1 |
| 4 | Content and information | 0.679 |
| 5 | Participation | 0.157 |
| 6 | Trust | 0.915 |
| 7 | Maintenance and support | 0.125 |
| 8 | Services | 0.12 |
| 9 | Usability | 0.099 |
Crisp weight of indexes.
| No. | Index | Crisp Weight | Fuzzy Weight Percentage | Ranking |
|---|---|---|---|---|
| 1 | Website design | 0.1009 | 10.09% | 5 |
| 2 | Responsiveness quality | 0.16 | 16% | 4 |
| 3 | Security | 0.2374 | 23.74% | 1 |
| 4 | Content and information quality | 0.1655 | 16.55% | 3 |
| 5 | Participation | 0.0373 | 3.73% | 6 |
| 6 | Trust | 0.2172 | 21.72% | 2 |
| 7 | Maintenance and support | 0.0297 | 2.97% | 7 |
| 8 | Services | 0.0285 | 2.85% | 8 |
| 9 | Usability | 0.0235 | 2.35% | 9 |
| 10 | Total | 1 | 100 | ------- |
The normalized crisp weight if indexes.
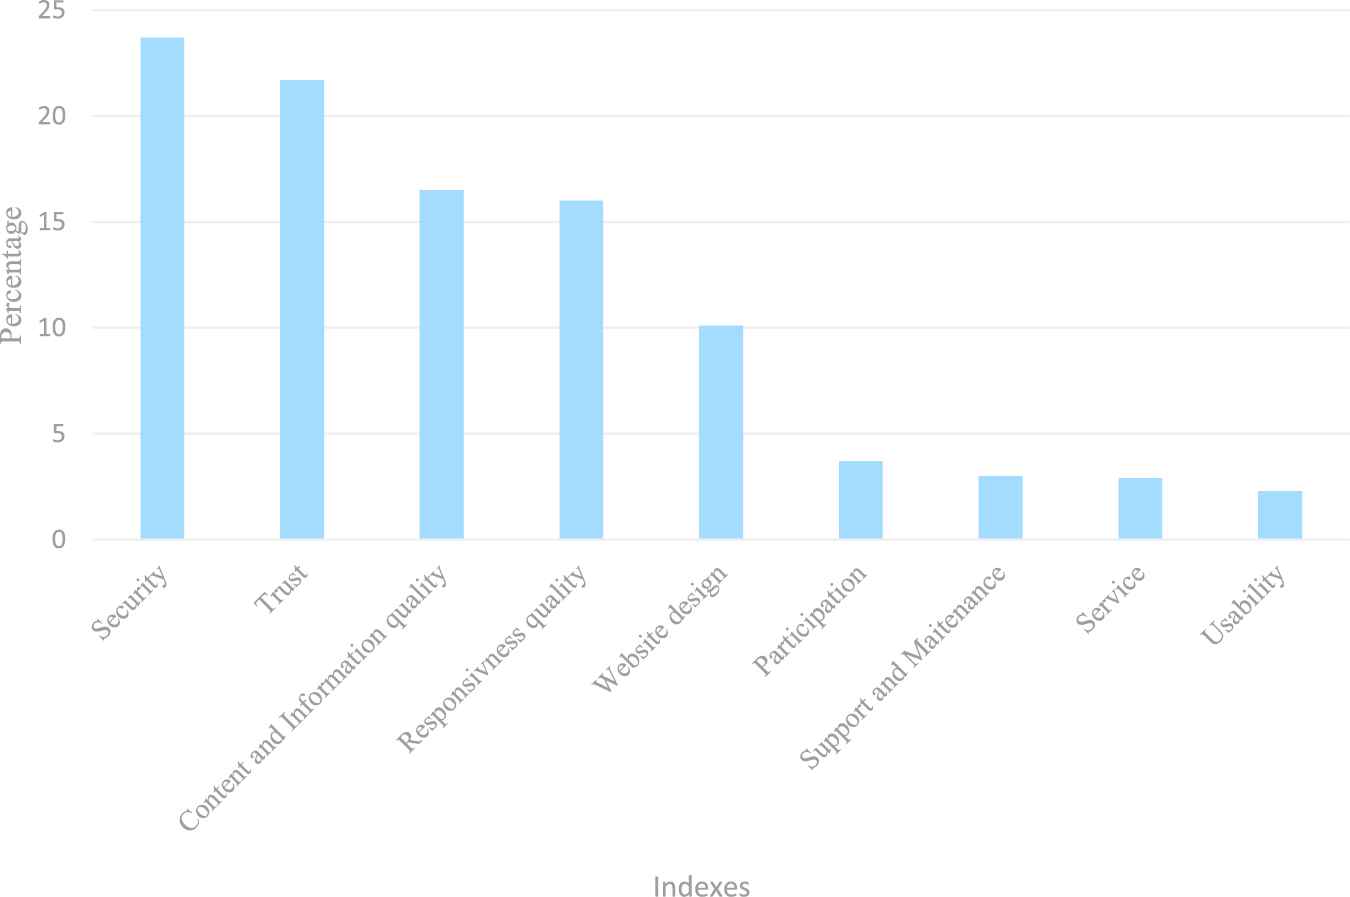
Final raking of e-government website assessment indexes.
5.2.2. Ranking indicators
In this step, indicators were ranked based on fuzzy PROMETHEE.
First step: Indicators were compared pairwisely and results are put into decision matrix. As the number of experts exceeds one person therefore all information are supposed to be aggregated and set into single decision matrix. The aggregation operation are conducted based on equitation (18) and (19).
Second step: Fuzzy difference value of the aggregated indicators are obtained through equitation (20) to (27) and is put into the preference function. The result is “input flow” which shows the preference of an indicator against all indicators, so the “output flow,” which indicates the preference of all indicators against each indicator, is achieved.
Third step: The input and output flow are defuzzified using Equations (28) and (29) then net flow is achieved.
Fourth step: Net flow values were normalized and final ranking of indicators were obtained by relations (30) and (31). Obviously the higher the net flow, the better ranking of index is. Tables 13–21 show the final results.
| No. | Indicator | Net Flow | Ranking |
|---|---|---|---|
| 1 | -Web page color | −0.2264 | 9 |
| 2 | -Web page font | −0.1711 | 6 |
| 3 | -Same font in all pages | −0.3831 | 10 |
| 4 | -Simple and same design | −0.2025 | 8 |
| 5 | -Simple pictures compatible with text | −0.1356 | 5 |
| 6 | -Page title | −0.0777 | 4 |
| 7 | -Compatibility with different browser | 1 | 1 |
| 8 | -Compatibility with different system (Ex. Mobile phone) | 0.7342 | 2 |
| 9 | -Presenting personalized services | 0.3358 | 3 |
| 10 | -Write-in personal information by users | −0.1955 | 7 |
| 11 | -Time, date and weather display | −0.7690 | 11 |
Website design's indicators ranking.
| No. | Indicator | Net Flow | Ranking |
|---|---|---|---|
| 1 | -Supporting multi languages | 0.2520 | 5 |
| 2 | -Search engine | 0.5203 | 3 |
| 3 | -Simple menu for better navigation | 0.5696 | 2 |
| 4 | -Website map for faster access to information | 0.2737 | 4 |
| 5 | -Ability to return to previous step | −0.5074 | 6 |
| 6 | -Ability to cancel operation | −0.5211 | 7 |
| 7 | -Links management | −0.8197 | 8 |
| 8 | -Links for connecting to other organizations | −1 | 9 |
| 9 | -Accessibility 24×7 | 0.855 | 1 |
Usability's indicators ranking.
| No. | Indicator | Net Flow | Ranking |
|---|---|---|---|
| 1 | Speed of servers' responsiveness after each click | 0.6080 | 1 |
| 2 | Document downloading time | 0.2504 | 3 |
| 3 | Wide bandwidth between server and user's browser | −0.0600 | 5 |
| 4 | Compatibility with social networks | −0.1156 | 6 |
| 5 | Low size file | 0.2731 | 2 |
| 6 | Low size pictures | 0.0749 | 4 |
| 7 | Server deployment inside country | −1 | 7 |
Responsiveness quality's indicators ranking.
| No | Indicator | Net Flow | Ranking |
|---|---|---|---|
| 1 | -Data encryption between server and user's browser | −0.1402 | 4 |
| 2 | -Supporting HTTPS protocol for enhancing security between server and user's browser | 1 | 1 |
| 3 | -Improving transaction security by supporting SSL protocol | −0.0756 | 2 |
| 4 | -Security image after entering password | −0.3248 | 5 |
| 5 | -Virtual keyboard for entering password | −0.3838 | 6 |
| 6 | -Sending alert message after anonymous user's log-in | −0.0757 | 3 |
Security's indicators ranking.
| No | Indicator | Net Flow | Ranking |
|---|---|---|---|
| 1 | Disposition to trust | −0.5047 | 11 |
| 2 | Familiarity with theInternet | 0.6186 | 5 |
| 3 | Avoidance of sharing personal information with other agencies | 0.1975 | 8 |
| 4 | Avoidance of unauthorized user to personal information | 0.2476 | 7 |
| 5 | Avoidance of personal information abuse | 0.2976 | 6 |
| 6 | High speed of online transaction | 0.0147 | 9 |
| 7 | Error avoidance in financial transaction | −0.1786 | 10 |
| 8 | User satisfaction with services in past experience | 0.7187 | 3 |
| 9 | Efficiency and effectiveness of services | 0.6686 | 4 |
| 10 | User's benefit consideration in services by agencies | 0.8188 | 1 |
| 11 | Organization's honesty in delivering services | 0.7687 | 2 |
| 12 | Message display after completing procedures | −1 | 13 |
| 13 | Display of organization's logo in all pages | −0.9431 | 12 |
Trust's indicators ranking.
| No | Indicator | Net flow | Ranking |
|---|---|---|---|
| 1 | Data precision | 1 | 1 |
| 2 | Updated data | 0.2144 | 4 |
| 3 | Data presentation in different formats such as HTML, PDF | 0.0007 | 6 |
| 4 | Data accuracy | 0.7617 | 3 |
| 5 | Service and information delivery based on user's requirements | 0.1229 | 5 |
| 6 | Date indication of latest update | −0.1536 | 8 |
| 7 | Avoidance of using complicated language in presenting information | −0.0489 | 7 |
| 8 | Presenting important information at the outset of paragraphs | −0.8909 | 9 |
| 9 | Restricting advertisement content | 0.8735 | 2 |
Content and information quality's indicators ranking.
| No | Indicator | Net Flow | Ranking |
|---|---|---|---|
| 1 | Online survey | 0.5453 | 3 |
| 2 | Frequent answer and question (FAQ) | 0.6450 | 2 |
| 3 | Publishing weekly news letter | −1 | 7 |
| 4 | Online weekly meeting (e.g., Webinar) for increasing people's awareness | −0.9561 | 6 |
| 5 | Online voting | 0.4555 | 5 |
| 6 | Online complaint and criticism | 0.7873 | 1 |
| 7 | Contact information | 0.5003 | 4 |
Participation's indicators ranking.
| No | Indicator | Net Flow | Ranking |
|---|---|---|---|
| 1 | Online supporting services for guiding users while using services | 1 | 1 |
| 2 | Online maintenance services | −0.1317 | 4 |
| 3 | Error message display during transaction | −0.9182 | 6 |
| 4 | Sending email for informing users about latest request status | −0.5847 | 5 |
| 5 | Sending tracking number after registration | 0.7429 | 2 |
| 6 | User manual | −0.1141 | 3 |
Maintenance and support's indicators ranking.
| No | Indicator | Net Flow | Ranking |
|---|---|---|---|
| 1 | Downloadable forms for registering requests | 0.3192 | 3 |
| 2 | Online payment | 0.4483 | 1 |
| 3 | Downloadable documents | 0.1514 | 5 |
| 4 | Online tender participation | 0.2547 | 4 |
| 5 | Online license | 0.4483 | 2 |
| 6 | Variety of specialized services | −0.6226 | 6 |
Service's indicators ranking.
The Table 22 shows the final results of assigning weights to indexes and ranking indicators respectively.
| No. | Index (Weight) | Indicator | Ranking | Net Flow |
|---|---|---|---|---|
| 1 | Security (0.2374) | -Data encryption between server and user's browser | 4 | −0.1402 |
| -Supporting HTTPS protocol for enhancing security between server and user's browser | 1 | 1 | ||
| -Improving transaction security by supporting SSL protocol | 2 | −0.0756 | ||
| -Security image after entering password | 5 | −0.3248 | ||
| -Virtual keyboard for entering password | 6 | −0.3838 | ||
| -Sending alert message after anonymous user's log-in | 3 | −0.0757 | ||
| 2 | Trust (0.2172) | Disposition to trust | 11 | −0.5047 |
| Familiarity with the Internet | 5 | 0.6186 | ||
| Avoidance of sharing personal information with other agencies | 8 | 0.1975 | ||
| Avoidance of unauthorized user to personal information | 7 | 0.2476 | ||
| Avoidance of personal information abuse | 6 | 0.2976 | ||
| High speed of online transaction | 9 | 0.0147 | ||
| Error avoidance in financial transaction | 10 | −0.1786 | ||
| User satisfaction with services in past experience | 3 | 0.7187 | ||
| Efficiency and effectiveness of services | 4 | 0.6686 | ||
| User's benefit consideration in services by agencies | 1 | 0.8188 | ||
| Organization's honesty in delivering services | 2 | 0.7687 | ||
| Message display after completing procedures | 13 | −1 | ||
| Display of organization's logo in all pages | 12 | −0.9431 | ||
| 3 | Responsiveness quality (0.1600) | Speed of servers' responsiveness after each click | 1 | 0.6080 |
| Document downloading time | 3 | 0.2504 | ||
| Wide bandwidth between server and user's browser | 5 | −0.0600 | ||
| Compatibility with social networks | 6 | −0.1156 | ||
| Low size file | 2 | 0.2731 | ||
| Low size pictures | 4 | 0.0749 | ||
| Server deployment inside country | 7 | −1 | ||
| 4 | Content and information quality (0.1655) | Data precision | 1 | 1 |
| Updated data | 4 | 0.2144 | ||
| Data presentation in different formats such as HTML, PDF | 6 | 0.0007 | ||
| Data accuracy | 3 | 0.7617 | ||
| Service and information delivery based on user's requirements | 5 | 0.1229 | ||
| Date indication of latest update | 8 | −0.1536 | ||
| Avoidance of using complicated language in presenting information | 7 | −0.0489 | ||
| Presenting important information at the outset of paragraphs | 9 | −0.8909 | ||
| Restricting advertisement content | 2 | 0.8735 | ||
| 5 | Website design (0.1009) | -Web page color | 9 | −0.2264 |
| -Web page font | 6 | −0.1711 | ||
| -Same font in all pages | 10 | −0.3831 | ||
| -Simple and same design | 8 | −0.2025 | ||
| -Simple pictures compatible with text | 5 | −0.1356 | ||
| -Page title | 4 | −0.0777 | ||
| -Compatibility with different browser | 1 | 1 | ||
| -Compatibility with different system (e.g., mobile phone) | 2 | 0.7342 | ||
| -Presenting personalized services | 3 | 0.3358 | ||
| -Write-in personal information by users | 7 | −0.1955 | ||
| -Time, date and weather display | 11 | −0.7690 | ||
| 6 | Support and maintenance (0.0297) | Online supporting services for guiding users while using services | 1 | 1 |
| Online maintenance services | 4 | −0.1317 | ||
| Error message display during transaction | 6 | −0.9182 | ||
| Sending email for informing users about latest request status | 5 | −0.5847 | ||
| Sending tracking number after registration | 2 | 0.7429 | ||
| User manual | 3 | −0.1141 | ||
| 7 | Usability (0.0235) | -Supporting multi languages | 5 | 0.2520 |
| -Search engine | 3 | 0.5203 | ||
| -Simple menu for better navigation | 2 | 0.5696 | ||
| -Website map for faster access to information | 4 | 0.2737 | ||
| -Ability to return to previous step | 6 | −0.5074 | ||
| -Ability to cancel operation | 7 | −0.5211 | ||
| -Links management | 8 | −0.8197 | ||
| -Links for connecting to other organizations | 9 | −1 | ||
| -Accessibility 24×7 | 1 | 0.855 | ||
| 8 | Service (0.0285) | Downloadable forms for registering requests | 3 | 0.3192 |
| Online payment | 1 | 0.4483 | ||
| Downloadable documents | 5 | 0.1514 | ||
| Online tender participation | 4 | 0.2547 | ||
| Online license | 2 | 0.4483 | ||
| Variety of specialized services | 6 | −0.6226 | ||
| 9 | Participation (0.0373) | Online Survey | 3 | 0.5453 |
| Frequent answer and question (FAQ) | 2 | 0.6450 | ||
| Publishing weekly news letter | 7 | −1 | ||
| Online weekly meeting (ex. Webinar) for increasing people's awareness | 6 | −0.9561 | ||
| Online voting | 5 | 0.4555 | ||
| Online complaint and criticism | 1 | 0.7873 | ||
| Contact information | 4 | 0.5003 |
Final ranking of indexes and indicators.
6. APPLYING THE PROPOSED MODEL FOR ASSESSING e-GOVERNMENT WEBSITES OF LOCAL GOVERNMENT
With the rapid growth of cities' population, the role of local governments in providing services to citizens is becoming more pronounced. Municipalities as the lowest level of governance are considered as one of the most important organization in providing services to citizens [1]; therefore, in order to assess the status of e-government services at the subnational level in Iran, five metropolitan municipalities including Tehran, Isfahan, Shiraz, Karaj, and Mashhad are selected. The cities' population makes around 20 percent of total population of Iran. In order to quantify the study, the frequency of indicators were calculated for the five cities in order to assess readiness of e-government website development. General information of the selected cities are shown in Table 23.
Security
The most important proposed model's index is “security.” The index assesses the security of website in two dimensions: “providing secure platform for transferring information between server and user browser” and “security on the user interface.” The relevant indicators to the first dimension including “using secure protocols such as HTTPS and SSL” and “encrypting information between the user browser and the server” are also well-considered in the websites. The second dimension (user interface) is comprised of following indicators “sending emails when anonymous people enter user's account without permission” and “having a virtual keyboard to enter password” which do not exist in any websites. Additionally, the “presence of security code image after entering keyword” indicator is only considered in half of the websites. The index's readiness for the selected websites is evaluated around 50% which shows the lack of website readiness in the security index.
Trust
Trust is the second most essential index of the proposed model. The index evaluates websites in three dimensions: “risk,” “social characteristic of citizens,” and “characteristics of public agencies.” The “risk” dimension assesses the extent of not sharing users' personal information with other organizations and unknown people which is well observed in all websites additionally, users believe that their personal information is not being misused by the organizations. “Social characteristics of citizens” dimension is comprised of two sections: “organization's credibility” and “user past experience.” In the first section, the integrity of the organization is poorly evaluated and more than 50% of users believe that organizations are not honest in providing services to citizens. Second section assesses the level of users' satisfaction with the delivered service, the vast majority of users are not fully satisfied with the services. The “social characteristic of citizens” dimension assesses the user's willingness to trust against other party which is also poorly evaluated, in other words, citizens do not easily trust against third party which reduces citizens inclination to use services. Some indicators are relevant to features on the user interface including “putting organization logo in all pages” and “displaying completion message after doing every processes.” These two indicators are well-considered in all websites. The readiness of this index on websites is about eighty percent which is indicative of its high readiness.
Content and information quality
Content and information quality is the third most important the proposed model's index. The most important indicators are “data updating,” “data accuracy,” and “data precision.” The indicators are well-observed on the selected websites (whose readiness is more than 90%). “Restricting advertising content” is another indicator. Due to the absence of ads on the websites, the indicator is also favorably evaluated. Another indicator is “providing information in different formats” where all websites present their information in a single format which reduces the efficiency of the website. The website “display of last updating date” indicator is not observed on the most websites. The readiness of the index is calculated around seventy percent which indicates high level of readiness.
Responsiveness quality
The fourth important proposed model's index is “responsiveness quality” that assesses the responsiveness of the website to users' requests. “Server time response against user's click on the website” and “required time to download information” are considered as important indicators which are well observed in most websites. “Using low size images and files” also helps to speed up the website's response whose readiness is calculated around 30%. Due to the development of social networks among citizens, website compatibility with the social networks is another indicator which is considered just in half of the websites. The indicator's readiness is around 90 percent which shows a high readiness of the index.
Website Design
Website design evaluates website in two dimensions: “technical features” and “visual beauty.” The most important technical dimension's indicators are how well website is compatible with different systems and browsers. All the websites are fully compatible with different browsers and systems. Providing personalized services is another indicator that is not well-considered in a way that less than 30% of websites is equipped with the indicator. The “visual beauty” dimension assesses the font, color, and uniformity of webpage design which is not well considered in a way that less than 20% of websites having uniform pages. The readiness of the index is around fifty percent indicating poor condition of index on the websites.
Participation
The Index measures the extent of participation between citizens and organizations. Presence of services for “recording objections, criticisms, and surveys” are considered as the most important indicators which are observed in less than half of the websites. “Presence of contact information for communicating with organization” is other indicator which is observed in all the websites. Other indicators concentrates on boosting up participation between users and organization such as “online voting” and “online meeting to inform users,” are not embedded in any websites. The readiness of the index is estimated to be around 50% indicating that the index is in poor condition.
Maintenance and support
The Index evaluates the website's capabilities to guide users to make a better use of online services. “Online help and tips for using the website” are the most important indicators which are considered in less than 40% of the websites. “Sending emails to inform users regarding their latest status of requests” is another indicator which is observed in less than half of the websites. The readiness of the index is estimated around fifty percent indicating poor readiness of index.
Service
The Index assesses the diversity and number of provided services. “Online payment” and “online downloadable forms” are the most important indicators which are considered by the most websites. “Tender documents” and “online tender participation” are other indicators. The first indicator have been met in all the websites but the second one is not available in any websites therefore users are not able to exercise online tender participation. The readiness of the index has been estimated around eighty percent indicating high readiness of the index.
Usability
“Usability” assesses “ease of use” of services and website. The most important indicator is “accessibility.” All the websites are accessible around the clock during a week. “Using simple menus,” “search engine,” and “website map” are other indicators which facilitate easy access to information. The indicators are considered in more than 80% of the websites. “Ability to cancel process” and “return to the previous stage” are other indicators which are presented in more than 90% of the websites. Keeping links active for connecting to other website's pages is another indicator. The indicator is in poor condition and just less than 20% percent of the websites considered the indicator. The readiness of the index is estimated at around 80% which indicates the high readiness of the index.
| .No | City Name | Province | Population (2019) | Proportion of Population City Against Country Population (Percentage) | City Area (Km2) | Website Address |
|---|---|---|---|---|---|---|
| 1 | Isfahan | Isfahan | 2, 000, 000 | 2.5 | 340 | www.isfahan.ir |
| 2 | Tehran | Tehran | 8, 700, 000 | 11 | 730 | www.tehran.ir |
| 3 | Shiraz | Fars | 1, 570, 000 | 2 | 240 | www.shiraz.ir |
| 4 | Karaj | Alborz | 1, 600, 000 | 2 | 168 | www.karaj.ir |
| 5 | Mashhad | Razavi Khorasan | 3, 000, 000 | 4 | 351 | www.mashhad.ir |
General information of selected cities.
Table 24 and Figure 3 show the status of e-government indexes on the websites.
| Index City | Website Design | Responsiveness Quality | Security | Content and Information Quality | Participation | Trust | Maintenance and Support | Service | Usability |
|---|---|---|---|---|---|---|---|---|---|
| Isfahan | 36% | 100% | 66% | 77% | 62% | 87% | 50% | 71% | 88% |
| Tehran | 54% | 85% | 66% | 77% | 50% | 63% | 66% | 42% | 77% |
| Shiraz | 54% | 85% | 66% | 77% | 50% | 94% | 83% | 71% | 88% |
| Karaj | 45% | 100% | 66% | 77% | 62% | 94% | 66% | 71% | 100% |
| Mashhad | 63% | 85% | 66% | 77% | 75% | 81% | 50% | 71% | 66% |
Status of e-government indexes on the websites.
Table 25 shows the readiness value of the e-government websites.
| Ranking | City | Readiness Value |
|---|---|---|
| 1 | Karaj | 78 |
| 2 | Shiraz | 76 |
| 3 | Isfahan | 75 |
| 4 | Mashhad | 74 |
| 5 | Tehran | 73 |
The readiness value of municipalities.
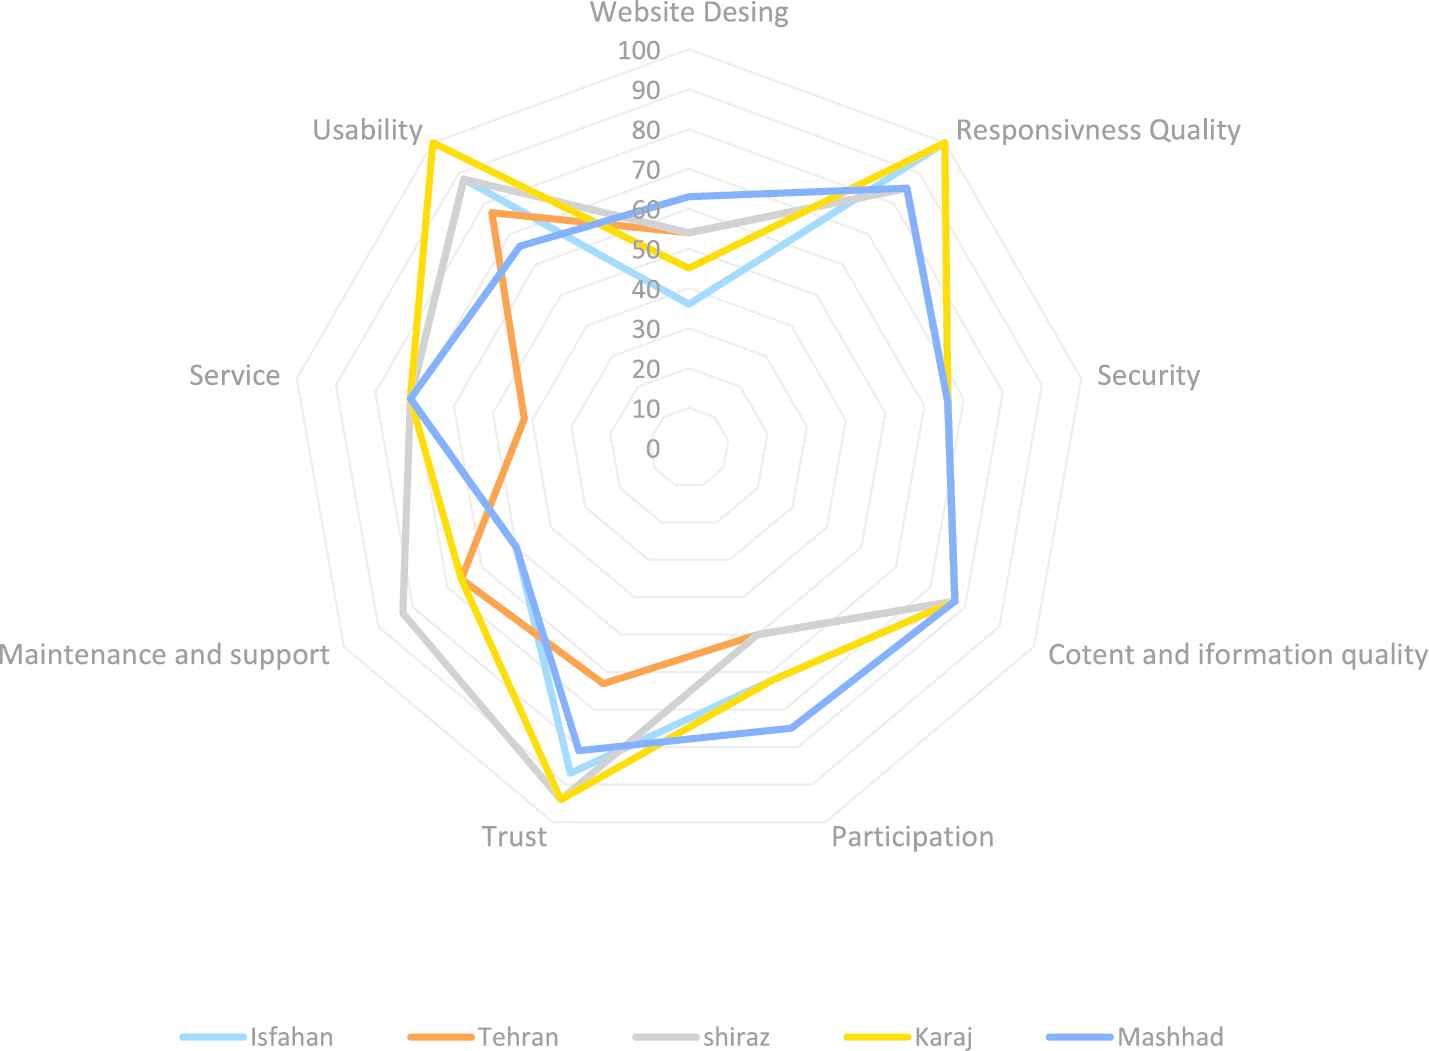
Status of e-government website indexes' on the websites.
7. DISCUSSION
In this study, a novel model was proposed for assessing e-government websites for Islamic Republic of Iranian state agencies. The model managed to recognize the preference of indexes and indicators by applying hybrid fuzzy MCDM methods. The final outcome shows that security is the most important index. The index mostly assesses required facilities for avoiding data leakage between servers and user's browsers. The high importance of the index was highlighted by [25,32]. Supporting different secure protocols such as SSL and HTTPS are the most indicators for enhancing security level. Sending alert message when an anonymous users log into user's account is the second indicator which intends to informs users and avoid any potential penetration. Data encryption is also computed as the fourth indicator which prevents user's personal information from being monitored by hackers.
Trust is the second most important index which evaluates citizen's trust to e-government services. The index also mentioned in different studies and have considered it as highly significant factor for encouraging people to use e-government services [30,31]. Organization honesty in delivering e-services is the most significant element. “User satisfaction in the past experience” is the second most important factor which has a direct effect on further usage of e-services by people. Service efficiency and effectiveness make the usage of e-services more comfortable and convenient which is seen as second indicator. User's familiarity with internet paves the way for users to apply e-services more easily. Such factor also has been computed as another important indicator. Avoiding sharing user's personal information with other people and organization cause to increase user's trust in using e-government services.
Content and information quality is another infrastructural index which assesses quality of information such as accuracy, updating, and precision. The high importance of the index was supported by [28]. Quality of information in different dimensions are assessed such as information updating (assessing the last information updating) and information precision and accuracy which evaluates how accurate presented information are. Presenting information in different formats enables users to use information regardless of their software or applications.
Responsiveness quality assesses how fast e-government websites respond to user's requests. The index considers different required services including applying low-size files and pictures on the user interface. Moreover, deploying website's servers inside the country is so helpful for increasing website's responsiveness. The index was supported by [28,29].
Website design is the fifth important index which is responsible for providing attractive user interface by using nice and beautiful color, font, and design. Moreover, providing personalized services and website compatibility with different web browsers and systems are considered. The importance of index was highlighted by [17].
Participation is another important index which evaluates the extent of citizen's participation with e-services through websites. Online survey and online complaints are taken into account in the index. Online polling and online meeting are two important facilities which help to increase citizen's participation in e-services. The importance of the index was supported by [6].
Support and maintenance is accountable for providing required tools for guiding people more efficiently for better ruse of e-services. Online support and maintenance are the most important facilities which help user to use services more efficiently. The high importance of the index was highlighted by [18].
Services is another important index which evaluates basic and fundamental online services. Online document and forms are the most basic facilities for fulfilling user's requests. Online payments also enable users to conduct online transactions which is seen as another basic online service. The high importance of the index was highlighted by [1].
Usability is the lease important index assessing required services for ease of use of online services. The accessibility 24×7 is the most important indicator which allows to provide online service around the clock during a week. Simple menu and search engine facilitates reaching to user's favorite information and services. The high importance of the index was supported by [6]
8. THEORETICAL AND PRACTICAL IMPLICATIONS
The paper is comprised of theoretical and practical implications. The main theoretical implications are as follows:
Proposing a model which is able to consider wider aspects of e-government services by recognizing various indexes and indicators. The model can monitor wider aspects of e-government services in comparison with previous studies which leads to increasing the accuracy of final outcome.
Applying fuzzy sets theory to model the existed ambiguity in the indexes and indicators. The method has a direct impact on increasing the final result's accuracy and precision.
The main practical implications are mentioned as follows:
The final result showed that security is the most important index in assessing e-government services. Policy makers are expected to provide a secure platform for exchanging information between server and user's browser in order to avoid any potential data leakage.
Trust assesses the extent of citizen's trust in e-government services and considered as second most important indicator. Policy makers should increase the user's trust in online services by enhancing state agencies' reputation. In addition to it, policy makers should create an appropriate platform for providing public education aimed at increasing user's knowledge and information about internet.
Content and information quality is the third important index which assesses the quality of information in different aspects including updating, accuracy, precision, and presenting information in different formats. Policy makers are expected to provide regular assessment of presented information on the websites and make sure about the quality of information in different dimensions.
9. CONCLUSION
The purpose of paper is to develop a model for assessing e-government websites. To achieve this, the model is designed based on multi-criteria decision-making and fuzzy sets theory in which the fuzzy AHP was used to weigh the indexes and the “fuzzy PROMETHEE” method is applied to rank the indicators. The most effective indexes and indicators for assessing e-government website are extracted from previous which is able to assess wider dimensions of e-government websites. Then, using the e-government expert's opinion, the effect of model indexes on assessing the readiness of e-government websites are obtained by expert's judgments. The model's indexes are ranked based on their importance as “security,” “trust,” “content quality,” “responsiveness quality,” “website design,” “participation,” “web support,” “diversity of services,” and “usability.”
Then the proposed model was applied to assess the readiness of the five metropolitan Iran's municipality websites. The final results shows that the assessed websites has got highest readiness in the following indexes as “responsiveness quality” (91 percent), “usability” (83), and “trust” (83) and the least readiness in “website design” (54), “participation” (59), and “maintenance and support” (63). The highest and lowest website readiness are Karaj (78%) and Tehran (73%) respectively.
Due to ambiguity in decision environments and different in decision maker's cultures, it is highly recommended as future study to apply multi-attribute group decision-making (MAGDM) based on multi-granular HFLTSs to better modeling the existed ambiguity in the problem for difference in environment and decision maker's culture [39,62]. Moreover, fuzzy preference relation with self-confidence (FPR-SC) is also suggested as future study to better model decision maker's judgments and opinions over various alternatives [40].
CONFLICTS OF INTEREST
The authors declare they have no conflicts of interest.
AUTHORS' CONTRIBUTIONS
Methodology, Masoud Shayganmehr, Gholam Ali Montazer; Analysis, Masoud Shayganmehr; Validation, Masoud Shayganmehr, Gholam Ali Montazer; Original Draft Preparation, Masoud Shayganmehr, Gholam Ali Montazer; Writing, Masoud Shayganmehr, Gholam Ali Montazer.
Funding Statement
The authors declare that they have no known competing financial interests or personal relationships that could have appeared to influence the work reported in this paper.
REFERENCES
Cite this article
TY  - JOUR
AU  - Masoud Shayganmehr
AU  - Gholam Ali Montazer
PY  - 2021
DA  - 2021/05/03
TI  - A Novel Model for Assessing e-Government Websites Using Hybrid Fuzzy Decision-Making Methods
JO  - International Journal of Computational Intelligence Systems
SP  - 1468
EP  - 1488
VL  - 14
IS  - 1
SN  - 1875-6883
UR  - https://doi.org/10.2991/ijcis.d.210423.002
DO  - 10.2991/ijcis.d.210423.002
ID  - Shayganmehr2021
ER  -