
Selecting Multiple Evaluator’s Perception-Oriented Relevant Physical Features of Consumer Goods by Using Fuzzy Data Sensitivity and OWA Operators
- DOI
- 10.1080/18756891.2016.1149997How to use a DOI?
- Keywords
- feature selection; fuzzy logic; data sensitivity; OWA operators; Multi-criteria decision making; percolation technique
- Abstract
The assessment of goods quality using experts is costly task in addition to their often unavailability. In this paper, we present a new method for ranking physical features of consumer goods according to their relevancy to multiple evaluators’ perception at different levels and selecting the most important ones for quality characterization. The main contribution of the paper is combining of fuzzy method and ordered weighted averaging (OWA) operators to achieve our aim. The proposed selection method, considered as a Multi-Evaluators and Multi-Criteria Decision Making (ME-MCDM) technique, has been developed using fuzzy sensitivity (FS) criterion for ranking and OWA operator to aggregate the aforementioned ranking lists. Finally, by introducing a smart percolation technique we get automatically the most relevant physical features for a given sensory descriptor. The suggested approach is applied to a selection problem of textile physical features.
- Copyright
- © 2016. the authors. Co-published by Atlantis Press and Taylor & Francis
- Open Access
- This is an open access article under the CC BY-NC license (http://creativecommons.org/licences/by-nc/4.0/).
1. Introduction
In different consumer industrial sectors (food, textile and apparel, cars, furniture, cosmetics…), quality of products is generally evaluated in two aspects: 1) sensory evaluation and 2) physical evaluation. Sensory evaluation permits to characterize human perception with a panel of trained evaluators who evaluates consumer goods using a normalized procedure (perceived quality)1. It is very close to markets and consumer’s behaviors but includes uncertainty and imprecision due to the involvement of human factors. Moreover, it is often difficult to quickly gather qualified evaluators to perform evaluation sessions on product quality due to their individual time availability. It is for these reasons that physical evaluation on consumer goods using measuring devices is more acceptable in industrial companies, especially for those who wish to design high quality consumer goods by engineering means2. Industrial norms on product quality are generally developed using physical evaluations3. A physical evaluation of consumer goods is performed by measuring a set of normalized physical features. It leads to precise numerical data about product quality but is relatively far from human perception on consumer goods and its interpretation with respect to human feeling should be further exploited4. For consumer goods, understanding of the relation between measured physical features and quality perceived by consumers or professional experts is very important to rely subsequently on measuring devices rather than evaluators’ groups whose availableness cannot constantly be assured. It can effectively help to define and explain quality norms with respect to human perception on finished products5.
In practice, the number of measurable physical features characterizing quality of consumer goods is very large. These features are often redundant between them and not all relevant to human perception on product quality. For defining appropriate norms of consumer goods, it is necessary to reduce the quality feature space so that only the physical features the most relevant to human perception are considered in quality characterization6–8.
Selection of relevant features is an important topic which has attracted many researchers for reducing the search space and the complexity of the problem to be processed7,9. Indeed, relevant variables selection has been widely applied to pattern recognition, system modeling and data mining. The definition of the criterion of relevancy depends on the specific problems to be solved and then it has different versions in the literature. These definitions can be summarized in some sense using a general statement given by Blum and Langley10.
A variable x is relevant to a target concept c if there exists two examples A and B in the instance space such that A and B differ only in their assignment to x and c(A) ≠ c(B).
In the existing literature, the classification based feature selection using the supervised learning strategy has been frequently used in different applications. Its selection objective is to improve the classification accuracy or class label predictive accuracy of data samples. Several well-known methods include the decision-tree method11, the fuzzy TOPSIS (Technique for Order of Preference by Similarity to Ideal Solution) and fuzzy AHP (Analytic Hierarchy Process) to aid the selection decision process, have been developed using fuzzy techniques12,13. Deng et al.8 proposed a feature selection method by using the Fuzzy Combination of Data Sensitivity and Human Knowledge (FCDSHK). Compared with the classification-based feature selection methods, it is more efficient for dealing with very few numbers of experimental data and capable of integrating both experimental data and human professional knowledge into the ranking or selection procedure. Its effectiveness has been validated in many industrial applications, especially in the selection of relevant manufacturing process parameters (input variables) for a given quality feature (output variable)8.
In this paper, different from the previous applications of FCDSHK in which the output variable is a unique and normalized magnitude, we extend this method to the selection or ranking of relevant physical features of consumer goods related to quality evaluation scores provided by different evaluators14. As these evaluators consider the product quality according to different criteria, a direct aggregation of their evaluation results is not physically significant and can not completely characterize the difference between these criteria. In this context, we propose to develop an appropriate aggregation of the ranking results provided by different evaluators, which is more significant and can be more easily adjusted by production and quality experts using their professional knowledge.
The aggregation of different ranking lists for a set of alternatives with single or multiple criteria has been encountered in many real scenarios and widely studied by researchers15. The earliest contributions in this area were given by Borda and Kendall16. Recently, the Ordered Weighted Averaging (OWA) operators, introduced by Yager17, have shown their good performance for aggregating ranking lists in different applications in decision making14,18,19. They can provide more choices and more flexibility than the Borda-Kendall method20. A fundamental aspect of this operator is the re-ordering step, in particular an aggregate ai is not associated with a particular weight wi but rather a weight is associated with a particular ordered position of aggregate. When we view the OWA weights as a column vector we shall find it convenient to refer to the weights with the low indices as weights at the top and those with the higher indices with weights at the bottom21. Actually, the OWA methods have been applied in preferential voting and election systems22, parameterized estimation of fuzzy random variables23, and queuing systems of hospital’s databases24.
The problem of determining weights for an OWA operator can be addressed in different ways, for example with the use of the so-called linguistic quantifiers, introduced by Zadeh25. A relative linguistic quantifier Q, such as most, few, many and all, can be represented as a fuzzy subset of the unit interval, where for a given proportion r ∈ [0, 1] of the total of values to aggregate, Q(r) indicates the extent to which this proportion satisfies the semantics defined in Q. Regular Increasing Monotone (RIM) quantifiers are especially interesting for their use in OWA operators21. A quantifier Q is called RIM wherever Q(0) = 0, Q(1) = 1, if r1 > r2 then Q(r1 ≥ Q(r2). Yager17,26 suggested to compute weights wi with the use of a RIM quantifier Q following Eq. (5).
In this paper, we aggregate the ranking lists by using the OWA operators. For this purpose, the well-known Regular Increasing Monotone (RIM) linguistic quantifier Qα(r) is applied14,27. In this quantifier, a number of linguistic principles provided by the evaluators are taken into consideration for determining the weights (Section 2.1.1).
The proposed procedure is illustrated by a real case for selecting the most relevant physical features of washed denim fabrics with respect to fabric hand feeling. The perceived quality on fabric hand has been evaluated by two different panels of evaluators. The first one is composed of 6 evaluators, selected from general public and who have received training of quantitative sensory evaluation techniques. It is used to assess and classify 41 fabric samples using a number of sensory descriptors frequently used in fabric hand evaluation. The second one, composed of 8 experts, is a panel mastering professional knowledge in textile metrology and mechanical features of fabrics. These experts have not received training on sensory evaluation. The second panel aims to provide complementary information in order to adjust the ranking list obtained previously towards the professional knowledge given by the experts.
Therefore, this paper aims to develop a new decision making method which takes care of suitable objective and subjective criteria selection and proper evaluation of the alternatives treating it as a MCDM problem using two kinds of panel of evaluators. The proposed approach integrates experimental data, human professional knowledge, fuzzy data sensitivity and OWA operators to select automatically the set of the most relevant features from irrelevant ones. The number of features is automatically determined by the proposed percolation technique. In order to do so, the remainder of this paper is set out as follows. Each functional block of the proposed methodology is described in Section 2. In Section 3, selection of washed denim fabric physical features is applied in order to validate the effectiveness of the proposed approach. Conclusions are presented in Section 4.
2. Proposed method for selecting relevant features
The general structure of the proposed relevant physical features selection procedure with respect to one single sensory descriptor and multiple evaluators is described in Fig. 1. It is composed of six functional blocks. From the set of S samples, m features are measured using physical devices. Besides, all the samples are evaluated by n trained evaluators (Panel 1) using different normalized sensory descriptors.
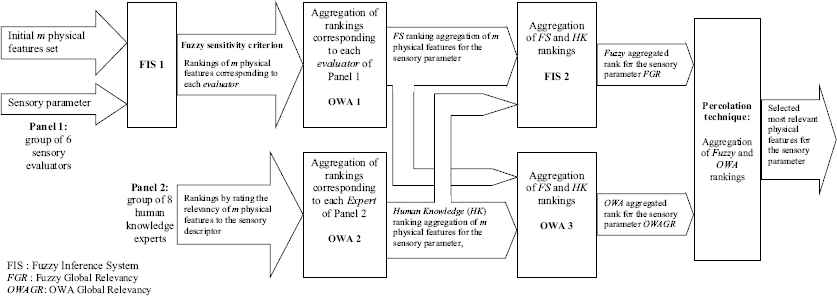
Integrated approach for selecting the set of relevant physical features to one sensory descriptor
Based on these measured and evaluated data, the fuzzy inference system (FIS1) block generates a number of ranking lists of physical features by computing the fuzzy sensitivity (FS) criterion of all the physical features to each specific sensory descriptor delivered by different evaluators. Each ranking list corresponds to one evaluator. Next, all these ranking lists are aggregated using an OWA operator (OWA1) in order to generate an aggregated ranking list for all the evaluators related to the sensory descriptor. In the same time, a number of professional experts specialized in manufacturing processes and product quality (Panel 2) give their ratings on the relevancy of each physical feature to each sensory descriptor. In practice, professional experts generally master knowledge about the relationship between physical measures and perceived quality of consumer goods but it is incomplete and uncertain. For exploiting the complementary knowledge provided by the experts, we use another OWA operator for aggregating these different human knowledge (HK) sources (OWA2). Next, the ranking lists obtained from OWA1 will be combined with the aggregated human knowledge generated by OWA2 using fuzzy logic and another OWA respectively. We obtain then two new aggregated ranking lists of physical features for each sensory descriptor, i.e. the fuzzy data sensitivity-based ranking list (FIS2) and the OWA aggregated ranking list (OWA3). Finally, by using the percolation technique, we combine the two previous ranking lists to generate the final comprehensive ranking list for each sensory descriptor. The physical features selected from this ranking list is capable of taking into account the sensitivity of measured physical data to human perception, the difference between multiple evaluators on perceived quality and complementary knowledge provided by different professional experts. This overall procedure can be carried out for different sensory descriptors.
In the illustrative example of relevant physical feature selection for washed denim fabrics, we produce 41 basic denim fabrics (S=41) using different washout treatments. These samples have been measured in the testing laboratory and evaluated by a panel of six evaluators having received sensory evaluation training (Panel 1).
The values extracted from the physical measures and sensory evaluations have been normalized into the range of [0, 1]. The total number of physical features on the 41 denim fabric samples is m=20, including direct and indirect measured features (Table 1). The direct measures are realized directly from the related measuring devices. The indirect measures are calculated from the direct measures according to the known physical laws28,29. Also, the same samples are evaluated by the 6 trained evaluators using 9 predefined subjective sensory descriptors: smooth, fluffy, full, supple, elastic, wrinkle, soft, cold, and sliding. For each sensory descriptor, each evaluator provides an evaluation score to each fabric sample.
| Ref. | Physical feature | Feature description | Equipment (standard) |
|---|---|---|---|
| x1 | T2 (mm) | Thickness at 2gf | Fabric Assurance by Simple Testing: FAST system |
| x2 | St (mm) | Surface thickness | |
| x3 | B1 (μN.m) | Warp bending rigidity | |
| x4 | B2 (μN.m) | Weft bending rigidity | |
| x5 | F1 (mm2) | Warp formability | |
| x6 | F2 (mm2) | Weft formability | |
| x7 | G (N/m) | Shear rigidity | |
| x8 | E1001 (%) | Warp extensibility at 100 gf | |
| x9 | E1002 (%) | Weft extensibility at 100 gf | |
| x10 | Pic of tension (N) | Peak of tension | Stiffness tester (ASTM D4032) |
| x11 | Pic of comp. (N) | Peak of compression | |
| x12 | F | Drape coefficient | Drape meter (NF G07-109) |
| x13 | MIU1 | Warp friction coefficient | Kawabata Evaluating System for Fabrics ‘KES-F’ |
| x14 | MIU2 | Weft friction coefficient | |
| x15 | SMD1 | Warp roughness | |
| x16 | SMD2 | Weft roughness | |
| x17 | Mass (g/m2) | Fabric weight by unit area | Balance (EN 12127) |
| x18 | P.air (l/m2/s) | Air permeability | Air permeability device (ISO 9237) |
| x19 | Elast1 (μm) | Warp elastic deformation | Universal Surface Tester (UST) |
| x20 | Elast2 (μm) | Weft elastic deformation | |
Description of the physical features
2.1. Selection of relevant physical features using fuzzy sensitivity (FIS1 model)
The fuzzy sensitivity criterion FS for all the physical features related to a sensory descriptor is defined in Section 1 according to the same principles given by Blum and Langley10. These principles are transformed into a set of fuzzy rules for building a Fuzzy model in which the physical data variation Δx (distance between two normalized vectors in the physical feature space) and the sensory data variation Δy (distance between two normalized values of one specific sensory descriptor) are taken as two input variables, respectively, and the general sensitivity FS as output variable (model FIS1 in Fig. 1). Evidently, FS is a function of Δx and Δy, denoted as FS = FIS1 (Δx, Δy). This fuzzy model includes an interface of fuzzification, a base of fuzzy rules, an inference mechanism and an interface of defuzzification.
The fuzzification procedure aims to uniformly partition each of the two input variables into three fuzzy values: Small (S), Medium (M) and Big (B). The output variable is a fuzzy variable varying from 0 to 1 and composed either of three fuzzy values: Small (S), Medium (M) and Big (B) (illustrated in Fig. 2)30.
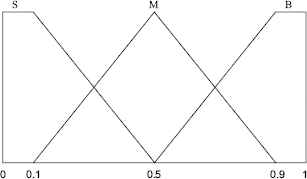
Fuzzy values for each input and output data variable in FIS1 model
According to the experience of the quality experts on the relationship between physical and sensory parameters, a set of fuzzy rules are defined in Table 2. As the output variable includes fuzzy values, Mamdani’s fuzzy inference method is used for aggregating these fuzzy rules and obtaining defuzzified output values31.
| FS | And | Δy |
||
|---|---|---|---|---|
| Small | Medium | Big | ||
| Δx | Small | Small | Big | Big |
| Medium | Small | Medium | Big | |
| Big | Small | Small | Medium | |
Fuzzy rules of fuzzy sensitivity criterion
Given a specific sensory descriptor yβ, for any pair of data samples (Xi, yiβ) and (Xj, yjβ) denoted as (i, j), the physical data variation d(Xi, Xj) is calculated as follows:
The corresponding sensitivity in the data pair (i, j) related to yβ, denoted as FSβ(i, j), can be obtained from the fuzzy model FIS1, i.e. FSβ (i, j) = FIS1(d(Xi, Xj), d(yiβ, yjβ)). FSβ(i, j) can be considered as a measure of information content of all the physical features in the pair (i, j) related to the sensory descriptor yβ.
When removing xk from the whole set of physical features, the sensitivity of the remaining physical features in the data pair (i, j) related to the sensory descriptor yβ can be calculated in (2)
The general fuzzy sensitivity criterion FSk,β for all the pairs of data samples when removing the physical feature xk is defined in (3)
Clearly, when FSk,β < FSp,β for all p≠k, then the removed physical feature xk is considered as the least relevant among all physical features.
The FS criterion FSk,β is normalized in [0,1]. In this way, the closer the value of FSk,β is to 1, the more the physical feature xk is relevant to the sensory descriptor yβ. The closer the value of FSk,β is to 0, the less the physical feature xk is relevant to the sensory descriptor yβ.
Based on the fuzzy sensitivity criterion defined in (3), an algorithm for selecting the most relevant physical features and ranking all the physical features is proposed. The principle of this algorithm is illustrated in Fig. 3.
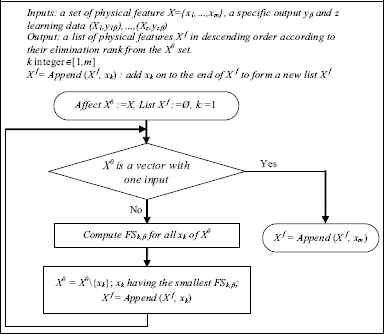
The algorithm for ranking physical features using fuzzy sensitivity criterion
2.1.1. Aggregating FS rankings using OWA1 operator weights for Panel 1
After the application of the fuzzy model (FIS1), we obtain a number of ranking lists of all the m physical features for a given sensory descriptor. Each ranking list corresponds to the evaluation scores provided by one trained evaluator. In our approach, only the rank values of physical features are significant for further aggregation because the values of the Fuzzy Sensitivity criterion FS are less significant. In fact, their absolute values cannot be compared to each other since they are generated from different selection loops. In a ranking list of m physical features, the rank value of the most relevant one is m; that of the second one is m−1, and so on. The value of the worst ranked feature is 1.
Before computing the aggregation for different ranking lists, we test the sensitivity of each evaluator to the physical features in order to ensure their equipollency. Then, we use an OWA operator derived from the Regular Increasing Monotone (RIM) linguistic quantifier and the corresponding weight definition to set up the formula of the weights21.
Indeed, by applying the RIM linguistic quantifier, the weight of the ith evaluator is obtained as follows:
By definition, an OWA operator of n dimensions is a mapping F : ℛn → ℛ with an associated weight vector W = (w1,...,wn)T such that
We suppose that a specific physical feature is selected by the aggregation. By applying an OWA operator to the ranking scores given by all the n evaluators, denoted as a1,…,an, and the previous aggregation principle and weight definition, we have:
This operator is a re-ordering processing. During the aggregation, the value ai is not associated with wi but with another weight obtained by comparing all the m rank values. The weights with lower indices correspond to more important features and those with higher indices to less important features. As the minimal condition for being selected corresponds to the aggregated rank m−Ns+1, the coefficient α can be calculated from the following equation:
2.1.2. Aggregating human knowledge experts (Panel 2) using OWA2 operator weights
To validate the previous ranking lists given by FIS1 and OWA1 and provide knowledge-based complementary information in order to adjust the obtained ranking lists, we integrate the results of another panel composed of q professional experts (Panel 2). The experts of this panel have not received training on sensory evaluation but master professional knowledge on products and processes. Their role is to classify the physical features according to their relevancy to each given sensory descriptor. Each expert assigns values to each of the m physical features from the set of (1, 2, 3, 4), in which 4 stands for relevant, 3 moderately relevant, 2 little relevant and 1 no relation. For each sensory descriptor, the aggregated ranking list of the physical features for all the q experts of Panel 2 can be obtained by using another OWA operator (OWA2 model), whose principle is same to that described in Section 2.1.1.
2.2. Combination between FS and human knowledge (HK) rankings
The two previous ranking lists, i.e. the fuzzy sensitivity FS and the HK are combined in order to obtain a Global Relevancy (GR) value. At this stage, two aggregation techniques, i.e. Fuzzy Inference System (FIS2) and OWA (OWA3) (see Fig. 1) are applied in order to compare their results. In fact, the weights issued from the FIS2 aggregation is a result of a linear (triangular) membership functions managed by fuzzy rules whereas the weights obtained from the OWA3 are extracted drawing upon Zadeh’s concept of linguistic quantifiers32. These two aggregation techniques will be detailed right after. If both of them yield similar results, we consider that the obtained aggregation result is reliable. In both cases, the obtained GRs are robust and can effectively avoid the discrepancy in the ranking lists obtained from OWA1 and OWA2 due to the sensitivity of experimental data, the perceptual divergence of human evaluators and professional knowledge.
2.2.1. Using the FIS2 fuzzy model (FGR)
The combination is based on the fuzzy rules presented in Table 3, obtained from the common qualitative knowledge. All the scores have been normalized in the range of [0, 1] to eliminate the scale effects.
| FGR scores (FIS2) | And | FS (OWA1) |
||||
|---|---|---|---|---|---|---|
| Very relevant | Relevant | Average relevant | Slightly relevant | Not relevant | ||
| HK (OWA2) | Very relevant | Very relevant | Very relevant | Very relevant | Very relevant | Not relevant |
| Relevant | Very relevant | Relevant | Relevant | Slightly relevant | Not relevant | |
| Average relevant | Very relevant | Relevant | Average relevant | Slightly relevant | Not relevant | |
| Slightly relevant | Very relevant | Slightly relevant | Slightly relevant | Slightly relevant | Not relevant | |
| Not relevant | Not relevant | Not relevant | Not relevant | Not relevant | Not relevant | |
Fuzzy rules for aggregating FS and HK rankings
These fuzzy rules are used to build a fuzzy model in which FS and HK are taken as two input variables and the Fuzzy Global Relevancy score as output variable (FGR). The input and output variables are fuzzy variables each including five fuzzy values: Not Relevant (NR), Slightly Relevant (SR), Average Relevant (AR), Relevant (R) and Very Relevant (VR) (illustrated in Fig. 4).
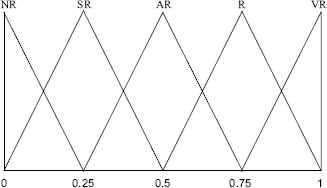
Fuzzy values for each input and output data variable in the FIS2 model
Obviously, the output variable FGR varies in the interval of [0, 1]. The closer the value of FGR is to 1, the more the corresponding variable xk is relevant.
2.2.2. Using the OWA3 model (OWAGR)
Similarly to OWA1 and OWA2, in order to generate the weights of OWA3 we consider that the ranking lists yielding from OWA1 and OWA2 have equal chances. We translate equal chances by the following linguistic principle: if a physical feature is ranked in the extreme case at the top of the first ranking (FS ranking) and at the bottom of the second ranking (HK ranking) then, it should be in the middle of the overall ranking (i.e. his overall score is equal to m/2). Hence, the weights of OWA3 are generated using the RIM linguistic quantifier where the coefficient α is obtained from Eq. (7) with n=2, p=1, k=1 and Ns=m/2+1, i.e.
2.3. Distinctness between relevant and irrelevant physical features
Until this stage, the role of the aggregation techniques used previously (Fuzzy or OWA) is restricted in building a single operation of aggregation and provide a ranking by relevance. However, for each ranking list, the scores of the physical features are usually closed each other. Therefore, we need to determine an appropriate threshold in order to separate the set of relevant physical features from irrelevant ones.
The key issue of the proposed percolation technique is to filter automatically and objectively the relevant features by creating a gap between scores of relevant and irrelevant physical features. It permits to automatically generate threshold that can effectively reduce human subjectivity and arbitrariness when manually choosing thresholds. For a specific sensory descriptor, the threshold is defined systematically by iteratively aggregating (n times) the ranking lists generated by OWA3 and FIS2.
The complete percolation technique algorithm is summarized below:
- 1)
Initialize the percolation technique algorithm by obtaining FGR and OWAGR rankings respectively from FIS2 and OWA3 models of the previews functional blocks as shown in Fig. 1.
- 2)
Repeat Until AE < ε
- a)
Merge FGR and OWAGR rankings using FIS2 model to obtain a new FGR ranking
- b)
Merge FGR and OWAGR rankings using OWA3 model to obtain a new OWAGR ranking
- c)
Calculate the fuzzy and OWA Absolute Errors ‘AE’ for two consecutive iterations, i.e.
- a)
- 3)
Generate the final FGR and OWAGR percolated ranking lists.
In our experiments, ε is chosen so that the error AE is less than or equal to 1% of the maximal values of FGR. Since the latter is normalized, then we may choose ε =0.01. In general, if the percolation algorithm converges very quickly, then ε can be smaller in order to obtain more precise results. However, if the convergence is slow, ε can be larger in order to reach a faster convergence.
The proposed percolation technique can effectively filter or select the relevant input variables because it’s capable of making a sharp difference between the scores of the relevant and irrelevant ones.
3. The case study – Selection of stonewashed denim fabric physical features
In this real example, we select the most relevant physical features related to hand feeling of a well known finished textile product especially the stonewashed denims, usually considered as the most important quality criteria in jeans’ evaluation. The corresponding parameters, including 9 normalized sensory descriptors provided by quality evaluators, 20 physical features measured using devices, and the nature of the evaluation panels (Panel 1 and Panel 2), have been described in the previous sections.
3.1. Aggregated ranking lists generated by FIS1-OWA1 and HK-OWA2
Using OWA1, we select the six most relevant features (Ns=6) from a total of m=20 physical features. Six evaluators (n=6) perform fabric hand evaluation on the selected samples. A physical features is considered relevant if the aggregated rank score is no smaller than m − Ns + 1 = 15. For a specific physical feature, if two-thirds of the evaluators (k=4) consider it as one of the p most relevant features (p=4), then we obtain from Eq.(5) and Eq.(6):
| w1 | w2 | w3 | w4 | w5 | w6 | Σ wi | |
|---|---|---|---|---|---|---|---|
| Smooth | 0.554 | 0.142 | 0.099 | 0.079 | 0.067 | 0.058 | 1.000 |
| Fluffy | 0.589 | 0.151 | 0.106 | 0.084 | 0.071 | 0 | 1.000 |
| Full | 0.633 | 0.162 | 0.114 | 0.090 | 0 | 0 | 1.000 |
| Supple | 0.589 | 0.151 | 0.106 | 0.084 | 0.071 | 0 | 1.000 |
| Elastic | 0.589 | 0.151 | 0.106 | 0.084 | 0.071 | 0 | 1.000 |
| Wrinkle | 0.633 | 0.162 | 0.114 | 0.090 | 0 | 0 | 1.000 |
| Soft | 0.633 | 0.162 | 0.114 | 0.090 | 0 | 0 | 1.000 |
| Cold | 1.000 | 0 | 0 | 0 | 0 | 0 | 1.000 |
| Sliding | 1.000 | 0 | 0 | 0 | 0 | 0 | 1.000 |
Aggregation weights for OWA1
After interviewing the experts of Panel 2, we found that all of them agreed on the following principle: if a physical parameter has all but two excellent assigned values then his overall score should be about 3.75, which is a cut-off value for the relevant physical feature to a sensory one27. In other words, by applying this principle to OWA2, a physical feature is considered as relevant if at least six (k=6) of the eight experts (n=8) in Panel 2 take it as relevant (the assigned value is 4). Then, the final score should be m − Ns + 1 = 3.75. In this case (application of OWA2), we have m=4 and p=1.
According to Eq. (5), we calculate the weights for all the sensory descriptors, shown in Table 5.
| w1 | w2 | w3 | w4 | w5 | w6 | w7 | w8 | Σ wi | |
|---|---|---|---|---|---|---|---|---|---|
| For each sensory parameter | 0.533 | 0.124 | 0.086 | 0.068 | 0.057 | 0.049 | 0.044 | 0.040 | 1.000 |
Aggregation weights for OWA2
By aggregating the ranking lists given by different evaluators in Panel 1 and Panel 2, we obtain the scores and ranking lists for three sensory descriptors, presented in Table 6.
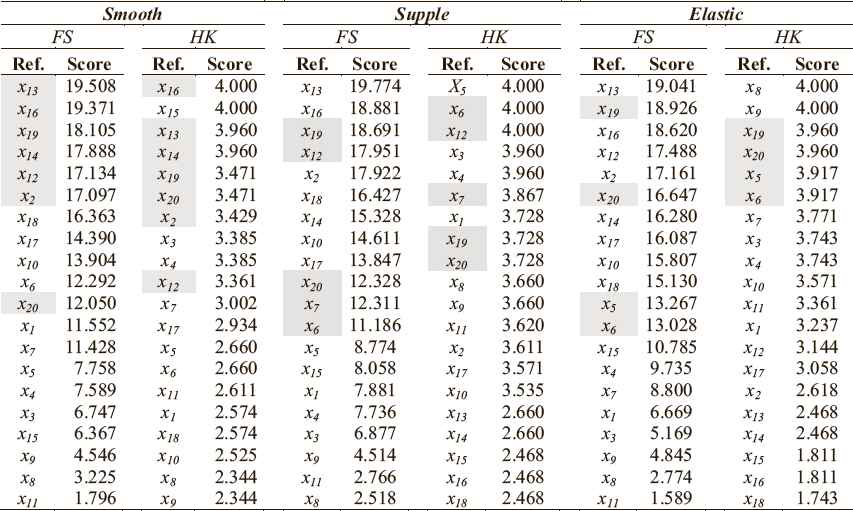
Aggregation results obtained from OWA1 (FS) and OWA2 (HK) for three sensory descriptors
For instance, when considering the sensory descriptor “Smooth”, the physical parameters (x13, x16, x19, x12, x2) have been classified on top of relevant parameters by OWA1. When using OWA2 the same parameters have been considered as most relevant but in addition to the physical parameter x15 which was classified on bottom of the list using OWA1.
In order to make more reliable decisions in selection of relevant physical features, it is necessary to further combine these two ranking lists. The combination is performed using two different approaches, i.e. FIS2 and OWA3.
3.2. Aggregated ranking lists generated by FIS2 and OWA3
Having obtained the aggregated ranking lists with OWA1 and OWA2 models, we further aggregate them to form the final ranking list of physical features for each specific sensory feature. This combination will permit to integrate both sources of information (perception of sensory evaluators and professional knowledge of experts) and overcome the sensitivity of experimental data and perceptual divergence of human evaluators.
The combination using fuzzy techniques (FIS3) takes FS and HK as fuzzy input variables and fuzzy global relevancy FGR as output variable. The five membership functions for these fuzzy variables are presented in Fig. 4.
The combination using OWA3 is based on the following rule: if a physical feature has, in the most divergent condition, a good score in one ranking list and bad score in another one, then its overall ranking score should be around 10. Therefore, by applying Eq. (6) and (7), we have:
According to the Eq. (5), we deduce the following weights (0.526 0.474) for aggregating the FS and HK ranking lists respectively, to obtain the OWA global relevancy OWAGR ranking list.
By using the two previous combination methods (FIS2 and OWA3), we obtain the values of FGR and OWAGR respectively and then can easily rank the 20 physical features from the most to the least relevant one. Indeed, in Table 7 and for “Smooth” sensory descriptor, FGR and OWAGR agreed that the eight most relevant physical features are (x2, x12, x13, x14, x15, x16, x19, x20) although with different classifications. However, we cannot sharply distinguish the relevant features from irrelevant ones due to very close aggregated scores between them (See Table 7). At the next step, we use the percolation technique to cause an abrupt variation in the scores of the relevant and irrelevant features.
| Smooth |
Supple |
Elastic |
|||||||||
|---|---|---|---|---|---|---|---|---|---|---|---|
| OWAGR |
FGR |
OWAGR |
FGR |
OWAGR |
FGR |
||||||
| Ref. | Score | Ref. | Score | Ref. | Score | Ref. | Score | Ref. | Score | Ref. | Score |
| x16 | 0.996 | x16 | 0.920 | x12 | 0.950 | x6 | 0.920 | x19 | 0.988 | x13 | 0.914 |
| x13 | 0.989 | x15 | 0.920 | x19 | 0.883 | x12 | 0.909 | x20 | 0.926 | x19 | 0.905 |
| x14 | 0.944 | x13 | 0.919 | x2 | 0.823 | x5 | 0.908 | x5 | 0.824 | x20 | 0.867 |
| x19 | 0.807 | x14 | 0.862 | x6 | 0.764 | x19 | 0.825 | x6 | 0.817 | x5 | 0.848 |
| x2 | 0.765 | x19 | 0.812 | x7 | 0.749 | x7 | 0.806 | x10 | 0.812 | x6 | 0.844 |
| x12 | 0.747 | x12 | 0.778 | x20 | 0.702 | x2 | 0.792 | x12 | 0.773 | x12 | 0.794 |
| x15 | 0.648 | x2 | 0.777 | x10 | 0.699 | x20 | 0.761 | x17 | 0.713 | x17 | 0.764 |
| x20 | 0.632 | x20 | 0.670 | x5 | 0.698 | x3 | 0.731 | x4 | 0.687 | x10 | 0.759 |
| x17 | 0.543 | x17 | 0.475 | x17 | 0.690 | x4 | 0.715 | x13 | 0.678 | x4 | 0.668 |
| x18 | 0.498 | x4 | 0.456 | x4 | 0.655 | x17 | 0.706 | x7 | 0.668 | x9 | 0.657 |
| x4 | 0.486 | x7 | 0.450 | x3 | 0.632 | x10 | 0.690 | x2 | 0.653 | x7 | 0.574 |
| x7 | 0.474 | x18 | 0.370 | x13 | 0.585 | x13 | 0.501 | x9 | 0.614 | x2 | 0.550 |
| x3 | 0.463 | x3 | 0.365 | x1 | 0.580 | x1 | 0.436 | x14 | 0.595 | x3 | 0.483 |
| x10 | 0.411 | x5 | 0.242 | x16 | 0.499 | x9 | 0.287 | x3 | 0.563 | x14 | 0.467 |
| x6 | 0.402 | x6 | 0.241 | x9 | 0.464 | x14 | 0.218 | x8 | 0.558 | x1 | 0.381 |
| x1 | 0.355 | x1 | 0.224 | x14 | 0.450 | x11 | 0.119 | x16 | 0.527 | x8 | 0.356 |
| x5 | 0.267 | x10 | 0.209 | x18 | 0.424 | x15 | 0.086 | x1 | 0.486 | x16 | 0.248 |
| x11 | 0.085 | x9 | 0.089 | x8 | 0.409 | x18 | 0.084 | x18 | 0.408 | x15 | 0.135 |
| x9 | 0.082 | x11 | 0.088 | x11 | 0.402 | x16 | 0.083 | x11 | 0.377 | x11 | 0.082 |
| x8 | 0.042 | x8 | 0.087 | x15 | 0.169 | x8 | 0.081 | x15 | 0.291 | x18 | 0.081 |
Aggregation of the ranking lists by using FIS2 (FGR) and OWA3 (OWAGR) for three sensory descriptors
3.3. Separation of the relevant physical features from irrelevant ones
Having applied the percolation method described in Section 2.3 with ε = 10−4, we can observe that the set of relevant physical features is separated as shown in Table 8. The number of iterations needed to achieve the convergence is around 26. When we change the percolation threshold to ε = 0.01, similar results are obtained within about 15 iterations.
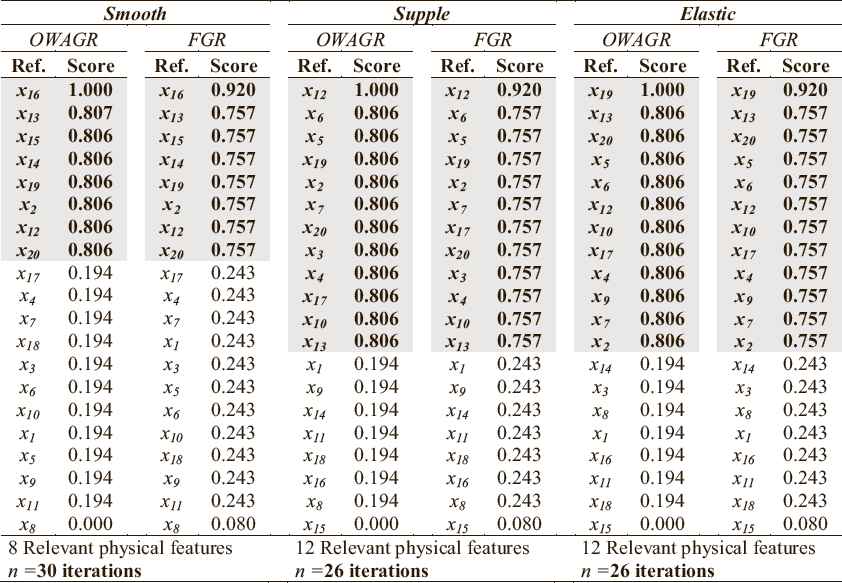
Extraction of the set of the relevant physical features
Having applied the percolation technique, we separate the relevant physical features from irrelevant ones for each sensory descriptor. The results of three descriptors are shown in Table 8. From the final scores, we can clearly note that the relevant features are very different from the irrelevant ones. Besides, we can easily observe that the most relevant features have not changed when comparing Table 7 and Table 8. Nevertheless, apparently the order of the physical features changes after applying percolation, yet the scores several physical features are identical therefore, the order is indeed not different. For the presented descriptors, the numbers of relevant physical features vary: 8 selected relevant features for “Smooth” and 12 for “Supple” and “Elastic”. The originality and performance of the proposed relevant feature selection method can be shown from these various results. Instead of selecting identical numbers of features with a predefined threshold, the proposed method can be adapted to the specific natures of the complex relations between sensory descriptors and physical features, in order to propose lists of relevant features of different sizes for different descriptors.
In the real application of stone washed denim fabrics, the final physical feature selection results can be validated by the professional textile knowledge or results in textile research. Some analysis is given below. The relevant physical features for the descriptor “Smooth” include: surface thickness “St” (x2), coefficient of friction “MIU” (x13 and x14), geometric roughness “SMD” (x15 and x16) and the elastic deformation of the surface texture (x19 and x20). Obviously, all the surface features are selected except the drape coefficient “F” (x12). “F” is a parameter that describes the way in which fabric flows or falls with gravity. From the point of physical view, this feature is less related to surface smoothness. Nevertheless, the relevancy of “F” to smoothness can be validated by the study given by Hu and Chan33, who found that the mean deviation of friction coefficient is highly correlated with the fabric drape coefficient.
The selected relevant features for the descriptor “Supple” are mainly physical parameters related to the suppleness, apart from (x13) which describes fabric surface (see Table 8). However, the relevancy of x13 to “Supple” can also be validated by the study of Hu and Chan33.
According to the Australian Wool Textile Objective Measurement Executive Committee AWTOMEC34, the descriptor “Elastic” is related to tensile, compression and shear. These three properties are represented by the set of physical features (x5, x6, x9, x10) for tensile, (x2, x19, x20) for compression and (x7) for shear. Indeed, all the stated physical features have been taken as the most relevant ones to the descriptor “Elastic” in Table 8. Also, conform to the conclusion obtained by Kim and Vaughn35, the other selected relevant physical features of “Elastic” have a good correlation with the extensibility property.
The previous discussion on fabric mechanical properties show that the proposed relevant feature selection method is effectively conform to the conclusions obtained in the other textile research work and general textile standards.
3.4. Correlations between the selected physical parameters
In practice, there are often dependencies between input variables. It is more reasonable to choose the physical parameters that are more sensitive to the sensory descriptor, but less correlated with other input variables. For this reason, we propose to calculate the Bravais-Pearson coefficient R obtained from Eq. (9) for each pair of the relevant parameters (xk, xp) as:
After selecting the set of relevant parameters, the objective of the next step is to keep one of two highly correlated variables with other variables in the list of the relevant physical parameters according to the following algorithm:
- 1)
For each pair of the relevant parameters (xk, xp), calculate the coefficient (R);
- 2)
If xk and xp ∈ Xr; k ≠ p; |R(xk, xp)| ≥ t (correlation threshold) and FSk,l> FSp,l, xp then must be removed from the list of the relevant parameters Xr.
- 3)
XR = Xr \ {xp}
Undergone this algorithm, the input variables obtained in the XR final list are the most relevant variables to a specific sensory descriptor. The threshold is defined by the experts. The higher the threshold t, the less variable in the final list are correlated. The chosen threshold t is 0.75. Following this threshold value, we obtain the sets of most physical parameters as presented in Table 9.
| Smooth | x16 | x13 | x15 | x14 | x19 | x12 |
| x20 | x2 | |||||
| Fluffy | x13 | x16 | x15 | x2 | x14 | x19 |
| x17 | x20 | |||||
| Full | x1 | x13 | x16 | x12 | x6 | x19 |
| x10 | x7 | x5 | x14 | x15 | ||
| Supple | x12 | x6 | x5 | x19 | x2 | x7 |
| x20 | x10 | x17 | x13 | |||
| Elastic | x19 | x13 | x20 | x5 | x6 | x12 |
| x17 | x10 | x4 | x9 | x2 | ||
| Wrinkle | x19 | x5 | x6 | x16 | x13 | x20 |
| x12 | x2 | x7 | x14 | x17 | x10 | |
| Soft | x16 | x15 | x13 | x2 | x14 | x12 |
| x7 | x19 | x6 | x18 | |||
| Cold | x13 | x16 | x15 | x2 | x18 | x14 |
| x12 | x19 | |||||
| Sliding | x13 | x16 | x14 | x12 | x15 | x19 |
| x20 | x17 | x6 | ||||
Sets of the most relevant physical features
After checking the correlations between physical parameters, the number of inputs was reduced according to the number of possible correlations between them (see Table 9).
4. Conclusion
This paper presents an integrated method for selecting relevant physical features related to a specific sensory descriptor of a given consumer product. This proposed method integrates the data sensitivity criterion and human professional knowledge by using the techniques of fuzzy logic and OWA operators. Considered as an approach in Multi-Evaluators and Multi-Criteria Decision Making (MCDM), we originally integrate evaluator perception on products and professional knowledge of experts. The proposed selection method is applicable to any consumer good, as far as its quality is objectively quantified by physical measurements and subjectively evaluated by persons. Our approach combines the degree of relevancy obtained from the experimental data-based Fuzzy Sensitivity (FS) and the Human Knowledge (HK) using both the fuzzy model and OWA operators.
In the proposed aggregation procedures for ranking lists obtained by different sources, the OWA operators associated with some linguistic rules have been applied. They have been proved to realize aggregations between different objectives, by allowing a good compensation between scores. The effectiveness of the OWA operators as well as the data sensitivity-based fuzzy model has been validated through the real example of stonewashed denim fabric. In fact, the ranking lists of the physical features corresponding to FGR and OWAGR are very close each other and both of them are robust, insensitive to measured data noises and conflicts. Moreover, they are more sensitive to significant data and more efficient for physical interpretation. In order to obtain more reliable results for selection of relevant physical features, a percolation technique has been applied for combining the fuzzy global relevancy and OWA global relevancy criteria in order to clearly distinguish scores of the relevant physical features from those of irrelevant ones.
References
Cite this article
TY  - JOUR
AU  - I. Feki
AU  - X. Zeng
AU  - A. Ghith
AU  - L. Koehl
AU  - F. Msahli
AU  - F. Sakli
PY  - 2016
DA  - 2016/04/01
TI  - Selecting Multiple Evaluator’s Perception-Oriented Relevant Physical Features of Consumer Goods by Using Fuzzy Data Sensitivity and OWA Operators
JO  - International Journal of Computational Intelligence Systems
SP  - 213
EP  - 226
VL  - 9
IS  - 2
SN  - 1875-6883
UR  - https://doi.org/10.1080/18756891.2016.1149997
DO  - 10.1080/18756891.2016.1149997
ID  - Feki2016
ER  -