
Descriptive and Comparative Analysis of Human Perceptions expressed through Fuzzy Rating Scale-based Questionnaires
- DOI
- 10.1080/18756891.2016.1175811How to use a DOI?
- Keywords
- human perceptions; fuzzy rating scales; descriptive and comparative surveys; data science
- Abstract
Opinion surveys are widely admitted as a valuable source of information which becomes complementary to the information extracted from data by machine learning techniques. This paper focuses on a challenging and still open problem which is related to how to handle properly the inherent uncertainty of human perceptions. Namely, we propose new ways to interpret and analyze fuzzy data coming out from a special case of survey, the so-called fuzzy rating scale-based questionnaire. This kind of questionnaire is characterized by allowing expressing human perceptions in terms of fuzzy rating scales. The proposed methods are in charge of capturing and modeling the uncertainty of the answers by varying the heights of the related fuzzy sets. These methods have been validated in two case studies: (1) a descriptive survey related to the packaging design of gin bottles; and (2) a comparative survey related to 2015 IFSA-EUSFLAT conference.
- Copyright
- © 2016. the authors. Co-published by Atlantis Press and Taylor & Francis
- Open Access
- This is an open access article under the CC BY-NC license (http://creativecommons.org/licences/by-nc/4.0/).
1. Introduction
Even though we are living in the Big Data era, in a global and technological world where everything (and everyone) is highly connected, opinion surveys are more and more common in our daily live. Surveys are worldwide admitted as the de facto standard when looking for a way to gather opinions from groups of people. There are surveys conducted in almost every research field: Education 1,2, Medicine 3,4, Economy 5, etc. Of course, surveys are also extensively used by public and private companies with the aim of gaining insight into the degree of satisfaction of customers with the products and/or service they offer 6,7. Nowadays, information derived from surveys provides a humanistic view that is complementary to information extracted from Big Data 8.
It is worthy to note that the success of classical surveys is mainly due to their several advantages and benefits 9, such as cost-effective trade-off (on-line surveys are extremely low cost), reliability of reported results that is supported by strong statistical background, and so on. However, surveys also have some drawbacks and weak points to pay attention. Their lack of flexibility is argued as their main disadvantage. Respondents are usually asked to choose an answer among a small set of options (commonly expressed by linguistic terms and ordered in the so-called Likert scales 10). In addition, there is no way to tell neither how truthful respondents are being nor how much thought they have put in 11. Even worse, understanding properly the meaning of the involved linguistic terms depends on the context and background of each respondent. In consequence, the validity of the results derived from a survey strongly depends on how carefully it was designed in order to avoid bias and minimize ambiguity, imprecision and uncertainty in the given questionnaire. Notice that, uncertainty is a characteristic inherent to human perceptions and opinions are always subjective.
Fuzzy Logic, introduced by Zadeh in 1965 12, is ready to cope with imprecision and uncertainty. It is acknowledged for its well-known ability for linguistic concept modeling mainly due to its semantic expressiveness close to expert natural language, using linguistic variables and rules 13. Fuzzy sets and systems are able to formalize, in an approximate but even precise way, vague concepts (like tasteful, elegant, exclusive, and so on). In contrast to classical (crisp) sets where only two values (0/1, false/true, etc.) are admissible, fuzzy sets are characterized by the assignation of a membership degree to each element in the set, in such a way that low values (close to zero) represent low membership to the set, while high values (close to one) represent high membership.
In the last fifty years, the fuzzy research community has kept on growing, yielding as a result many successful applications along with novel theoretical developments and extensions 14,15. Fuzzy rating scales, introduced by Hesketh et al. 16 in 1988, allow a respondent to give a flexible answer by selecting any value in a continuous line, along with two additional values which represent a certain interval of preference. Thus, it becomes straightforward the generation of a triangular fuzzy set which characterizes the uncertainty attached to the given answer. From a psychometric point of view, fuzzy rating scales make easier the assessment of the diversity, subjectivity, imprecision and uncertainty that are inherent to human opinions 17. In addition, the use of fuzzy sets and systems paves the way to pass from computing with numbers to computing with words and perceptions 18. Thus, the Computational Theory of Perceptions, introduced by Zadeh in 2002 19, provides a framework to compute with imprecise descriptions of the world (expressed through linguistic expressions close to natural language) in a similar way to how humans naturally do. In the context of Computational Theory of Perceptions, it becomes essential dealing with subjective judgments 20. Consequently, it results natural passing from questionnaires based on the usual Likert scales to fuzzy rating scale-based questionnaires 17, i.e., questionnaires based on fuzzy rating scales. Moreover, the recent advances and developments in Statistics 21 have yielded new statistical techniques ready to deal properly with this kind of questionnaires.
In this paper, we propose the use of fuzzy rating scale-based questionnaires in the context of the descriptive and comparative analyses which are popular in surveys related to sensory evaluation practices and consumer science 6,7. On the one hand, we first introduce a new interpretation of fuzzy data coming out from fuzzy rating scales. Instead of considering the usual normal fuzzy sets, we work with triangular fuzzy sets with height modulated in accordance with the amount of uncertainty attached to each given answer. Then, we cope with the aggregation of several answers related to the descriptive analysis of a given sample (object under evaluation) along with the related statistical tests. Novel graphical representations are also proposed in order to make easier the interpretation and understanding of the conclusions derived from the conducted statistical analysis even for non-expert readers. On the other hand, we extend the usual method for conducting comparative analysis which is based on asking respondents for a mere ranking of samples. To do so, we propose the use of fuzzy rating scales with the aim of refining the given ranking, i.e., respondents are asked for quantifying the similarity between each pair of consecutive samples in the given ranking.
In short, the following points highlight the main contributions in this paper:
- •
Treatment of the uncertainty associated to each answer in a fuzzy rating scale-based questionnaire by better modeling it through fuzzy sets with variable heights. Such heights will slightly change in accordance with the respondents confidence.
- •
Enhancing the expressiveness of comparative surveys by adding fuzzy peer comparisons, i.e., consecutive objects in a given ranking will be also deeply compared two by two. The comparative data collected this way can be effectively translated into highly expressive descriptive data.
- •
Novel graphical visualizations of outcomes derived from both descriptive and comparative methods.
The remainder of this paper is structured as follows. In Section 2, we introduce preliminary concepts about fuzzy logic and survey methods. Section 3 is the core of this work. It describes two new procedures to deal with human perceptions (from descriptive and comparative analysis viewpoints) gathered through fuzzy rating scale-based questionnaires. The usefulness of both procedures is shown in Section 4 where two illustrative case studies are discussed. Some concluding remarks and future work are given in Section 5.
2. Preliminary concepts
This section is devoted to provide introductory concepts that are necessary to the good understanding of the rest of this paper. It has been split into two subsections. Firstly, fuzzy concepts used along the paper are provided. Secondly, we focus on the study of already existent methods to conduct a survey and to analyze the obtained data.
2.1. Fuzzy logic
This logic serves as a way to model frequently used terminology that the classical set theory can not properly handle. To do so, each element is assigned a membership degree to the set.
Definition 1.
Let X be a non-empty set. A fuzzy set A in X is given by its membership function
Along this paper, we use FS(X) to denote the set of all fuzzy sets in X.
Different extensions of fuzzy sets have been developed and widely applied 14,22, such as interval-valued fuzzy sets 23,24, intuitionistic fuzzy sets 25 or type-2 fuzzy sets 13,26, although in this work only the original definition of fuzzy set is considered.
Among the most used fuzzy sets are the trapezoidal and triangular fuzzy sets 27, which are given as follows.
Definition 2.
Let X be a non-empty set, a,b,c,d ∈ X and h ∈ [0,1] such that a ≤ b ≤ c ≤ d. The fuzzy set A = (a,b,c,d;h) given by the membership function:
Remark 1.
Consider a trapezoidal fuzzy set of height h, A = (a,b,c,d;h),
- •
if b = c, then A is a triangular fuzzy set of height h, usually denoted by A = (a,b,d;h),
- •
if h = 1, then A is a normal trapezoidal fuzzy set, usually denoted by A = (a,b,c,d),
- •
if b = c and h = 1, then A is a normal triangular fuzzy set, usually denoted by A = (a,b,d).
Note that the used notation for a triangular fuzzy set along this paper is the usual one, i.e., A = (a,b,c;h) (or A = (a,b,c) if it is a normal one).
In a survey supported by fuzzy rating scales, answers are given in the form of fuzzy sets. In order to summarize several answers, a way to aggregate fuzzy sets is necessary. Aggregation of trapezoidal fuzzy sets can be done by particularizing Aumann-type mean 28, widely admitted as the gold standard, as follows.
Definition 3.
Let A1,…,An ∈ FS(X) be normal trapezoidal fuzzy sets such that Ai = (ai,bi,ci,di),∀i = 1,…,n. The sample Aumann-type mean of (A1,…,An) is the normal trapezoidal fuzzy set given as
In addition, there exist more general processes to aggregate several fuzzy sets which are not trapezoidal fuzzy sets, centered in the definition of aggregation operator.
Definition 4.
A mapping g : [0,1]n → [0,1] is an aggregation operator if it satisfies
- •
monotonicity: if x1 ≤ y1,…,xn ≤ yn, then g(x1,…,xn) ≤ g(y1,…,yn),
- •
boundary conditions: g(0,…,0) = 0 and g(1,…,1) = 1.
Among them, Averaging Operators 29 and Ordered Weighted Averaging Operators 30 are the most widely known. In this work, we focus on the former.
Definition 5.
A mapping g : [0,1]n → [0,1] defined by
Finally, we need to introduce a fuzzy subsethood measure for making self-contained the rest of the manuscript. The one provided by Kosko in 1990 31 has been selected.
Definition 6.
Let X be a non-empty set, and A,B ∈ FS(X). The degree to which A is a subset of B is defined by
2.2. Survey methods
As it has been already stated, the use of surveys has been applied in a wide range of fields. One of the most usual procedures to collect answers from respondents is based on the so-called Likert scales, that were introduced in 1932 10.
Likert proposed asking respondents to evaluate a given statement with respect to their level of agreement. An example of this kind of scale with five values (the most usual number of values) is shown in Figure 1(a).
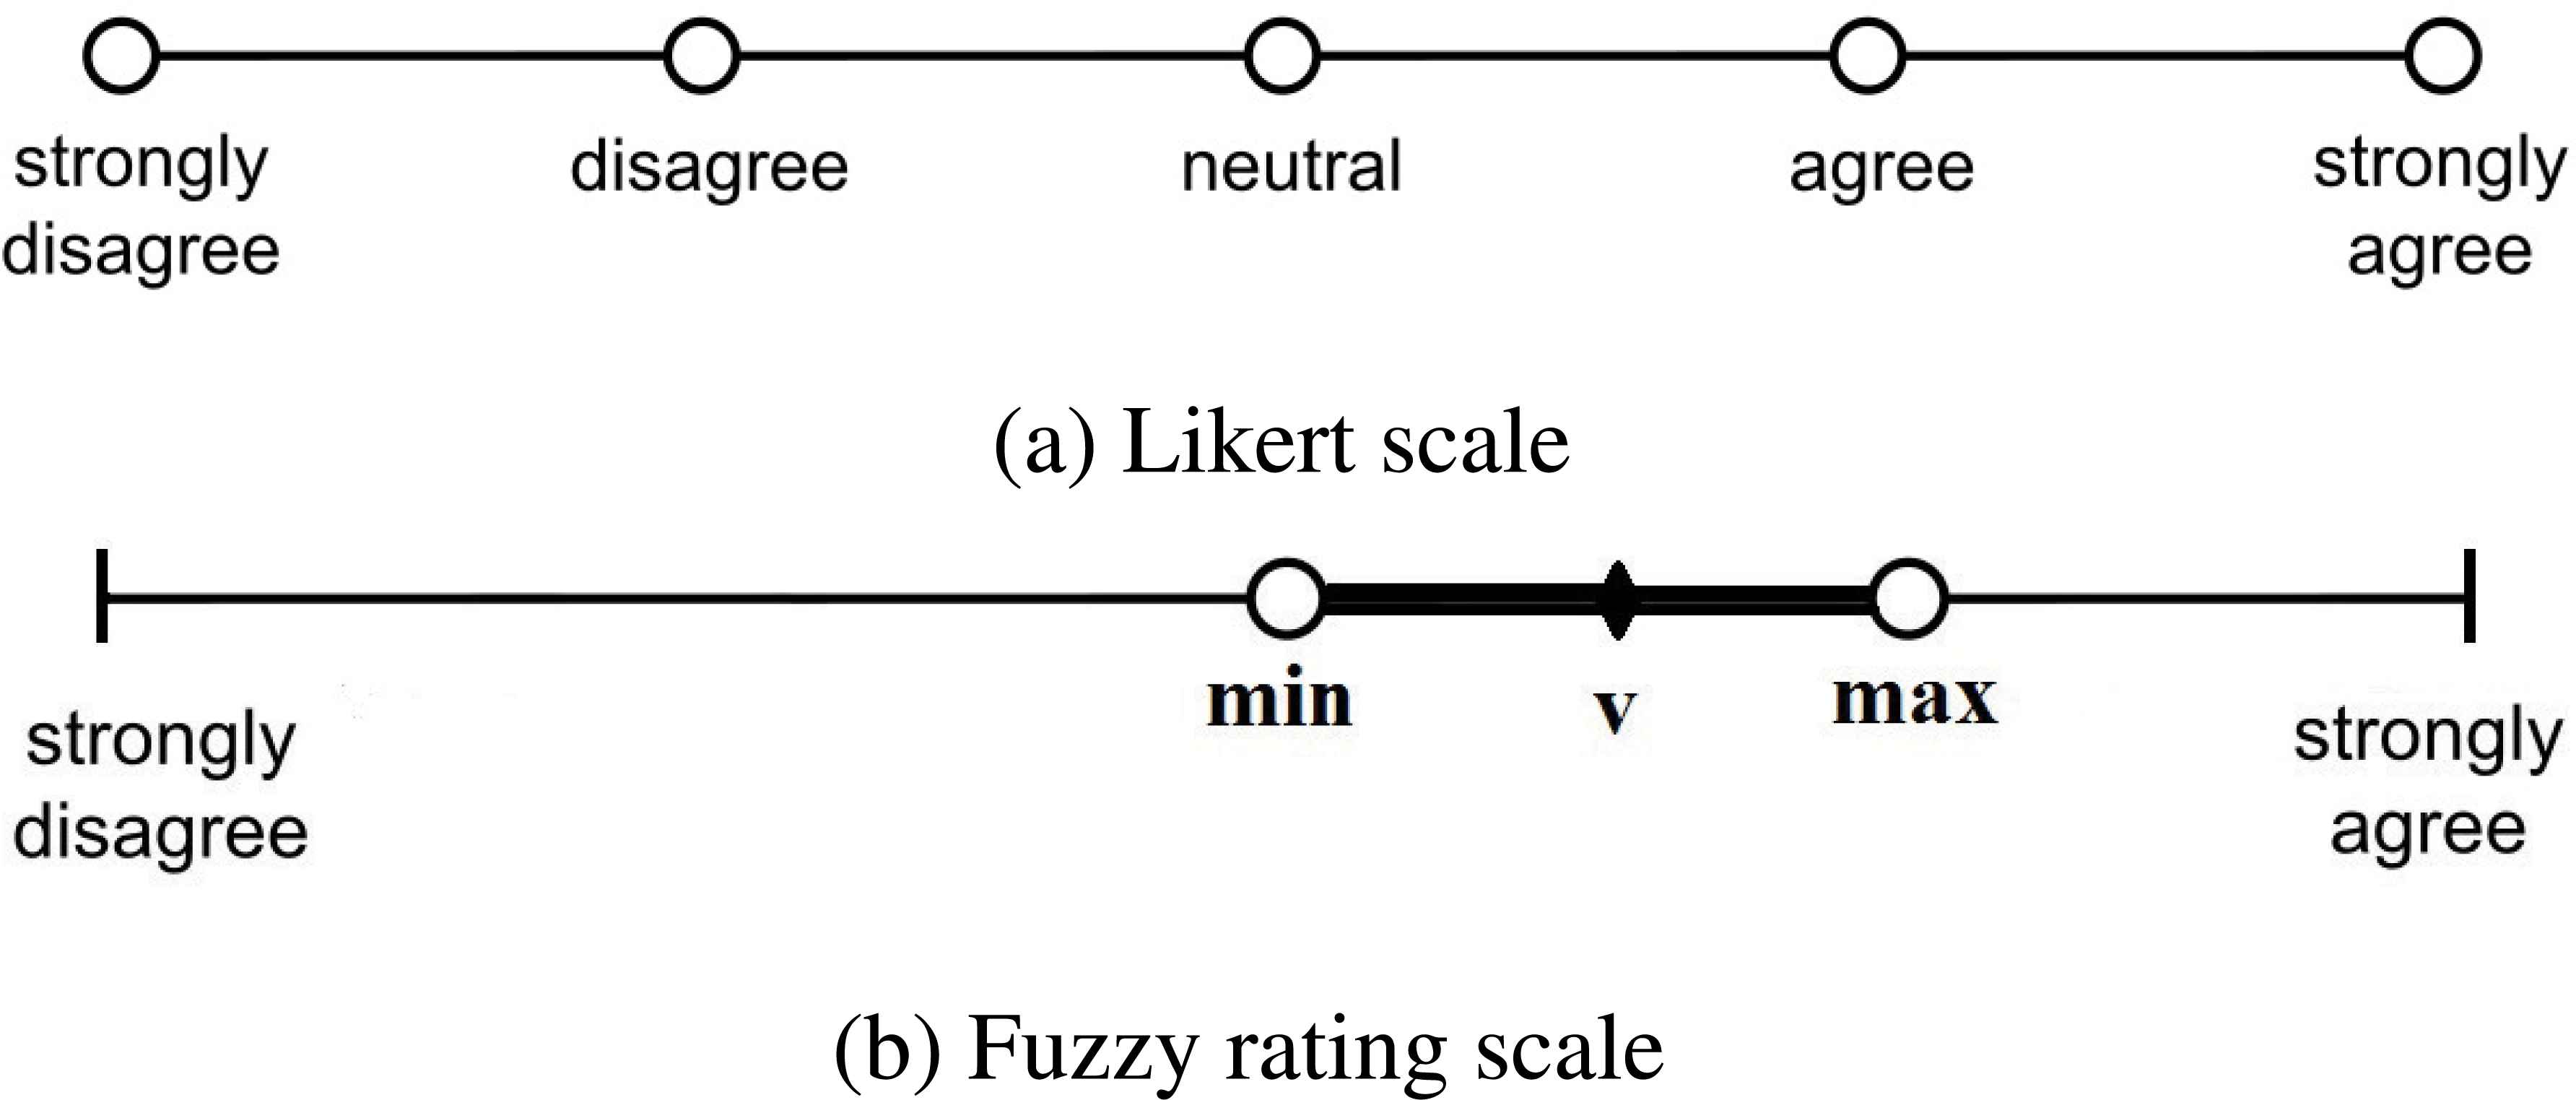
Example of scales.
An increase of the number of choices is meant to provide more informative results 32. Moreover, the concept of fuzzy rating scale was provided by Hesketh et al. 16 in order to broaden this idea. They take advantage of the properties of fuzzy logic to extend the number of choices to a continuum. The main idea behind fuzzy rating scales is that the respondent provides a graphical answer in such a way that it gives a preferred point, and the possibility of drawing lines to both sides of such point indicating certain degree of preference. An example is shown in Figure 1(b), where the preferred point is given by v, and the interval that allows certain degree of preference is given by points min and max.
This type of answers is turned naturally into triangular fuzzy sets, where the three points assigned by the respondents are the parameters that shape the sets. Formally, A = (min,v,max). Two examples are provided in Figure 2, where two answers with different levels of confidence are shown.
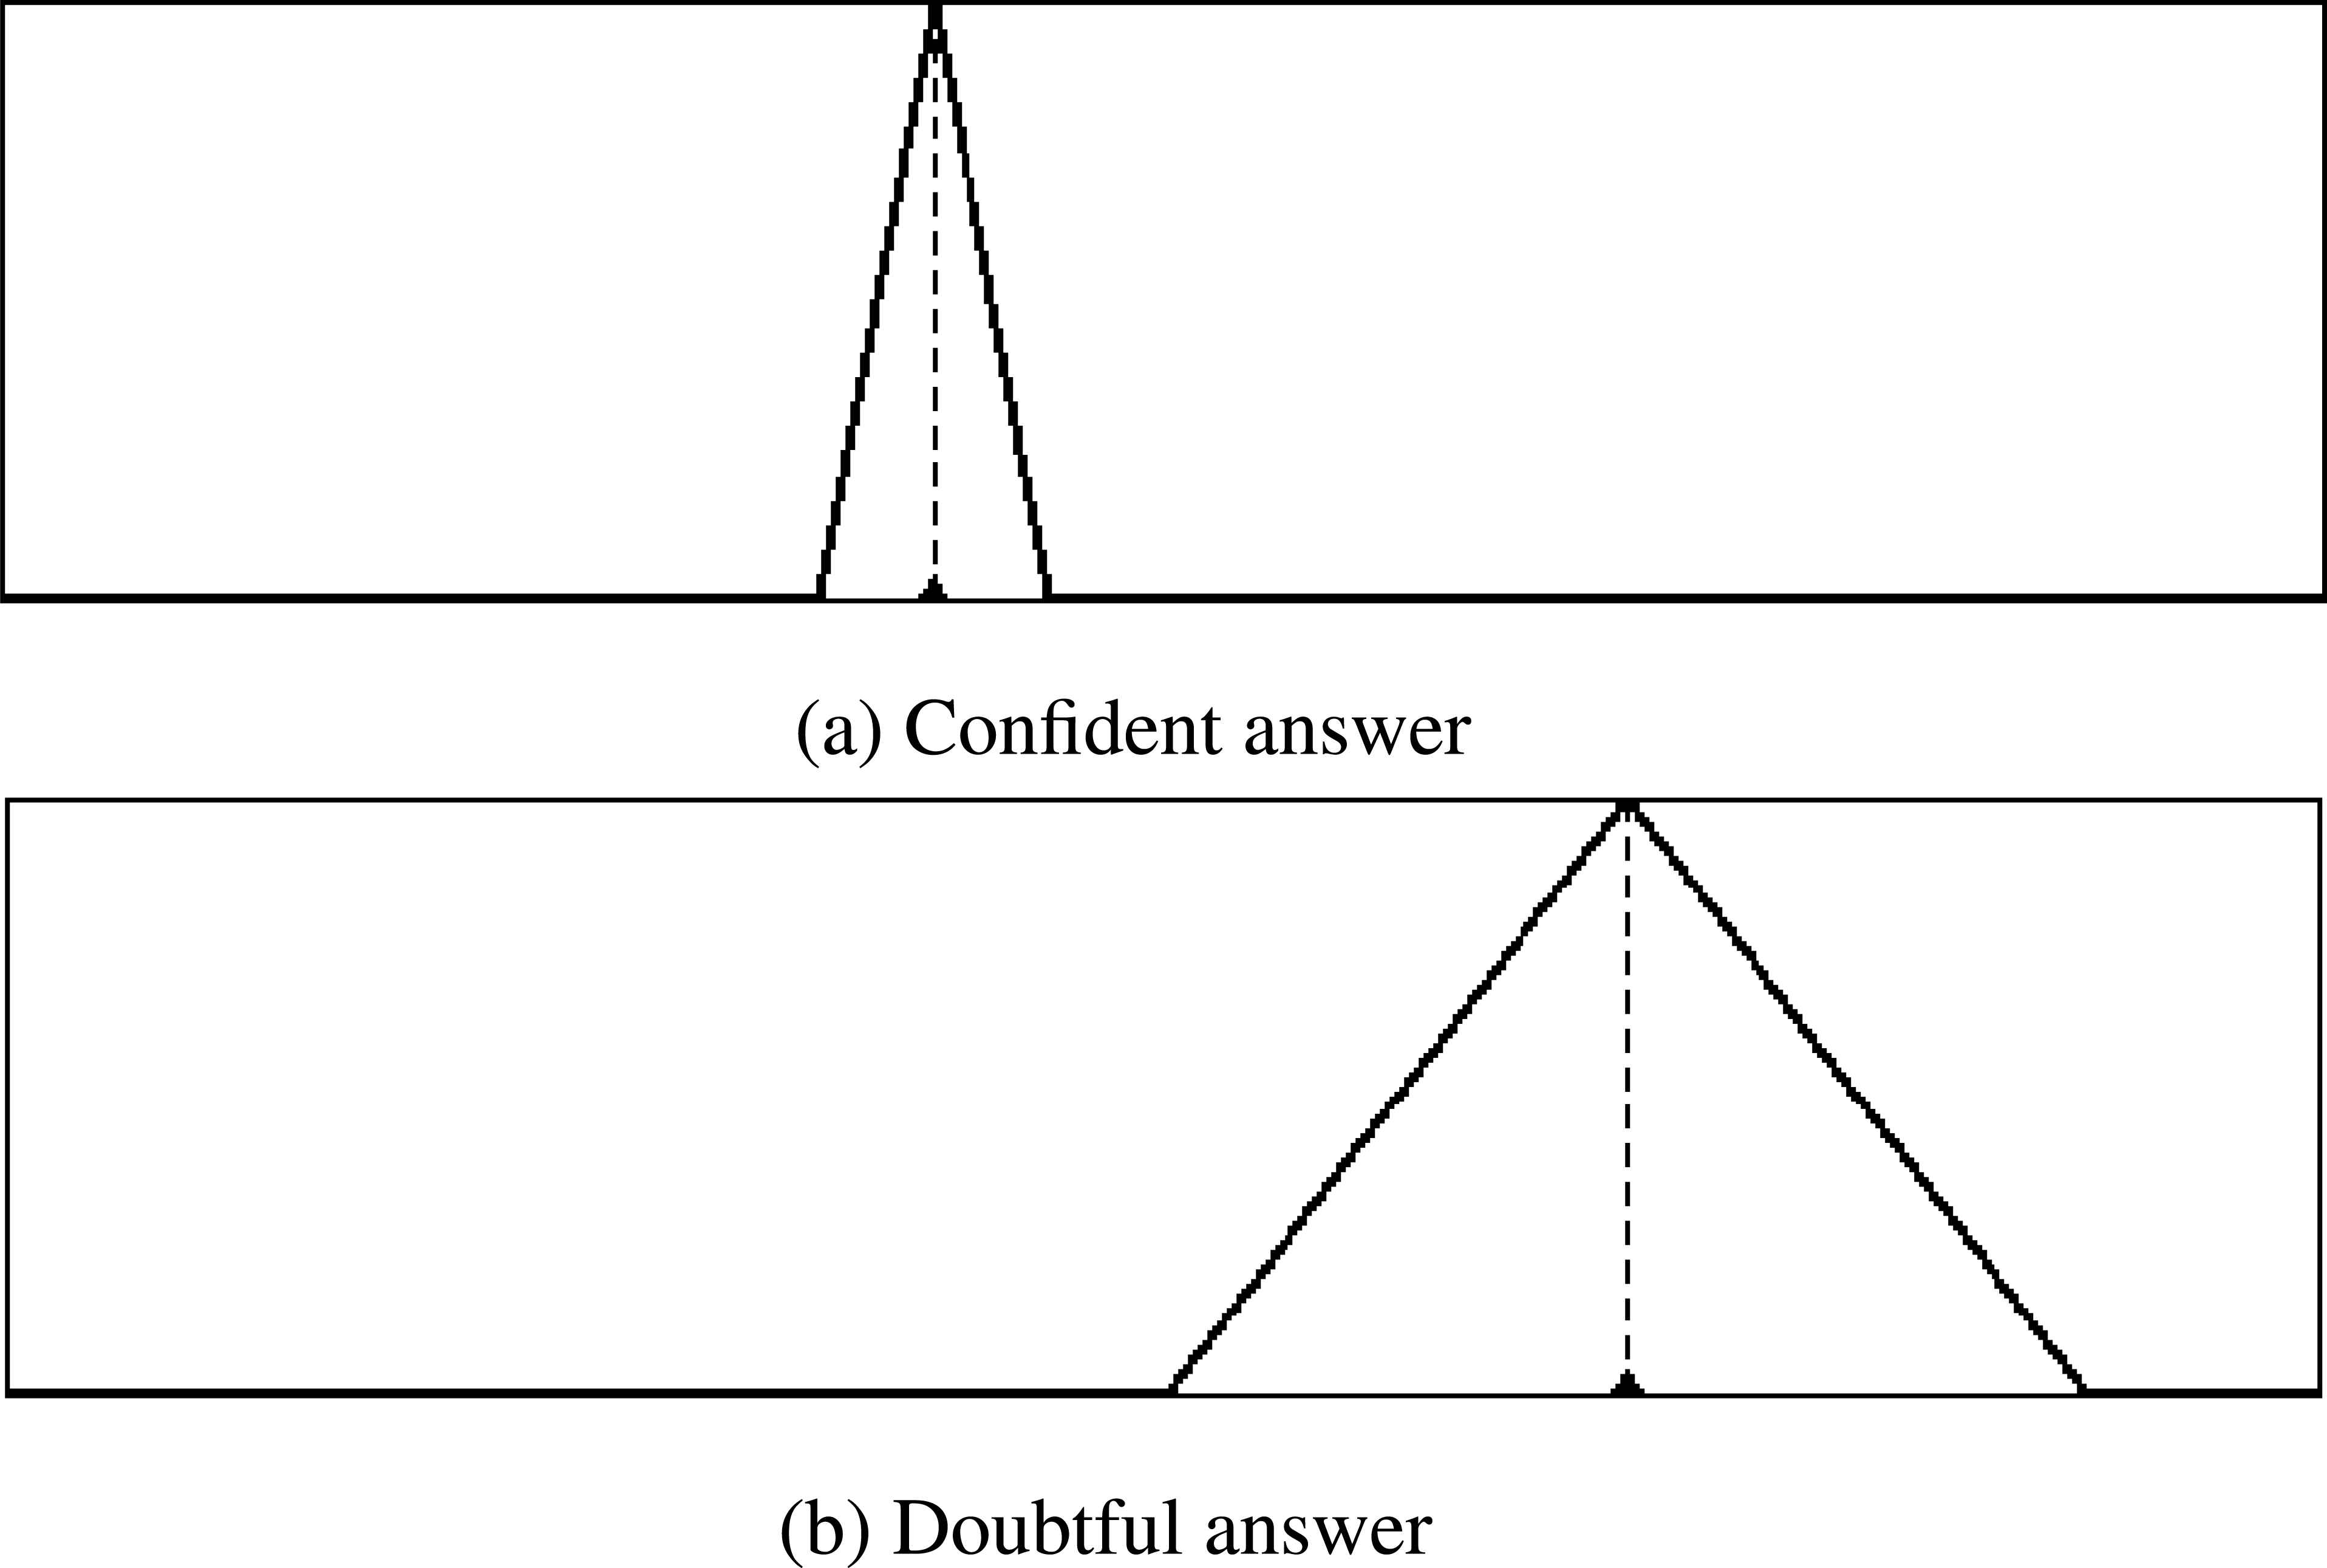
Answers with different degrees of confidence.
As a consequence, the treatment of this type of data requires the adaptation of statistical techniques to the fuzzy case. The SMIREa Research Group is very productive and has developed several statistical results 17,33,34 around an extended concept of fuzzy rating scale, where the preferred value can be an interval instead of just a point. Thus, they deal with trapezoidal fuzzy sets instead of triangular ones. It is worthy to note their effort to provide the fuzzy community with the free software R package called SAFDb. The interested reader is referred to 35c where a thorough review of fuzzy systems software is provided.
3. Descriptive and comparative surveys supported by fuzzy rating scales
In this section, we propose two novel approaches to conduct surveys of two types: descriptive and comparative. The innovative part of the former is the different treatment given to the data obtained through fuzzy rating scales. The latter introduces an original method applying fuzzy rating scales as well.
From here on out, we refer to the objects of study in a survey as samples, and to the different features analyzed about them as attributes.
3.1. Descriptive surveys
The proposed method in this subsection is based on the fuzzy rating scale, but the process to treat data is different to the original one given by Hesketh 16.
The main issue is the fact that a very undecided answer (wide amplitude) treated as a normal triangular fuzzy set (as suggested by Hesketh) becomes as important as a more confident one (narrow amplitude), or even more if the usual aggregation operators are considered. For instance, consider two answers A = (a,b,c) and B = (a′,b′,c′), such that a < a′ ≤ b = b′ ≤ c′ < c, then respondent B is more confident than A. However, μA(x) ≥ μB(x), ∀x ∈ X, and as a result, the influence of B in the aggregation is weaker than the one of A.
In order to provide a way to overcome such drawback, the collection of data is done in a similar way as shown in Figure 1(b). However, the interpretation of the information provided by the respondents is not straightforwardly done to a triangular fuzzy set of height 1 as it is usually done. On the contrary, this height should slightly change in accordance with the whole range covered by the answer.
Formally, we propose that, given the three values that characterize an answer a,b,c, the resulting fuzzy set is a triangular fuzzy set of height h A = (a,b,c;h) where
In Figure 3, the same five answers are treated in two different ways. On the left, the usual approach is illustrated. There, answers are turned into normal triangular fuzzy sets. On the right, answers are turned into triangular fuzzy sets with variable heights (k = 10). Dashed lines represent the averaging operator for p = 1, i.e., the arithmetic mean. It is easy to appreciate how the mean in the first case is less representative than in the second one when it comes to the answers provided in the survey. Notice that a greater accumulation and certainty is shown in accordance with the three answers closer to 100. This fact is better represented in Figure 3(b) since the mean for variable heights properly fits.
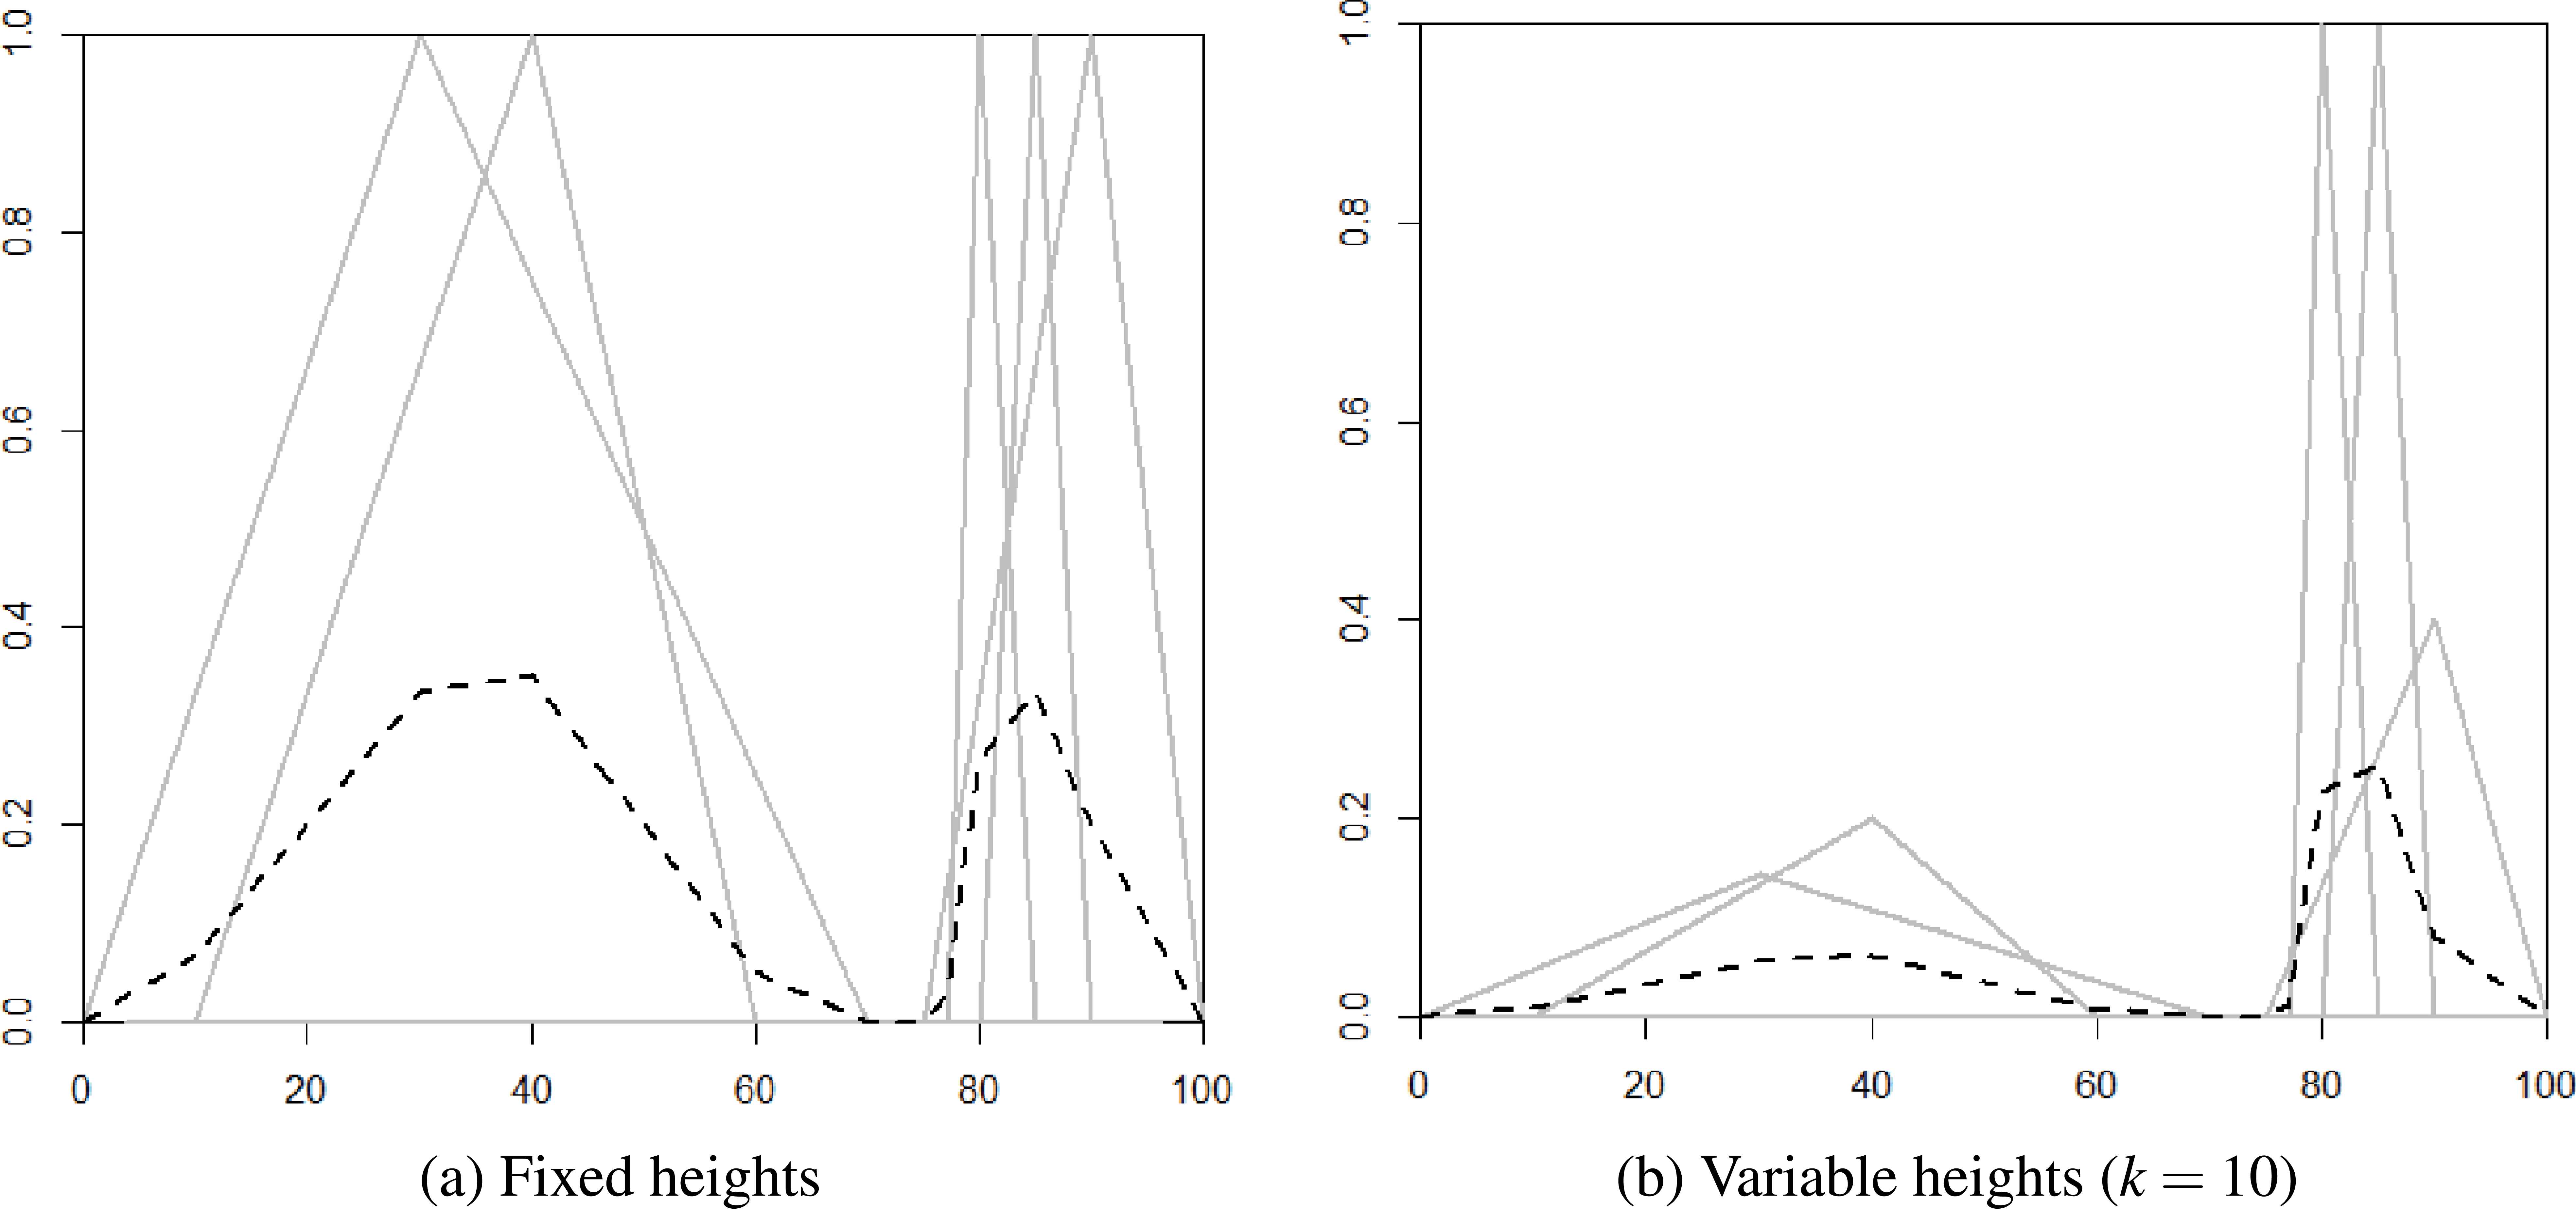
Comparative of triangular fuzzy sets (grey lines) and their aggregations (dashed black lines) with fixed and variable heights.
The selection of parameter k is based on how much the researcher wants to penalize the doubt in the answers. The larger the value of k, the weaker the penalization of doubtful answers.
The proposed procedure in this subsection is based on characterizing every answer by triangular fuzzy sets with variable heights, and summarizing them through an averaging operator. Once this aggregation has been done, the study of this new mapping is carried out searching for one or more answer accumulation areas. The computational procedure is as follows:
- Step 1:
Conduct the survey and collect the three values (Figure 1(b)) that characterize each answer for each attribute and respondent.
- Step 2:
Build the triangular fuzzy sets of variable heights (Figure 3(b)) for each answer through the Equation (3), once the suitable value of constant k has been set.
- Step 3:
Aggregate the answers of all respondents for each question using an aggregation operator.
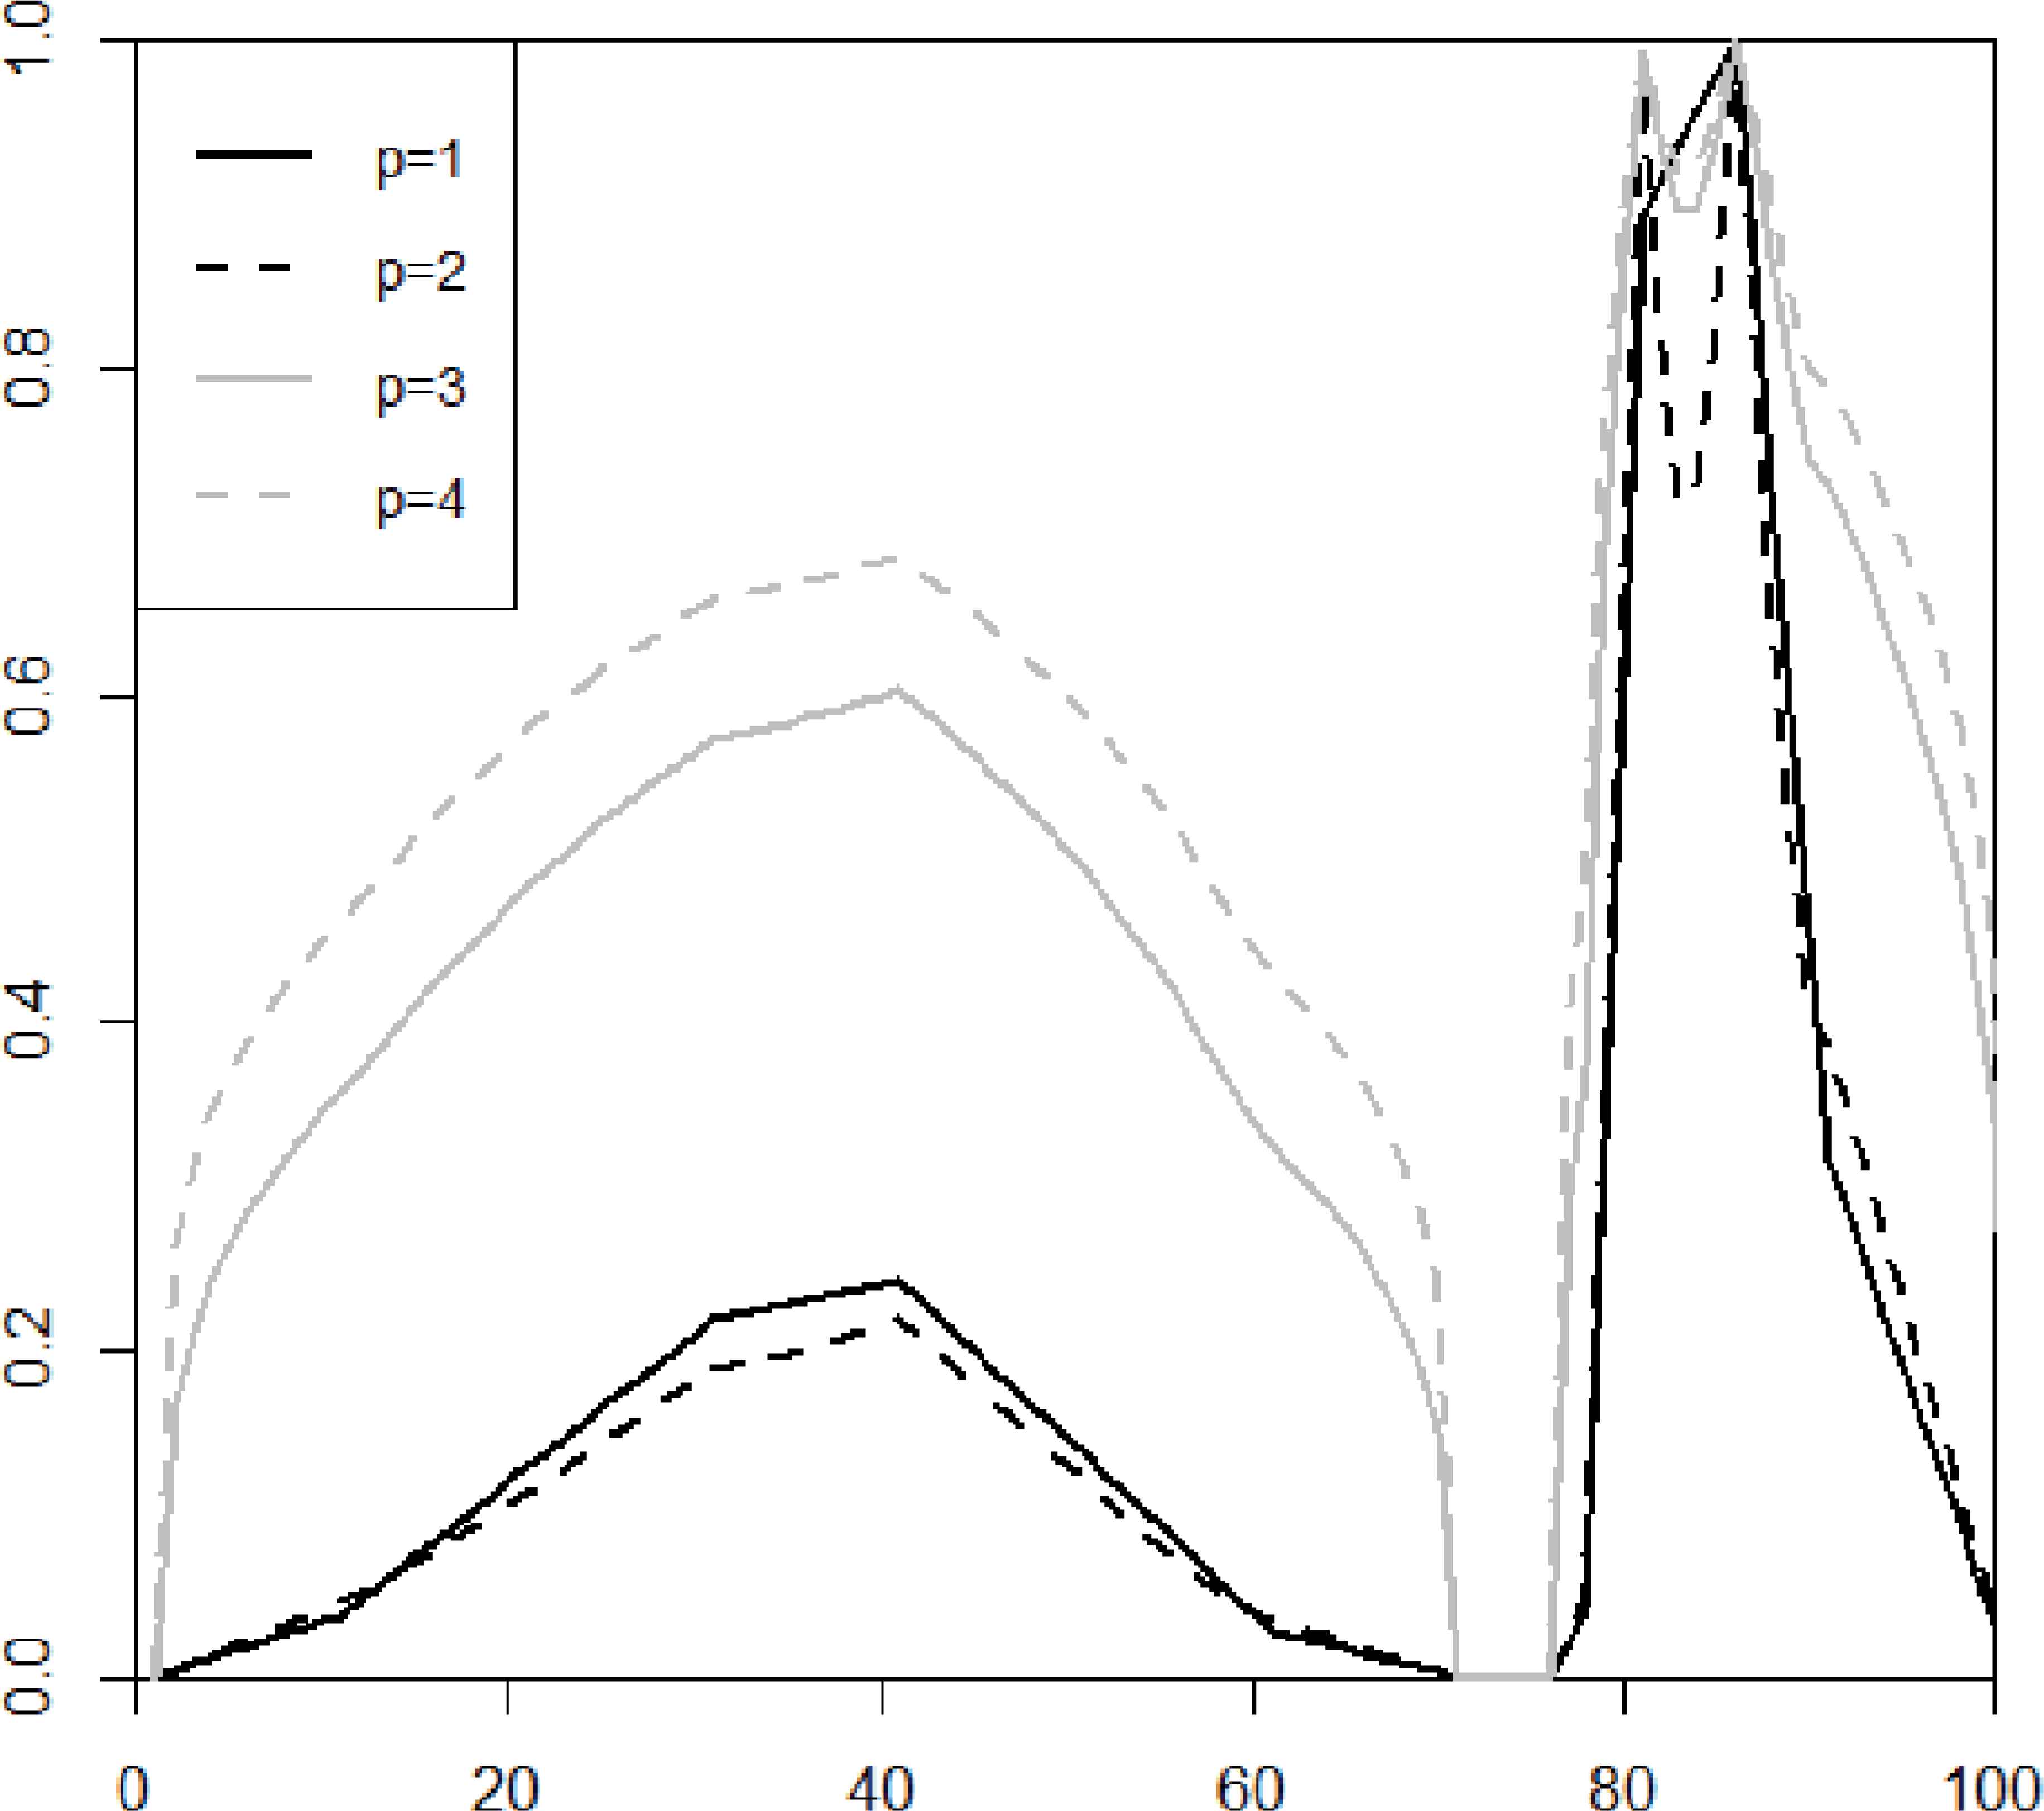
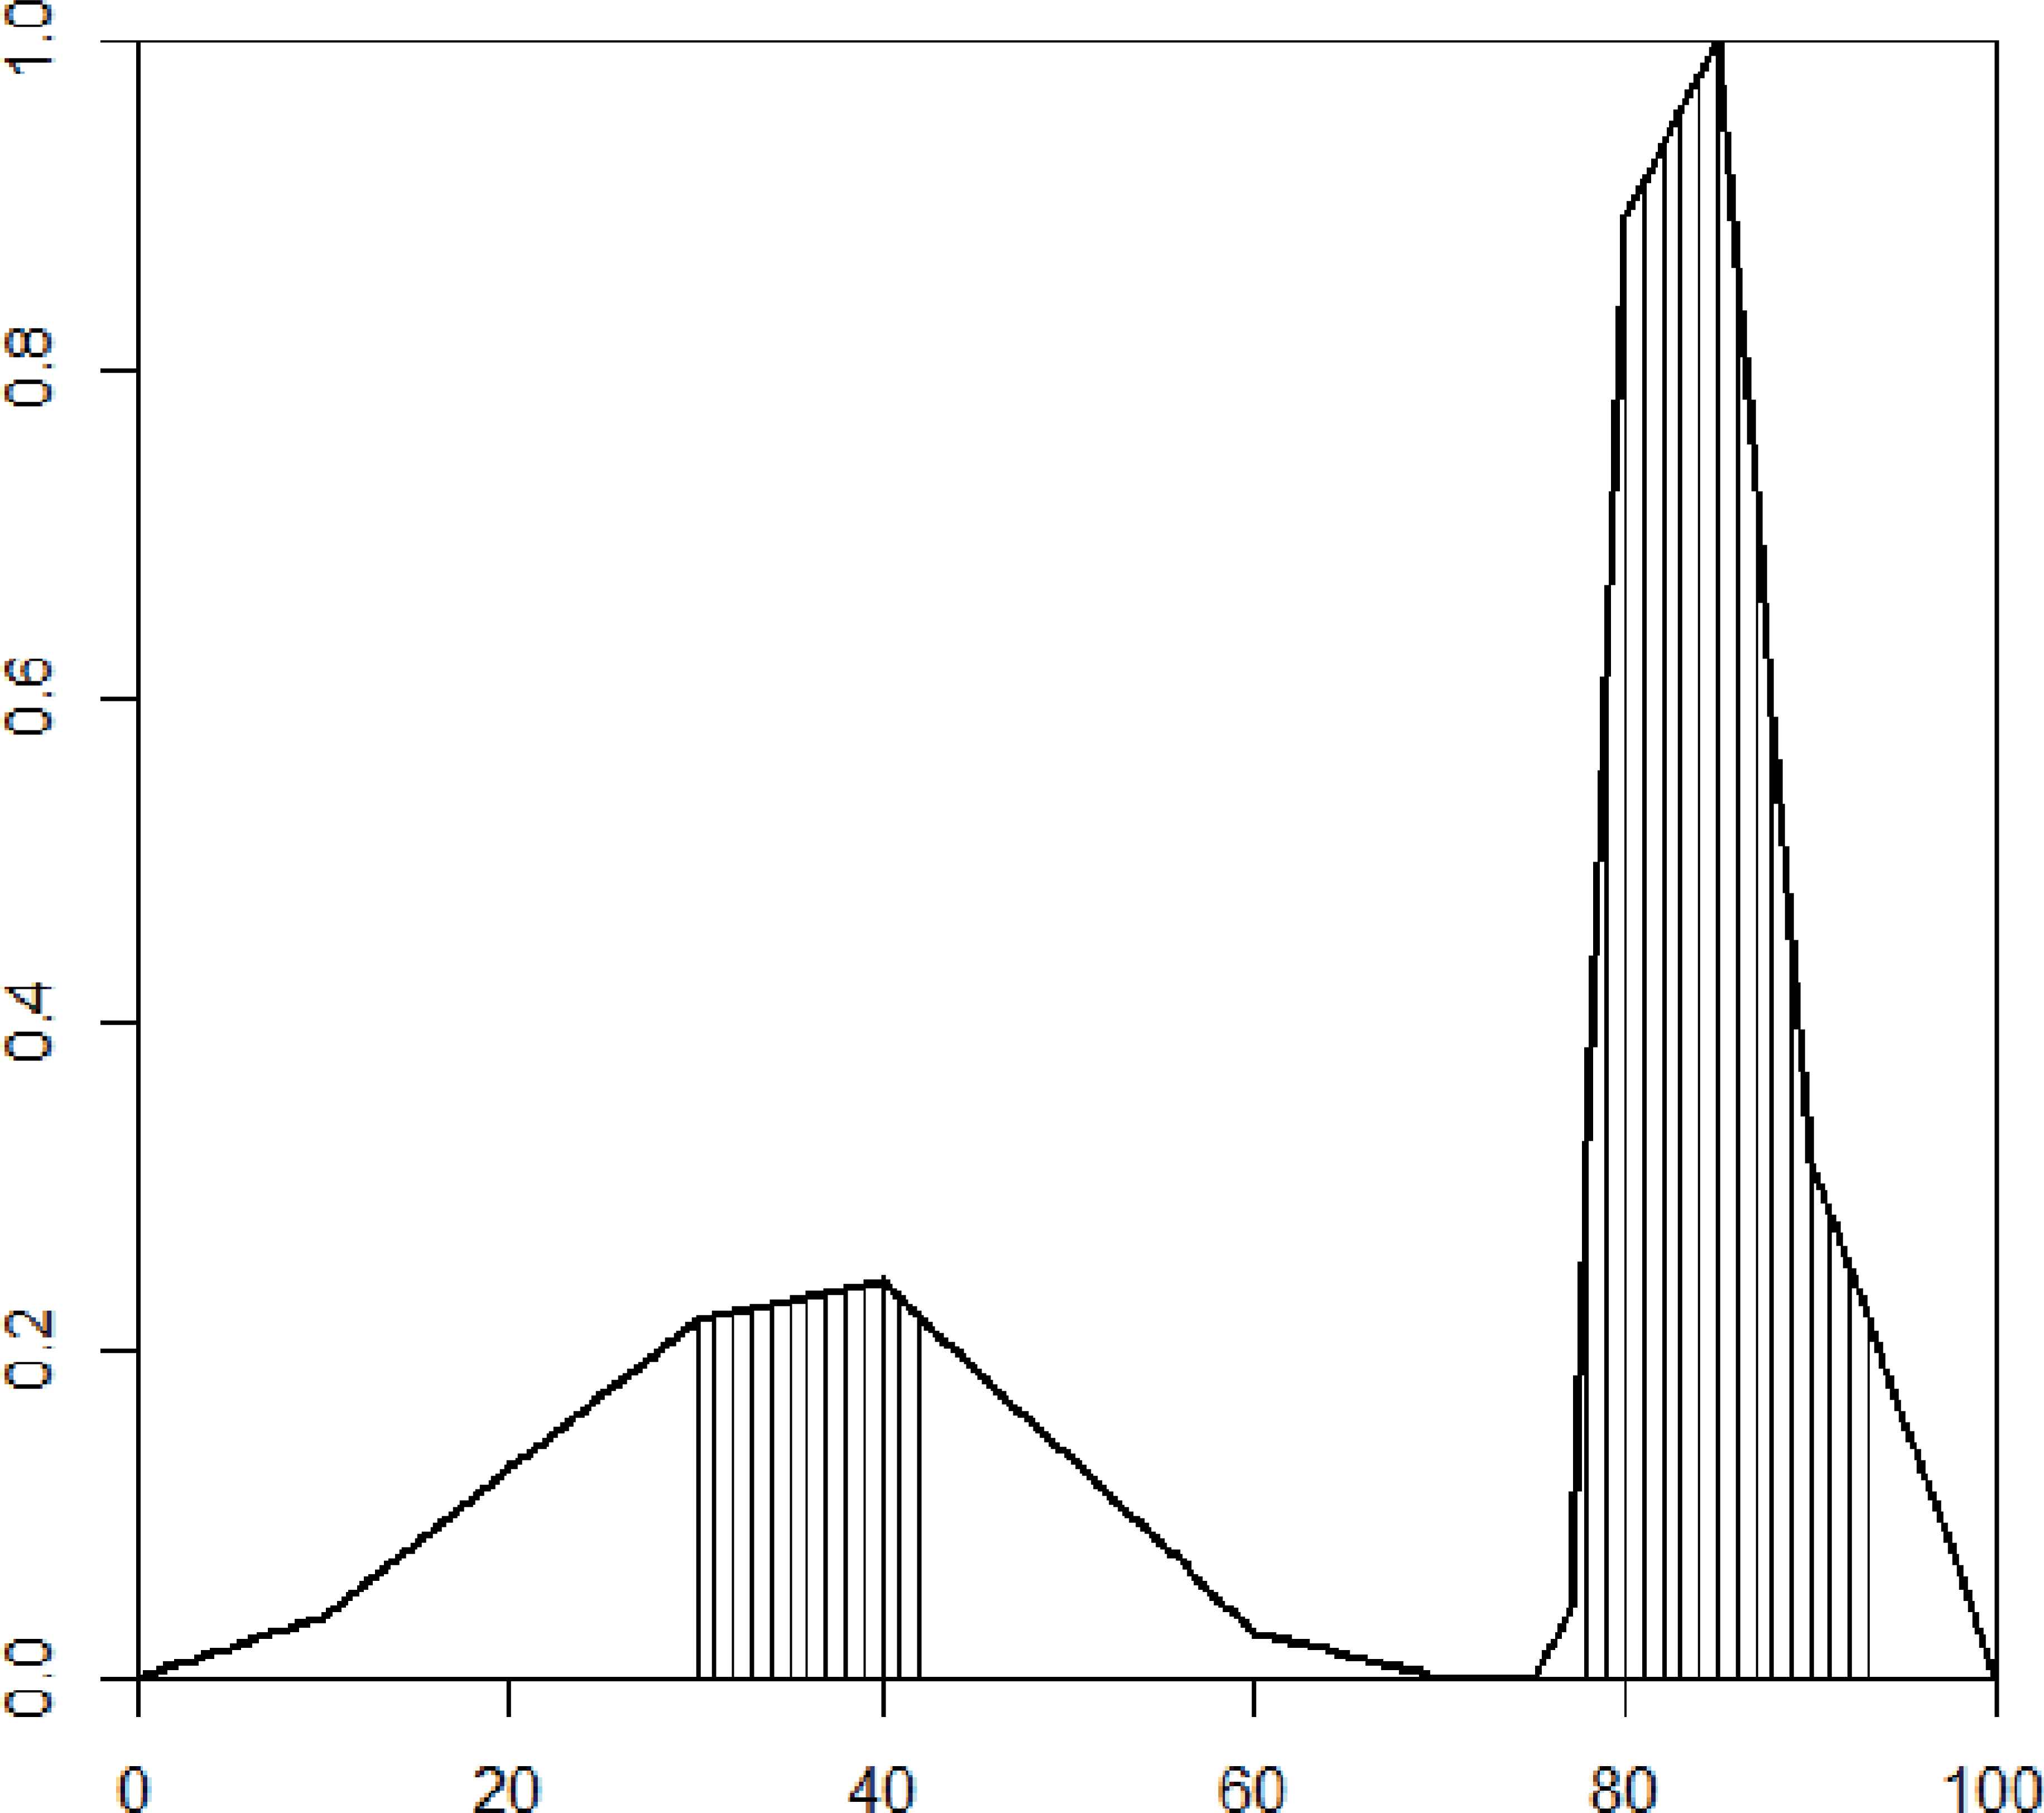
Among the averaging operators from Definition 5, an example with p = 1,2,3 and 4 is displayed in Figure 4. Averaging operators with p = 1 and p = 2 get similar normalized aggregations, where the accumulation area on the right of the space is more noticeable than the left one. On the contrary, p = 3 and p = 4 make the difference between both areas less marked, and as a result, the doubtful answers from Figure 3 get greater importance than necessary. Thus, the averaging operators that provide better representation of the confident answers are those ones for p = 1 and p = 2, as an increase in the parameter makes the difference between accumulation areas less noticeable, and as a result, provides less informative data.
- Step 4:
Group those points in the scale with the greatest aggregated values until a fixed threshold of the total is reached.
Figure 5 shows an example where threshold is set to 70%. It is worthy to note that such threshold must be set beforehand for each survey. In this example, the threshold value has been selected after several experiments with different options, being 70% the value that allowed us to obtain the clearer results to identify the accumulation areas.
- Step 5:
Build the interval or intervals that shape the set of points. If two or more intervals are close enough, then they are fused into a single interval. This fusion depends on a parameter of configuration that is selected by the researcher.
With the aim of being effective, this parameter should be neither too small (so this fusion would be effective only in some situations), nor be too large (as it would result into huge intervals). Considering 5% of the total space as fusion threshold, we have achieved a good trade-off in our experiments.
- Step 6:
Build a trapezoidal fuzzy set associated to each interval and the aggregation of answers given in Step 3. Let
On the other hand, a and d are obtained as the values in [0,b] and [c,100], respectively, such that
and there does not exist another pair (a′,d′) in [0,b] × [c,100] such that Equation (4) is satisfied and d − a > d′ − a′. Formally,The parameter q selected in our experimentation has been q = 0.2r, where r is the proportion of the total that is associated to the core of the trapezoidal fuzzy set. It is worthy to note that in this way, the support is not much wider than the core.
- Step 7:
Calculate the number of answers characterized by each trapezoidal fuzzy set generated in the previous step. We make use of the subsethood definition S(A,B) given in Equation (2). Let A ∈ FS(X) be the given trapezoidal fuzzy set, and A1,…,Am ∈ FS(X) the answers provided by the respondents. Then, the number of answers characterized by A is given by:
Figure 7 shows both intervals and percentages of individuals characterized coming from Figure 5.
- Step 8:
Compute the aggregated score associated to each attribute. We use the center of gravity of the trapezoidal fuzzy set associated to the interval with the greatest percentage. Given a normal trapezoidal fuzzy set A = (a,b,c,d) ∈ FS(X), the center of gravity is calculated as follows:
Once all previous steps have been carried out, all generated graphics are integrated into a global report that summarizes the results of the survey. In addition, if several samples are analyzed in the survey, they can be compared with respect to each attribute, obtaining this way a ranking associated.
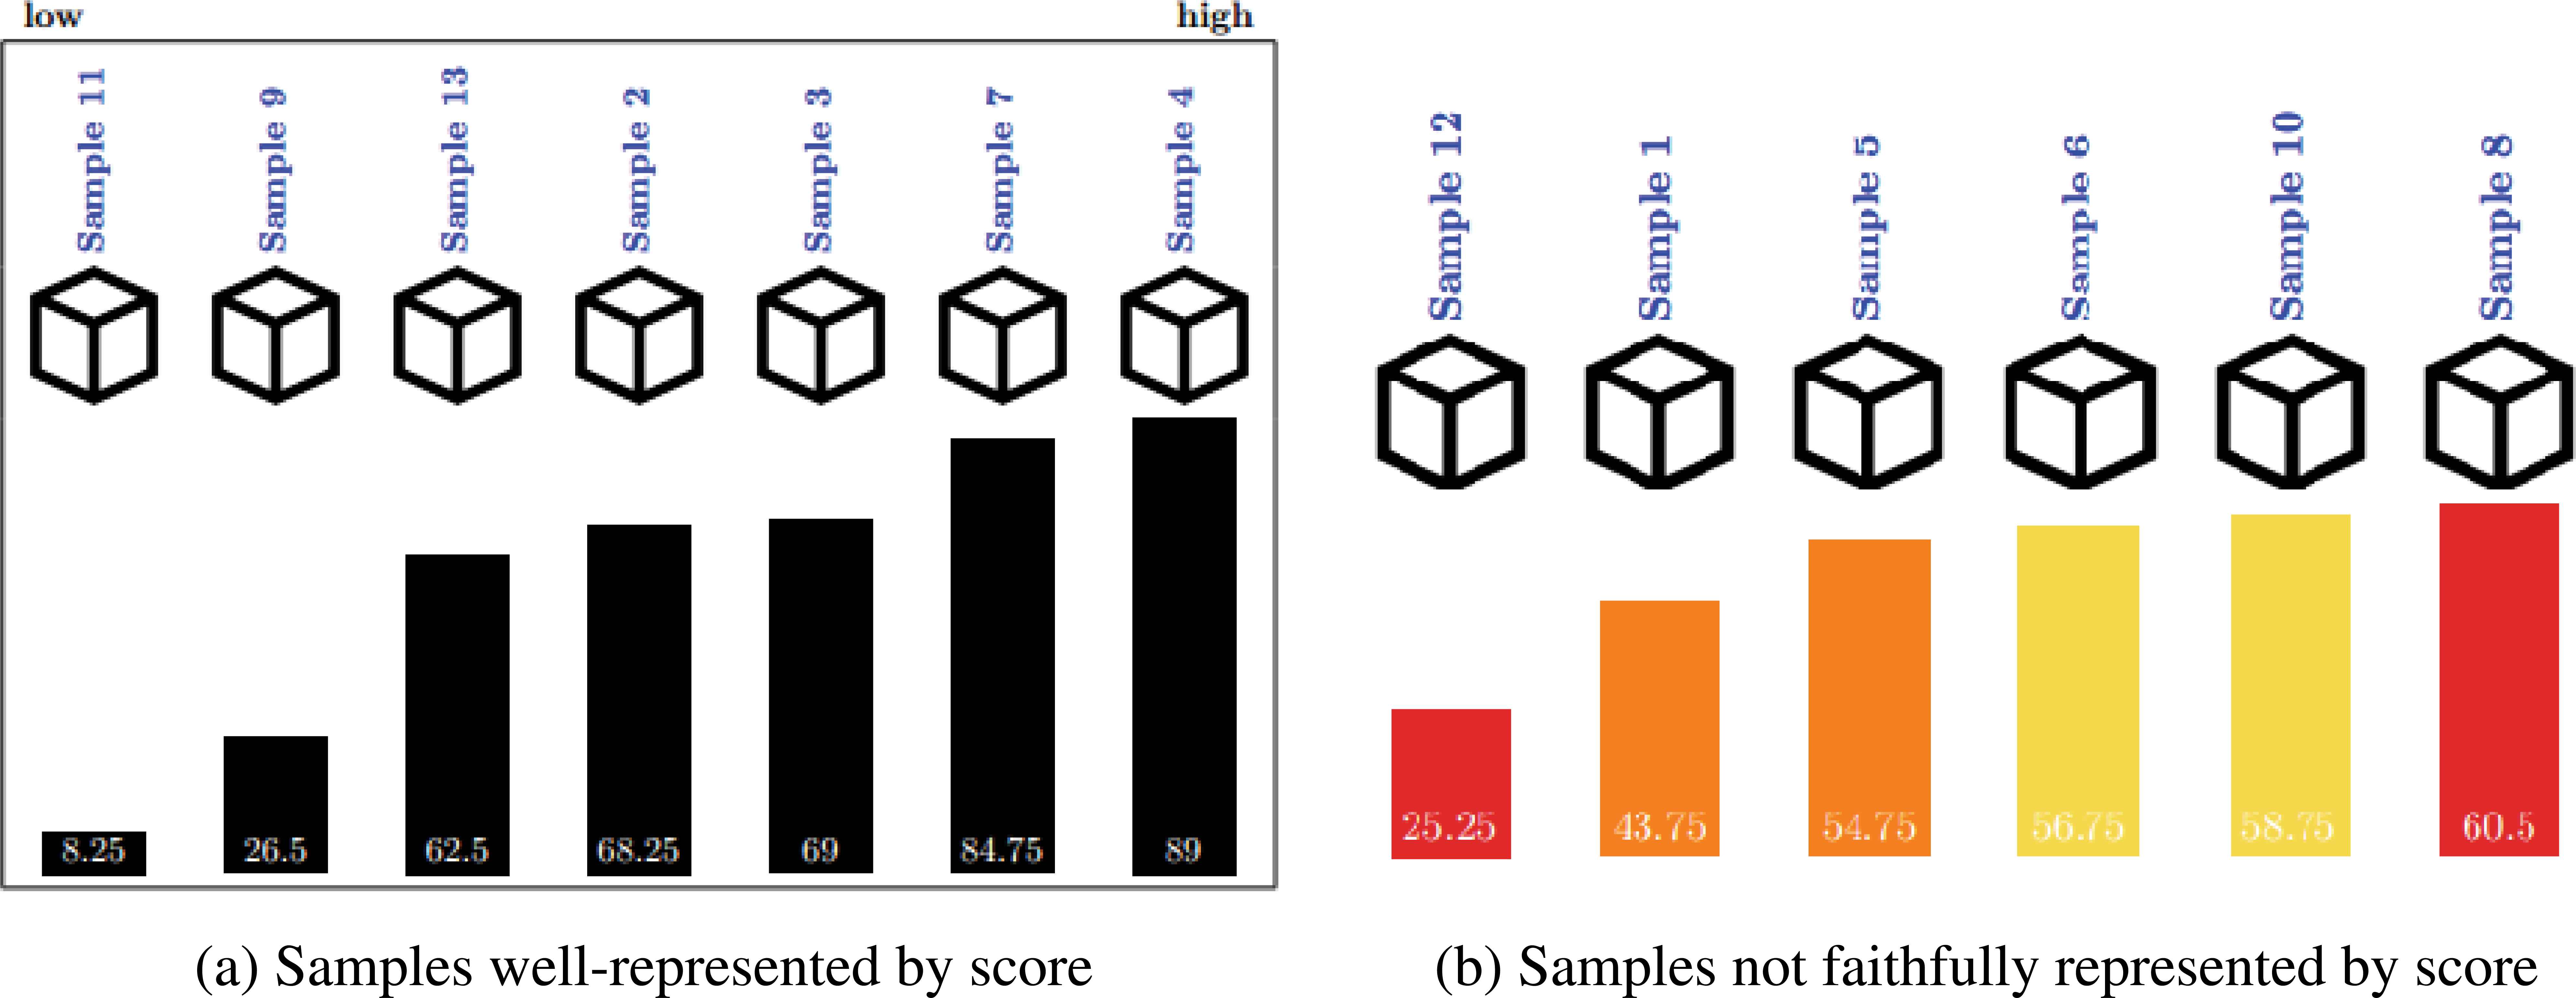
To do so, the scores obtained in Step 8 are taken into account, so the samples are ranked with respect to such values. However, it does not always faithfully represent the sample depending on the consensus of agreement. In order to distinguish such situations, those samples without faithful scores are set “in quarantine” and separated from the rest. Figure 6 shows an example with 13 samples. A first group of seven samples is shown on the left, ordered increasingly with respect to the associated score. On the right, the non-trustful samples are separated from the rest. A color code is used to identify three groups:
 the interval with the greatest associated percentage does not characterize a big enough number of individuals,
 the interval with the greatest associated percentage is too wide,
 there exists a second interval whose associated percentage is big enough.
Obviously, these three criteria depend on some thresholds that must be set by the researcher, for each specific survey. This selection influences the graphical representation of data, but not their obtaining, as the analysis remains the same.
Representation of normalized averaging operators.
Points with 70% of total of the aggregation.
Example of ranking of 13 samples.
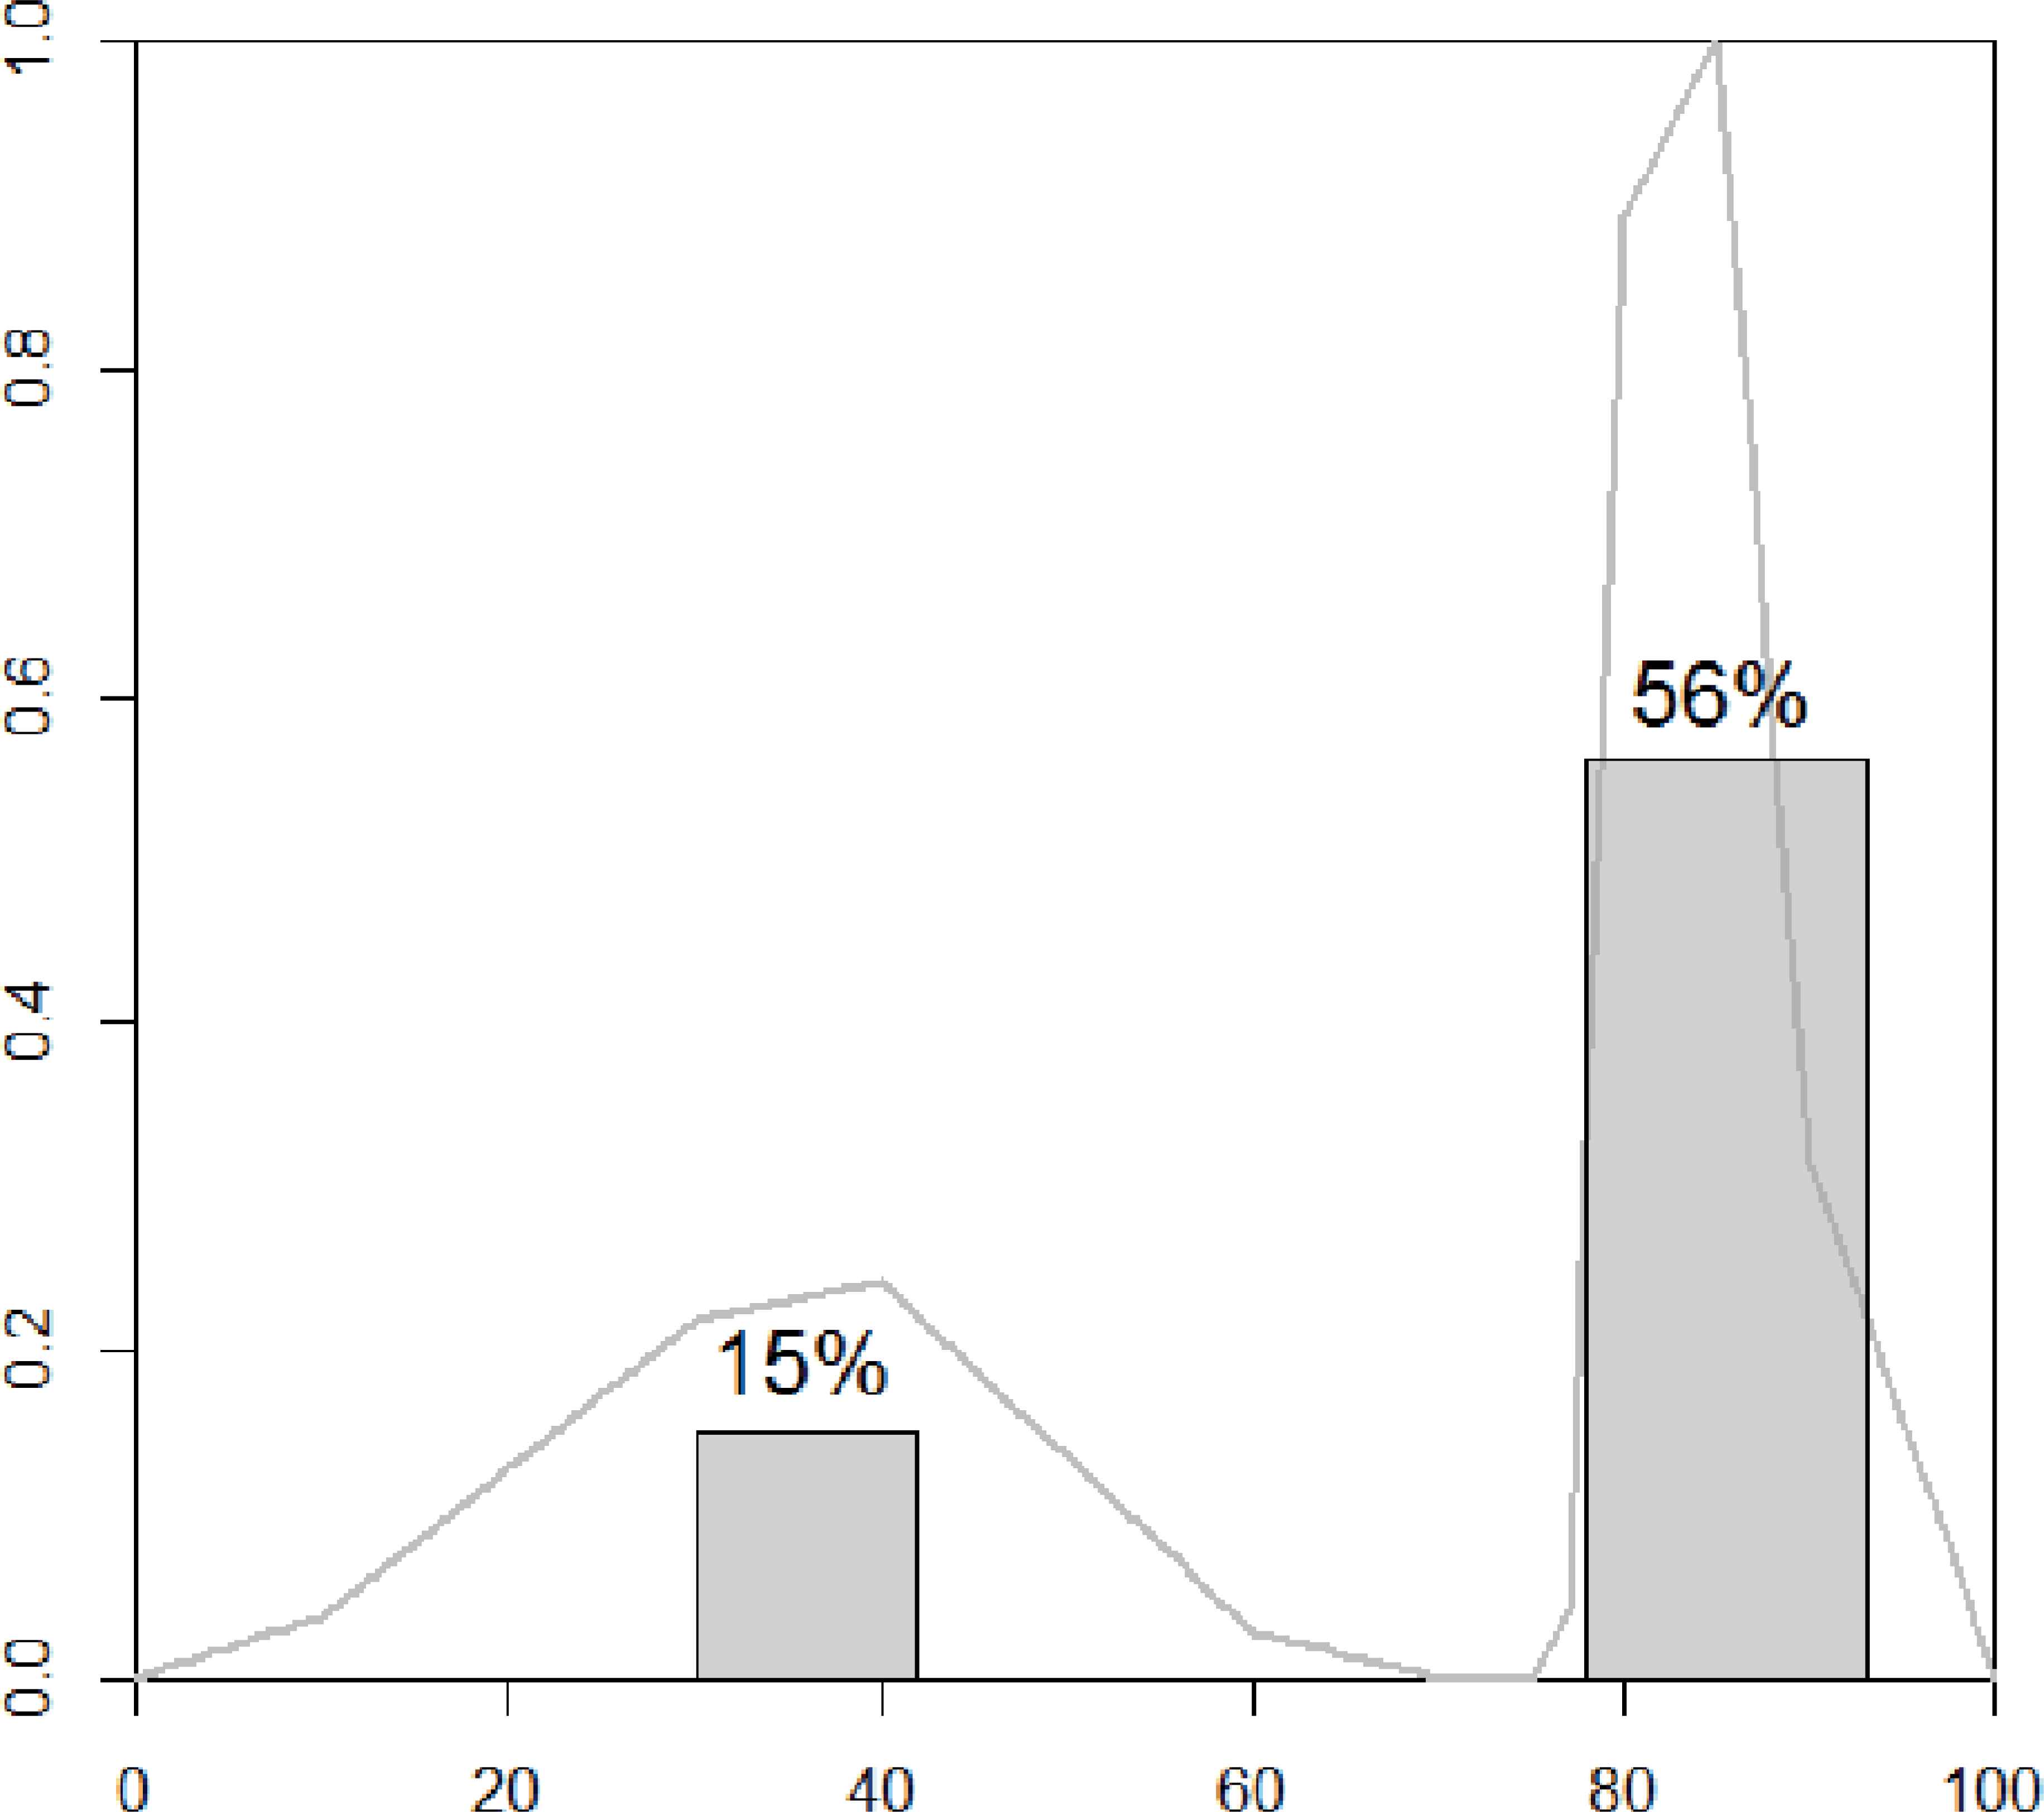
Intervals and their associated percentages obtained from points shown in Figure 5.
3.2. Comparative surveys
In this kind of surveys, the usual process consists in asking respondents to simply sort the samples under study. However, this way of doing has a main drawback. Namely, a respondent may think that two samples are too close and are indistinguishable in his/her opinion, but he/she is forced to rank one higher than the other.
In order to overcome this problem, we propose an extended version (supported by fuzzy rating scales) of the classical procedure. Firstly, respondents rank the samples as usual. After that, they are asked to assess the difference between every pair of consecutive ordered samples. To do so, the answer is given in a fuzzy rating scale (Figure 1(b)), where the extreme values are “Both samples are equal” and “Both samples are completely different”. In this way, if a respondent considers that two samples are indistinguishable with respect to the provided ranking, the value assigned between them will be the lowest possible one, while if he/she considers that they are not similar at all, the highest value will be chosen. This procedure enriches the semantic of the answers, allowing the user to better express his/her opinion.
The main task from here on out in this subsection is to analyze how to compute a final ranking from the single ones given by all respondents. As it was done in the descriptive case, we will detail the process step by step:
- Step 1:
Conduct the survey and collect the ranking of samples and the three values (Figure 1(b)) of the comparisons between every pair of consecutive samples from each respondent. Let us suppose that X = [0,100] without loss of generality.
- Step 2:
For each respondent, assign weights to each sample in accordance with data collected in the previous step. Let s1,…,sn be the samples to rank, and r1,…,rm be the respondents in the survey. Consider sσi(1) > ⋯ > sσi(n) the ranking provided by the i-th respondent, where σi is a permutation of {1,…,n}, and
In other words, the ranking and the differences provided by each respondent are turned into weights for each sample, where the best ranked sample is assigned a total weight (100), and for the others, 100 minus the sum of the values of the previous consecutive differences is assigned.
- Step 3:
Compute aggregated weights for each sample from the ones obtained in Step 2 from each respondent.
where wj(si) are obtained as in Equation (5), ∀i, j. - Step 4:
Compute the final ranking. Consider w(s1),…,w(sn) the weights for each sample obtained by Equation (6). Then, the ranking obtained by aggregating all the responses is calculated by ordering decreasingly the weights of the samples. Formally,
is the aggregated ranking, where σ is a permutation of {1,…,n} such thatIn case that ∃ j ∈ {1,…,n − 1} such that w(sσ(j)) = w(sσ(j+1)), then sσ(j) ≡ sσ(j+1).
The process described above allows us to obtain the aggregated ranking. However, the fuzzy information provided by the respondents have not been used yet, as only the central value of the pairwise differences has been considered in the previous process.
Actually, some extra outcomes can be obtained from this type of comparative surveys, taking into account the fuzzy part of the answers. Indeed, it is a parallel process to the one described in the previous subsection, in order to obtain graphical representations like Figure 7. First of all, we have to define a procedure to build a fuzzy set associated to each sample and respondent in a similar way to how we did in Subsection 3.1.
To do that, an analogous procedure to the one explained in Step 2 and Equation (5) is carried out with the lower and upper values of each difference between consecutive samples (i.e.,
Consequently,
Once we have built these triangular fuzzy sets, then Steps 3 to 8 of the descriptive procedure can be carried out with them. It must be noted that, instead of aggregating the answers of the users with respect to each attribute in Step 3, we aggregate them with respect to each sample. In this way, a graphic like Figure 7 is produced with the aggregation of the answers with respect to such sample.
Both procedures introduced in this section provide different fuzzy approaches to conduct descriptive and comparative surveys.
4. Experimental analysis
This section presents two use cases where we have tested and validated the proposals made in this paper. Both cases have been developed with the help of the software called Quale® 36.
Figure 8 sketches Quale® software architecture. It follows a Model-View-Controller architectural pattern. Firstly, the Model is stored in a database (with the definition of samples and attributes to evaluate along with the profile of required respondents). Secondly, the View is implemented in the form of two alternative user interfaces regarding survey configuration and analysis (desktop application) but also online data capture (web page survey). Finally, the Controller consists of a report generator module. It is in charge of automatically processing data coming out from fuzzy rating scale-based questionnaires. Moreover, it produces a report made up of a set of graphs and texts in a user-friendly style which can be customized in accordance with the reader’s preferences. This report is generated combining packages from softwares R and LATEX.
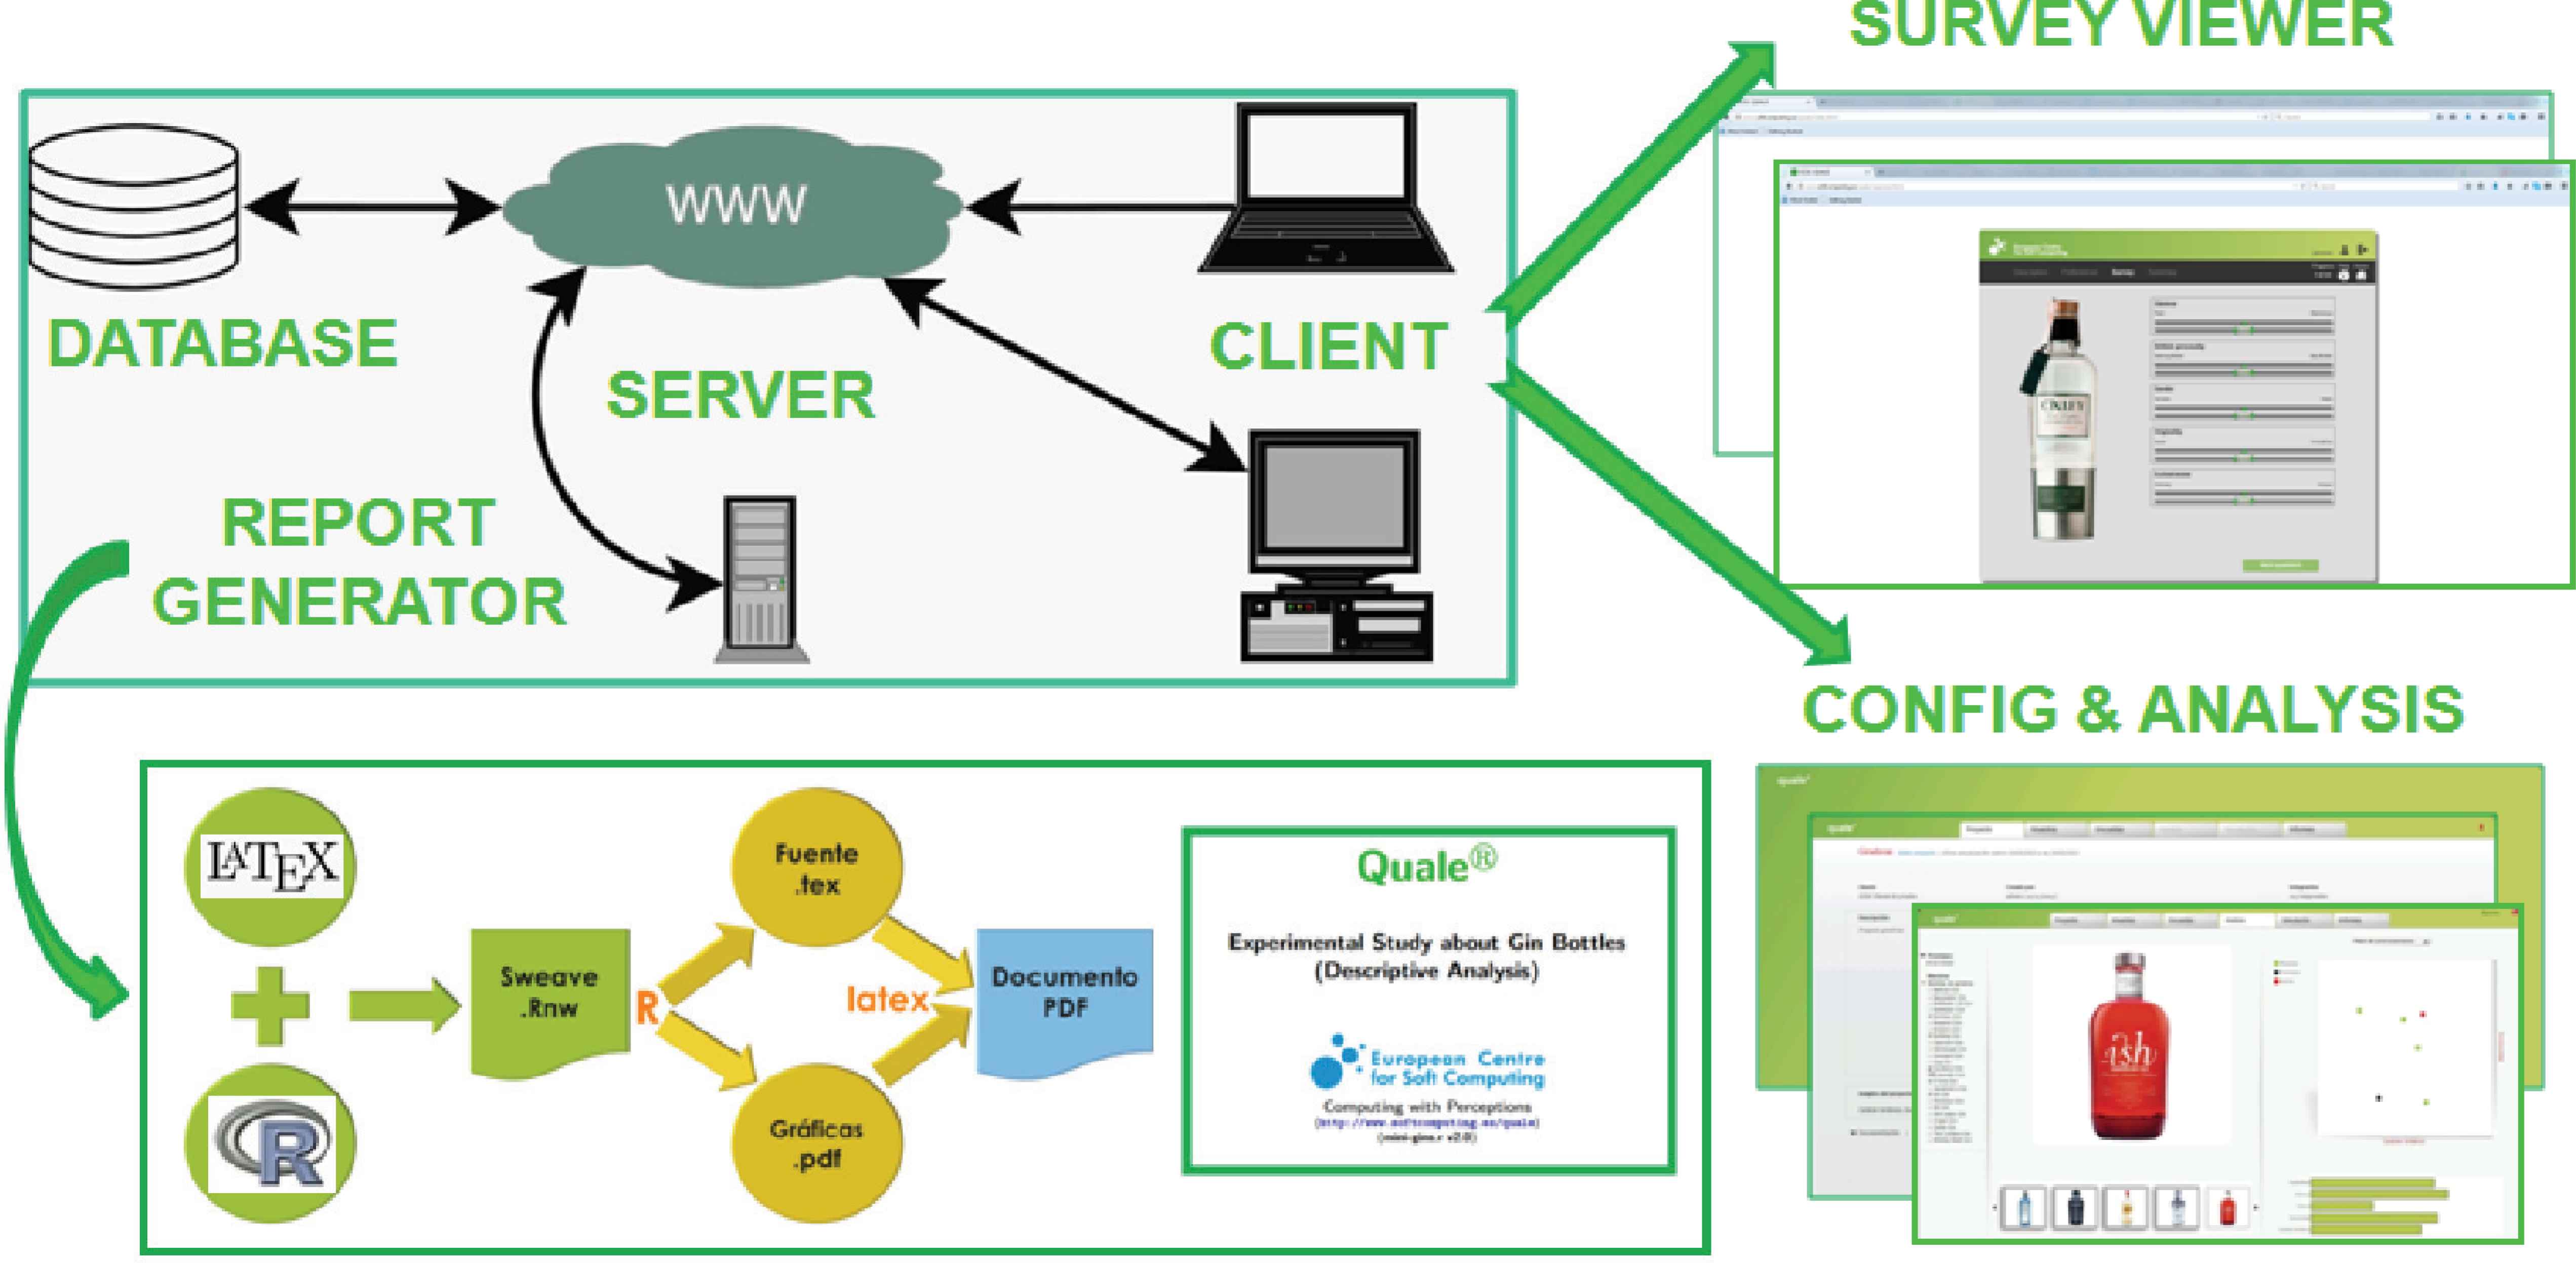
Quale® software architecture.
The rest of this section goes in depth with the two selected use cases. The first case focuses on the descriptive analysis of human perceptions while the second one tackles with its comparative counterpart.
4.1. Descriptive survey
The Poshmakersd, a well-recognized multi-sectorial product and services creator, proposed in 2011 the creation of the most desired premium gin brand named Ish London Dry. The challenge was to build up a new brand from scratch, presenting a superior notoriety that favored its commercial introduction. The product specification remarked the need for notoriety but without prejudicing against its credibility and confidence in a high competitive niche. Monetary limitations constrained the quantity and quality of the labeled, packaging elements, and communication campaigns. The interested reader can get detailed information at 36.
With the aim of validating the packaging of Ish London Dry, we conducted a descriptive survey regarding 24 gin bottles available in the market. Respondents were asked, using fuzzy rating scales, about aesthetic attributes of the bottles such as: British character, exclusivity, gender, glamour and originality. The answers were defined in the space X = [0,100]. For illustrative purpose, here we will focus only on the analysis of exclusivity.
We collected responses from 50 valid respondents that answered the survey. Moreover, they were asked about additional information (country, sex, etc.) in order to make group analyses later.
The parameter k from the variable heights (given by Equation (3)) selected for this experiment has been k = 10, representing that an amplitude lower than 10% of the space has maximum height, and it starts to decrease from this point on.
Figures 9 and 10 present the ranking of bottles for the attribute exclusivity with respect to the associated score.
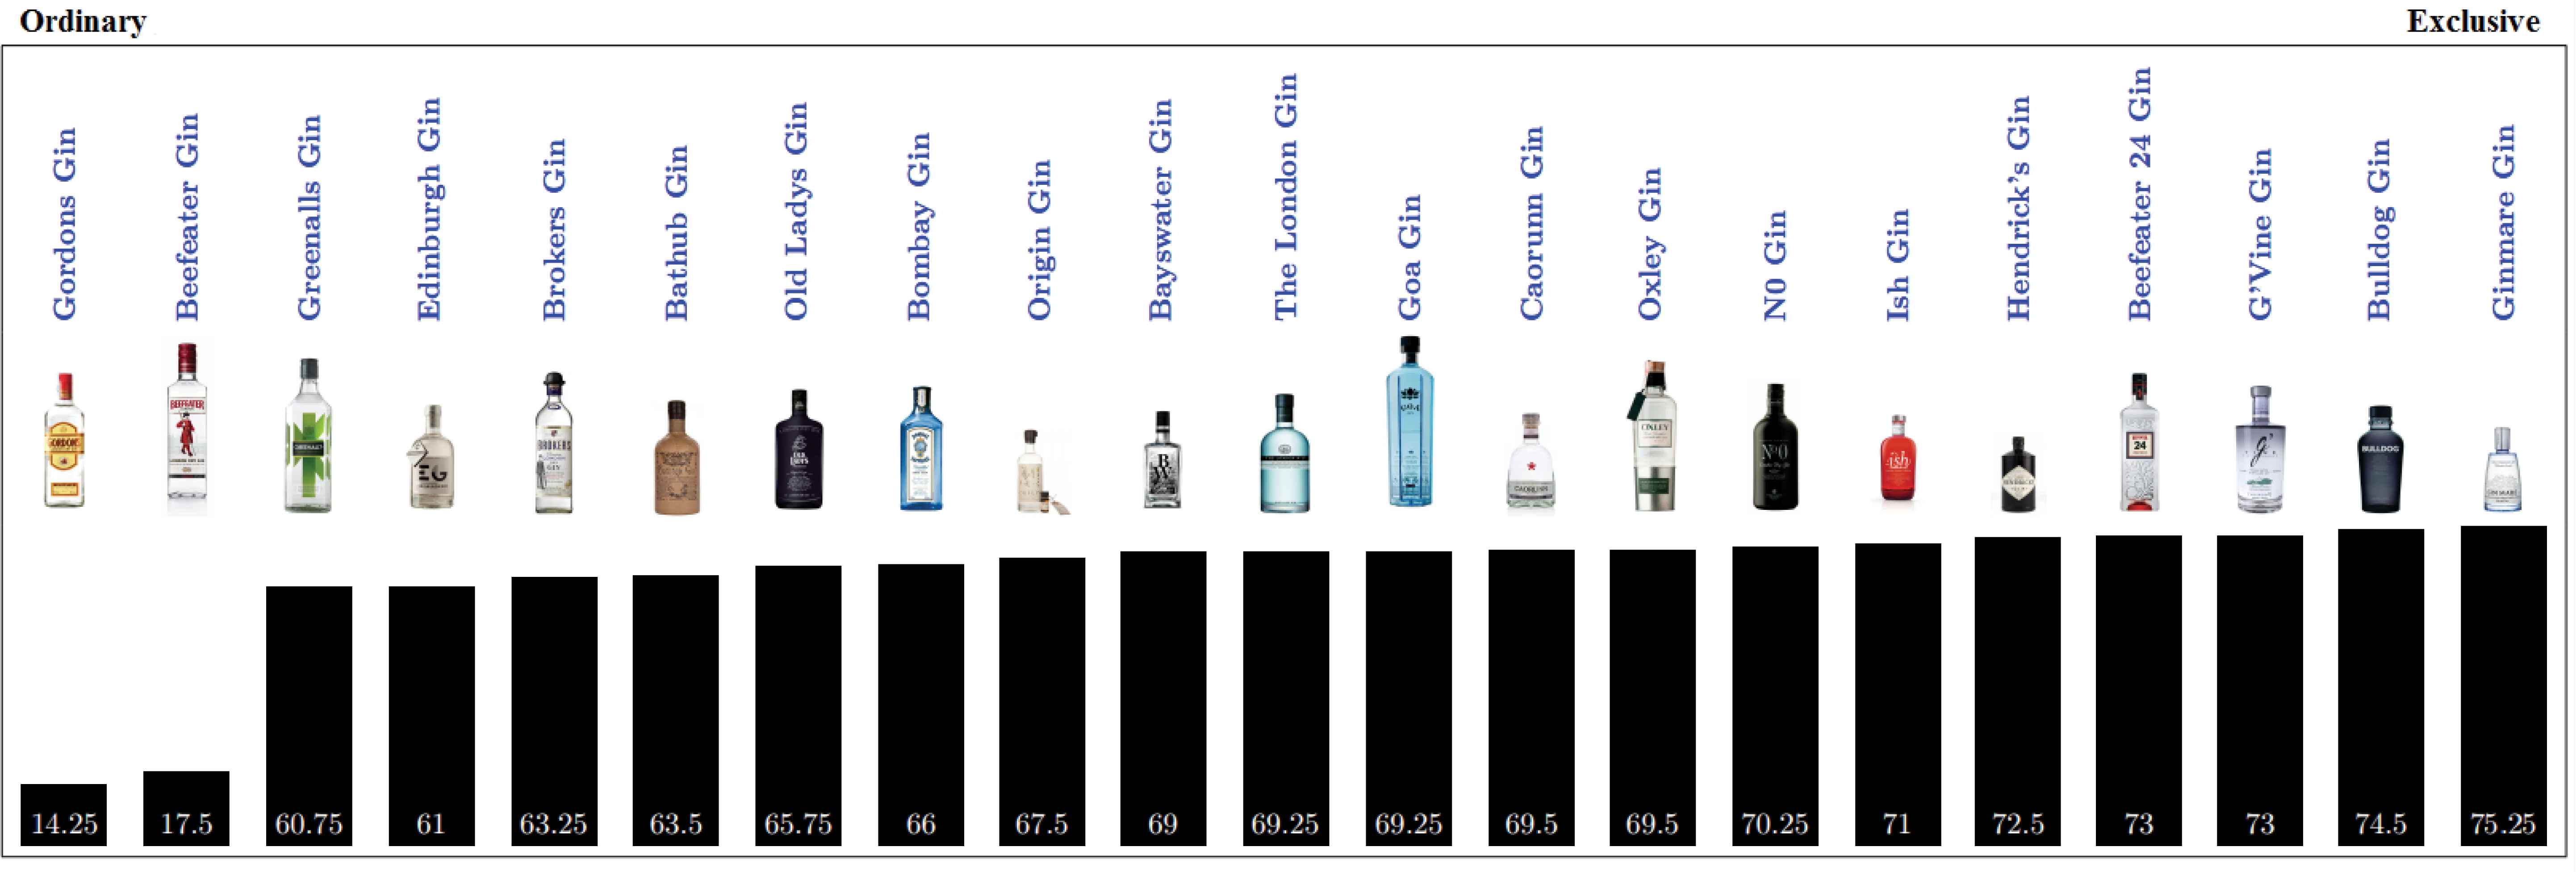
Ranking of bottles according to perceived exclusivity.
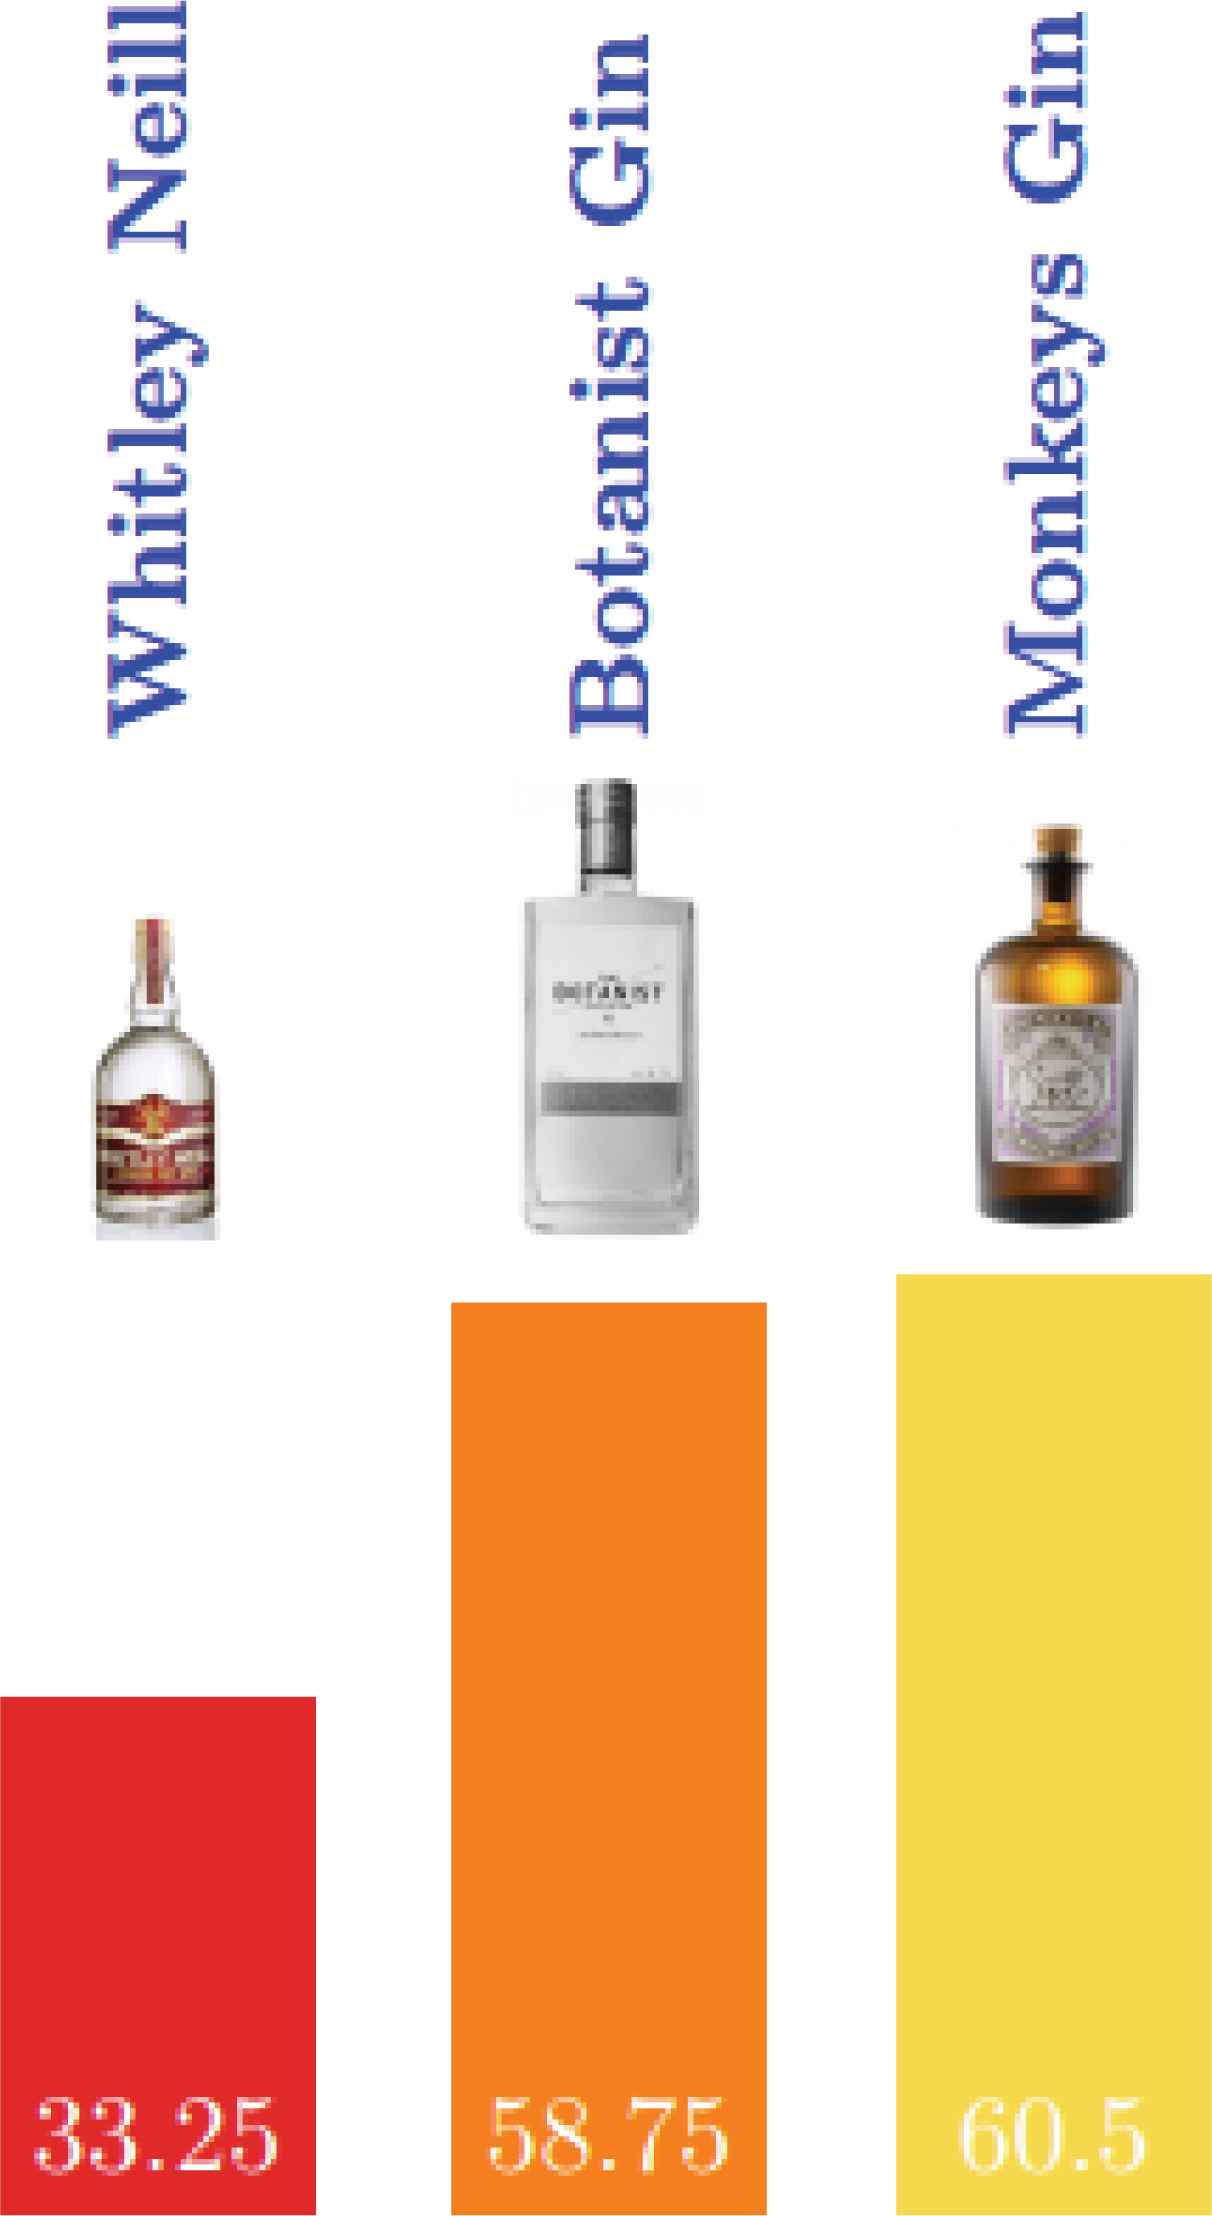
Bottles that require careful attention.
Figure 9 shows that bottles with the least exclusivity are Gordon Gin (14.25) and Beefeater Gin (17.5). However, between the others (without taking care of the isolated ones in Figure 10) the score is really close with respect to such attribute (from 60.75 to 75.25). Ish London Dry is the sixth in the ranking. This fact means that respondents consider it among the most exclusive gin bottles in the market, as it was desired by The Poshmakers. Moreover, the same analysis with respect to the other considered attributes (British character, gender, glamour and originality) reflected that Ish London Dry is always in the top part of the related rankings even though it is not pointed out as the best one for none of them.
As it has been stated, samples which are not faithfully represented by the attached score are isolated and plotted separately as shown in Figure 10. The color code depends on some thresholds as it has been aforementioned. In this experiment, these thresholds are as follows:
 the interval with the greatest associated percentage does not characterize at least 40% of individuals,
 the width of the interval with the greatest associated percentage is over the 40% of the whole range,
 there exists a second interval whose associated percentage is at least half the percentage of the first one.
In order to provide a numerical comparison, Table 1 shows the reported scores with respect to the attribute exclusivity. The first row reports values coming out of the Aumann-type mean given in Definition 3. The second row provides the values computed by the proposed process described in Subsection 3.1. The absolute differences are calculated in the third row. Finally, the variance associated to the answers for each sample can be found in the fourth row of the table. This variance is obtained through the function Bvar of R software package SAFD, which computes it using Bertoluzza distance 37.
| Sample | Bayswater | Goa | Brokers | Bulldog | Origin | G’Vine | Bathub | Ginmare |
|---|---|---|---|---|---|---|---|---|
| Aumann | 61.88 | 62.22 | 54.5 | 66.22 | 61.08 | 69.72 | 60.10 | 71.18 |
| New approach | 69 | 69.25 | 63.25 | 74.5 | 67.5 | 73 | 63.5 | 75.25 |
| Abs. dif. | 7.12 | 7.03 | 8.75 | 8.28 | 6.42 | 3.28 | 3.4 | 4.07 |
| Variance | 385.59 | 380.17 | 346.55 | 267.84 | 405.52 | 254.12 | 544.16 | 247.31 |
| Sample | N0 | Edinburgh | Ish | Monkeys | Hendrick’s | Bombay | Oxley | Beefeater 24 |
|---|---|---|---|---|---|---|---|---|
| Aumann | 67.84 | 60.38 | 67.54 | 46.48 | 63.40 | 49.80 | 65.06 | 58.52 |
| New approach | 70.25 | 61 | 71 | 60.5 | 72.5 | 66 | 69.5 | 73 |
| Abs. dif. | 2.41 | 0.62 | 3.46 | 14.02 | 9.1 | 16.2 | 4.44 | 14.48 |
| Variance | 234.12 | 437.88 | 307.99 | 633.35 | 430.19 | 572.21 | 341.99 | 433.5 |
| Sample | Botanist | Old Lady’s | London | Beefeater | Gordons | Greenalls | Whitley Neill | Caorunn |
|---|---|---|---|---|---|---|---|---|
| Aumann | 54.68 | 60.76 | 65.72 | 24.92 | 18.14 | 51.94 | 49.84 | 58.96 |
| New approach | 58.75 | 65.75 | 69.25 | 17.5 | 14.25 | 60.75 | 33.25 | 69.5 |
| Abs. dif. | 4.07 | 4.99 | 3.53 | 7.42 | 3.89 | 8.81 | 16.59 | 10.54 |
| Variance | 504.44 | 495.44 | 197.3 | 432.92 | 191.01 | 373.33 | 471.65 | 376.3 |
Table with scores associated to each sample for attribute exclusivity with respect to the Aumann-type mean (Definition 3) in the first row and the new approach proposed (Subsection 3.1) in the second row. Third row provides the absolute differences between them. Fourth row, shows the variance of the answers for each sample with respect to exclusivity.
With the aim of analyzing deeply the possible relation between the absolute differences and the variance associated to the answers for each sample, we have computed the correlation between them. The result is a correlation of 0.51, which means that 26% of one variable is explained by the other. In other words, the variance of the answers is related to a certain extent to the difference between both methods, thus getting more dissimilar results when there is less consensus among respondents.
Figure 11 shows two particular examples for Ish Gin and Bombay Gin, where the normalized mean (averaging operator for p = 1) is displayed for both fixed (dashed curve) and variable heights (continue curve), along with the values obtained with both procedures, the one with Aumann-type mean, and the proposed one in Subsection 3.1.

Graphical representation for bottles Ish Gin and Bombay Gin of normalized mean with fixed heights (dashed curve) and variable height (continue curve). In addition, Aumann-type mean (■) and score obtained by the proposed procedure (▲) are also displayed.
Figure 11(a) (Ish Gin) illustrates a single accumulation area. The results provided by both procedures are similar (67.54 for Aumann-type mean, 71 for the new procedure).
On the contrary, Figure 11(b) (Bombay Gin) reflects the ability of the proposed method to identify groups of opinion in situations with more than one accumulation area. The new method associated score is 66, and as it can be observed, it is in the center of a clear accumulation answers area. However, the Aumann-type mean gets the value 49.8, which does not represent any area with a big amount of answers accumulated. This is due to the existence of two main accumulation areas, one around 20 and another around 60. As the procedure of Aumann-type mean is the average of the central value, it is not surprising that sometimes it may end up in an area with a small number of individuals associated, what presents a clear drawback.
We have carried out similar analyses for specific groups of respondents. Figure 12 shows an example with Botanist Gin with respect to the group Sex. Both displayed graphics show the results provided by the procedure in Subsection 3.1, but only taking into account the respondents in the respective group: men or women. It is remarkable the fact that Botanist Gin is perceived as more exclusive for men than for women in this case, which is reflected in the generated intervals. It must be noted that although this bottle is an isolated sample (see Figure 10), its group analyses with respect to feature Sex are faithfully represented by the score.
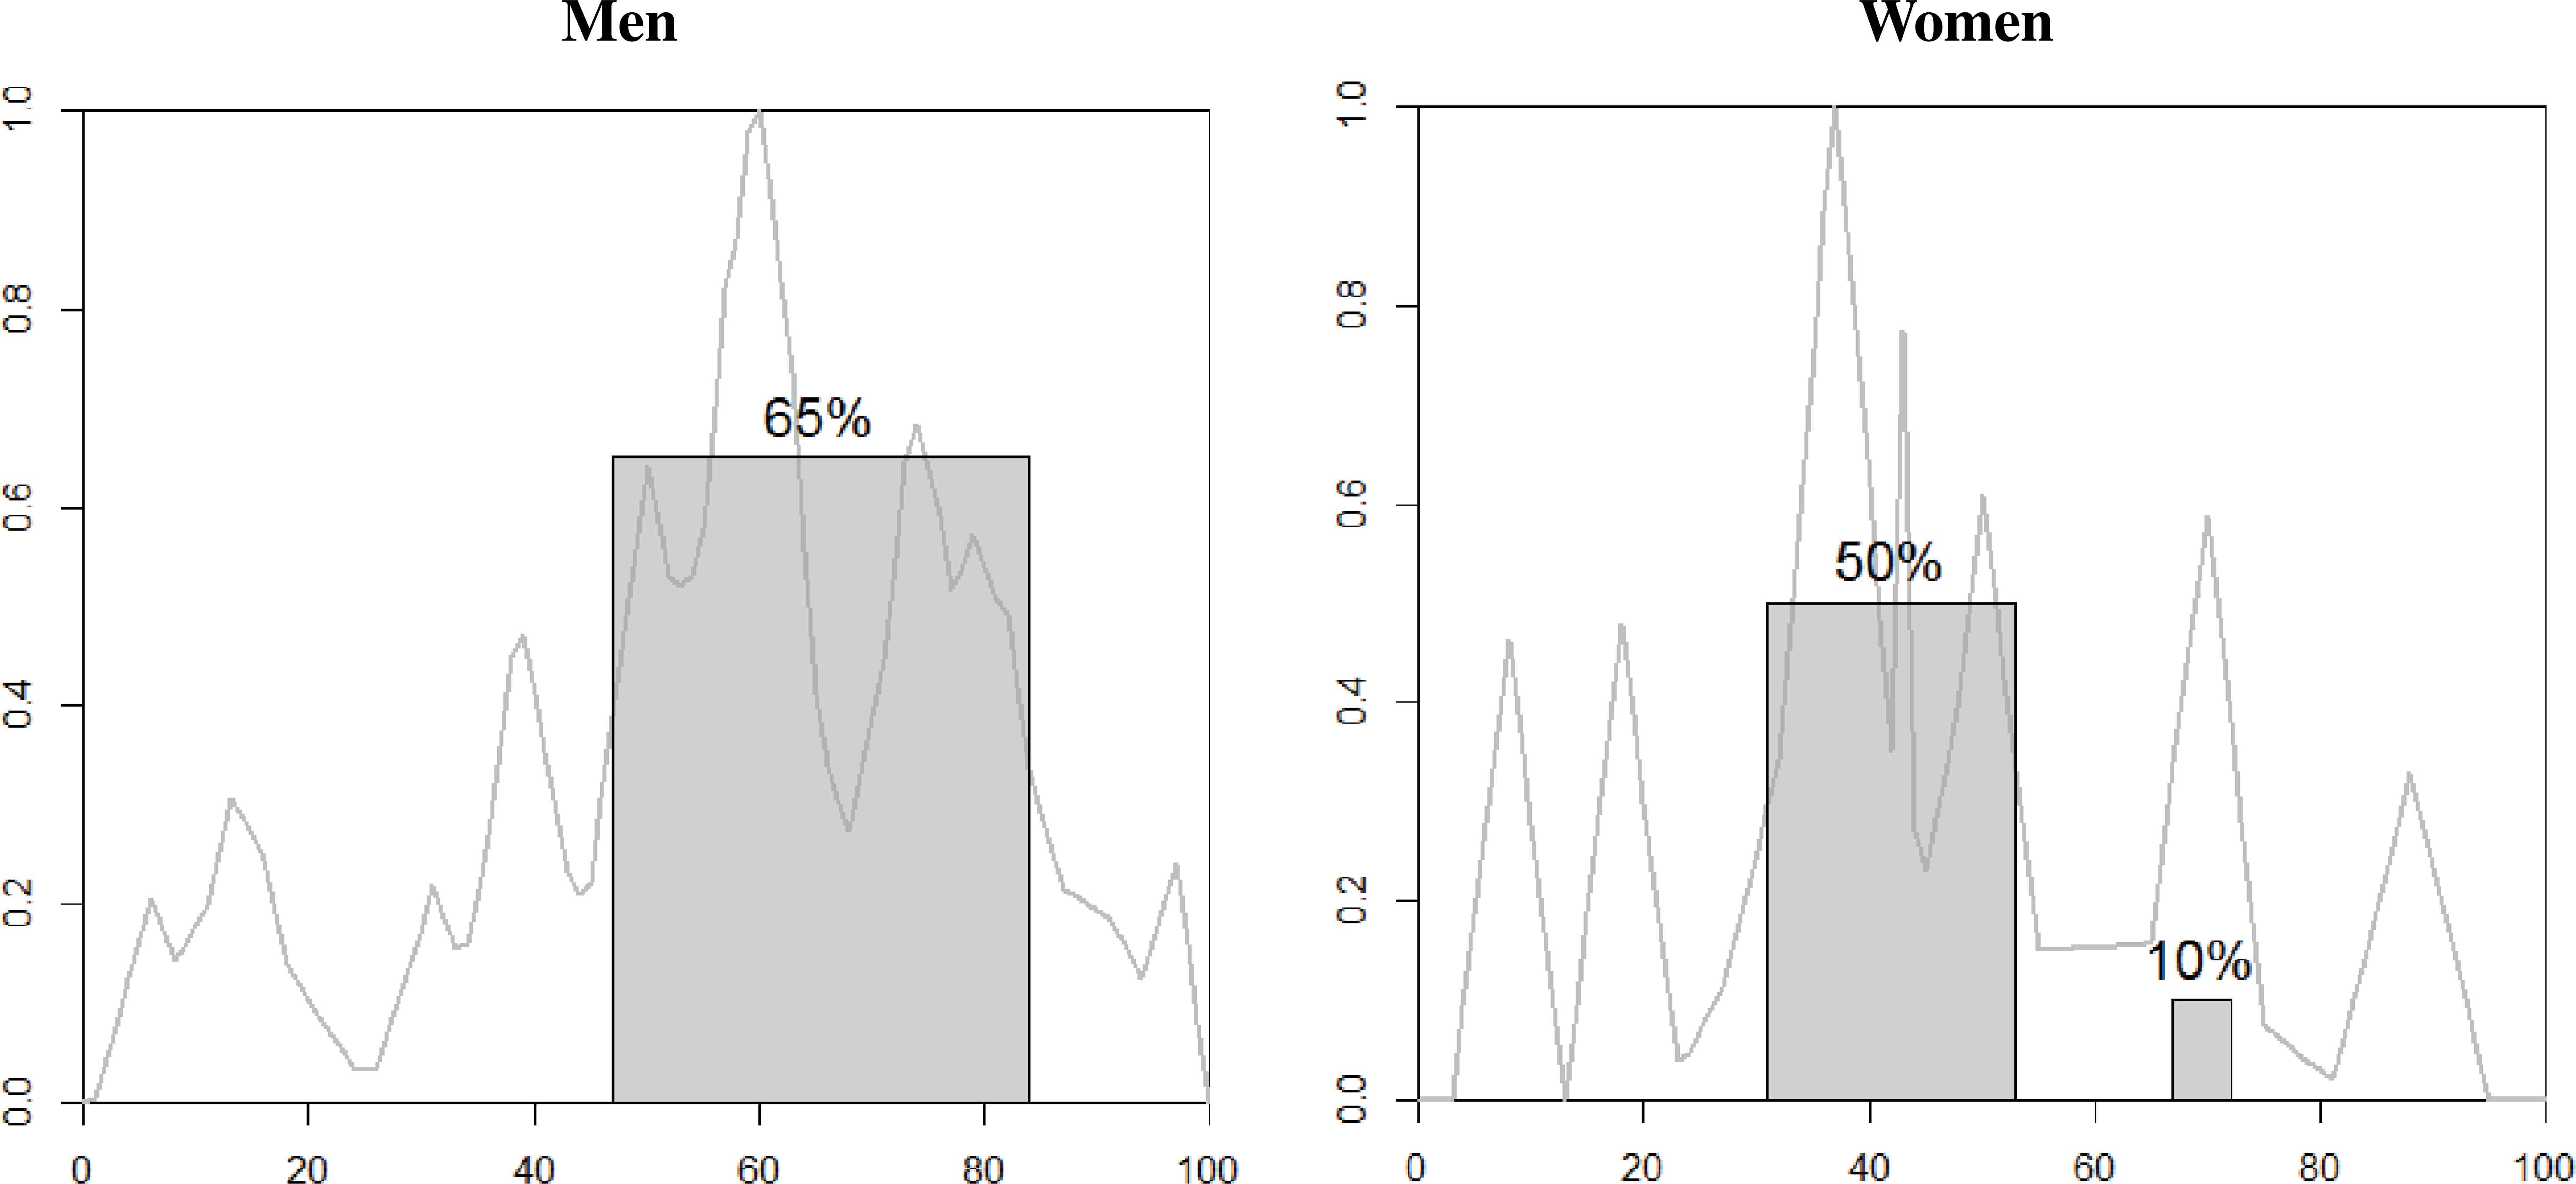
Graphical representation of attribute exclusivity for bottle Botanist Gin with respect to group sex. For men and women, respectively.
These group analyses can be made as long as the number of respondents in each group is representative. In case several groups have small number of respondents, then they may be fused to form another more representative group.
As it has been previously stated, the main advantage of the proposed procedure is its ability to identify the greatest accumulation area of answers even if there is another important one. On the other hand, the Aumann-type mean is not sensitive to these situations, as it has been shown in Figure 11. If the aim of the survey is to find groups of opinion, this new approach successfully allows their identification with the score associated, unlike the Aumanntype mean.
4.2. Comparative survey
The following experiment was carried out in the 2015 IFSA-EUSFLAT Conference, where a comparative question was proposed to the participants. We asked about the goodness of the different activities of this conference, Coffee Breaks, Parallel Sessions, Plenary Talks and Social Events, in terms of networking. Answers were given as exposed in Subsection 3.2. Respondents first ranked the four activities, and then, they evaluated the difference between every pair of consecutive activities using a fuzzy rating scale. The differences were defined in the space X = [0,100].
We collected answers from 70 valid respondents in this survey. Information about them (country, type of institution, etc.) was also collected in order to make group analyses later.
As in the descriptive experiment, the selected parameter k from Equation (3) has been k = 10. Thus, an amplitude lower than 10% of the space has maximum height, decreasing from this point.
In Figure 13, the obtained ranking of the four activities in terms of networking is shown. The values in the black bars are the ones calculated through the steps described in Subsection 3.2. Note that the orders obtained by this new approach and the classical one of simply adding the positions of each sample in all the orders provided by the respondents do not necessarily match, although in this example they do.
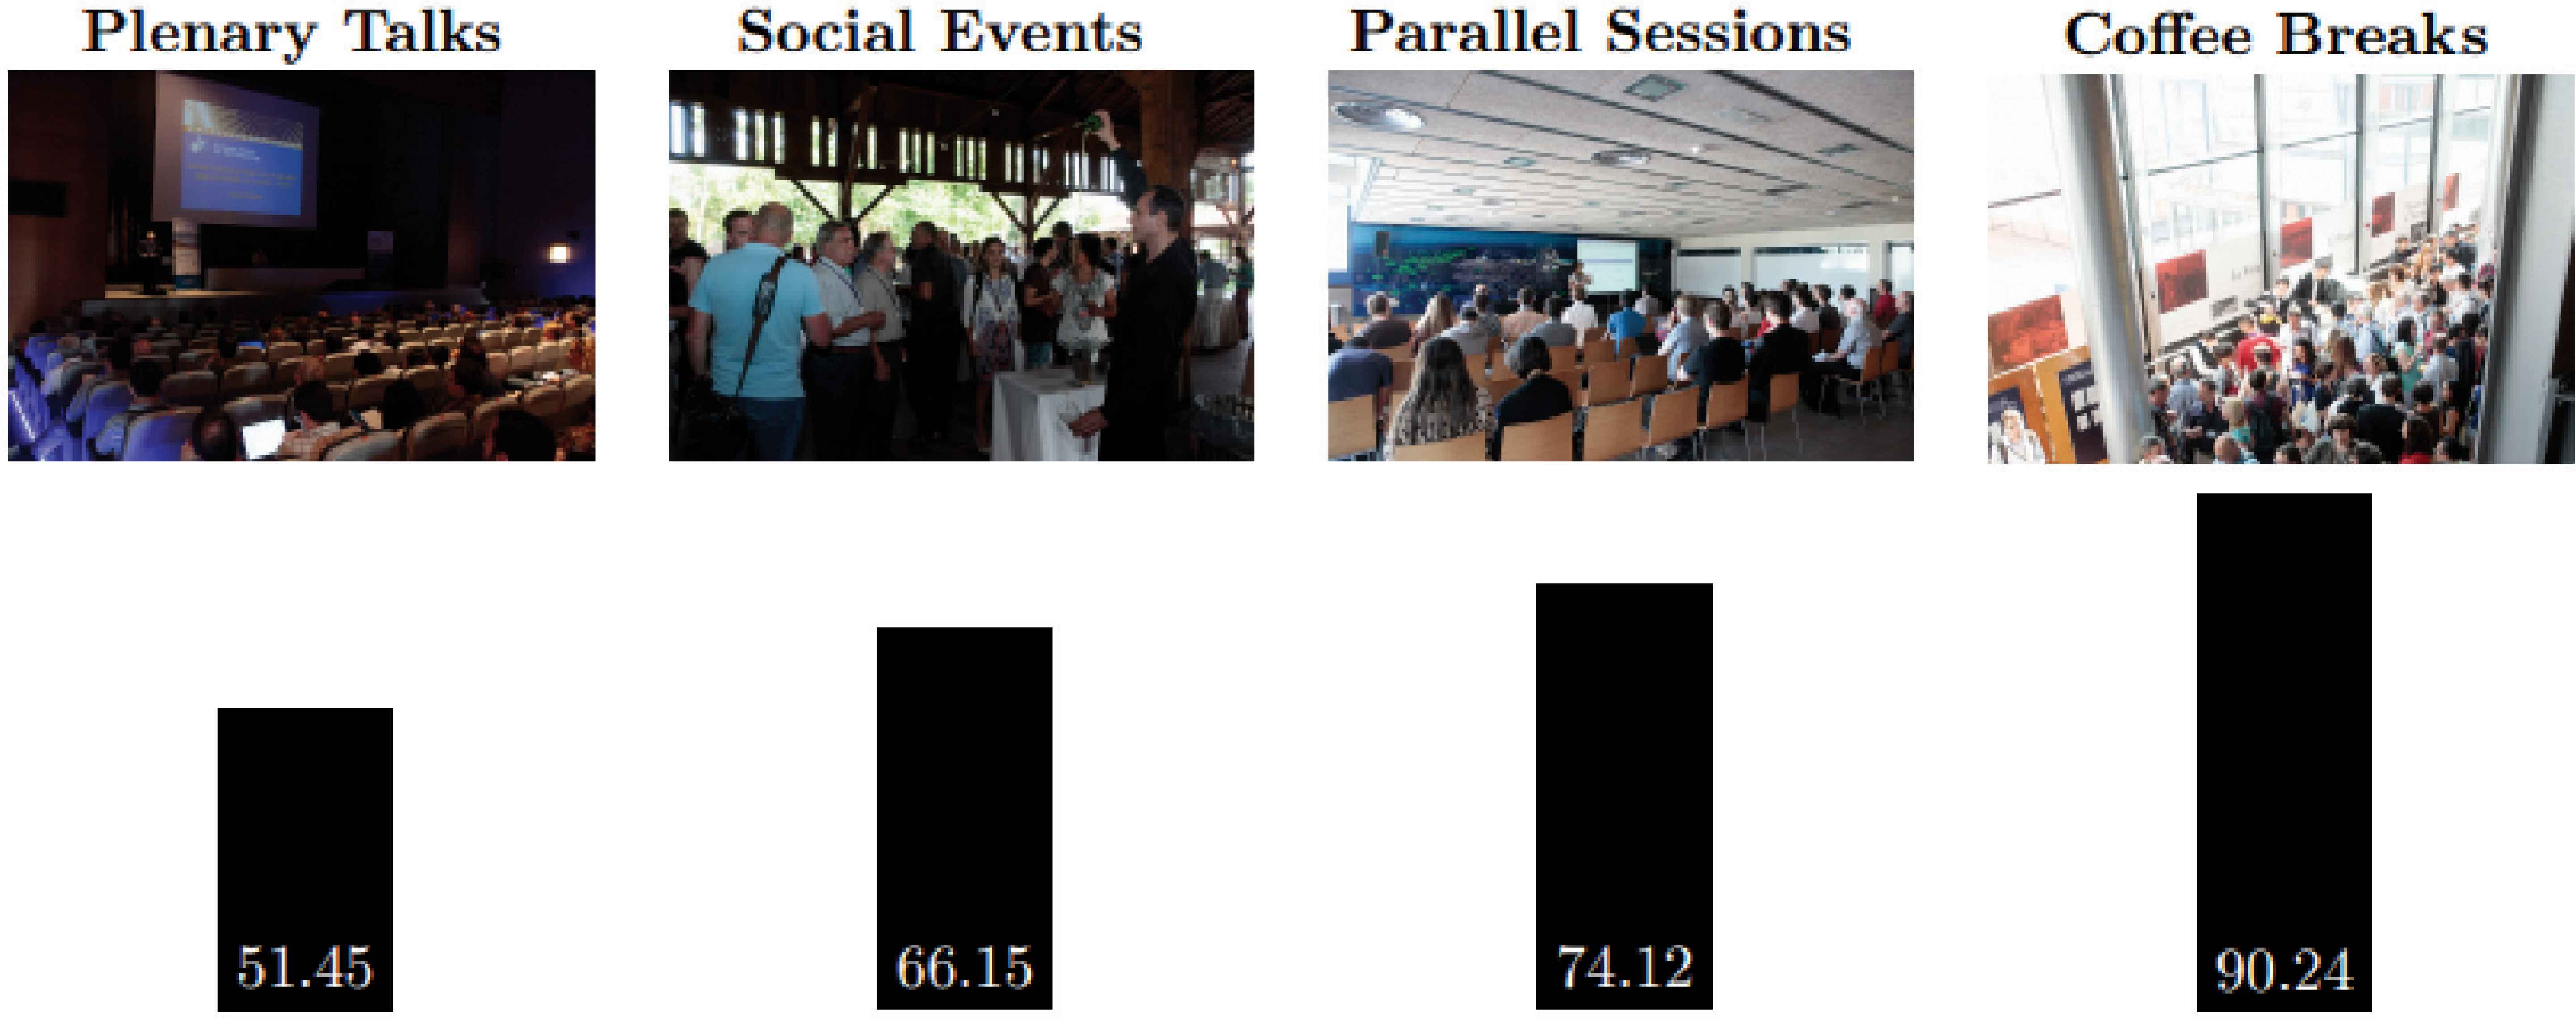
Ranking of conference events in terms of networking.
As it has been developed in Subsection 3.2, some extra data is obtainable taking into account the fuzzy information provided by respondents. Figure 14 shows four graphics, associated to each activity to rank. These graphics represent the aggregated mean of the triangular fuzzy sets previously computed for each respondent by Equations (5), (7) and (8), as well as the intervals and associated percentages resulting after running the process described in Subsection 3.1. They are in accordance with the ranking given in Figure 13. Coffee Breaks was chosen as the first option by most respondents, as a 63% are characterized by the single point 100. Assessments related to Parallel Sessions yield a high concentration in the higher values of the range. The goodness of Social Events and Plenary Talks is similar since they have similar aggregated curves.
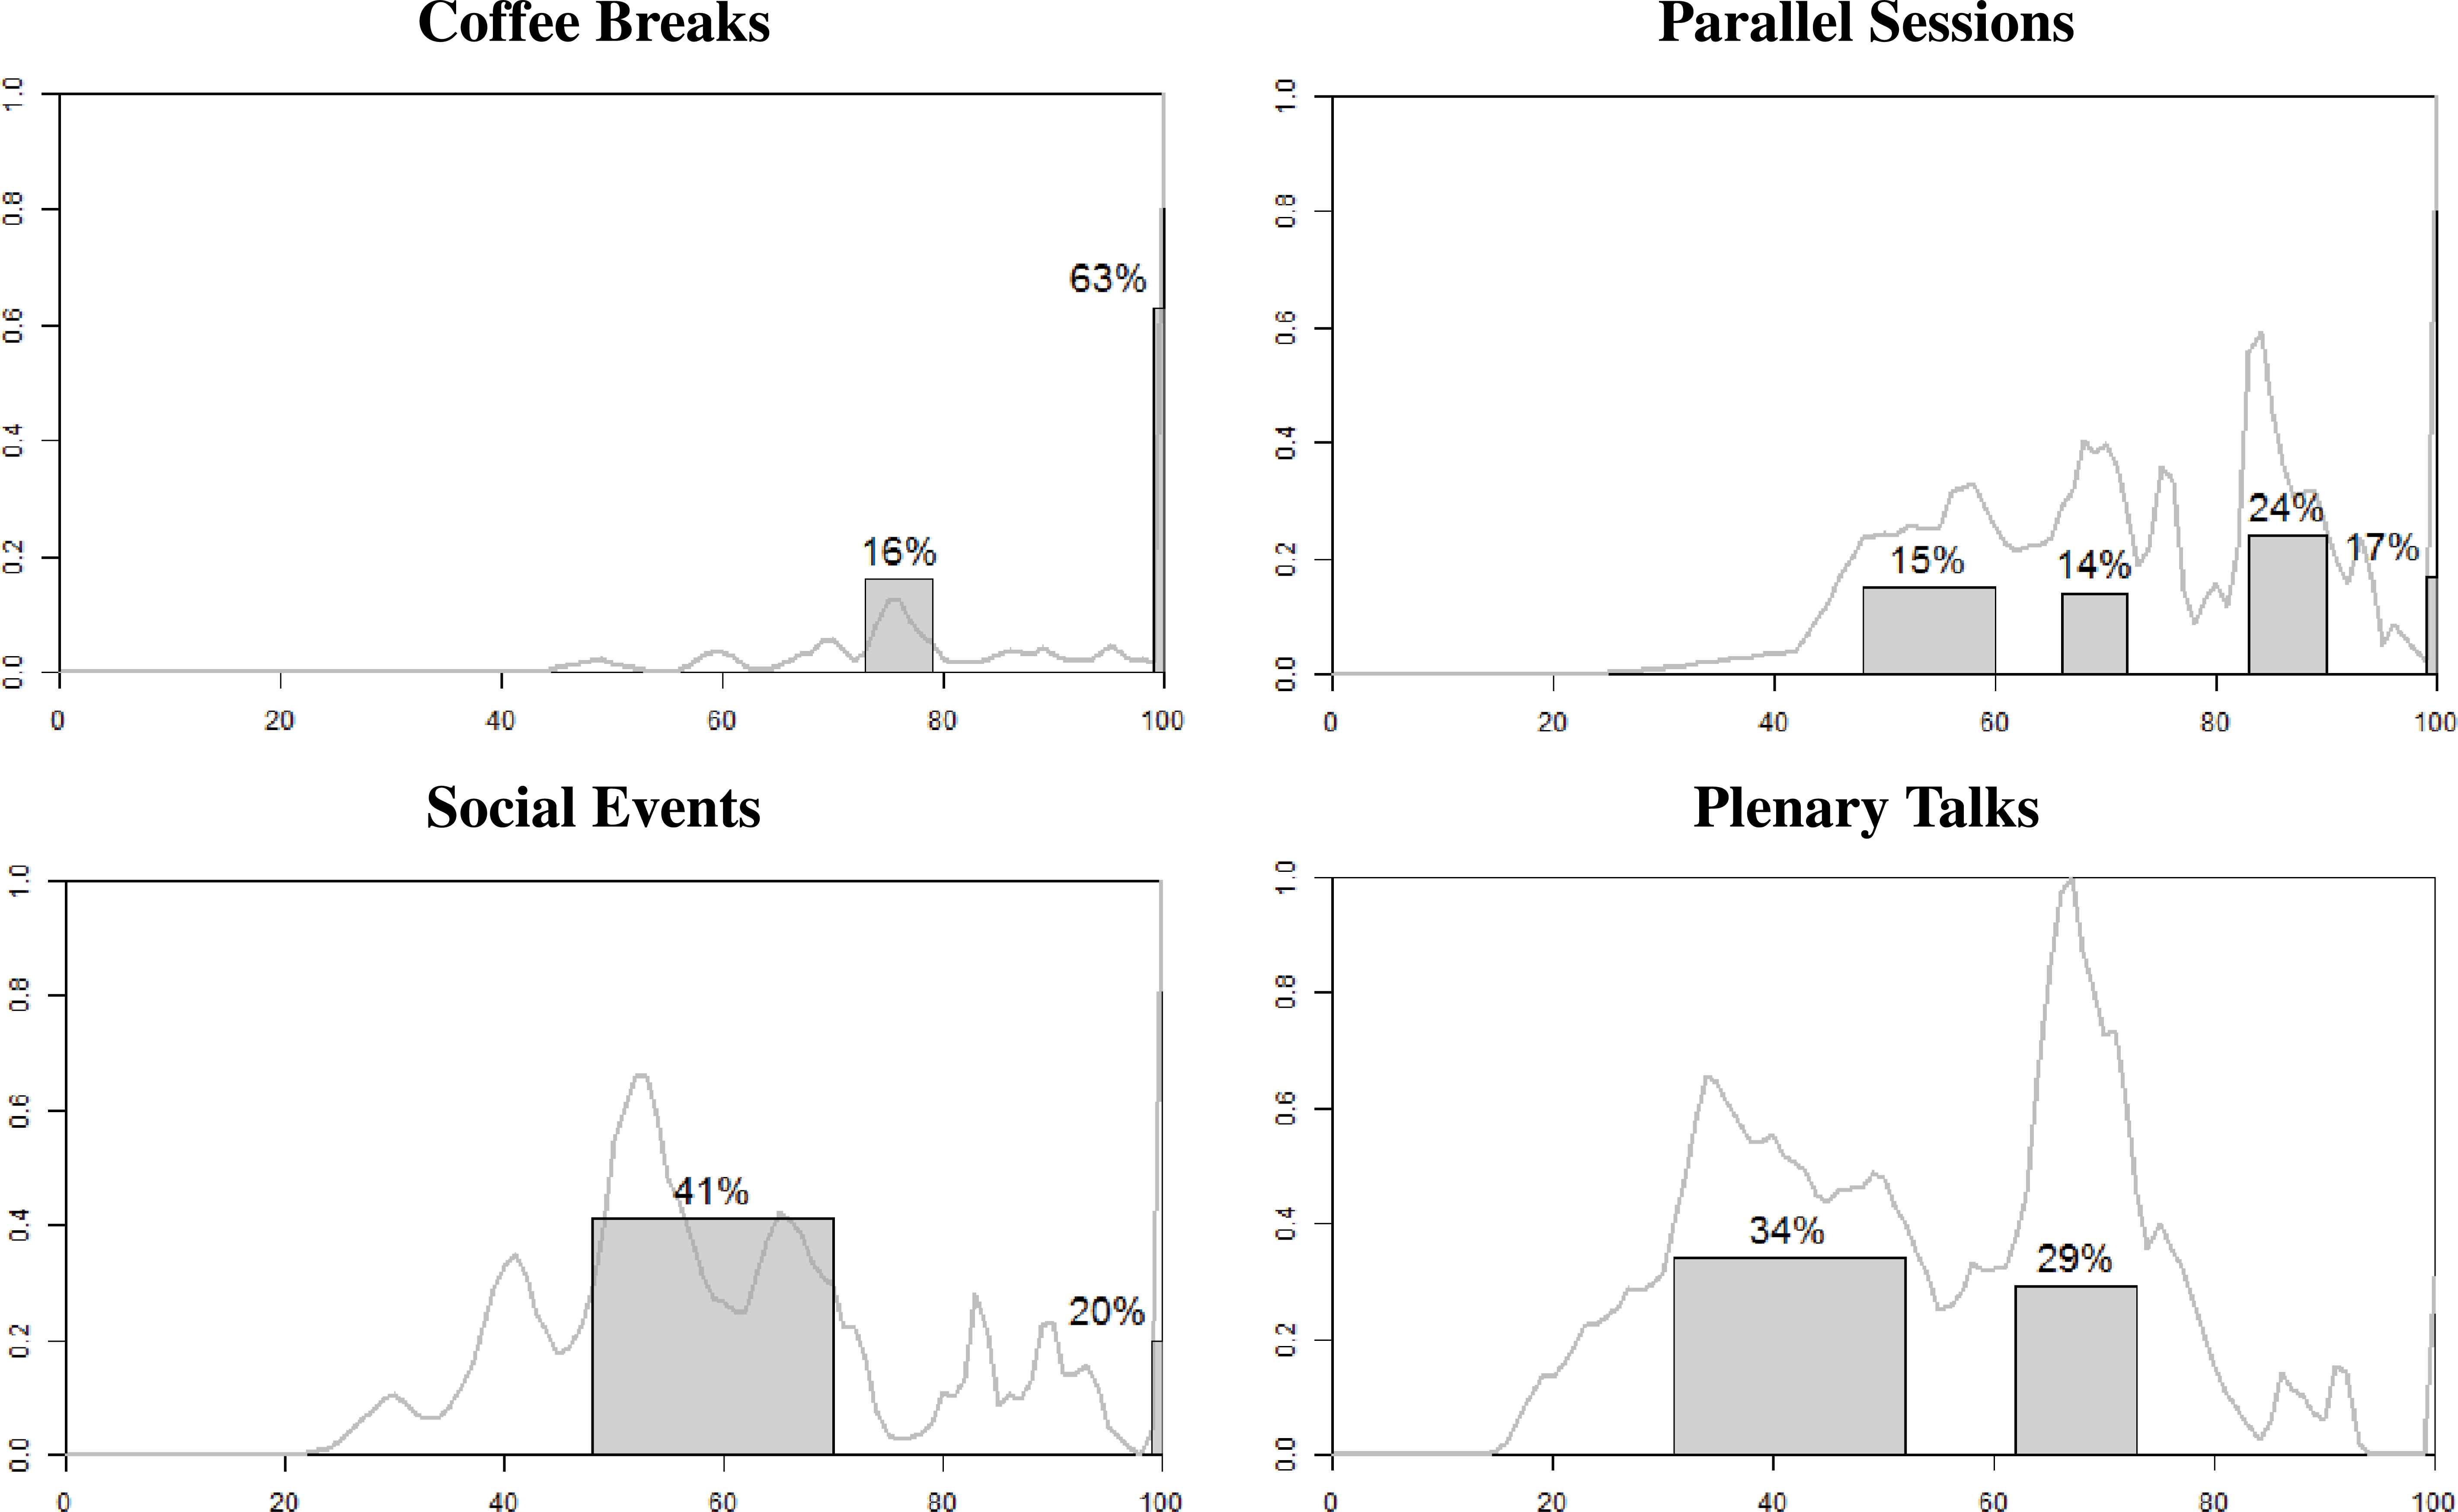
Detailed analysis for each activity (Coffee Breaks, Parallel Sessions, Plenary Talks and Social Events) in terms of networking.
As it has been done in the descriptive use case, a group analysis can also be carried out in the case of comparative surveys. Similar graphical representations to Figure 12 would be provided, using the fuzzy weights calculated in Subsection 3.2 instead.
The main advantage that this method presents with respect to the classical approach is the capability to allow respondents to determine, in an intuitive way, that two samples are similar and avoid strict orders if desired. In this way, the inclusion of fuzzy rating scales allows to obtain more insightful information.
5. Conclusions and future research
This paper introduces a novel approach to conduct and analyze survey questions, both descriptive and comparative. Starting from the usual way of working with fuzzy rating scales, we have proposed a different procedure to treat answers, where the obtained fuzzy sets are not normal fuzzy sets anymore, but ones with variable heights in function of the amplitude of the answers. In the case of comparative questions, an additional step of providing the difference between consecutive ranked samples is introduced, where the same modification of fuzzy rating scales is used as well.
Different ways to display the obtained information have been proposed. Furthermore, an experiment for each type of survey has been explained in order to illustrate the aforementioned processes, pointing out their advantages with respect to the classical approaches.
The descriptive proposal identifies the greatest accumulation area of answers even if there are more than one, unlike the usual procedure. The proposal for comparative surveys allows respondents to determine the similarity between the ranked samples, opposed to the classical method.
The optimization of the different parameters defined along the work is an important part of the future research, as a variation of some of these parameters can result into different outcomes of the procedures. Another open point is the application of these methods to big data examples in order to check and validate their complementary behavior to machine learning techniques. Moreover, we will also explore the automatic generation of self-explaining text attached to each graph.
Acknowledgments
We thank Wolfgang Trutschnig and Asun Lubiano (from the SMIRE Research Group) for making freely available the software R package called SAFD.
This work has been partially funded by the Spanish Ministry of Economy and Competitiveness under Grant TIN2014-56633-C3-3-R; and the European Centre for Soft Computing (ECSC) located at Mieres (Asturias, Spain).
Footnotes
SMIRE stands for Statistical Methods with Imprecise Random Elements. This is the name of the research group in the University of Oviedo (Spain) that is headed by M.A. Gil, one of the most well-known researchers in the field of Statistics and Soft Computing.
SAFD stands for Statistical Analysis of Fuzzy Data (https://cran.r-project.org/web/packages/SAFD/index.html).
References
Cite this article
TY  - JOUR
AU  - Pelayo Quirós
AU  - Jose M. Alonso
AU  - David P. Pancho
PY  - 2016
DA  - 2016/06/01
TI  - Descriptive and Comparative Analysis of Human Perceptions expressed through Fuzzy Rating Scale-based Questionnaires
JO  - International Journal of Computational Intelligence Systems
SP  - 450
EP  - 467
VL  - 9
IS  - 3
SN  - 1875-6883
UR  - https://doi.org/10.1080/18756891.2016.1175811
DO  - 10.1080/18756891.2016.1175811
ID  - Quirós2016
ER  -