
Hybridizing a fuzzy multi-response Taguchi optimization algorithm with artificial neural networks to solve standard ready-mixed concrete optimization problems
- DOI
- 10.1080/18756891.2016.1175816How to use a DOI?
- Keywords
- Standard ready-mixed concrete; Multi-response optimization; Taguchi method; Fuzzy TOPSIS; Artificial neural networks
- Abstract
In this study, a fuzzy multi-response standard ready-mixed concrete (SRMC) optimization problem is addressed. This problem includes two conflicting quality optimization objectives. One of these objectives is to minimize the production cost. The other objective is to assign the optimal parameter set of SRMC’s ingredient to each activity. To solve this problem, a hybrid fuzzy multi-response optimization and artificial neural network (ANN) algorithm is developed. The ANN algorithm is integrated into the multi-response SRMC optimization framework to predict and improve the quality of SRMC. The results show that fuzzy multi-response optimization model is more effective than crisp multi-response optimization model according to final production cost. However, the ANN model also gave more accurate results than the fuzzy model considering the regression analysis results.
- Copyright
- © 2016. the authors. Co-published by Atlantis Press and Taylor & Francis
- Open Access
- This is an open access article under the CC BY-NC license (http://creativecommons.org/licences/by-nc/4.0/).
1. Introduction
The standard ready-mixed concrete (SRMC) quality is an important issue in the field of material engineering environment [1, 2]. The SRMC industry has been developing rapidly as a result of social, economic and technological developments, especially in roads, bridges, and high rise buildings. SRMC consists of water, cement, crushed special stone, a chemical admixture, and sand which are called aggregates.
SRMC design and optimization are a time consuming and expensive process.
SRMC must conform to some specifications such as strength and durability during its technological life cycle. The characterization of the most appropriate chemical mixture is an important deal to achieve the desired quality for SRMC [3].
The aim of standardization of concrete mixtures is to determine the optimal concrete composition that provides sufficient quality for special applications. Since SRMC’s quality to optimize the chemical mixture is closely related with the prediction of each ingredient’s optimal levels that increase its strength along with capability in order to decrease production cost consequently the mixture proportion optimization have both technical and financial aspects.
However, such a thorough optimization and production process of each special SRMC is time consuming, instead of this technique; a two-stage methodology may reduce the workload by determining optimal mixture proportion of the SRMC production process. In this paper, a new model is developed to use in the SRMC mixture optimization process. Since the aim of the developed model is an instant optimization of SRMC composition, the scope of the proposed model is limited to the basic quality characteristics of the SRMCs’ performance.
For determining the optimal factor levels on concrete quality, experimental design methodologies such as Response Surface Methodology (RSM), Taguchi Methods and factorial design applications are widely used in literature [4–14]. Multi-Attribute Decision Making (MADM) methods are also combined with Taguchi methods where multiple responses are involved [15–18].
The TOPSIS-Taguchi method is quite a useful method compared to the other MADM-based Taguchi methods, such as GRA (Grey Relational Analysis) and VIKOR (Vlse Kriterijumska Optimizacija I Kompromisno Resenje). The advantages of the TOPSIS (Technique for Order Preference by Similarity to an Ideal Solution) method are simplicity and ability to yield an indisputable preference order [19].
Also, Fuzzy MADM methods are suggested for decision-making problems where imprecision and vagueness are involved in past studies. There are various studies that incorporate a fuzzy logic (FL) into MADM models in literature [20–24]. Furthermore, there are some studies which incorporate artificial intelligent (AI) methodologies into MADM based Taguchi models in literature.
Over the last decades, different AI applications based on FL or Artificial Neural Network (ANN) has become popular and has been used by many researchers for a variety of engineering applications [25]. For example, Tong and Su [24] optimized the multi response problem in the Taguchi method by Fuzzy TOPSIS (FTOPSIS). Lan [26] applied a fuzzy Taguchi deduction optimization on multi-attribute CNC turning.
Sivapirakasam et al. [27] developed a combination of Taguchi and FTOPSIS methods to solve multi-response parameter optimization problems in green manufacturing. Also, ANN’s applied to many civil engineering applications such as drying shrinkage [28], ready mixed concrete delivery [29], slump model [30], concrete durability [31], mechanical behavior of concrete at high temperatures [32–34], workability of concrete with metakaolin and fly ash [35, 36], and the long term effect of fly ash and silica fume on compressive strength [37], predicting comprehensive strength and slump for high strength concrete (HSC) [38], drying shrinkage of concrete [39], estimation of compressive strength of self-compacting concrete [40].
This paper argues a new model to predict the optimal mixture dosages of SRMC. The main contribution of this article is to demonstrate the application of hybrid FTOPSIS-Taguchi-ANN model to predict optimal mixture dosage of a SRMC. In the developed model, FTOPSIS based Taguchi is firstly used to identify the optimal mixture dosages of SRMC. Once needed experimental values, according to Taguchi’s appropriate orthogonal array, are entered by the user in the FTOPSIS-Taguchi module, the optimal set of mixture dosage levels are determined by this module. However experimental values such as factor levels and test results can be simultaneously transferred to ANN module for the prediction of optimal quality responses of any potential SRMC product.
Especially, low-repeatability experiments or different values which are appointed to quality criteria created compulsory use of multi-criteria decision making method with fuzzy logic. Slump loss can be seen on concrete in dumping places which has same feature in concrete production plant due to high temperature. Thus slump-spread value may be more important for worker in dumping place than any personnel in concrete plant. Similarly, concrete which has early strength can be preferred because of conditions based on temperature.
In the modeling of the TOPSIS method, judgments are assigned as crisp numbers in its conventional application. On the other hand, there may be cases in which experts’ preferences are uncertain and experts are forced to describe their judgments as uncertain values, such as “between two and four times more important”. In such situations, fuzzy version of the TOPSIS method, in which fuzzy numbers instead of crisp ones are used to represent uncertain judgments, is developed and used [22,23].
The argument of our study in literature is not only analyzing the optimal mixture proportion optimization but also researching the development of a mixture dosage prediction model for any possible SRMC product in the future. A prediction model based on ANNs is used for forecasting of appropriate SRMC mixture dosage for any SRMC application in civil engineering environments.
Typically, the ANN model’s result contains the optimal factor level’s predictions for a possible SRMC application, whereas the FTOPSIS-based Taguchi model’s result contains the optimal factor level combination of mixture dosage which can fulfill all multi-response quality characteristics for a specific SRMC application. In the proposed hybrid methodology, the FTOPSIS-based Taguchi model can be used, when an optimization of the factor level combination of mixture dosages for a specific SRMC production is required.
ANN is commonly used to estimate quality criteria as it does not require complex mathematical model based on industrial applications, it has opportunity for easy use and has interface which provides facility of use to user in computer programming languages [28–40]. Contrary to other expert systems, operators who work in companies can use models based on artificial neural nets without requiring complex mathematical formulations and applications.
On the other hand, when a simpler mixture dosage predicting application of any SRMC production is considered as enough, the ANN model can be used. However, the proposed SRMC mix dosage prediction algorithm, specifically ANN, is expected to reduce the number of experiment and experimental errors, save time, cost, and laborers. The SRMC designed by the proposed algorithm is expected to have lower cement and water contents, higher durability, and better economic effects.
Flow chart of the study which consists of two phases as to be modeling and optimization sections in a standard ready concrete production plant has been given in Section 2. Firstly, incomes which effect on concrete’s quality criteria have been determined respectively as amount of cement, water cement ratio, amount of plasticizer, fine aggregate ratio, coarse aggregate ratio, amount of fly ash, mixer mixing time and plasticizer type and experimental design matrix has been determined as considering levels used in company for experimental design (Section 3.1.). On first phase of the study, dosage levels which optimizes parameters of slump-spread value which represents workability feature of concrete, 2-day and 28-days compressive strength value which represent mechanics features, production cost, air content and water absorption percentage (Section 3.1) have been found by FTOPSIS-based Taguchi method (Section 3.2). On this phase, fuzzy method has been used as integrated with experimental design method for the purpose of assessment of all experts’ views (Section 3.2).
On the second phase of study, artificial neural nets have been used to estimate concrete quality criteria (Section 3.2). Taguchi based tests have been used to train net to mathematical modeling with artificial neural nets. Then, ten each of tests have been made respectively for test and validation. ANN and fuzzy modeling performance was compared in Section 4.
FTOPSIS and crisp TOPSIS methods have been used on Section 4 in terms of comparing optimization performance. In Section 5, the conclusions are presented.
2. The Description of the Structure of the developed Model
Although TOPSIS-based Taguchi Method and ANNs methodologies are explained in the following sections, the readers are referred to 17, 19, 23, 25, 28, 29, 41 and 42 for detailed explanations and application steps of TOPSIS-Taguchi methodology and ANNs.
The developed hybrid model incorporates two separate modules, named ‘Multi-Response Optimization Module: FTOPSIS-Taguchi modeling’ and ‘Prediction Module: ANN modeling’ (Figure 1).
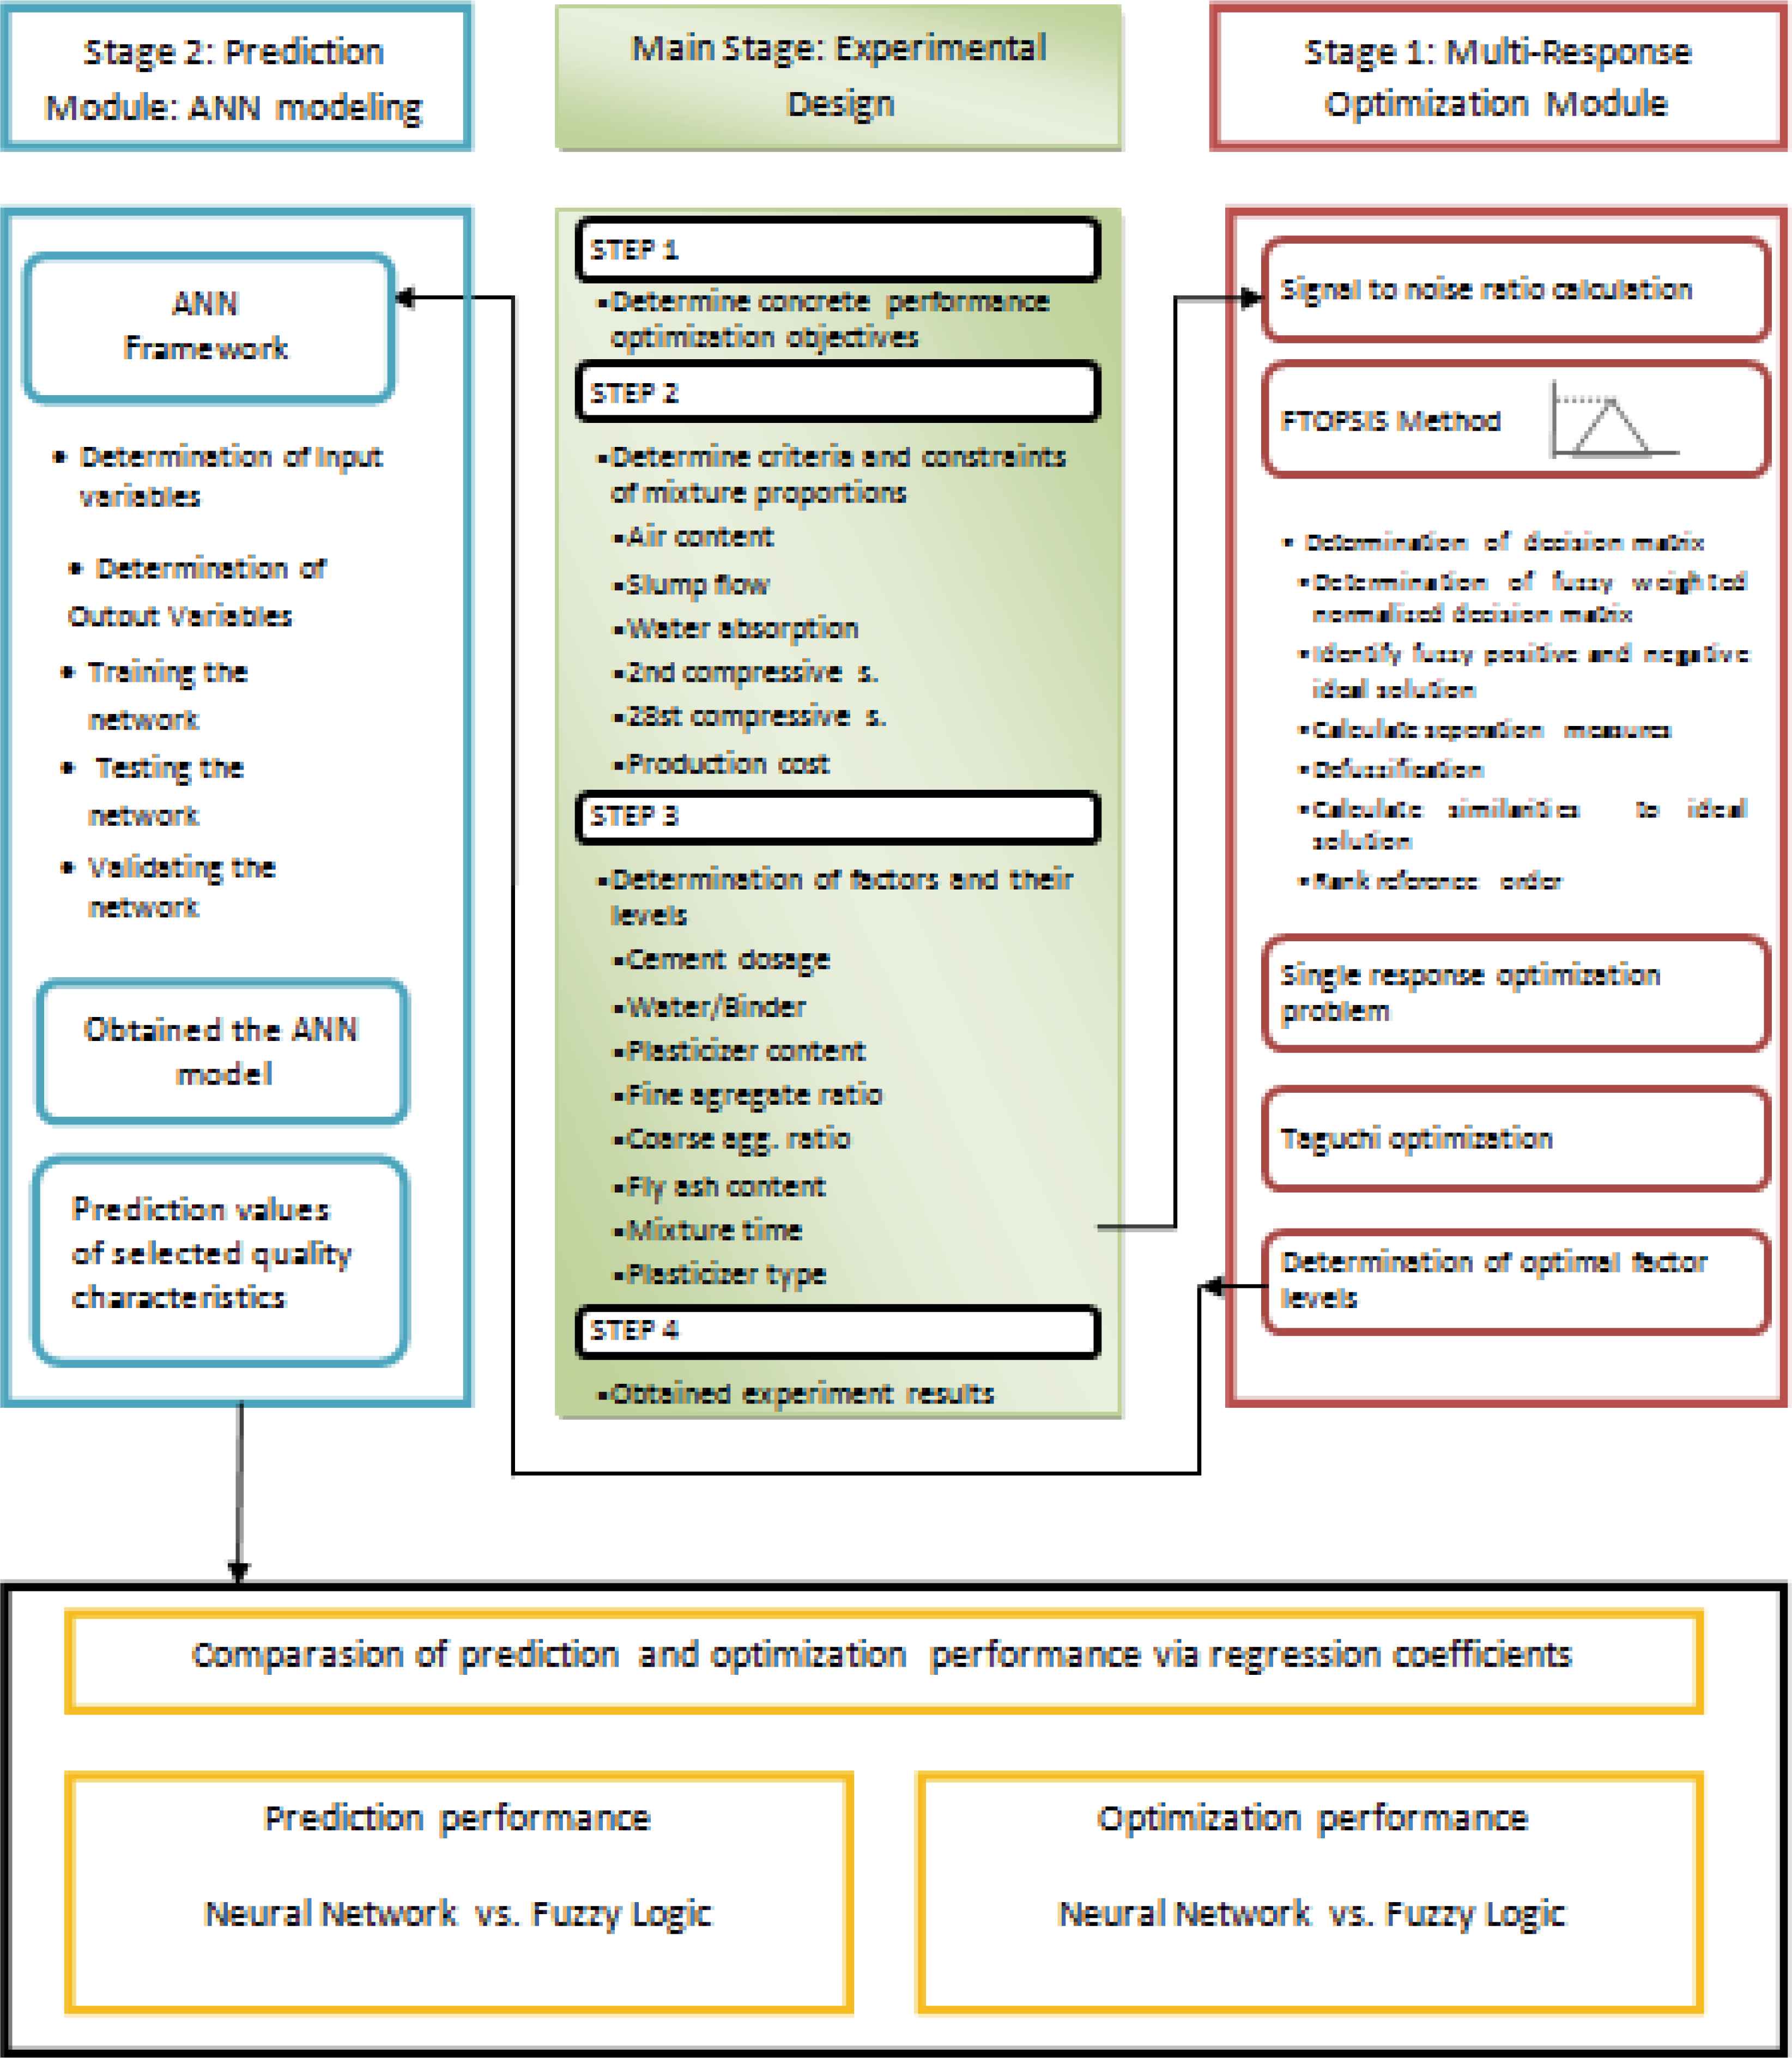
Proposed performance optimization and modeling framework justified manually.
For the first time in this paper, the application of integrating Fuzzy TOPSIS and Taguchi method is applied to solve SRMC mixture optimization problem. In addition to the multi-response Taguchi optimization module, the ANN module used in this study provides prediction of possible optimal mixture proportions of SRMC for any possible engineering application.
The model which may be designed, gives us the ability to predict a possible SRMC application’s quality responses for a given set of mixture parameters. Similarly, we may seek the variable-setting that minimizes the cost of production. The details of modules and examples are presented in the following sections.
3. Computational Application to Illustrate the Hybrid Multi-response Optimization Algorithm
In this section, the computational application which is proposed to illustrate the performance of the hybrid multi-response optimization algorithm is described. After that, the results obtained are presented and analyzed
3.1. Experimental Design
3.1.1. Determination of criteria and constraints of mixture dosages
The cement used in this application is a CEM I 42.5 R. Chemical compositions of the binder materials is given in Table 1 and 2 [9]. Table 3 presents the aggregate sieve analysis.
| Chemical analysis | CEM I 42.5 R (%) | FLY ASH (%) |
|---|---|---|
| CaO | 66.25 | 4.76 |
| SiO2 | 21.79 | 56.21 |
| Al2O3 | 5.98 | 23.1 |
| Fe2O3 | 2.51 | 6.51 |
| SO3 | 1.54 | 0.73 |
| MgO | 1.15 | 2.11 |
| K2O | 0.61 | 2.53 |
| Na2O | 0.15 | 0.27 |
| Cl | 0.0071 | 0.0018 |
| Loss of ignition | 3.71 | 2.24 |
Chemical composition of cement and fly ash [19]
| Properties | Superplasticizers | ||
|---|---|---|---|
| Chemical description | Polycarboxylic type polymer | Polycarboxylic type polymer | Polycarboxylic type polymer |
| Color | Light Brown | Brown | Brown |
| Specific gravity (kg/L) | 1.045 – 1.085 | 1.061 – 1.101 | 1.059 – 1.099 |
| Chlorin content % (EN 480-10) | < 0.1 | < 0.1 | < 0.1 |
| Alkaline content% (EN 480-12) | < 3 | < 3 | < 3 |
| State | Liquid | Liquid | Liquid |
| Symbol | PCE I | PCE II | PCE III |
Properties of the SPs at 200C
| Sieves (mm) | % passing through sieves | ||
|---|---|---|---|
| Crushed sand: particle size smaller than 4 mm (I) | particle size between 4 mm to 11.2 mm (II) | particle size between 11.2 mm to 22.4mm (III) | |
| 31.5 | 100 | 100 | 100 |
| 22.4 | 100 | 100 | 97.7 |
| 16 | 100 | 100 | 41.8 |
| 12.5 | 100 | 95.7 | 2.8 |
| 8 | 100 | 30.8 | 1.4 |
| 4 | 99.7 | 2.6 | 1.4 |
| 2 | 66.4 | 1.7 | 1.4 |
| 1 | 40.9 | 1.5 | 1.3 |
| 0.5 | 26.3 | 1.1 | 0.9 |
| 0.25 | 18.3 | 1.1 | 0.9 |
| 0.125 | 11.1 | 1.1 | 0.9 |
| 0.063 | 10.8 | 1.1 | 0.9 |
| fineness | 3.4 | 6.6 | 7.5 |
Aggregate sieve analysis [51]
3.1.2. Determination of concrete performance optimization objectives
The minimum concrete temperature must be 50C [43]. Slump flow range can be 10–220 mm for Standard Weight concrete [44]. Moreover, if slump flow range is greater than 220 mm, this concrete is considered vibrator-free special concrete according to TS EN 206-1 [43]. If slump flow range is between the range of 10–50 mm this concrete is considered road concrete according to TS EN 206-1 [43].
The air content percentage of standard concrete should be minimized [9]. The unit weight of fresh concrete depends on aggregate granulation, application of squeezing and amount of entrained air. In addition, the compressive strengths of three 150 mm cube concrete samples per experiment are determined on the 2th and 28th days according to TS EN 12390/3 [45]. Each compressive strength experiment is an average of the results coming from three 150 mm cube concrete specimens.
The cube compressive strength at 28 days of standard concrete is considered to be in the range of 10.0–60.0 N/mm2 [43]. Higher compressive strength means better concrete quality. One other criterion is water absorption of concrete mixtures which also should be minimized [9, 43]. The compressive test apparatus is given in Figure 2.
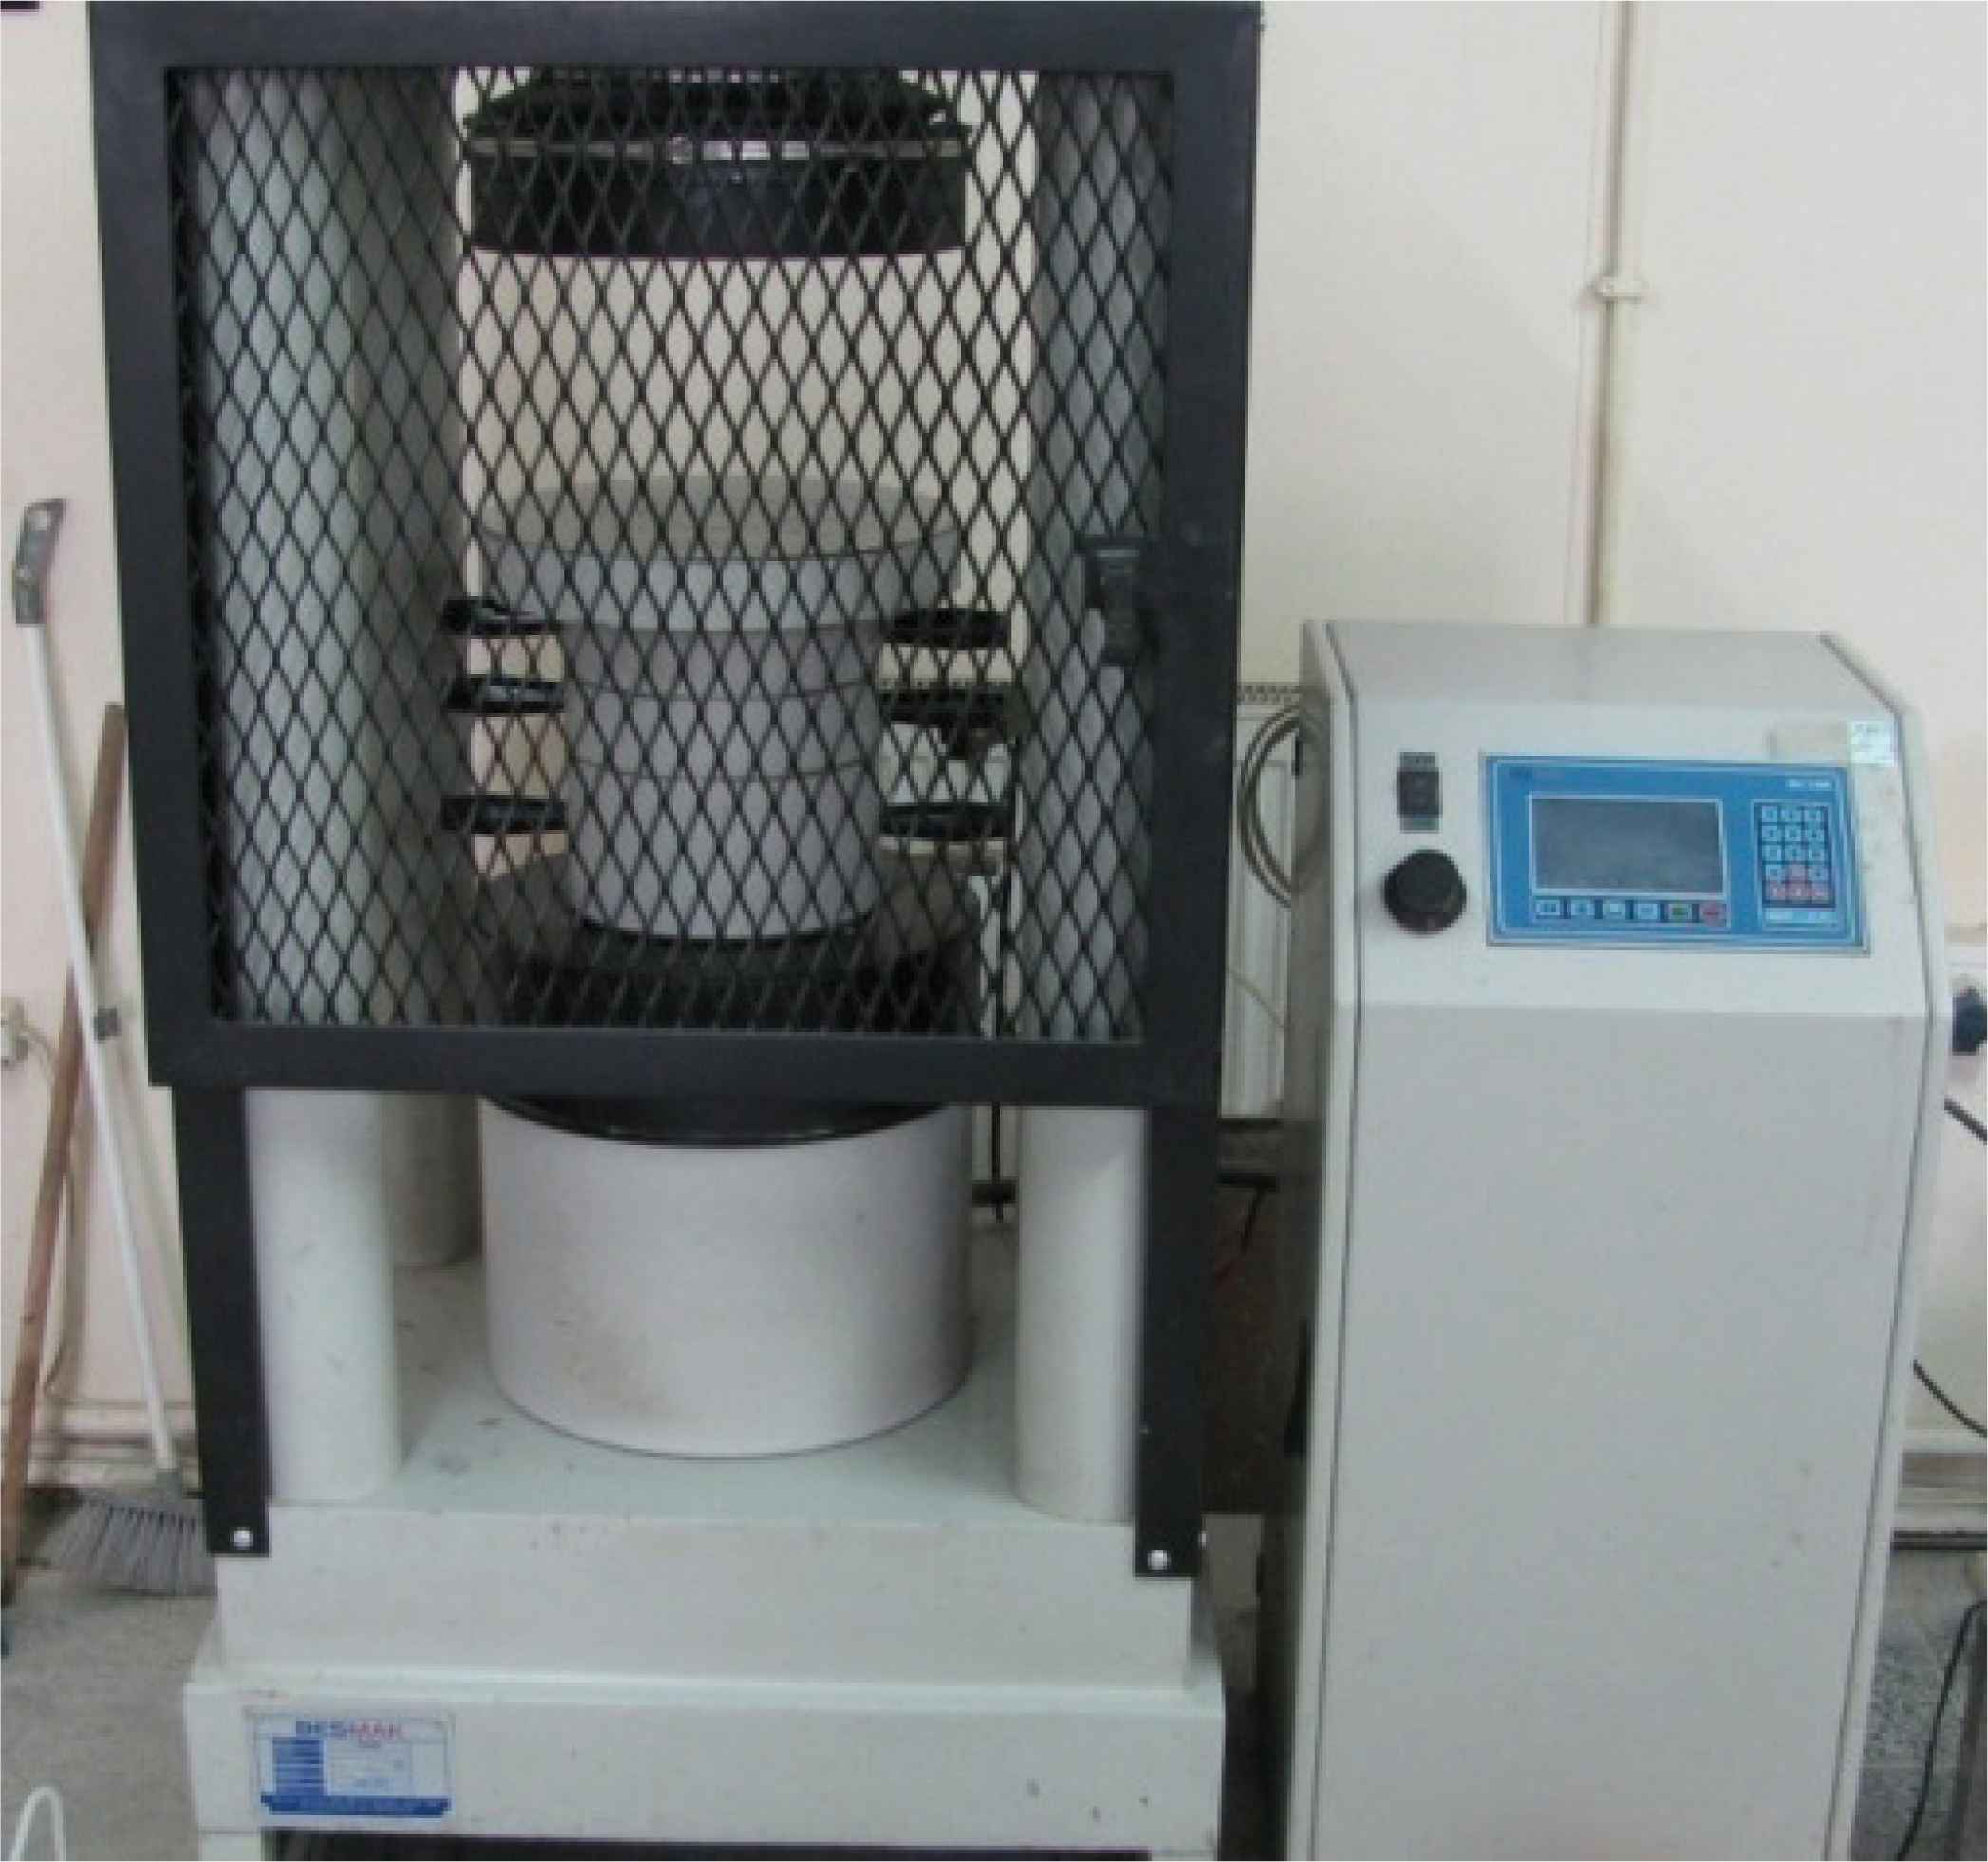
Compressive strength test apparatus
Six quality characteristics are identified for standard concrete. Quality characteristics for optimization phase are presented in Table 4. The basic concepts of triangular fuzzy numbers are given below [22,23, and 45]:
| Quality Characteristic | Symbol | Description | Type of concrete test | Target values | Expert evaluation (Individual weighting) | Corresponding Fuzzy Weightsa | Normalized Fuzzy Weights | ||
|---|---|---|---|---|---|---|---|---|---|
| Expert 1 | Expert2 | Expert3 | |||||||
| 1 | R1 | Air content (%) | Fresh concrete test | Smaller is better | 4 | 5 | 7 | (4a,5b,7c) | (0.085, 0.119, 0.200) |
| 2 | R2 | Slump flow (cm) | Fresh concrete test | Larger is better | 8 | 8 | 6 | (6,8,8) | (0.128, 0.190, 0.229) |
| 3 | R3 | Water absorption (%) | Hardened concrete test | Smaller is better | 4 | 5 | 6 | (4,5,6) | (0.085, 0.119, 0.171) |
| 4 | R4 | Compressive strength (N/mm2) 2 day | Hardened concrete test | Larger is better | 9 | 7 | 8 | (7,8,9) | (0.149, 0.190, 0.257) |
| 5 | R5 | Compressive strength (N/mm2) 28 days | Hardened concrete test | Larger is better | 9 | 8 | 9 | (8,9,9) | (0.170, 0.214, 0.257) |
| 6 | R6 | Production Cost ($/mm2) | Fresh concrete test | Smaller is better | 6 | 7 | 8 | (6,7,8) | (0.128, 0.167, 0.229) |
| Total | (35,42,47) | (0.745, 1.000, 1.343) | |||||||
The weights of responses are determined by three laboratory expert works in dump areas, quality laboratory and R&D department respectively.
Quality characteristics and their target values for optimization phase
A general definition of a fuzzy number is given by Chen and Hwang [45], as any fuzzy subset M={(x,μM(x)} where x takes its number on the real line R and μM(x) ∈ [0,1]. This membership function μM(x) can be determined by the following: i. Continuous mapping from R to the closed interval [0,1]; ii. Constant on (−∞,a]: μM(x) =0, ∀x∈(−∞, a]; iii. Strictly increasing on [a,b]; iv. Constant on [b]: μM(x) =1, ∀x∈[b] ; v. Strictly decreasing on [b,c]; vi. Constant on [c,+∞): μM(x) =0, ∀x∈[c,+∞]. Hence, a triangular fuzzy number,
For a triangular fuzzy number
3.1.3. Determination of concrete performance optimization objectives
Seven factors each of which have three levels and one factor that has two levels affect the SRMC identified quality. Cement dosage is determined as a two level factor and water to binder materials ratio, the percentage of super plasticizer content, fine aggregate to total aggregate ratio, coarse aggregate (I) to total aggregate ratio, fly ash dosage, mixture time of fresh concrete and type of SP are identified as three level factors. These factors are symbolized X1, X2, X3, X4, X5, X6, X7 and X8 respectively (Table 5). Estimated production cost for experiments are presented in Table 6.
| Factors | Description | Bounds | ||
|---|---|---|---|---|
| First bound | Second bound | Third bound | ||
| X1 | Cement dosage (kg) | 300 | 350* | |
| X2 | Water to binder materials ratio | 0.45 | 0.50* | 0.55 |
| X3 | Super plasticizer content (%) | 1.00 | 1.25 | 1.50* |
| X4 | fine aggregate (I) to total aggregate ratio | 0.45* | 0.50 | 0.55 |
| X5 | coarse aggregate (I) to total aggregate ratio | 0.25 | 0.30* | 0.35 |
| X6 | Fly ash content (kg) | 60 | 80 | 100 |
| X7 | Mixture time (s) | 100 | 110 | 120 |
| X8 | Type of SP | PCE I | PCE II | PCE III |
Mixture level using in the ready-mixed concrete plant
Levels of factors that affect quality characteristics for optimization phase
| Exp. No. | Fly ash | Cement | SP amount | Water | Aggregate #1 | Aggregate #2 | Production Cost |
|---|---|---|---|---|---|---|---|
| 1 | 1.698 | 20.4 | 4.860 | 0.448125 | 3.8270 | 4.0515 | 35.28463 |
| 2 | 2.264 | 20.4 | 6.225 | 0.4571875 | 4.1796 | 3.6260 | 37.15179 |
| 3 | 2.830 | 20.4 | 7.650 | 0.46625 | 4.5236 | 3.2079 | 39.07775 |
| 4 | 2.264 | 20.4 | 4.980 | 0.5109375 | 3.6765 | 3.8924 | 35.72384 |
| 5 | 2.830 | 20.4 | 6.375 | 0.5215625 | 4.0119 | 3.478 | 37.61646 |
| 6 | 1.698 | 20.4 | 7.290 | 0.495 | 4.5709 | 3.2412 | 37.69510 |
| 7 | 2.830 | 20.4 | 5.1 | 0.5765625 | 3.913 | 3.3892 | 36.20876 |
| 8 | 1.698 | 20.4 | 6.075 | 0.5475 | 4.4634 | 3.1635 | 36.34740 |
| 9 | 2.264 | 20.4 | 7.47 | 0.5590625 | 3.5862 | 3.7999 | 38.07916 |
| 10 | 2.264 | 23.8 | 5.73 | 0.528435 | 4.3516 | 3.0858 | 39.75984 |
| 11 | 2.830 | 23.8 | 7.32 | 0.5371875 | 3.4959 | 3.7037 | 41.68679 |
| 12 | 1.698 | 23.8 | 8.415 | 0.5128125 | 4.0205 | 3.4854 | 41.93171 |
| 13 | 1.698 | 23.8 | 5.61 | 0.575625 | 3.913 | 3.3929 | 38.98953 |
| 14 | 2.264 | 23.8 | 7.17 | 0.5859375 | 4.2226 | 2.997 | 41.03954 |
| 15 | 2.830 | 23.8 | 8.775 | 0.5959375 | 3.3927 | 3.5927 | 42.98634 |
| 16 | 2.830 | 23.8 | 5.85 | 0.6621875 | 4.0205 | 2.849 | 40.01169 |
| 17 | 1.698 | 23.8 | 7.02 | 0.631875 | 3.4228 | 3.6223 | 40.19498 |
| 18 | 2.264 | 23.8 | 8.595 | 0.64375 | 3.7281 | 3.2301 | 42.26095 |
Estimated production cost for all experiments ($/m3)
3.2. Multi-response optimization module: FTOPSIS-based Taguchi Optimization
3.2.1. Signal to noise ratio calculations
L18 (21×37) orthogonal array [46] is used to implement the experiments according to Taguchi’s parameter design principles (Figure 3). In Figure 3, columns 2–9 represent the eight mixture dosages (factors) and their levels. Signal to Noise Ratios (SNRs) for smaller the better and larger the better response are calculated by using Eq. (6) and (7) for each response [41].

Findings were obtained in all experiments by Taguchi experiments
3.2.2. Fuzzy TOPSIS methodology
In Figure 3, columns 16-21 are illustrated as decision matrix for the first step of the FTOPSIS method [22, 23, 45, and 49]. The normalized and then the fuzzy weighted normalized decision matrix are obtained respectively (Figure 3 and 4). The positive (A*) and negative ideal solutions (A-) (see Figure 4) and the separation measures (di+ and di-) (see Figure 5) are also determined. Finally, the final ranking scores of each scenario (Ci*) are calculated by using the FTOPSIS procedure [22, 23 and see also 45] (Figure 5).
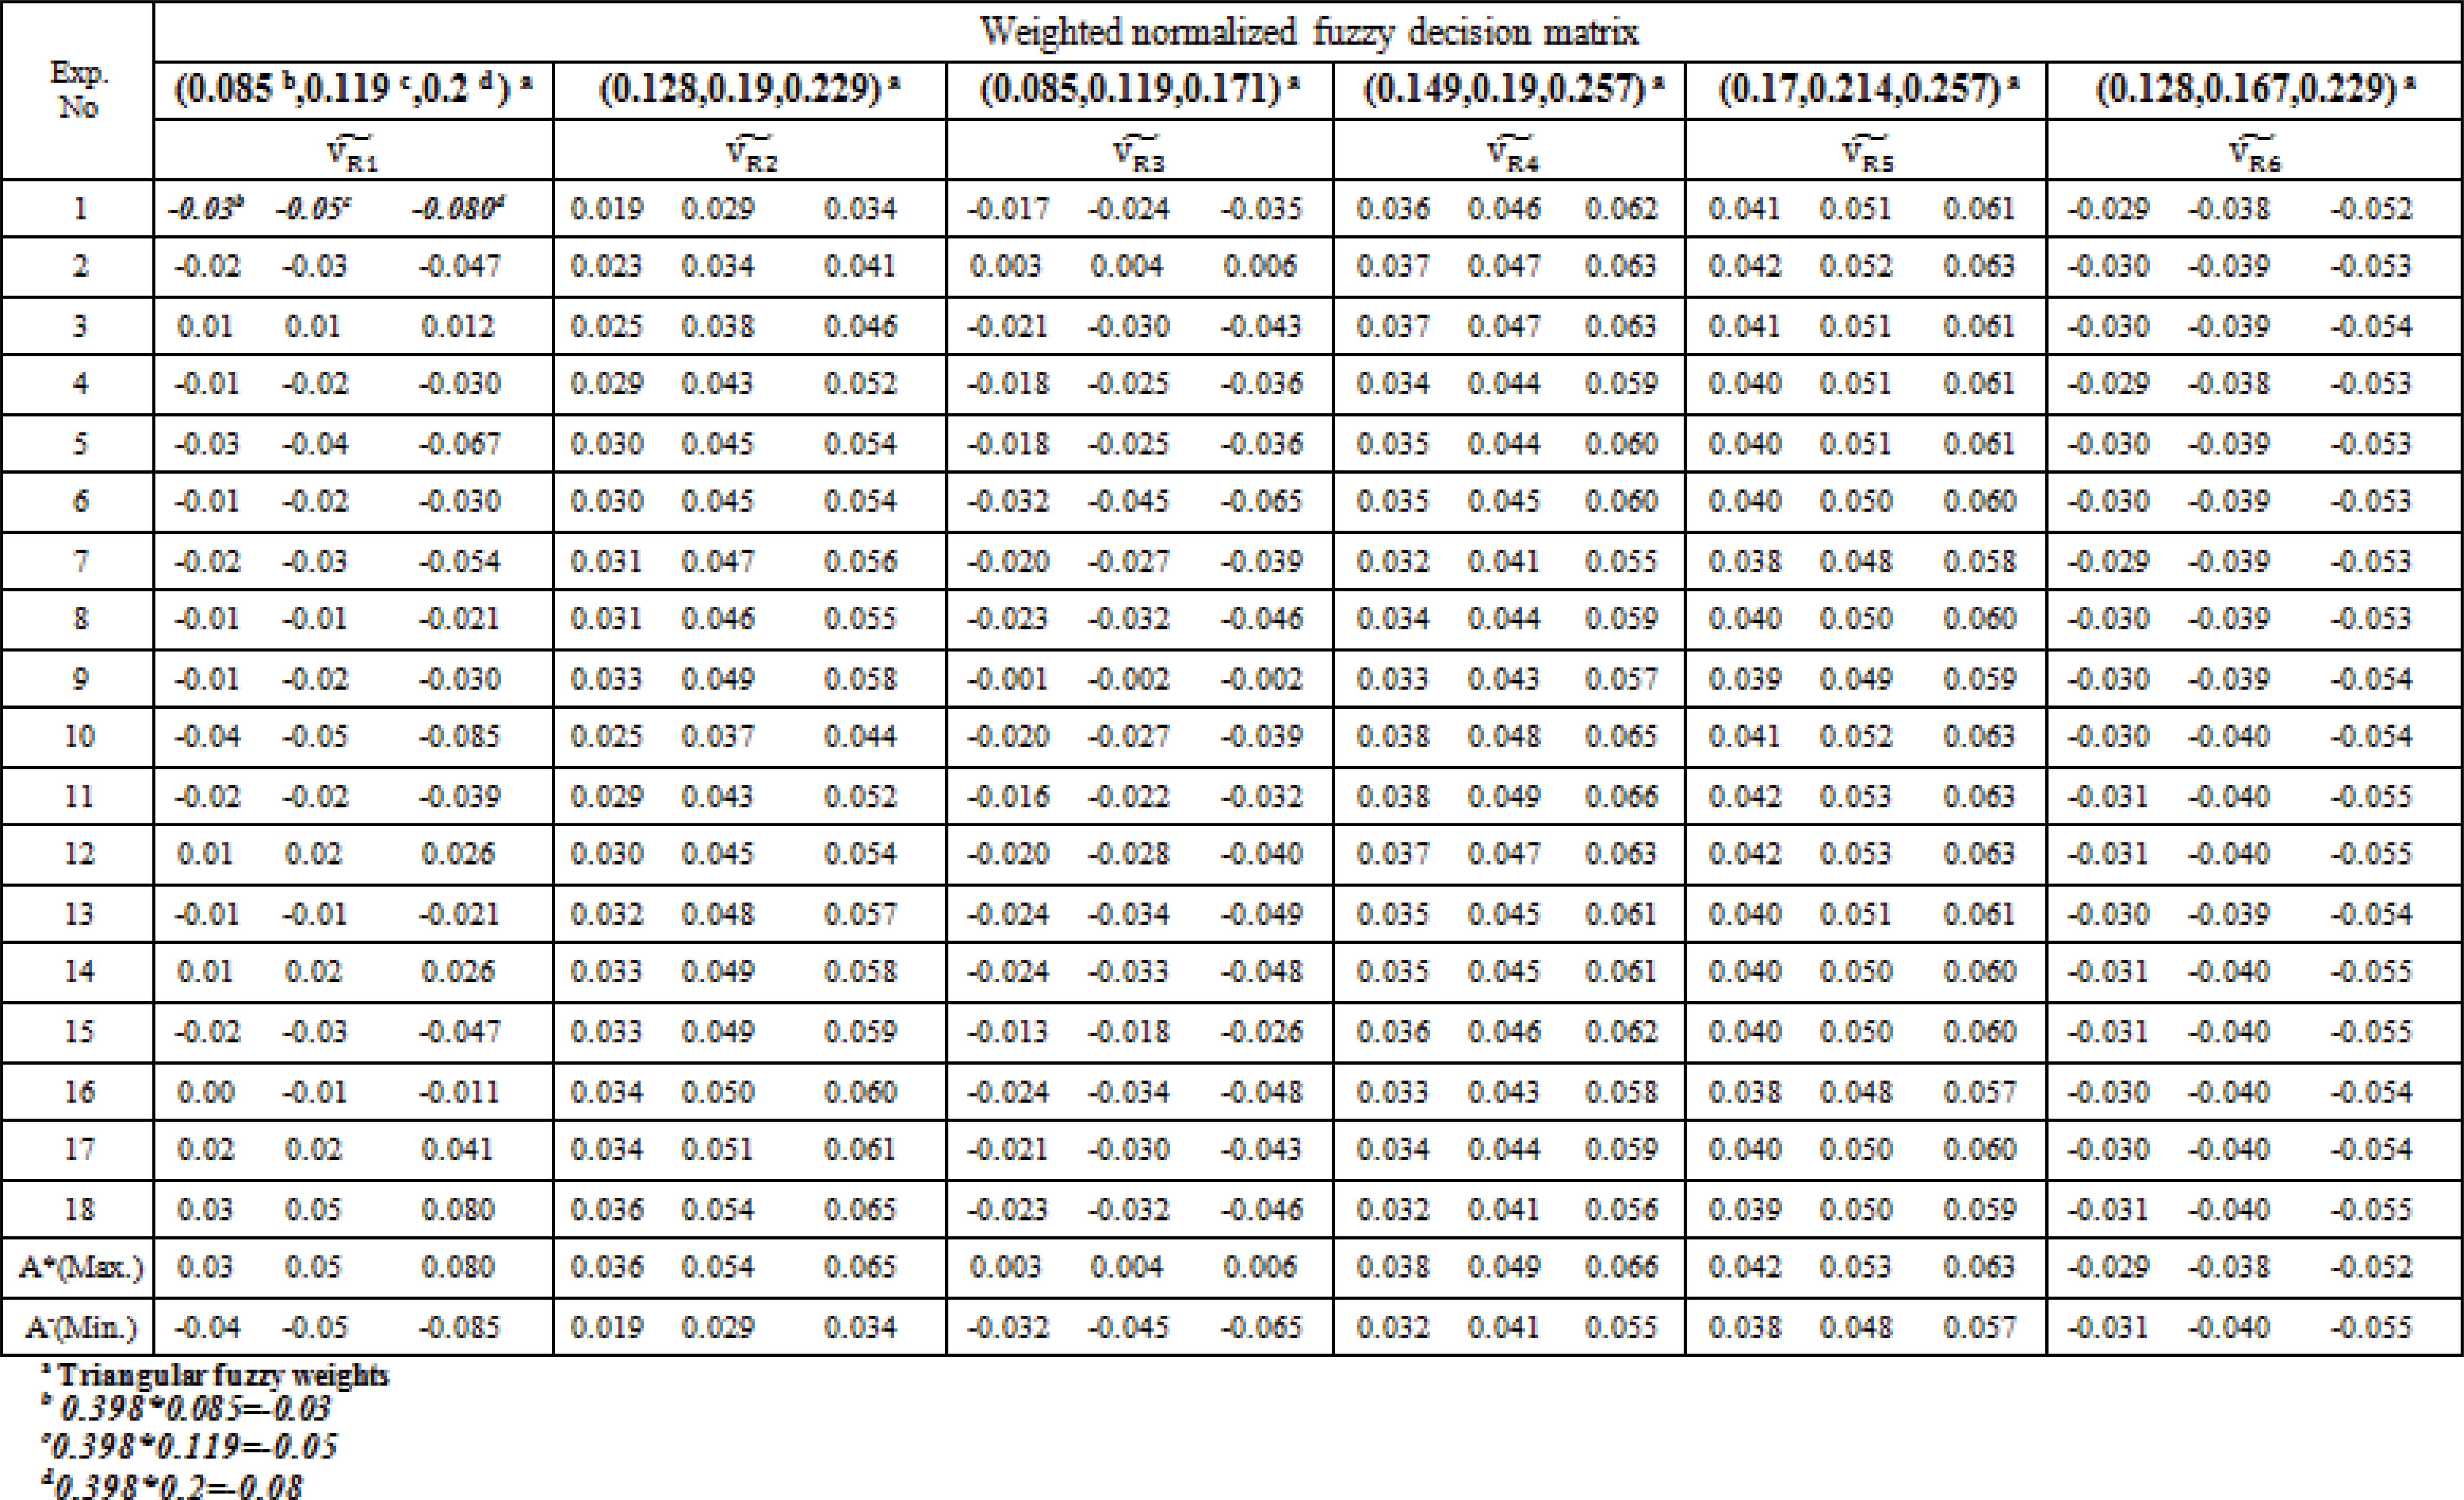
Fuzzy TOPSIS application: Weighted normalized decision matrix and defuzzification results
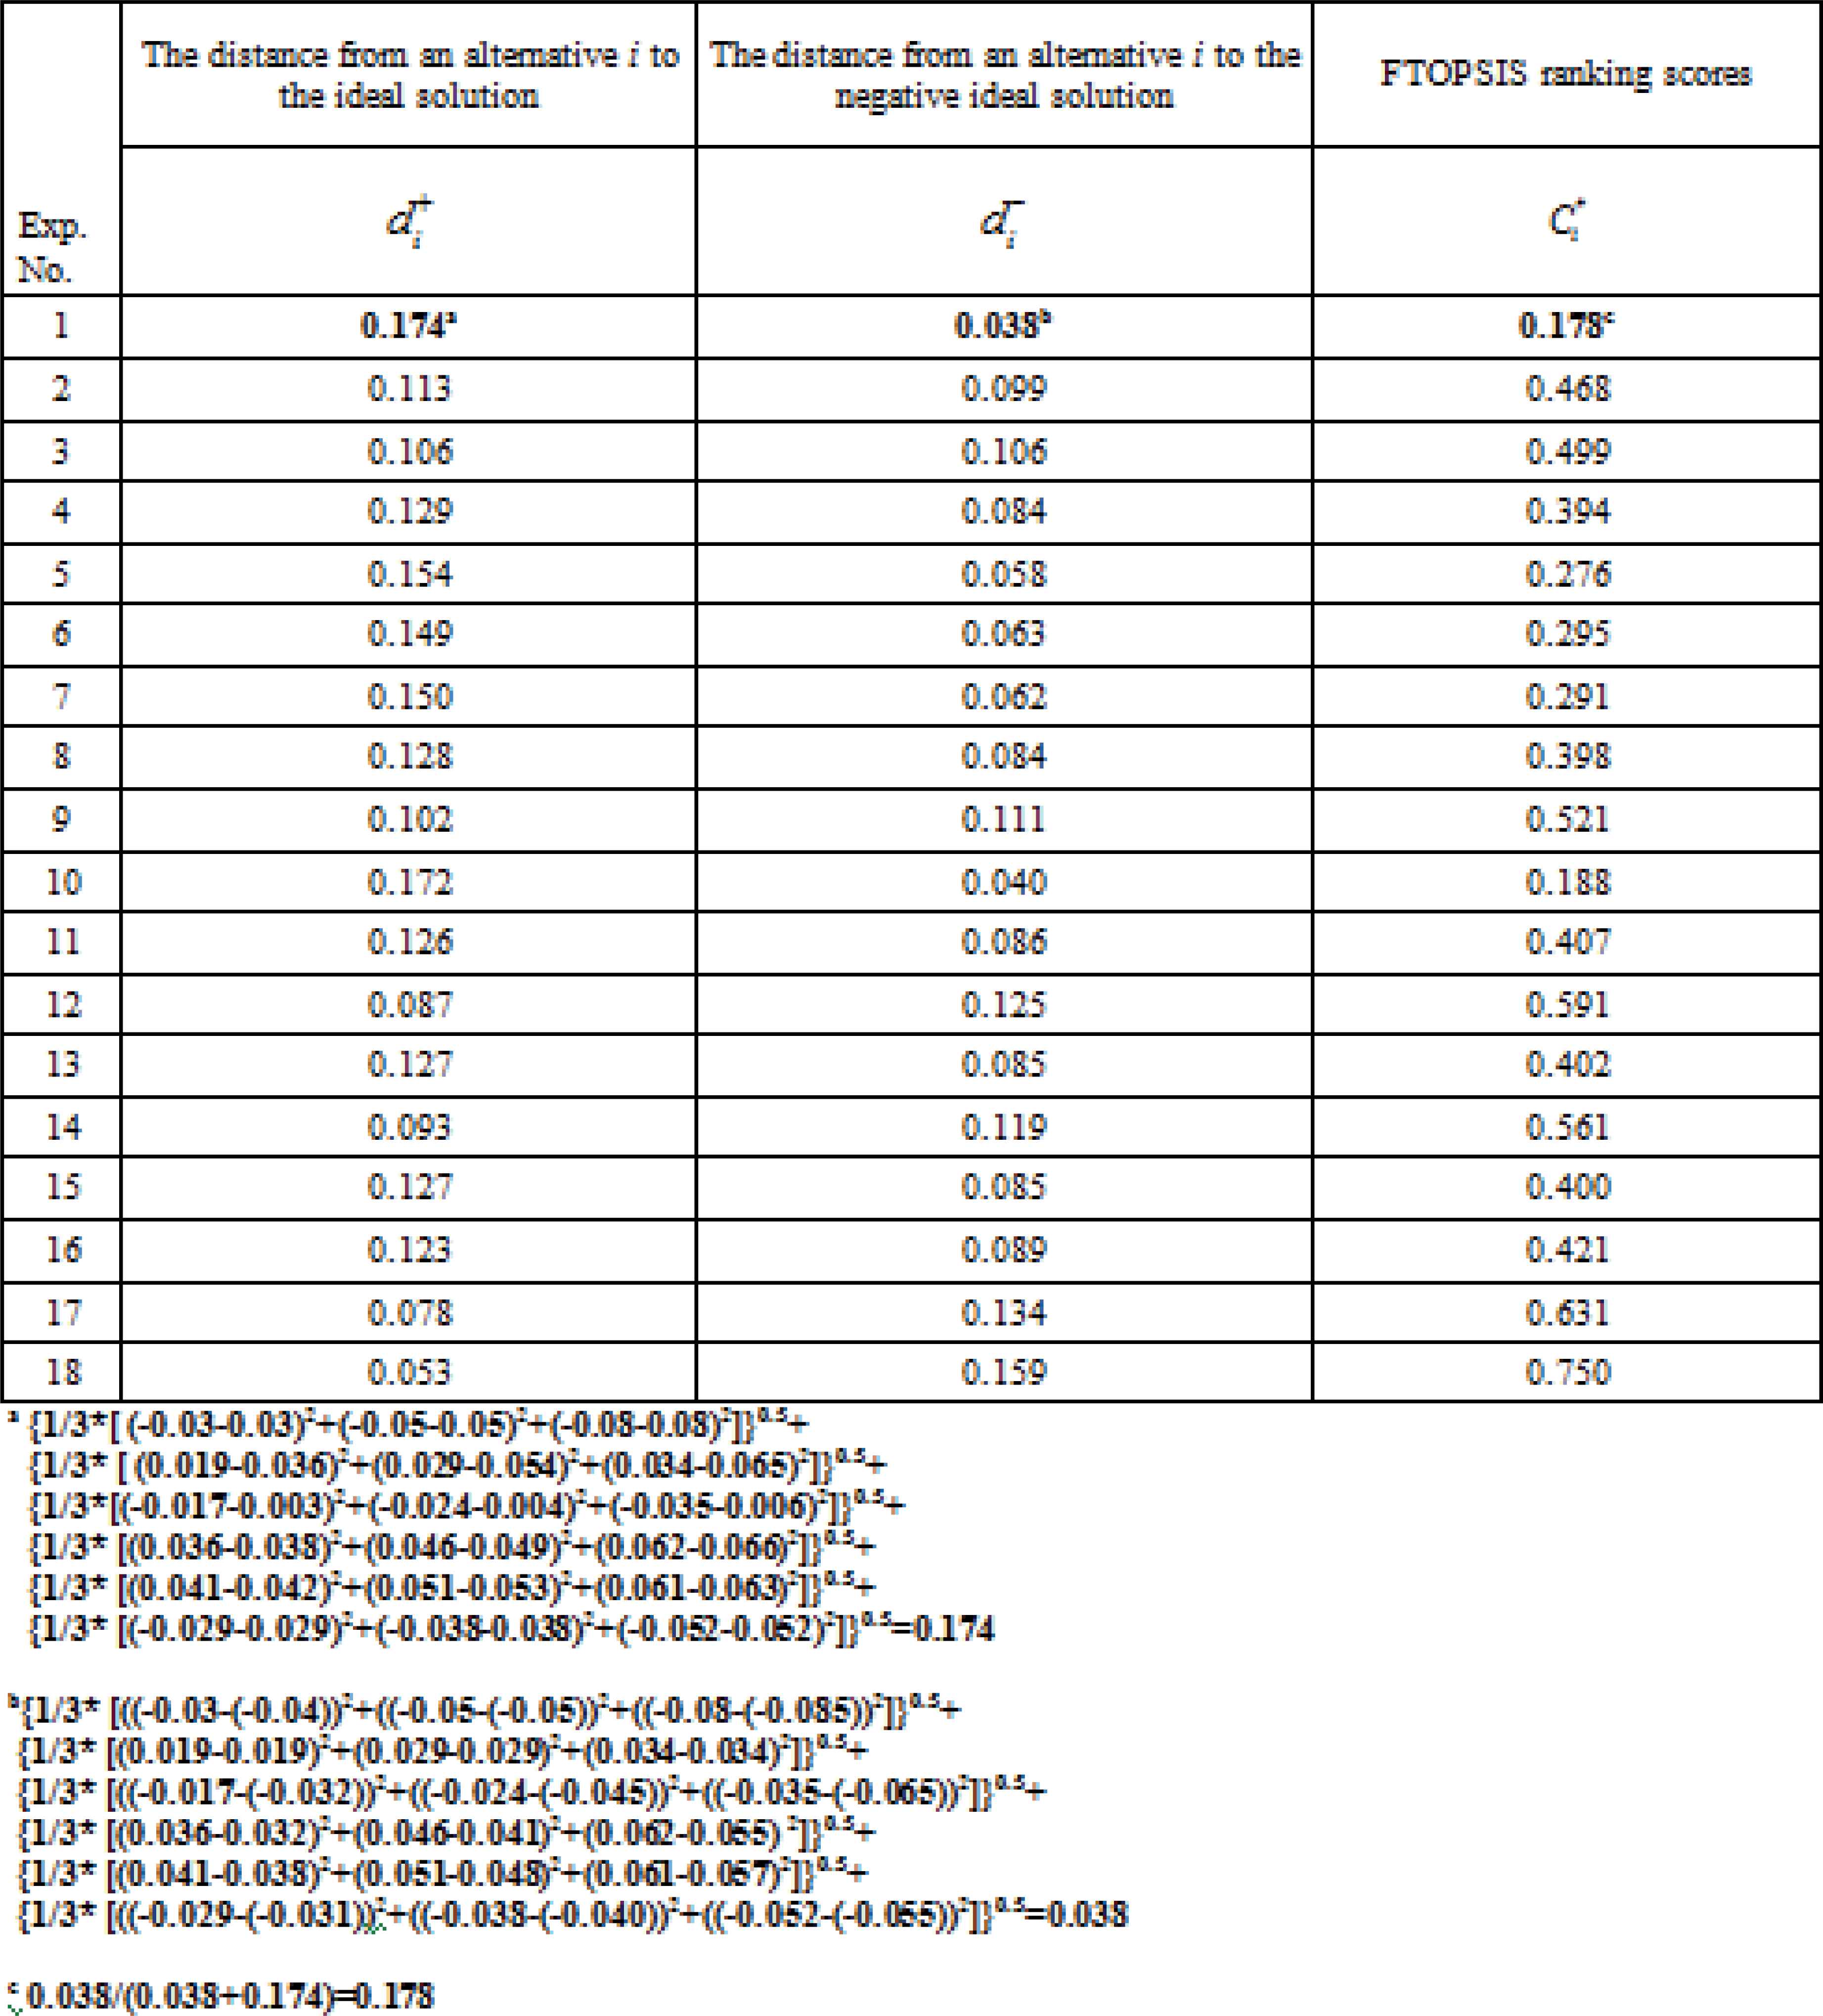
Fuzzy TOPSIS Results
3.2.3. Single-response Taguchi optimization: Determination of optimal factor levels
The average responses by factor levels can be established by using the Taguchi’s principles [See Refs 1, 2]. Their associated factor effect plots are given in Figure 6. Taguchi’s method results led to the final factor design of (X1)2 (X2)3 (X3)3(X4)2 (X5)2 (X6)2 (X7)3 (X8)3 (Table 7). Experimental results derived from optimum condition and significant anticipated improvement in the FTOPSIS-Taguchi method is given in Table 8.
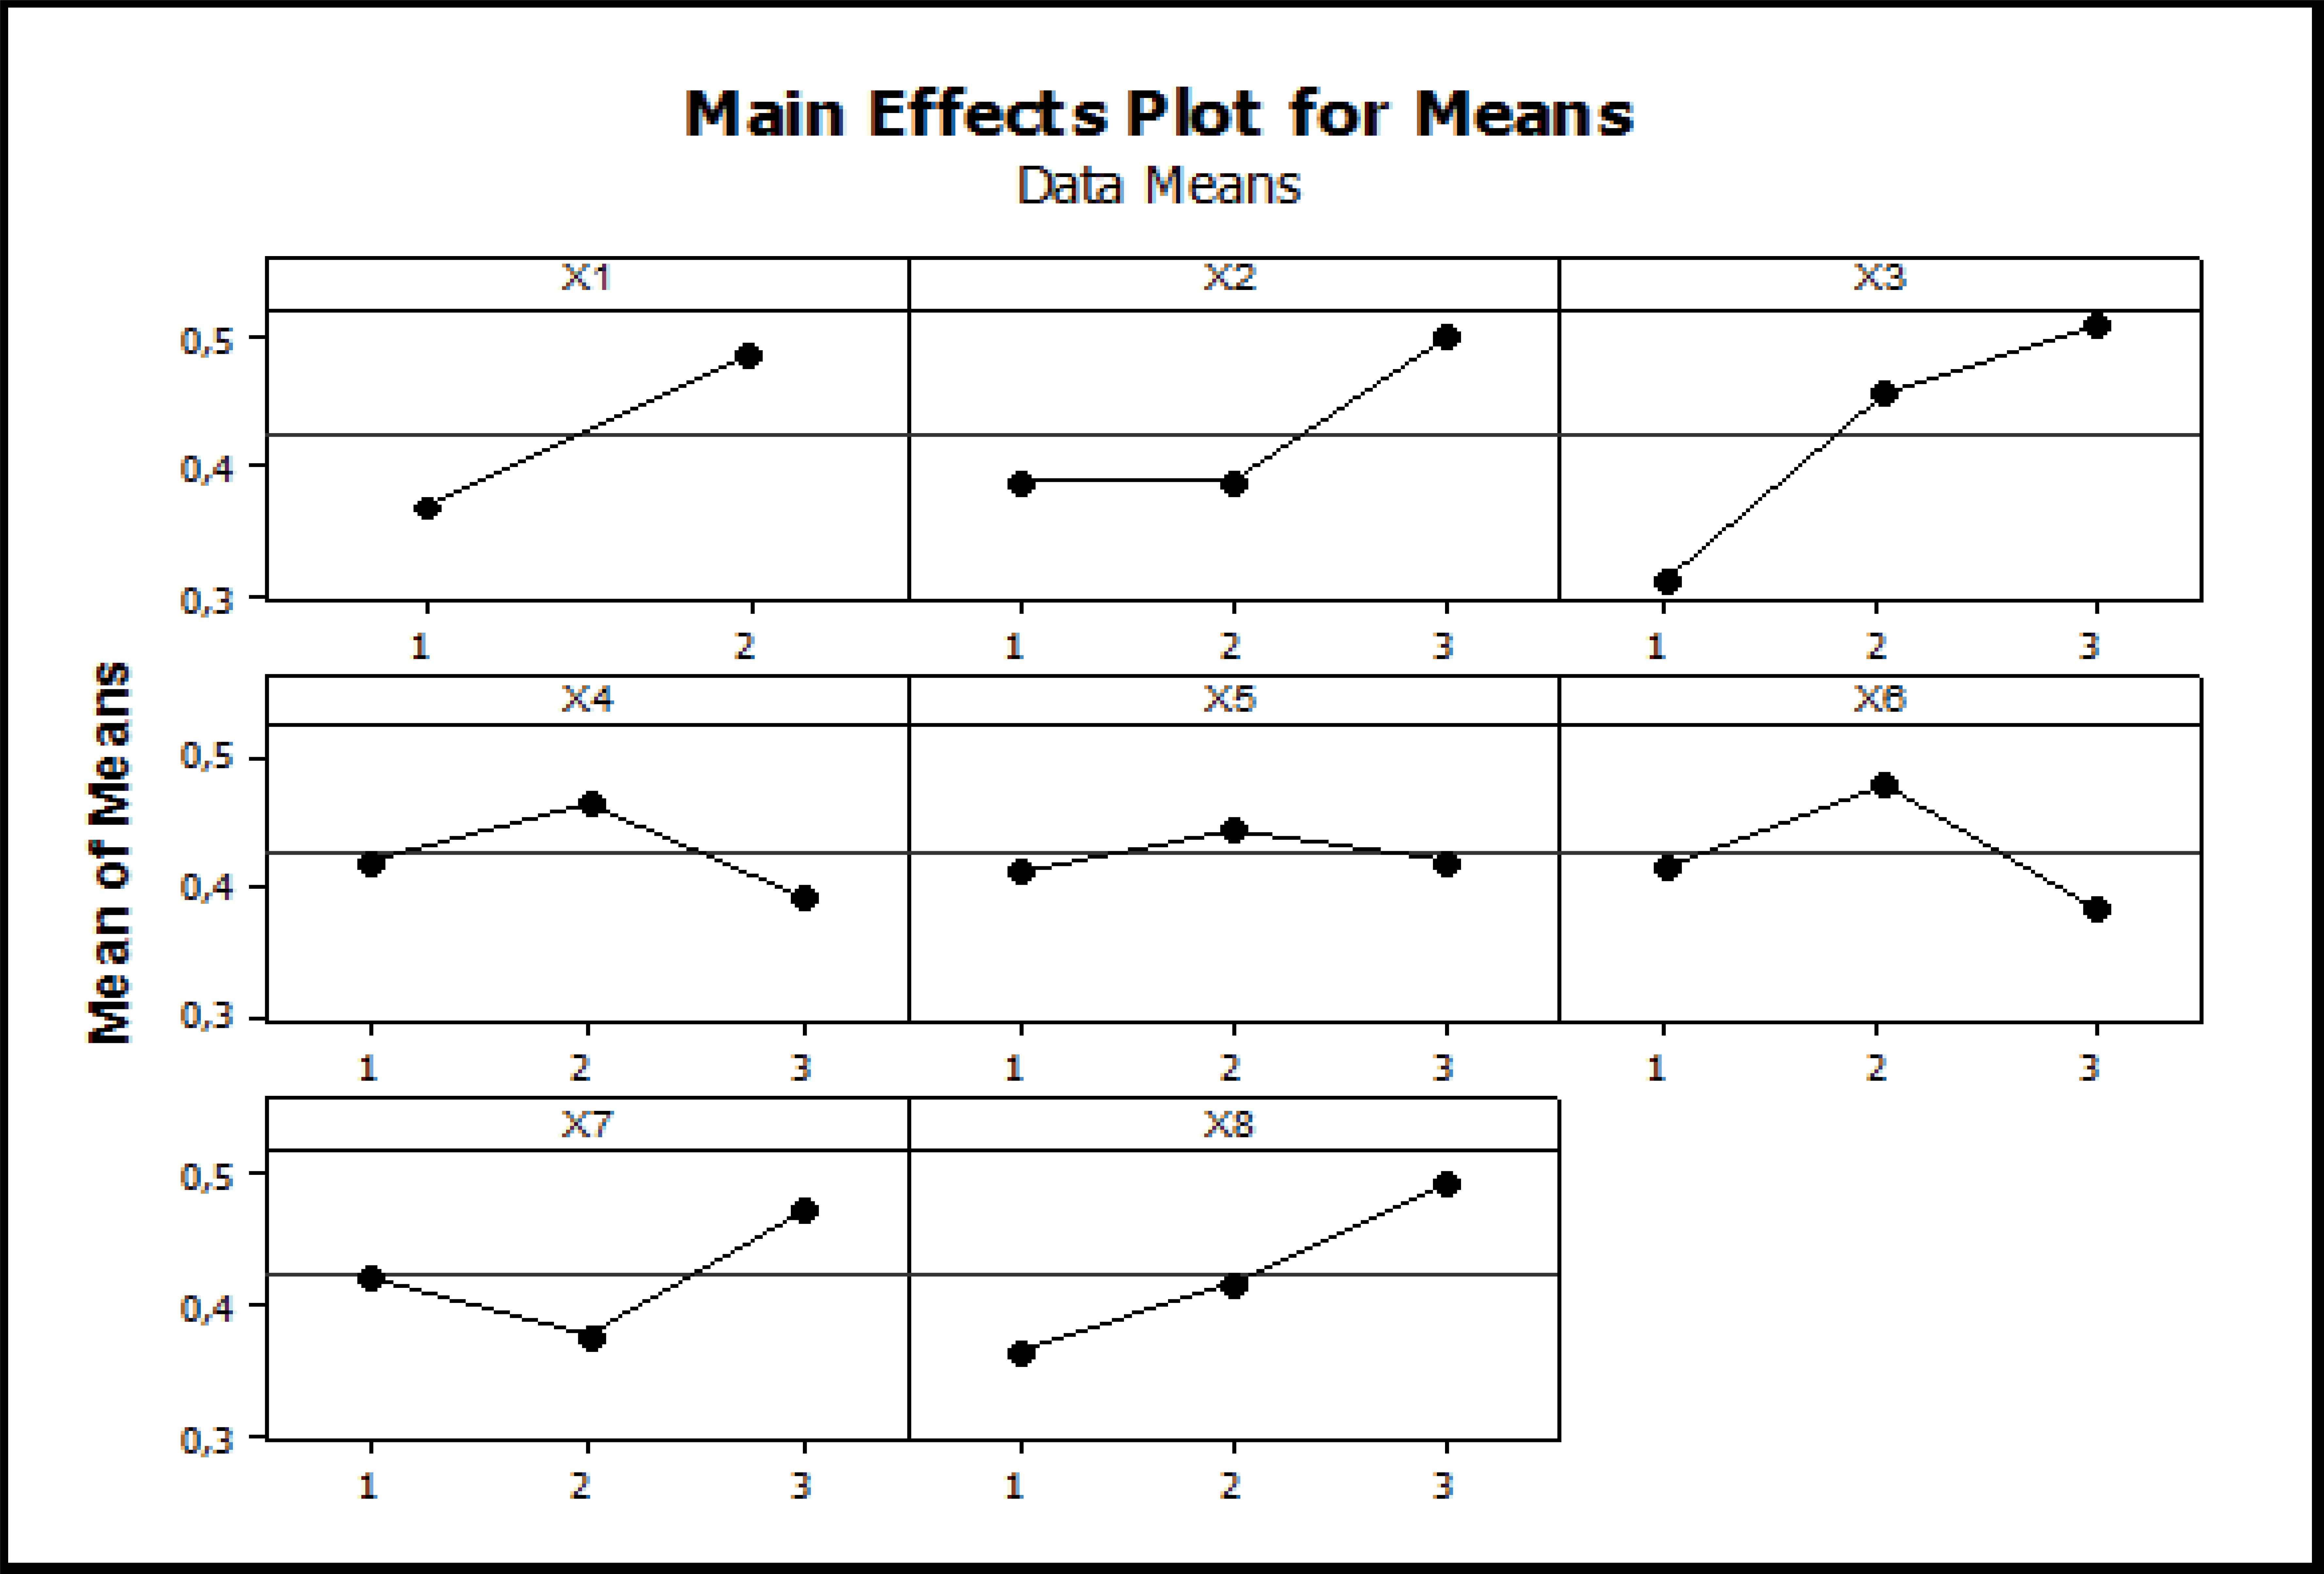
Means plots for factor effects
| Factors | X1 | X2 | X3 | X4 | X5 | X6 | X7 | X8 |
|---|---|---|---|---|---|---|---|---|
| Level 1 | 0.3689 | 0.3885 | 0.3122 | 0.4220 | 0.4136 | 0.4158 | 0.4245 | 0.3647 |
| Level 2 | 0.4834 | 0.3879 | 0.4568 | 0.4628 | 0.4454 | 0.4802 | 0.3789 | 0.4192 |
| Level 3 | 0.5020 | 0.5094 | 0.3936 | 0.4194 | 0.3824 | 0.4750 | 0.4944 | |
| Optimal factor levels | 2 | 3 | 3 | 2 | 2 | 2 | 3 | 3 |
Optimum factors’ levels
| Responses | Description | Estimated mixture levels before Taguchi experiments (X1)2(X2)2(X3)3(X4)1(X5)2(X6)3(X7)2(X8)1 | Optimal mixture levels after Taguchi experiments (X1)2(X2)3(X3)3(X4)2(X5)2(X6)2(X7)3(X8)3 | Anticipated improvement (dB) | Anticipated improvement (%) |
|---|---|---|---|---|---|
| 1 | Air content (%) | 1.5 | 1.5 | 0.0 | 0.0 |
| 2 | Slump flow (cm) | 250 | 290 | 0.16 | 16.0 |
| 3 | Water absorption (%) | 1.48 | 1.48 | 0.0 | 0.0 |
| 4 | Compressive strength (N/mm2) 2 day | 33.9 | 36.2 | 2.3 | 6.7 |
| 5 | Compressive strength (N/mm2) 28 days | 50.58 | 53.86 | 3.28 | 6.5 |
| 6 | Production Cost ($/mm2) | 42.9863 | 42.25634 | 0.72996 | 1.7 |
Anticipated improvement in optimum condition
The verification study results show that proposed results satisfy the expected increase for compressive strength and slump flow and expected decrease for production cost, air content and water absorption (Table 9).
| Exp. run | L18 Taguchi design |
Responses |
||||||||||||
|---|---|---|---|---|---|---|---|---|---|---|---|---|---|---|
| X1 | X2 | X3 | X4 | X5 | X6 | X7 | X8 | R1 % | R2 mm | R3 % | R4 (N/mm2) | R5 (N/mm2) | R6 $/mm2 | |
| 1 | 2 | 3 | 3 | 2 | 2 | 2 | 3 | 3 | 1.5 | 290 | 1.48 | 36.2 | 53.86 | 42.25634 |
Validation experiment in optimum condition
3.3. Prediction module: ANN modeling
In this module, a prediction model is developed by using ANN to predict effect of factors (mixture dosages) on the selected quality characteristics of SRMC for any potential application. Slump flow (R2), the 2th day compressive strength (R4), the 28th day compressive strength (R5) and production cost (R6) are the selected quality characteristics for the representative modeling application. The developed neural network in our application has eight parameters in input layer and four responses in output layer. The considered network parameters are as follows: hidden layers: 0, 1, 2; hidden units: 5, 10 and 15; learning cycles = 100, 300 and 500. The data used for training, validating, and calibrating of ANNs are collected from the experiment. The range of the parameters used as input and output variables are presented in Table 5 and Table 10 respectively. A data set including 38 samples determined from experimental results are used for training, testing and validation stages of the ANN model.
| Quality Characteristic | Symbol | Description | Data used in ANN model | |
|---|---|---|---|---|
| Minimum | Maximum | |||
| 2 | R2 | Slump flow (cm) | 1 | 50 |
| 4 | R4 | Compressive strength (N/mm2) 2 day | 20 | 45 |
| 5 | R5 | Compressive strength (N/mm2) 28 days | 40 | 65 |
| 6 | R6 | Production cost ($/mm2) | 35 | 43.5 |
The range of the parameters used as output variables
The available data set are divided into three groups as training, testing and validation data subsets which consist of 18, 10 and 10 data samples, respectively [25]. Taguchi experimental results are used for training of network models. Moreover, 10 experiments are used for testing and 10 experiments are used for validation of the network models. Multiple-input neuron models can approximate any linear function (Taguchi experiments are used for training the network) providing a sufficient amount of hidden layer neurons is available. Therefore, multiple-input neuron models are used in this research. The chosen model architecture is shown in Figure 7.
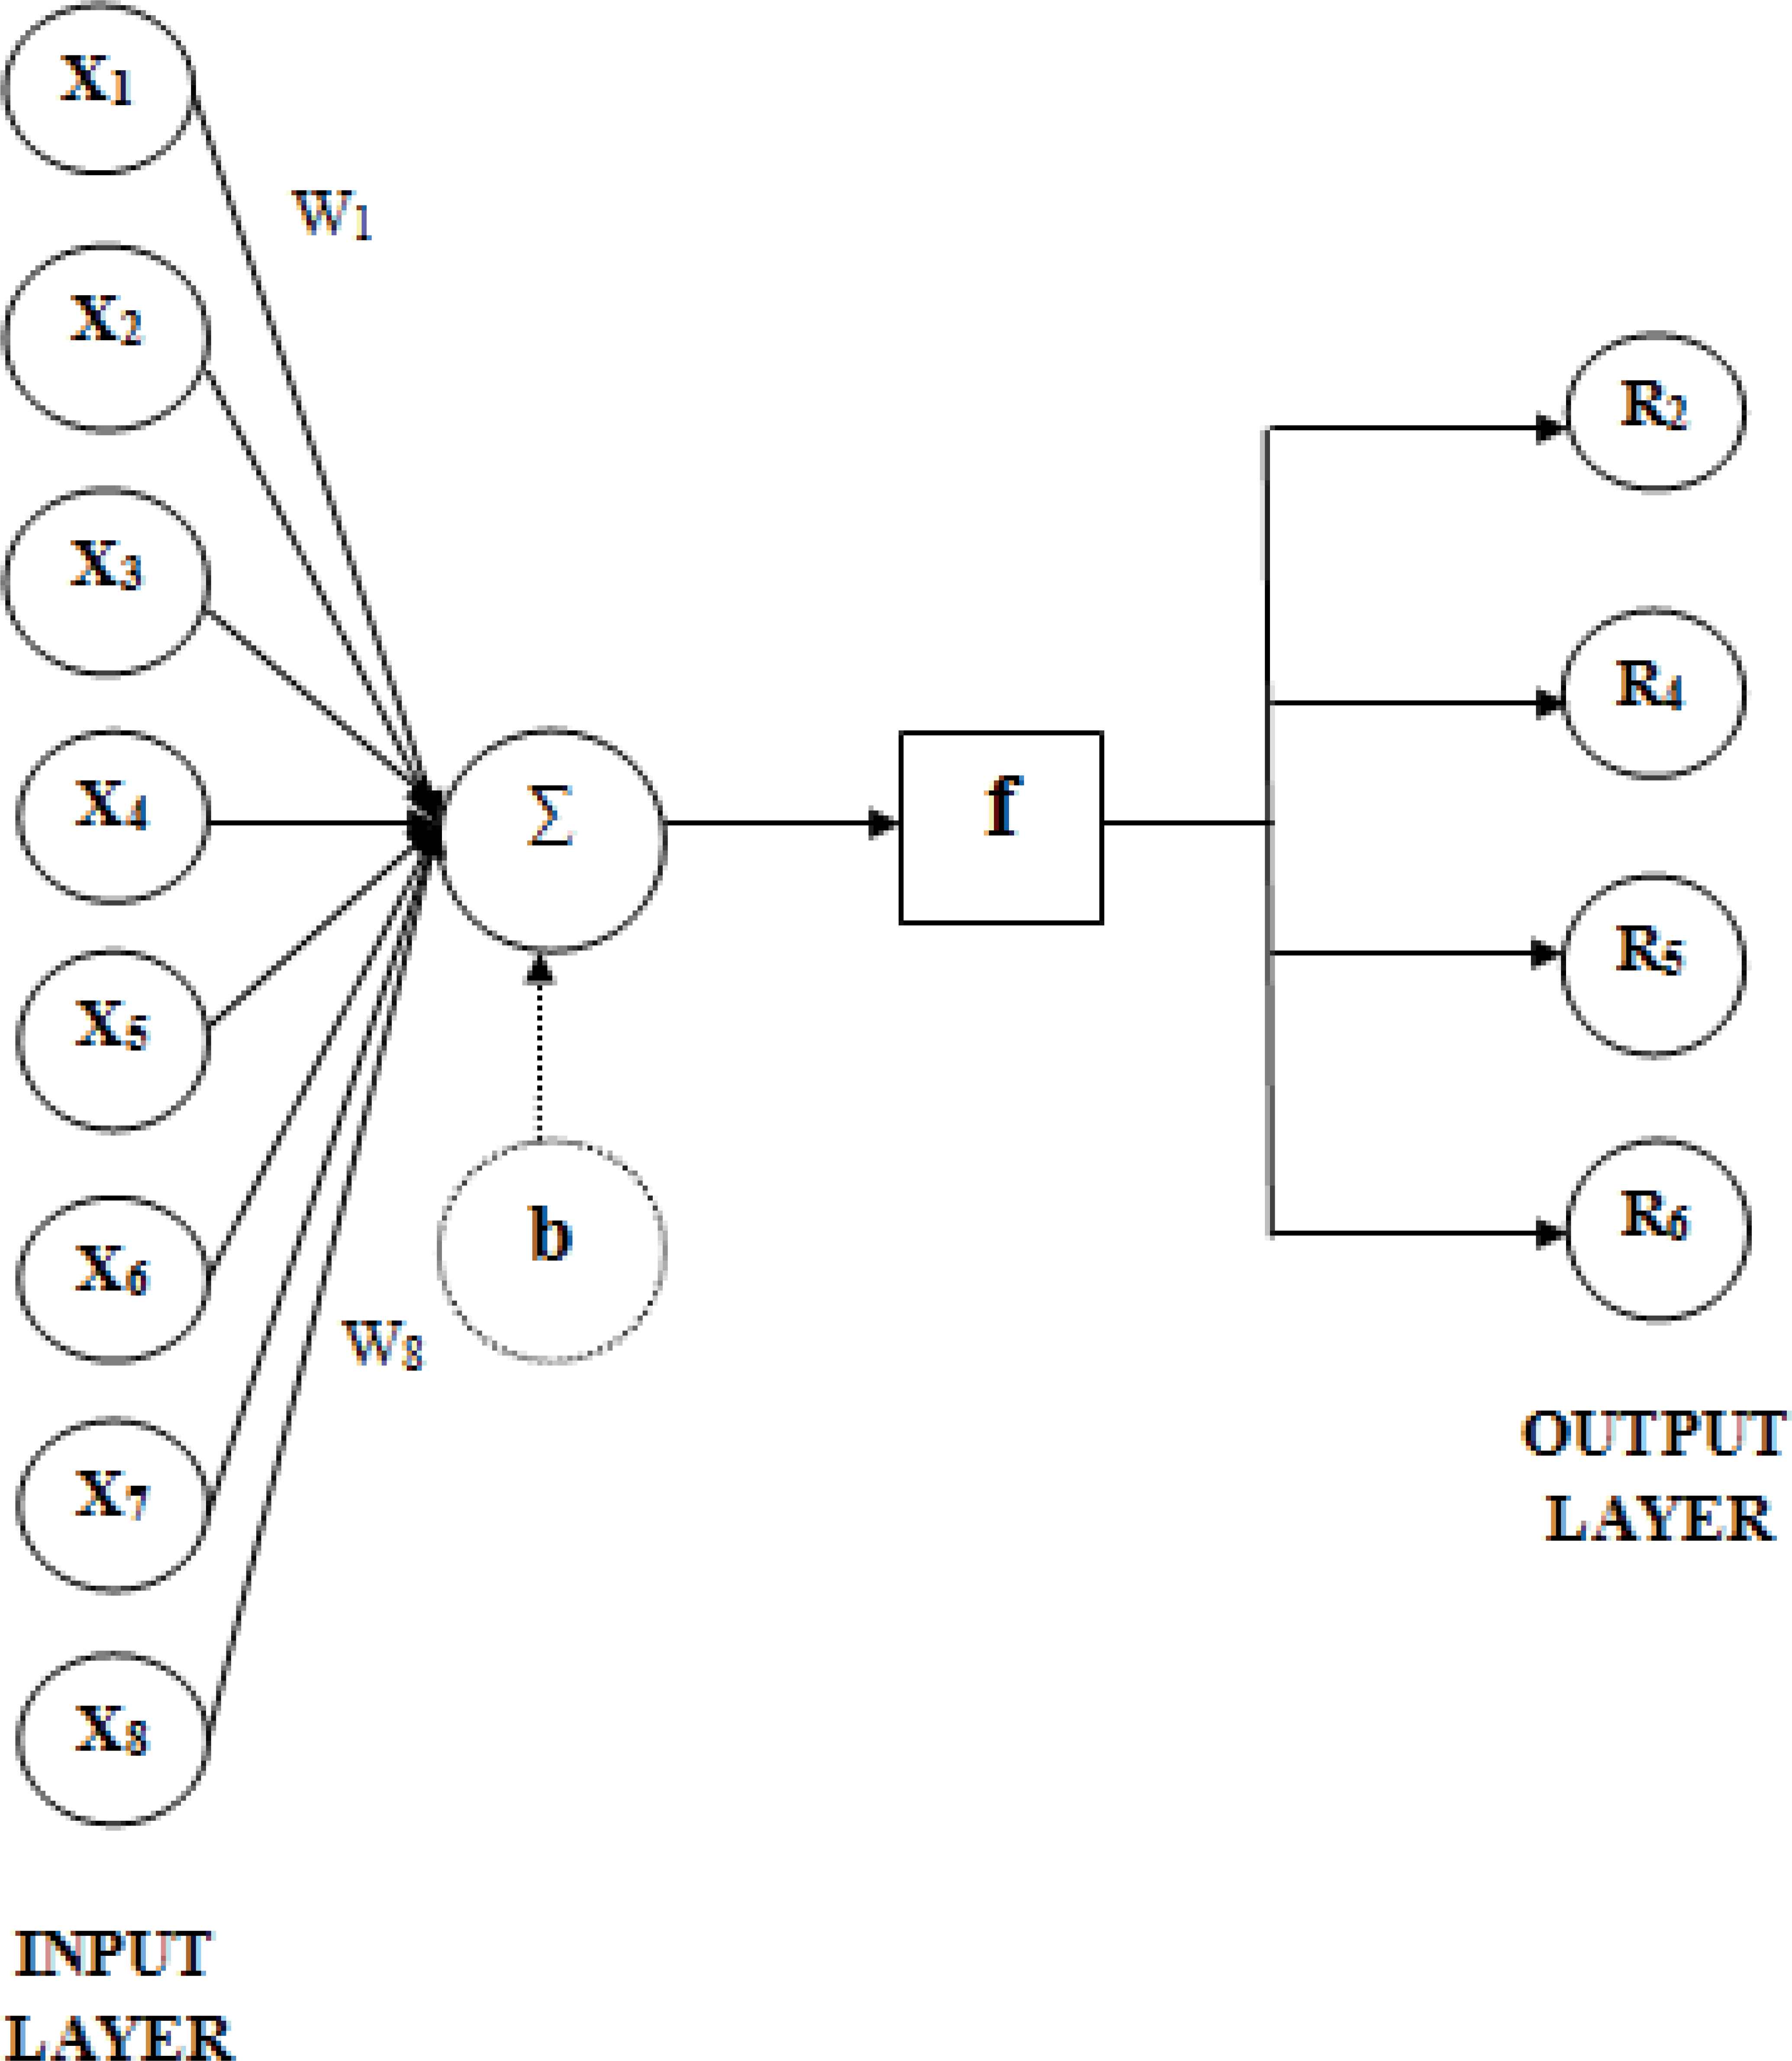
The system used in the ANN model
The parameters used in the chosen network can be determined as follows; multiple-input neuron model, adopted in this research, has 8 neurons (variables) in the input layer and 4 neurons in output layer. The computer program, used in running the network models, is written in MATLAB®. To compare the predicted results obtained from ANN, it transforms them back to their original results and then the mean absolute relative error (MARE) and MSE are gained. The hyperbolic tangent, logarithmic sigmoid and pure linear transfer functions are tried as activation operations for output layer neurons to get the best ANN model [25].
The relationship between prediction results with ANN and experimental results for all concrete criteria is given in Table 11. Validation experiments are also applied at estimated condition. The results demonstrate that the experimental results are close to the estimated results (Tables 12–14).
| Exp.no. | *R2 | ‡R2 | *R4 | ‡R4 | *R5 | ‡R5 | *R6 | ‡R6 |
|---|---|---|---|---|---|---|---|---|
| 1 | 25 | 14.722 | 33.9 | 34.7389 | 54.80 | 57.5742 | 35.28463 | 35.1892 |
| 2 | 45 | 37.222 | 36.3 | 36.0889 | 59.80 | 57.6742 | 37.15179 | 37.0857 |
| 3 | 70 | 59.722 | 36.6 | 37.4389 | 55.00 | 57.7742 | 39.07775 | 38.9822 |
| 4 | 130 | 109.72 | 28.5 | 30.1722 | 52.55 | 52.4717 | 35.72384 | 35.7712 |
| 5 | 150 | 119.72 | 30.2 | 31.1972 | 52.56 | 50.1567 | 37.61646 | 37.4069 |
| 6 | 150 | 157.22 | 30.3 | 29.8972 | 51.10 | 52.1917 | 37.69510 | 37.8819 |
| 7 | 190 | 205.56 | 23.3 | 23.5972 | 42.69 | 42.7850 | 36.20876 | 36.3266 |
| 8 | 170 | 213.06 | 28.7 | 25.4972 | 49.46 | 47.4925 | 36.34740 | 36.2071 |
| 9 | 230 | 243.06 | 26.0 | 25.1722 | 46.50 | 46.3400 | 38.07916 | 38.3293 |
| 10 | 60 | 83.611 | 39.7 | 38.9806 | 59.20 | 58.8178 | 39.75984 | 39.2338 |
| 11 | 130 | 163.61 | 42.1 | 38.5306 | 61.60 | 58.9078 | 41.68679 | 41.7508 |
| 12 | 150 | 151.11 | 36.4 | 38.3556 | 61.23 | 59.7003 | 41.93171 | 41.8311 |
| 13 | 210 | 181.11 | 31.1 | 33.1556 | 54.09 | 55.4786 | 38.98953 | 38.7452 |
| 14 | 230 | 221.11 | 31.4 | 30.9806 | 50.80 | 50.4911 | 41.03954 | 40.9755 |
| 15 | 250 | 271.11 | 33.9 | 33.7306 | 50.58 | 53.2536 | 42.98634 | 42.8980 |
| 16 | 280 | 277.78 | 26.3 | 26.2889 | 42.38 | 43.4511 | 40.01169 | 39.8857 |
| 17 | 290 | 305.28 | 28.7 | 26.8389 | 49.56 | 49.3211 | 40.19498 | 40.2527 |
| 18 | 420 | 365.28 | 24.0 | 27.7389 | 48.23 | 48.2832 | 42.26095 | 42.2832 |
| R2 | 93.9 93.5† |
88.3 87.6† |
90.7 90.2† |
99.5 99.4† |
Observed results for response
Predicted values for response using ANN
R2 (adj.)
R2 results using the ANN model (training phase)
| Exp. no. | Experiment Runs: coded variables | *R2 | ‡R2 | *R4 | ‡R4 | *R5 | ‡R5 | *R6 | ‡R6 | |||||||
|---|---|---|---|---|---|---|---|---|---|---|---|---|---|---|---|---|
| X1 | X2 | X3 | X4 | X5 | X6 | X7 | X8 | |||||||||
| 1 | 2 | 1 | 1 | 1 | 2 | 1 | 3 | 3 | 110 | 107.36 | 37.8 | 37.76 | 61.3 | 61.29 | 39.21 | 39.09 |
| 2 | 2 | 1 | 2 | 1 | 2 | 1 | 2 | 3 | 130 | 133.19 | 37.6 | 37.56 | 60.8 | 60.82 | 40.53 | 40.51 |
| 3 | 2 | 1 | 3 | 2 | 1 | 2 | 1 | 3 | 170 | 168.61 | 37.1 | 37.02 | 57.8 | 57.77 | 42.49 | 42.55 |
| 4 | 2 | 1 | 3 | 2 | 1 | 3 | 2 | 3 | 180 | 180.28 | 37.9 | 37.86 | 57.5 | 57.54 | 43.10 | 43.15 |
| 5 | 2 | 1 | 1 | 2 | 1 | 2 | 3 | 3 | 120 | 116.94 | 37.5 | 37.42 | 58.7 | 58.72 | 39.84 | 39.73 |
| 6 | 1 | 3 | 1 | 3 | 1 | 2 | 1 | 3 | 190 | 185.97 | 22.8 | 22.75 | 42.4 | 42.38 | 35.55 | 35.64 |
| 7 | 1 | 2 | 2 | 2 | 1 | 1 | 3 | 3 | 140 | 138.06 | 29.7 | 29.65 | 53.1 | 53.06 | 36.47 | 36.63 |
| 8 | 1 | 1 | 2 | 2 | 3 | 3 | 3 | 3 | 50 | 36.39 | 37.1 | 37.08 | 57.8 | 57.83 | 37.73 | 37.65 |
| 9 | 1 | 3 | 3 | 3 | 1 | 1 | 1 | 3 | 240 | 242.22 | 23.2 | 23.21 | 44.8 | 44.82 | 37.63 | 37.88 |
| 10 | 1 | 2 | 2 | 1 | 3 | 1 | 2 | 3 | 120 | 118.06 | 30.3 | 30.31 | 53.9 | 53.92 | 36.38 | 36.47 |
| R2 | 99.6 99.6† |
100.0 100.0† |
100.0 100.0† |
99.8 99.8† |
||||||||||||
Observed results for response
Predicted values for response using ANN
R2 (adj.)
R2 results using the ANN model (testing phase)
| Exp. no. | Experiment Runs: coded variables | *R2 | ‡R2 | *R4 | ‡R4 | *R5 | ‡R5 | *R6 | ‡R6 | |||||||
|---|---|---|---|---|---|---|---|---|---|---|---|---|---|---|---|---|
| X1 | X2 | X3 | X4 | X5 | X6 | X7 | X8 | |||||||||
| 1 | 2 | 2 | 1 | 2 | 1 | 1 | 2 | 3 | 200 | 196,94 | 31,0 | 30,91 | 52,9 | 52,89 | 39,08 | 39,05 |
| 2 | 2 | 2 | 2 | 2 | 1 | 2 | 1 | 3 | 230 | 229,03 | 31,0 | 30,99 | 51,1 | 51,13 | 41,01 | 41,06 |
| 3 | 2 | 2 | 3 | 2 | 1 | 3 | 3 | 3 | 280 | 277,36 | 32,8 | 32,76 | 52,5 | 52,53 | 42,96 | 43,10 |
| 4 | 2 | 2 | 2 | 3 | 1 | 2 | 1 | 3 | 220 | 221,11 | 31,0 | 30,98 | 50,5 | 50,49 | 41,00 | 40,98 |
| 5 | 2 | 2 | 1 | 3 | 1 | 2 | 2 | 3 | 190 | 195,28 | 31,2 | 31,18 | 51,0 | 50,97 | 39,68 | 39,56 |
| 6 | 2 | 3 | 1 | 2 | 1 | 1 | 2 | 3 | 280 | 288,61 | 25,3 | 25,25 | 46,8 | 46,82 | 38,93 | 38,99 |
| 7 | 2 | 3 | 2 | 2 | 1 | 2 | 3 | 3 | 400 | 331,53 | 26,5 | 26,46 | 47,2 | 47,17 | 40,88 | 41,02 |
| 8 | 2 | 3 | 3 | 3 | 1 | 2 | 3 | 3 | 430 | 354,86 | 26,9 | 26,81 | 47,1 | 47,11 | 42,21 | 42,35 |
| 9 | 2 | 3 | 2 | 3 | 1 | 3 | 1 | 3 | 380 | 319,03 | 25,6 | 25,59 | 43,1 | 43,14 | 41,45 | 41,51 |
| 10 | 1 | 3 | 2 | 1 | 3 | 1 | 2 | 3 | 210 | 209,72 | 24,6 | 24,64 | 47,9 | 47,85 | 36,23 | 36,40 |
| R2 | 95.7 95.1† |
99.9 99.9† |
99.9 99.9† |
99.8 99.7† |
||||||||||||
Observed results for response
Predicted values for response using ANN
R2 (adj.)
R2 results using the ANN model (validation phase)
| Symbol | Weights (wi) | Bias (b) | |||||||
|---|---|---|---|---|---|---|---|---|---|
| R2 | 1.9 | 1833.3 | 125.0 | −158.3 | −225 | 0.3 | 0.5 | −0.0012 | −1452.8 |
| R4 | 0.0 | −113.3 | 1.5 | −0.2 | 12.2 | 0.0 | 0.1 | −0.0005 | 62.072 |
| R5 | 0.0 | −121.3 | 2.3 | −12.7 | 12.8 | −0.1 | 0.1 | −0.0002 | 97.156 |
| R6 | 0.1 | −1.3 | 5.7 | −1.7 | −2.4 | 0.0 | 0.0 | 0.0001 | 6.3898 |
ANNs are composed of numerous of interconnected nonlinear memory less processing elements called neurons.
The neurons of each layer are connected to that of the next layer through associated weights.
The network employs the information of these weights to solve problems. A connected neuron formula is shown as [49]:
The weights and biases for ANN models* (in coded values)
4. Discussion
Artificial neural network are preferred much more in comparison with other data mining and artificial intelligence techniques due to their power, activeness and easy use [50]. Modeling success of artificial neural network method which is preferred on this study due to this feature has been compared with fuzzy logic method which is commonly used. Artificial neural network and fuzzy logic have been preferred as they have easy use and opportunity on tools such as MATLAB®. Moreover, TOPSIS method has been used with fuzzy version on optimization phase. Especially that those experts appoint different weight values to quality criteria causes to be different optimum point found. In order to remove this problem, fuzzy TOPSIS method has been preferred. The data set used for optimizing the criteria was utilized for modeling the concrete quality criteria. The primary purpose is that after the optimization process, we aim to see whether there will be sufficient experimental design based data set for a successful modeling work or not. If the regression coefficient were sufficient, additional experiments causing loss of time and money will not be needed in industry. Also, we had an opportunity to compare modeling and optimization performance with existing methods.
4.1. Prediction performance of ANN and Fuzzy Model
Mamdani fuzzy inference system was used in this study for modeling the quality criteria of standard concrete. In the proposed method, the factors defining the concrete quality criteria are treated as fuzzy variables. In the modeling of concrete quality criteria under variables such as cement dosage, water to binder ratio, the percentage of super plasticizer content, fine aggregate to total aggregate ratio, coarse aggregate (I) to total aggregate ratio, fly ash dosage, mixture time of fresh concrete are divided into a number of subsets with simple trapezoidal fuzzy membership functions taking into account factors’ levels in Taguchi experiments. Membership functions chosen for cement dosage X1 (normal, high), water to binder ratio X2, the percentage of super plasticizer content X3, fine aggregate to total aggregate ratio X4, coarse aggregate (I) to total aggregate ratio X5, fly ash dosage X6 (low, normal, high) and mixture time of fresh concrete X7 (short, middle, long) were given in Figure 8, respectively. Membership functions chosen for slump flow according to TSE EN 206-1 [42]; slump (very low, low, normal, high, very high), 2th day compressive strength R4; (bad, poor, normal, good and very good), 28th day compressive strength R5 according to TSE EN 206-1 [42]; (very low, low, normal, high and very high) and production cost R6; (low, normal) were also seen in Figure 8, respectively. In brief, fuzzy inference system model could be seen as schematically in Figure 8.
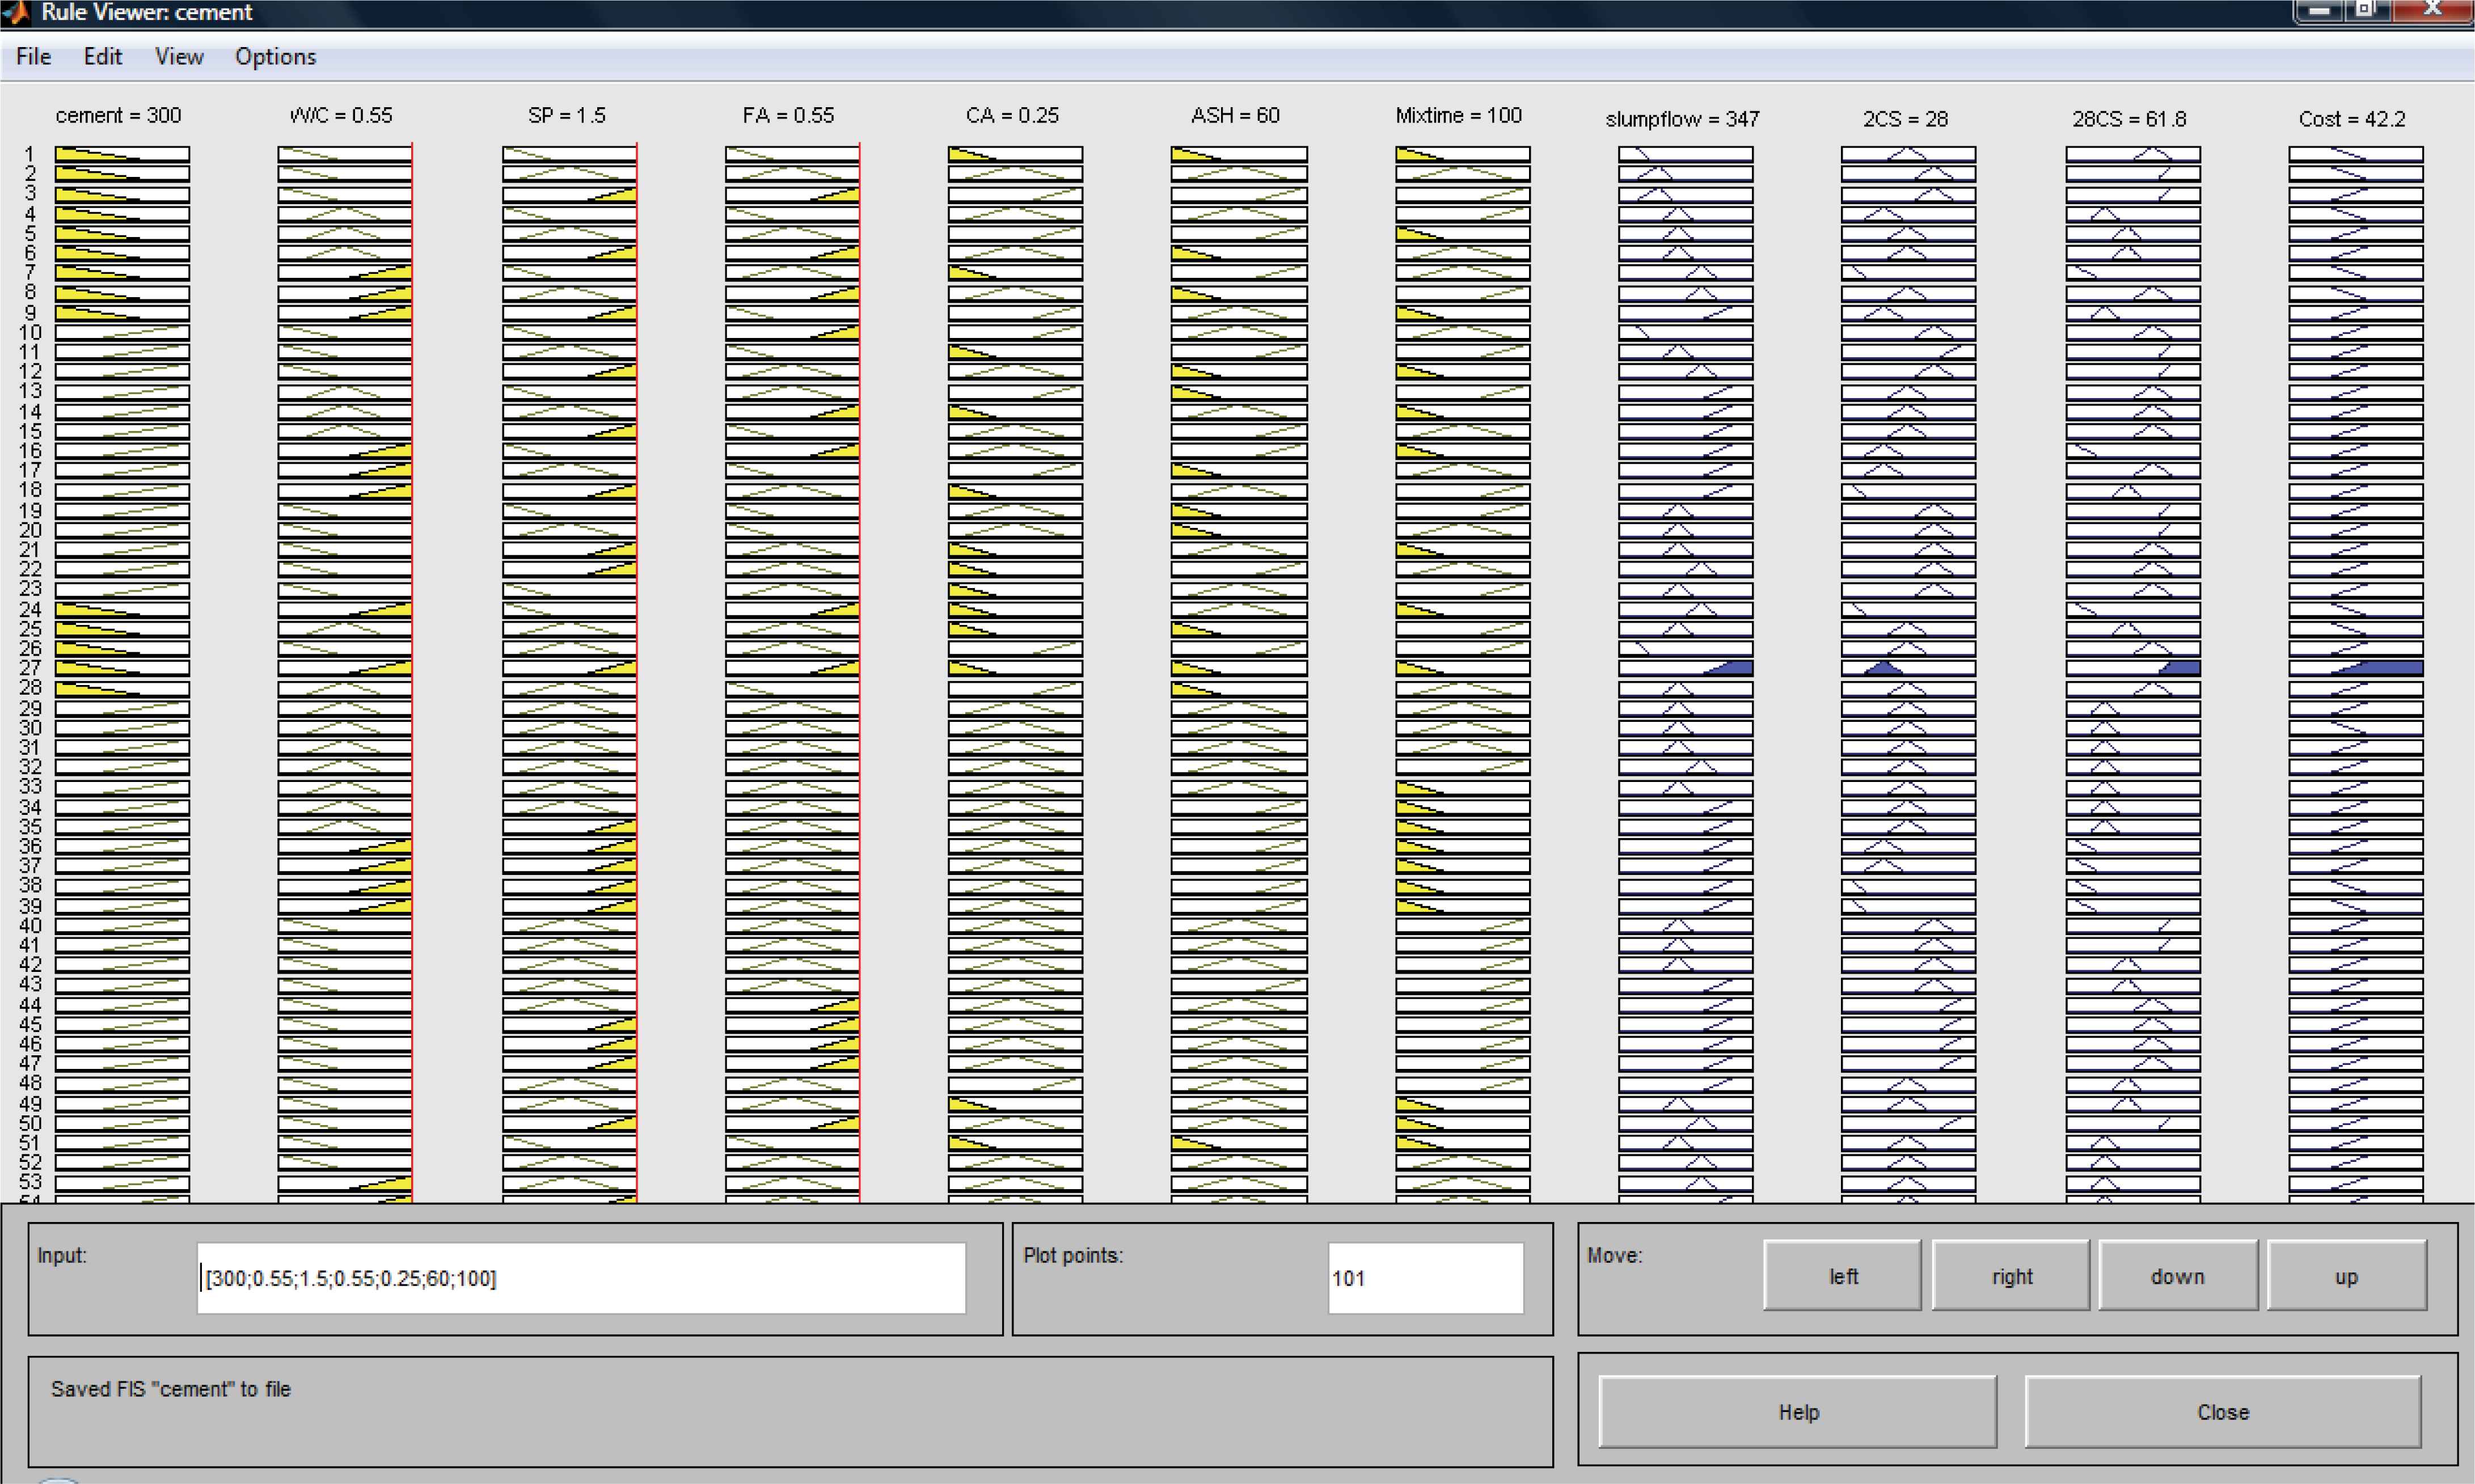
Rule viewer used for fuzzy modeling (validation experiment no: 9)
In this part of study, the developed fuzzy logic-based model was applied to predict the quality characteristics of SC data obtained from Taguchi experiments. The fuzzy rules were written for this purpose. It can be seen from Figure 4 that we devised the fuzzy logic-based algorithm model by using the FL toolbox in MATLAB®. The FL model had seven input parameters and four output parameters.
When fuzzy logic is compared with modeling performance of artificial neural nets, it is seen that artificial neural nets exhibit less data set and more successful estimation performance (Figure 9). For example, when regression coefficients are compared on modeling with artificial neural nets against modeling with fuzzy logic; value 0.96 has been gotten against slump-spread value 0.59, value 0.99 has been obtained against value 0.45 on two - day compressive strength, value 0.99 has been obtained against value 0.14 on twenty eight-day compressive strength and value 0.99 has been obtained against value 0.77 on production cost.
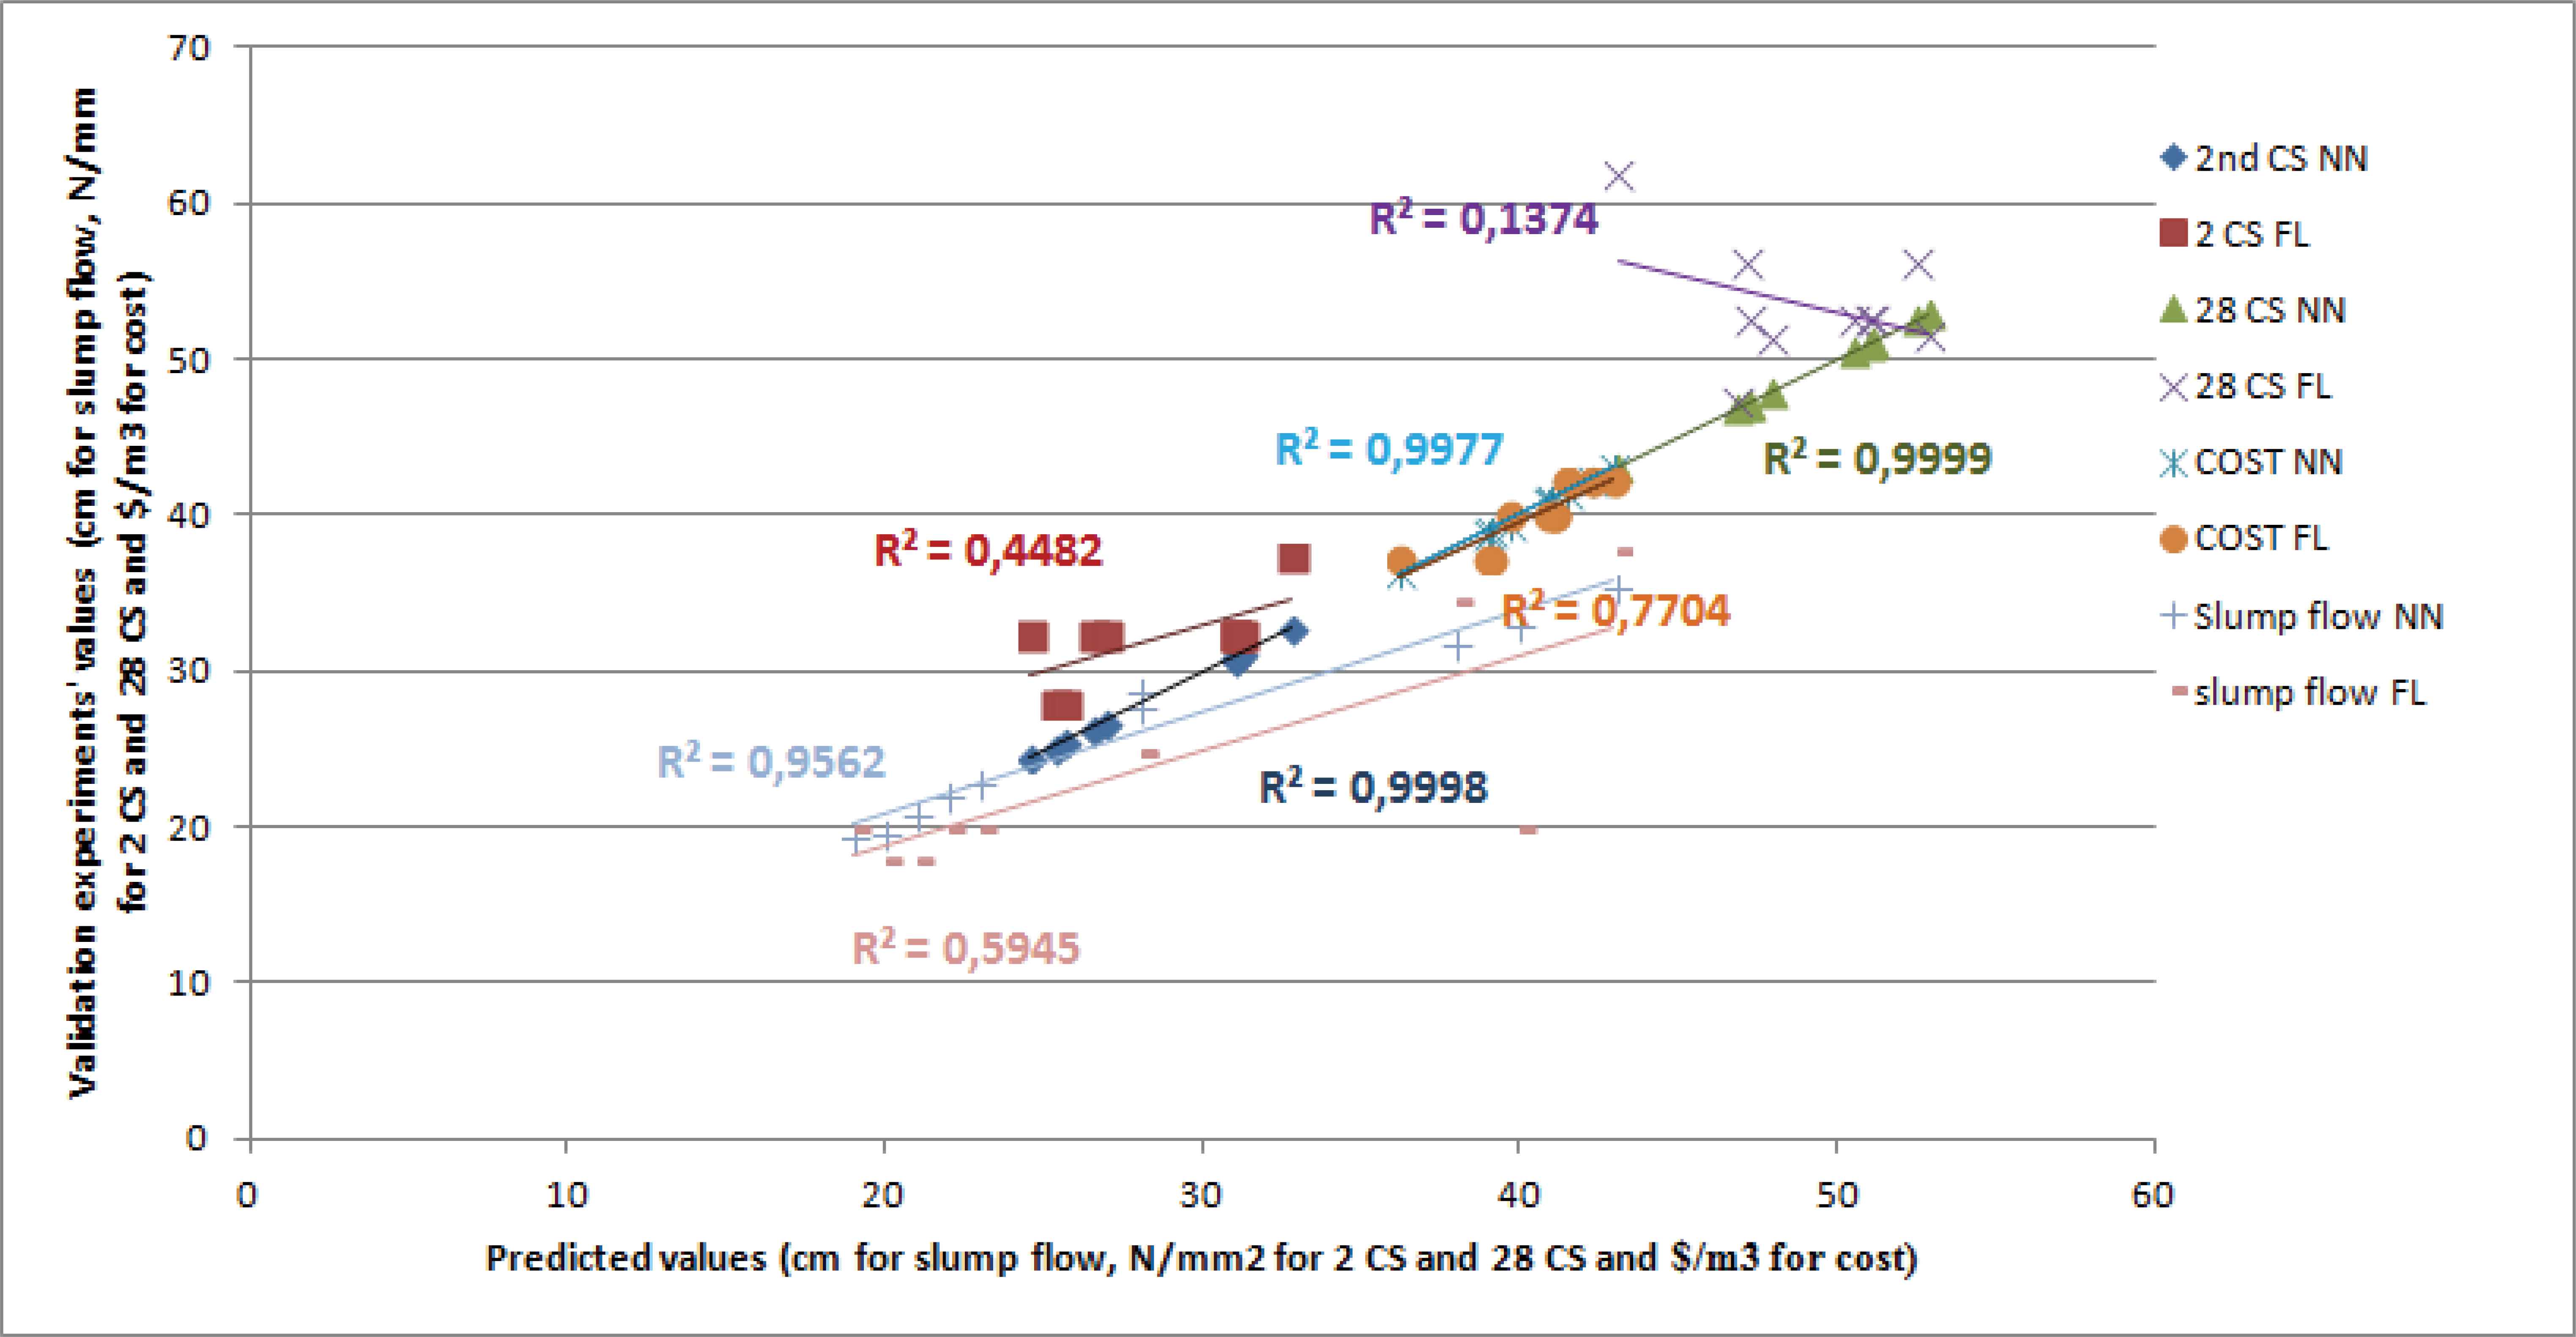
Experimental values vs. predicted values for validation data in Table 13 using fuzzy logic (FL) and neural network (NN)
4.2. Optimization performance of TOPSIS and Fuzzy TOPSIS
It can be seen in Figure 10 that in the results of the TOPSIS based Taguchi optimization model, the optimal factor levels are dissimilar to those derived by the result of the FTOPSIS-based Taguchi approach. Optimal dosage levels which are gotten by TOPSIS based Taguchi optimization application which is made in consideration with weights that only a single expert gives them (details of method can be found in [19] are different from optimal dosage levels which are gotten on FTOPSIS based Taguchi optimization application that is made in consideration with weights that all experts give to quality criteria.
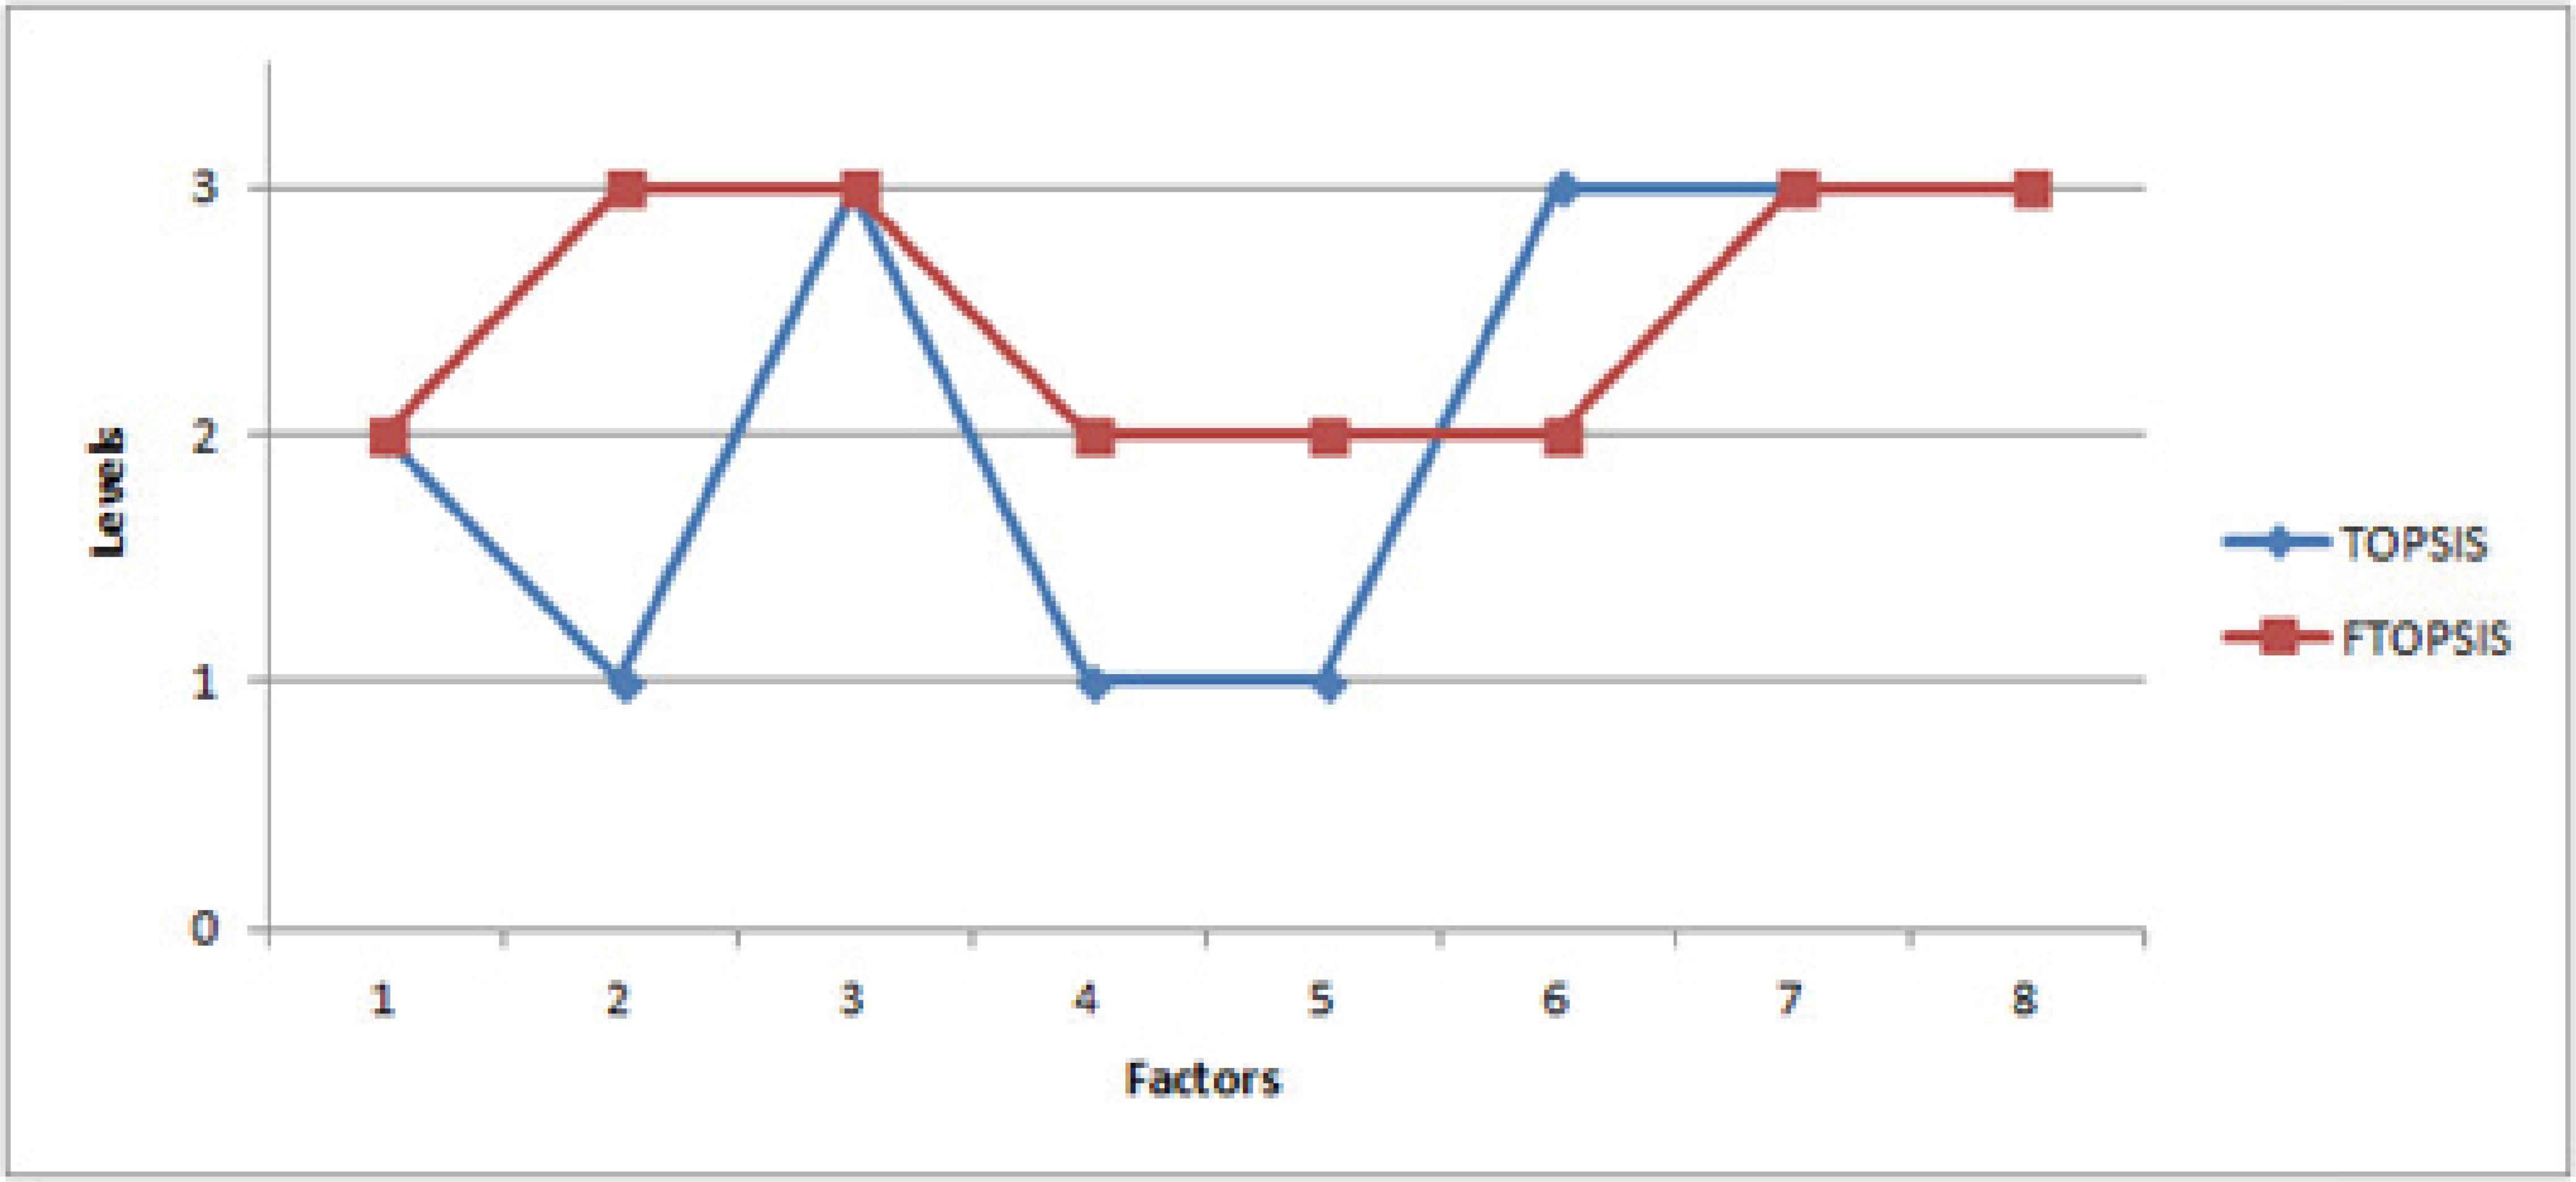
Optimum factor levels obtained by TOPSIS and FTOPSIS
The results show that FTOPSIS based Taguchi optimization is more effective than TOPSIS based Taguchi optimization according to production cost. 5.1% less cost and same quality concrete has been produced by FTOPSIS based Taguchi method than TOPSIS based Taguchi method on production cost (Figure 11). Differences among ambient conditions in concrete production plant and concrete dumping places cause that they assign concrete technician to different level of significance for different quality criteria. Concrete slump loss is seen due to temperature on production and casting points, so concrete’s slump-spread value is more important for worked in dumping place.
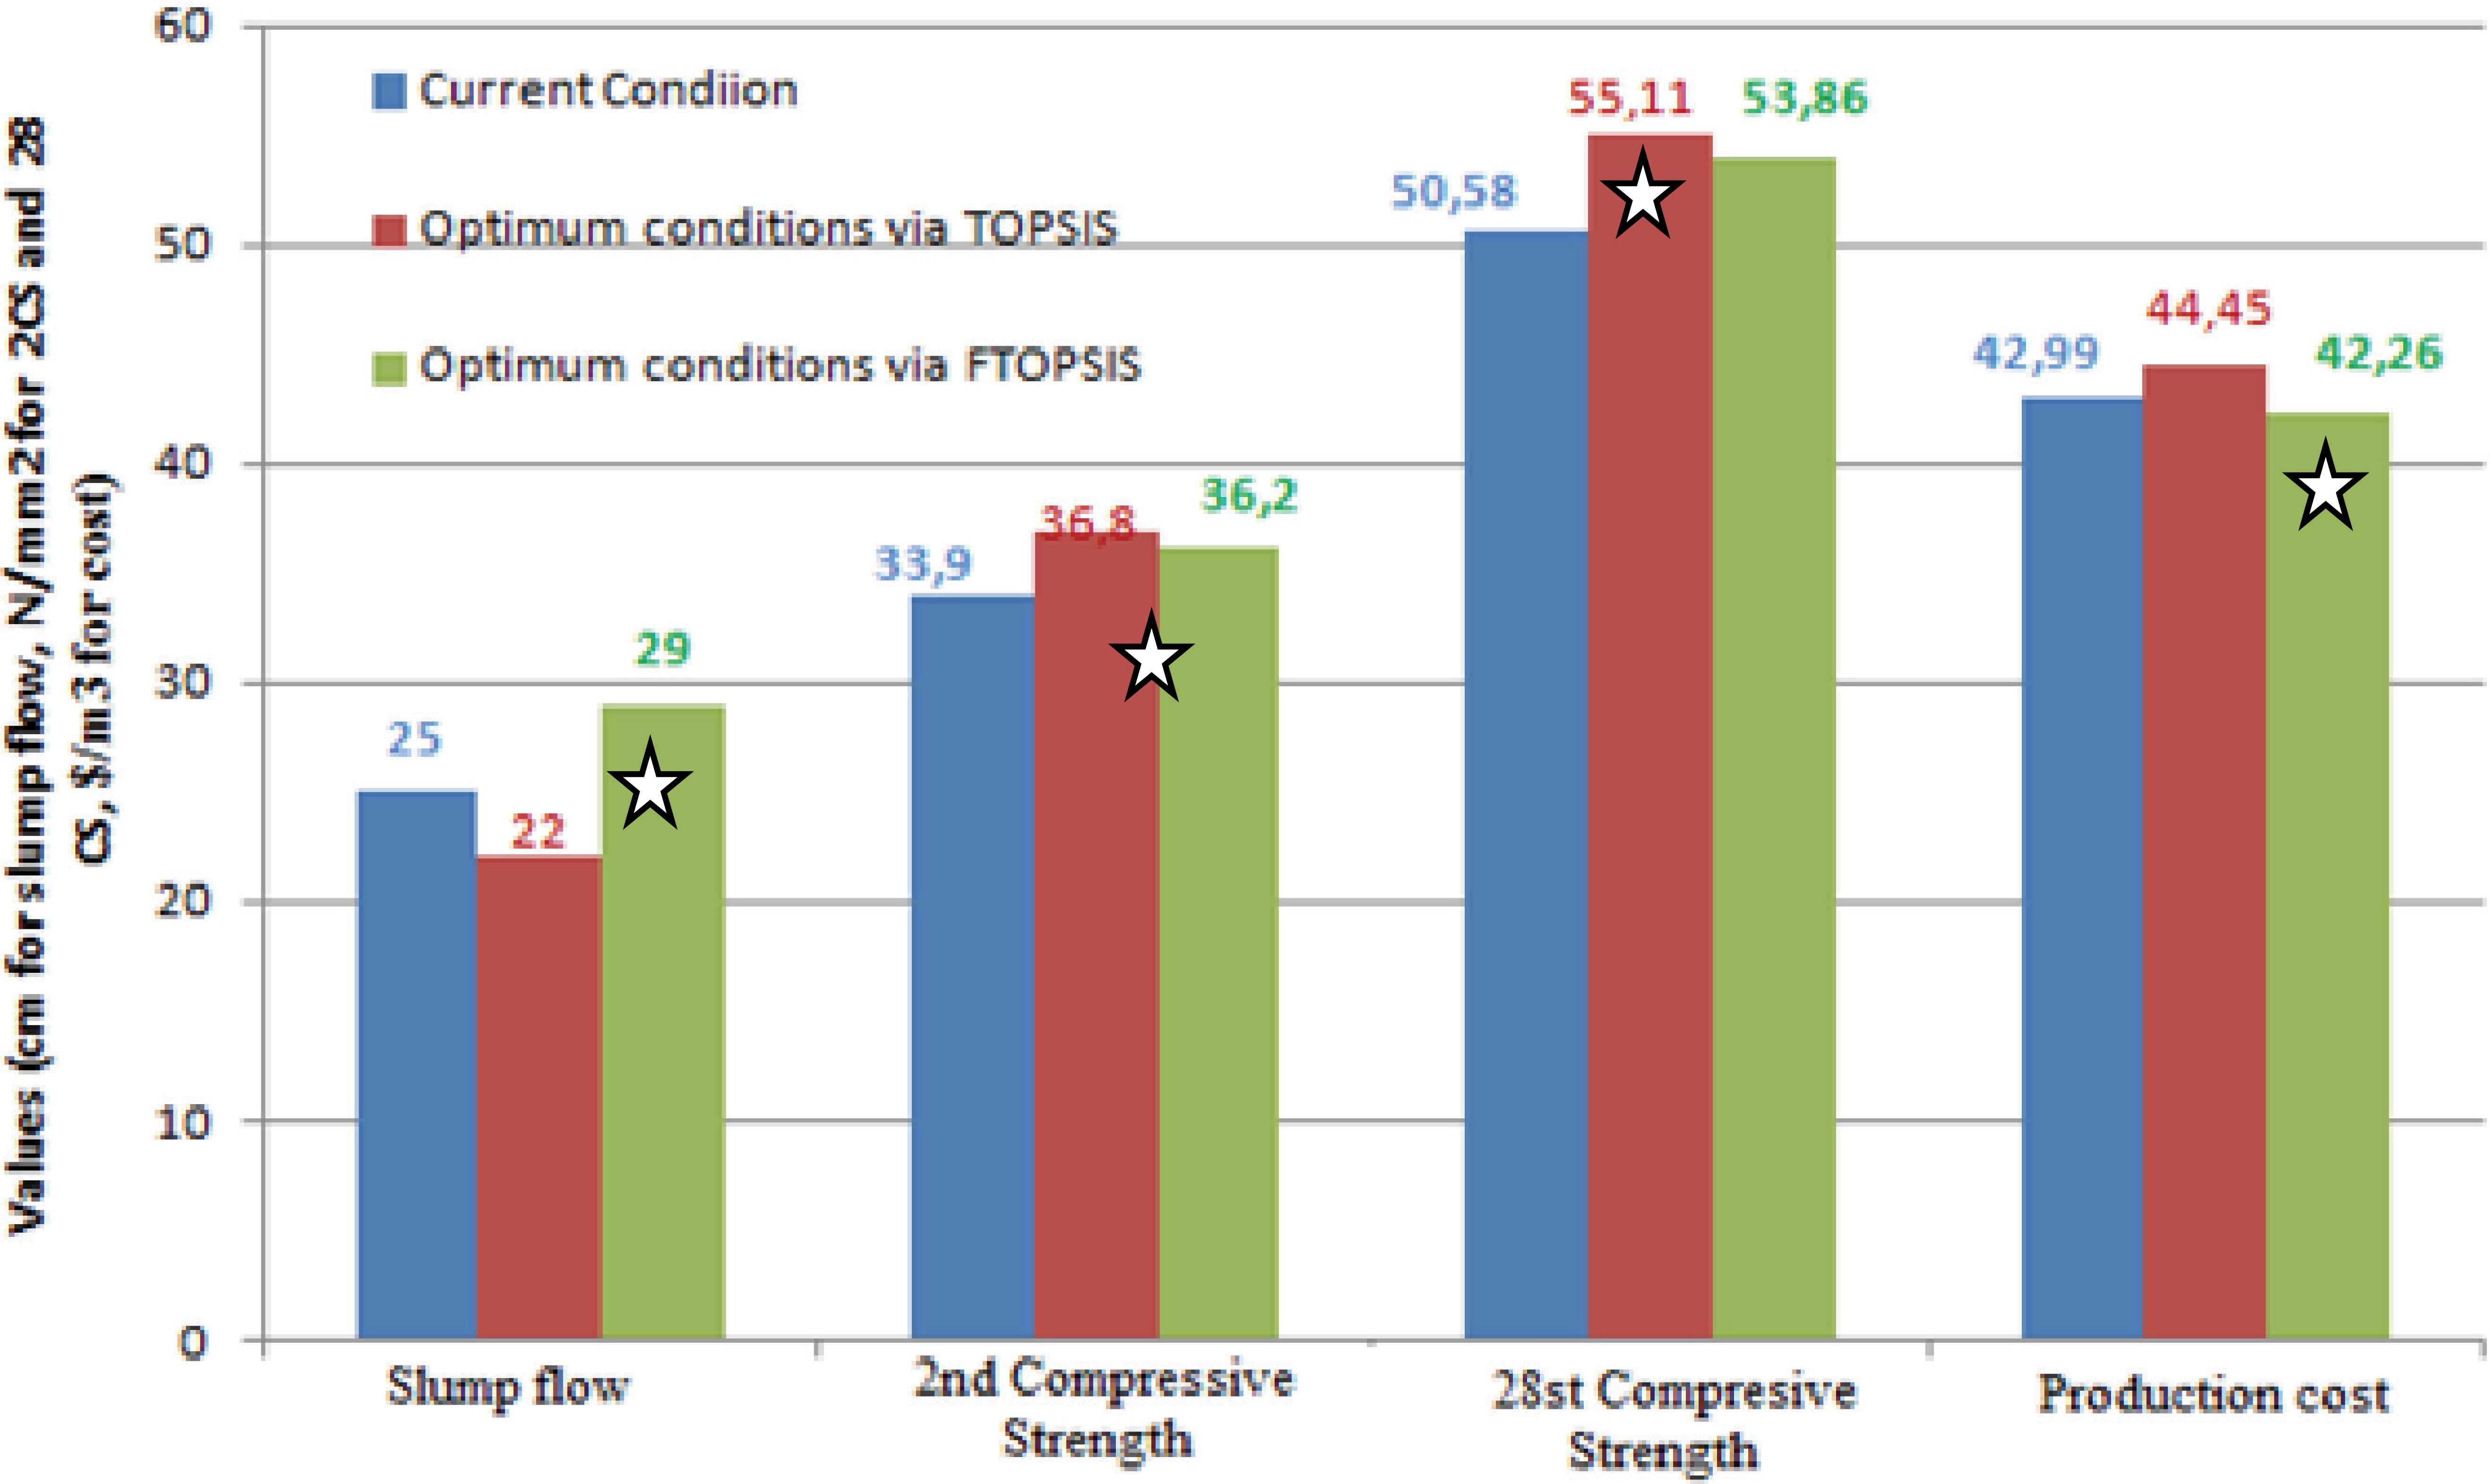
Optimum values for TOPSIS vs. FTOPSIS
5. Conclusions
In this study, the hybrid optimization and the modeling of mixture proportions of standard concrete (SRMC) are carried out by using the Fuzzy TOPSIS (FTOPSIS)-Taguchi model and artificial neural networks (ANNs). The developed model incorporates two separate modules, named ‘‘Multi-Response Optimization: FTOPSIS-Taguchi modeling’ and ‘Prediction: ANN modeling’.
Multi-response optimization module is used in this study to examine the ranking of the conflicting mixture dosage factors’ levels and the best possible mix proportions of SRMC. On the other hand the prediction model of possible mixture dosage combination levels of any possible SRMC production process are built based on ANNs. ANN-based model puts forward successful prediction results. The high correlation in ANN model for slump flow, the 2th day and 28th day compressive strength and production cost responses (Table 11, 12 and 13) indicates that the ANN model can be used as a more accurate tool to model the concrete quality (Figure 9). The concrete manufacturing which has similar mechanical properties was provided with lower cost by FTOPSIS method (Figure 11). The results show the efficiency and effectiveness of the proposed method.
This study represents an experimental study of mixture dosage optimization for the standard ready-mixed concrete sector. The optimal mixture dosage levels are selected considering not only the required quality characteristics of SRMC but also economic aspects which are lacking in many applications but are very important to be competitive in this sector.
References
Cite this article
TY  - JOUR
AU  - Barış Şimşek
AU  - Yusuf Tansel İç
AU  - Emir Hüseyin Şimşek
PY  - 2016
DA  - 2016/06/01
TI  - Hybridizing a fuzzy multi-response Taguchi optimization algorithm with artificial neural networks to solve standard ready-mixed concrete optimization problems
JO  - International Journal of Computational Intelligence Systems
SP  - 525
EP  - 543
VL  - 9
IS  - 3
SN  - 1875-6883
UR  - https://doi.org/10.1080/18756891.2016.1175816
DO  - 10.1080/18756891.2016.1175816
ID  - Şimşek2016
ER  -