
Improvement of the Aircraft Traffic Management Advisor Optimization Using a Hybrid Genetic Algorithm
- DOI
- 10.1080/18756891.2016.1175818How to use a DOI?
- Keywords
- Air traffic control; arriving sequences delays; traffic management advisor; genetic algorithm
- Abstract
During the last decade, problems regarding the Traffic Management Advisor(TMA) has become a concerning matter. A novel hybrid Genetic Algorithm(GA) for the goal of seeking best possible alignment has been presented in this paper. This simple and yet very thorough method benefits from low computational burden, higher convergence rate and lower overall delays. Comprehensive simulations and implementation of the imbedded specially designed rearrangement operator, have shown the effectiveness of the proposed method in comparison with previous literatures and classic GA.
- Copyright
- © 2016. the authors. Co-published by Atlantis Press and Taylor & Francis
- Open Access
- This is an open access article under the CC BY-NC license (http://creativecommons.org/licences/by-nc/4.0/).
1. Introduction
Generally, quality in transportations includes decisions about the design and frequency of service where from the passenger or company owner point of view, can have different meanings. Departure time, frequency of service and priority are aspects of any transportation system that influences the scheduling time table1. In recent years, the rise in flight demands has created concern among air traffic controllers and airlines. The air traffic volume and delays are particularly important since they directly influence flight safety regulations and airline profitability. Flight demand is predicted to be around 14.4 million movements in Europe, increasing the delay time from 1Min/flight to 5-6 Min/flight by the year 20352. Furthermore, putting aside small fluctuations, worldwide air traffic is expected to sharply climb in the upcoming years3. The constant rise in flight demands has surpassed the existing airport capacity which in USA alone has been estimated to have about 3.5 billion dollars’ revenue loss per year4. The Air Traffic Control (ATC) problem consists of several sections starting from departure through landing at the designated airport. During flight, this program is responsible to maintain a steady and balanced traffic flow in each sector and preventing air crashes.
The main focus of this paper is the task of scheduling a batch of arriving Number of Aircrafts (NAC) and assigning them to a suitable Number of Runways (NR), depending on aircrafts types and Estimated Time of Arrivals (ETAs), in order to achieve minimum flight delays and satisfy safety regulations. This is also known as the Traffic Management Advisor (TMA). Decision systems based on optimizing algorithms may help to exploit at most the capacity available in each terminal control area5. Early attempts to provide some control over the air traffic were made in 1919 based on the simple “rules of the road” for air navigation6. The US first formulated its flight regulations in 1926. A vast variety of solutions from early methods such as network theory7 and cut and try methods8 to more complicated approaches such as heuristic methods have been proposed over the years, each with their loss and gain. Some such as the cut-and-try method has shown to have great dependency on analysts’ experience on the matter. Rather than designing the ATC system itself, the dependability and safety assessment applications must be thoroughly studied9. In10, dependability evaluations have been done on the automatic CAUTRA air traffic system deployed on the France airways. The system consists of several Regional Control Centers (RCCs) and one Centralized Operating Center (COC) for analyzing the collected data. Analysts consider the ATC flow management system as a dynamic, complex social system which consists of many types of interactive traffic participants. The use of agent base modeling and simulation are also proposed in2,11.
Putting the financial aspects aside, environmental impacts have recently emerged to be just as important. Considering the overall air pollution in most regions, this has become a priority as well. In the case of airport traffic (busy hours), the additional required time for procedures such as taxi-in, taxi-out and departing/landing queuing has led to more energy consumption and air pollution. According to the intergovernmental panel on climate change, improvement in ATC can save up to 6-12% on fuel efficiency per flight2. To this end, Single European Sky Air Traffic Management Research and US-Next Generation Air Transportation system (NextGen) known as two of the biggest air traffic initiatives, have focused their research on the environmental impacts and implications regarding the ATC problem. Researchers have also focused on evaluating the efficiency of fuel consumption, gas emission and the delays based on different airports layouts12. Tatjana mainly focused on analyzing the dynamic behavior of gas, fuel, emission and their correlation in respect to one another. He showed that a correlation between the first two exists, whereas it’s not the same for different kinds of pollutants. The goal was to provide a clearer understanding of different TMA tactic implications on the overall performance of airport system12. The article however only simulates the idea using a simple one runway airport with low traffic and singular type aircrafts which could be inadequate compared to real conditions.
Several methods, tools and models have been discussed over the years to analyze the ATC problem with different parameters. In the case of automated arriving and departing aircraft models, where initially were developed by Boeing, automation of different arriving and departing models using VDM++ have been introduced by13. This approach has the benefit from ensuring safety, identifying errors at early stages and since the safe separation time of aircrafts are encouraged, it is favored by many.
In14, the distance between aircrafts and available runway ETAs have been emphasized as the main characteristics suitable for using in the ATC simulation. However, In 1960, poor connection capability has been reported as the main limiting factor15 for achieving better runway alignments. Nowadays, heuristic studies such as Genetic Algorithm (GA) and fuzzy systems have proven to be extremely helpful in solving and finding optimum points in some aspects of the ATC problem16,17. The GA based algorithms usually differ in two aspects. Some researches invest entirely on creating innovative coding models for the ATC problem (TMA in this case) hoping to reach lower fitness values at lower generations3, while others try designing new GA operators, tuned specifically for the given case18. Hansen reported an early approach using GA to minimize the overall delays and despite introducing four separate methods, which generally vary on GA operator usages, have shown to result in unsatisfactory delays3. In an attempt to further improve overall delays, Xia-Bing et. al. used an improved crossover and decoding structure, which lowered the overall delay of simulated scenarios but added additional computation burden and complexity. In addition, Particle Swarm Optimization (PSO) and related algorithms have been applied to various complex portions of the ATC such as aircraft departures19, conflict prediction20, route optimization and unmanned air systems21, optimization of arriving sequences22, etc. Even though other researchers such as22 have used none GA approaches (i.e. PSO, etc.) for the same goal and were successful in lowering the overall delays, they have however failed to show similar degree of effectiveness as the proposed method in this paper.
In this paper, a new method for fitness calculation is introduced which not only has shown to have greater convergence rate but also removes all unnecessary complexity from the procedure. A parallel rearrangement process is activated during fitness calculations to insure achievement of minimum delay possible. For simulation and comparison purposes the same case study data is used as by Hansen and Xiao-Bing which includes 4 different scenarios. Also, a fifth case is evaluated where the main purpose is finding the suitable number of runways for a given data bank. The remainder of this paper consists of the following. The air traffic control problem along with necessary constraints is introduced in section 2. The coding procedure and fitness assignment is explained in section 3. The chosen case study is introduced in section 4. Simulation results have been analyzed in section 5 and we conclude the paper in section 6.
2. Defining the ATC Problem
Flight procedures for private planes for instance, are different compared to cargo planes and thus require different time intervals in between. By adding the time required by airport to the announced ETA, the next time which the airport can provide services is calculated. If this time is greater than the ETA of the next aircraft, it would cause a delay and a different Scheduled Time of Arrival (STA). In simpler terms, the main objective is assigning NAC arriving aircrafts to NR runways in a matter that would create efficient landing sequences with lowest delays possible as shown by Fig. 1.
Graphical view of the traffic management advisor process.
By definition, a batch of arriving aircrafts within proximity of 35-200 nautical miles or 45 minutes of arrival time to the airport is considered the “Landing Flight Bank”. These banks are consistent of many different type and categories of airplanes such as commercial, private and even cargo planes. Having different types of aircrafts in a bank would require the airport to provide different services during landing and the next departure. Whether it’s just a simple refueling, taxi-in, taxi-out or cargo and passenger relocation, the airport would require sufficient time separations between consecutive airplane arrivals to execute their services. This is usually the main cause of delays appearing in flight schedules and after the first delay, it has a chain reaction to increase in the next flight, making the whole schedule from that point forward inapplicable.
3. Genetic Algorithm Coding
The complexity of assigning and scheduling arriving aircrafts in large and busy airports, much like the examination timetable scheduling23, is known to be a NP-hard problem. As mentioned in section 1, many approaches have been made using heuristic methods for solving or reaching optimum points for intelligent transportation systems. In most cases the main focus is either the coding structure of chromosomes or the design of suitable GA operators for the ATC problem specifically.
For example, the input for a single point crossover can be two non-string matrixes instead of the default string. The main disadvantage of this method is that it requires rebuilding the chromosome afterwards in order to continue in the GA procedure. In this paper, we have tried to restrain from bringing unnecessary complexity to basic structure of GA and used the default operators with binary coding. By taking a closer look, there are always a leading and a following aircraft at each runway.
Also, the aircrafts in a landing flight bank are not from same categories and therefore, the STA would be different depending on each case for each aircraft. Table 1 shows the time separation, in time per unit, between the leading and following aircrafts which the airport requires to successfully execute their services depending on aircraft type. For Example, if both leading and following aircrafts are type heavy, one perunit time has to be considered. The STA for each aircraft is calculated by adding the time relation from Table 1 with the announced ETA, shown as:
| S(i,j) | Following Aircraft | |||
|---|---|---|---|---|
| Type | Heavy | Large | Small | |
| Leading Aircraft | Heavy | 1 | 1.5 | 2 |
| Large | 1 | 1.5 | 1.5 | |
| Small | 1 | 1 | 1 | |
Time separation between leading and following aircrafts in time perunit.
Where, n = 2,3, …, NAC, k = 1,2, …, NR, ETA (n,k) and Sk(n,n − 1) represent the aircraft number, runway number, estimated time of arrival for the nth aircraft of runway k and the time separation required between aircrafts n and (n − 1). The difference between the ETA and STA determine the aircrafts delay. The main fitness function is calculated based on this formula. It’s fairly self-explanatory that the first aircraft will never face any delays but might cause one for the following aircrafts depending on the sequence. The overall optimization can be written as:
The GA structure proposed in this paper focuses mostly on a different way of fitness calculation procedure. Runway assignment is mostly carried out by analyzing the decoded chromosome. Each chromosome represents a NAC × NR matrix which fully assigns the NAC aircrafts to NR runways. The available aircrafts are assigned a number from 1 to NAC. If the ith row and jth column is equal to 1 then it means the aircraft number i is assigned to the runway j. A schematic of the string encoding and decoding process is shown in Fig. 2. Using a linear transformation would automatically satisfy basic constraints such as:
- •
Each aircraft can only be assigned to one runway
- •
Every aircraft will be assigned to a runway
Chromosome structure with encoding and decoding procedure.
In this approach we have divided the responsibility of finding optimum point in two steps. First, by using the Genetic Algorithms basic operators and decoding the respected chromosome, best aircrafts for each runway are determined. Second, the function sees each runway as separate sequences and finds the lowest reachable delay by randomly changing the order of aircrafts in each runway and saves the best calculated fitness and arrangement. Since Table 1 is asymmetric, changing the order of aircrafts will create different delays and therefore significantly increase convergence rate and reliability in finding the best answer. A graphical view and flowchart of the proposed method can be seen in Fig. 3 and 4. After decoding and assigning aircrafts to designated runways, as explained in Fig. 2, the loop will continue to change the arrangements until fitness for the respected schedule remains constant for 30 continuous iterations. The iteration threshold must be chosen wisely since a far too great number will only cause time consumption. The loop counter is selected based on the total possibilities of arranging aircrafts in each runway, regardless of their type. Based on trial and errors, a value of about one-fourth deemed suitable for the proposed method.

Dividing the process of fitness calculation.
Flowchart of the fitness calculation procedure.
However, in large case scenarios a higher threshold would result in less generation cycles to reach optimum point. The parameter acts in the form of pressure, where higher values will raise the probability of finding lower delay but also consume more computation time. It should also be pointed out that the objective in above flowchart is achieving lower fitness values, in contrast with the original GA optimization. Thus, the fitness function is multiplied by -1.
Genetic Algorithm in its original form suffers from poor convergence rate by not making optimum use of available information. Therefore, it is better to hybridize it with other local optimization methods24,25,26,27.
Hybrid Genetic Algorithm commonly uses new operators which are very powerful in local search and are often inspired by nature or other classical optimization methods. The parallel rearrangement procedure proposed in this paper is added as an efficient technique for a local search mechanism, applied to each individual during fitness calculation. This local search mechanism can be interpreted as Lamarckian individual learning.
For a better understanding of the effect of this function, consider a simple 5aircraft-2runway condition with the available data of Table 2. Imagine after decoding a gene from the population, aircrafts 1, 4 and 5 are assigned to runway 1 with priority of landing from first to third. Since the aircrafts are of different types, the rearrangement would create different fitness values.
| No. | Type | Name | ETA |
|
|---|---|---|---|---|
| Runway1 | Runway2 | |||
| 1 | H | DL130 | 12 | 11 |
| 2 | L | SW185 | 9 | 7 |
| 3 | L | UA1133 | 10 | 13 |
| 4 | S | SW200 | 6 | 7 |
| 5 | H | DL510 | 9 | 12 |
Available data for a simple 5aircraft-2runway example.
Table 3 shows the different alignments and their respected fitness values when the proposed function is activated. As it can be seen, in most cases, change in arrangement will reduce the fitness value which overall would increase GAs convergence rate. The inner loop of the flowchart in Fig. 4 shows the proposed local search, imbedded as a self-evolving program in fitness calculation. The proposed local search can be categorized as a specially designed genetic algorithm operator for the TMA optimization. Other applications of this approach and benefits of hybridization can also be seen in28,29.
| Arrangement (landing right to left) |
ETA | STA | Fitness |
|---|---|---|---|
| DL510-SW200-DL130 | 9-6-12 | 15-14-12 | 100 |
| SW200-DL510-DL130 | 6-9-12 | 15-13-12 | 97 |
| DL130-SW200-DL510 | 12-6-9 | 12-11-9 | 25 |
| SW200-DL130-DL510 | 6-12-9 | 14-12-9 | 64 |
| DL130-DL510-SW200 | 12-9-6 | 12-9-6 | 0 |
| DL510-DL130-SW200 | 9-12-6 | 13-12-6 | 16 |
Effect of rearrangement procedure proposed as local search for better fitness calculation.
4. Case Study
As mentioned before, in order to make a justifiable comparison, the landing data bank from3 is used. The study case consists of four scenarios, each varying in number of aircrafts and available runways to create more challenging circumstances. Some additional constraints have even been modeled in the 4th scenario to make the simulation condition even harder. For example, some airports prohibit the use of some runways for specific aircraft types, mostly due to lack of suitable length. In addition to the scenarios presented by Hansen3, a fifth simulation has also been proposed in this paper, which focuses on finding the suitable number of runways for a given landing bank. Details of each case study along with simulation results have been presented in the following section.
5. Simulation Results
The Genetic Algorithm coding has been done in MATLAB programing environment and the simulation was carried out using a typical desktop computer powered by Intel Core-i5 2500K processor and 8GB DDR3 Ram. Even though the GA program was designed in a way that the user has complete control over choosing selection methods, crossover methods, manual input of operator parameters and even pressure parameters for different selection choices, in order to judge based on equal terms, all scenarios were executed using the same conditions. An initial population size of 30, crossover method of single point with 80% rating, mutation rate of 1%, tournament selection method with pressure 3 and maximum iteration of 1000 has been selected for this matter. It should be mentioned that these values are chosen based on several trial and errors which have shown to be the best suited, given the study cases simulated in this paper. The common genetic operators, i.e. crossover and mutation have a probabilistic nature since each are activated if a generated random value is greater than the crossover rate or lower than mutation rate, respectively. The single point crossover and bitwise mutation operator have been chosen for the proposed method. The first operator swaps, i.e. exchanges information, the bits of two string chromosomes, beyond a random selected gene. The latter however, alters or modifies one or more bits in each chromosome to the opposite value (0 or 1). All scenarios have been executed 20 times with the exception of the last, where 10 simulation runs have been decided sufficient for analysis purposes. In each case the statistical results of the simulation are shown including Min, Max and average Iterations and fitness along with the number of successful executions.
5.1. Scenario 1
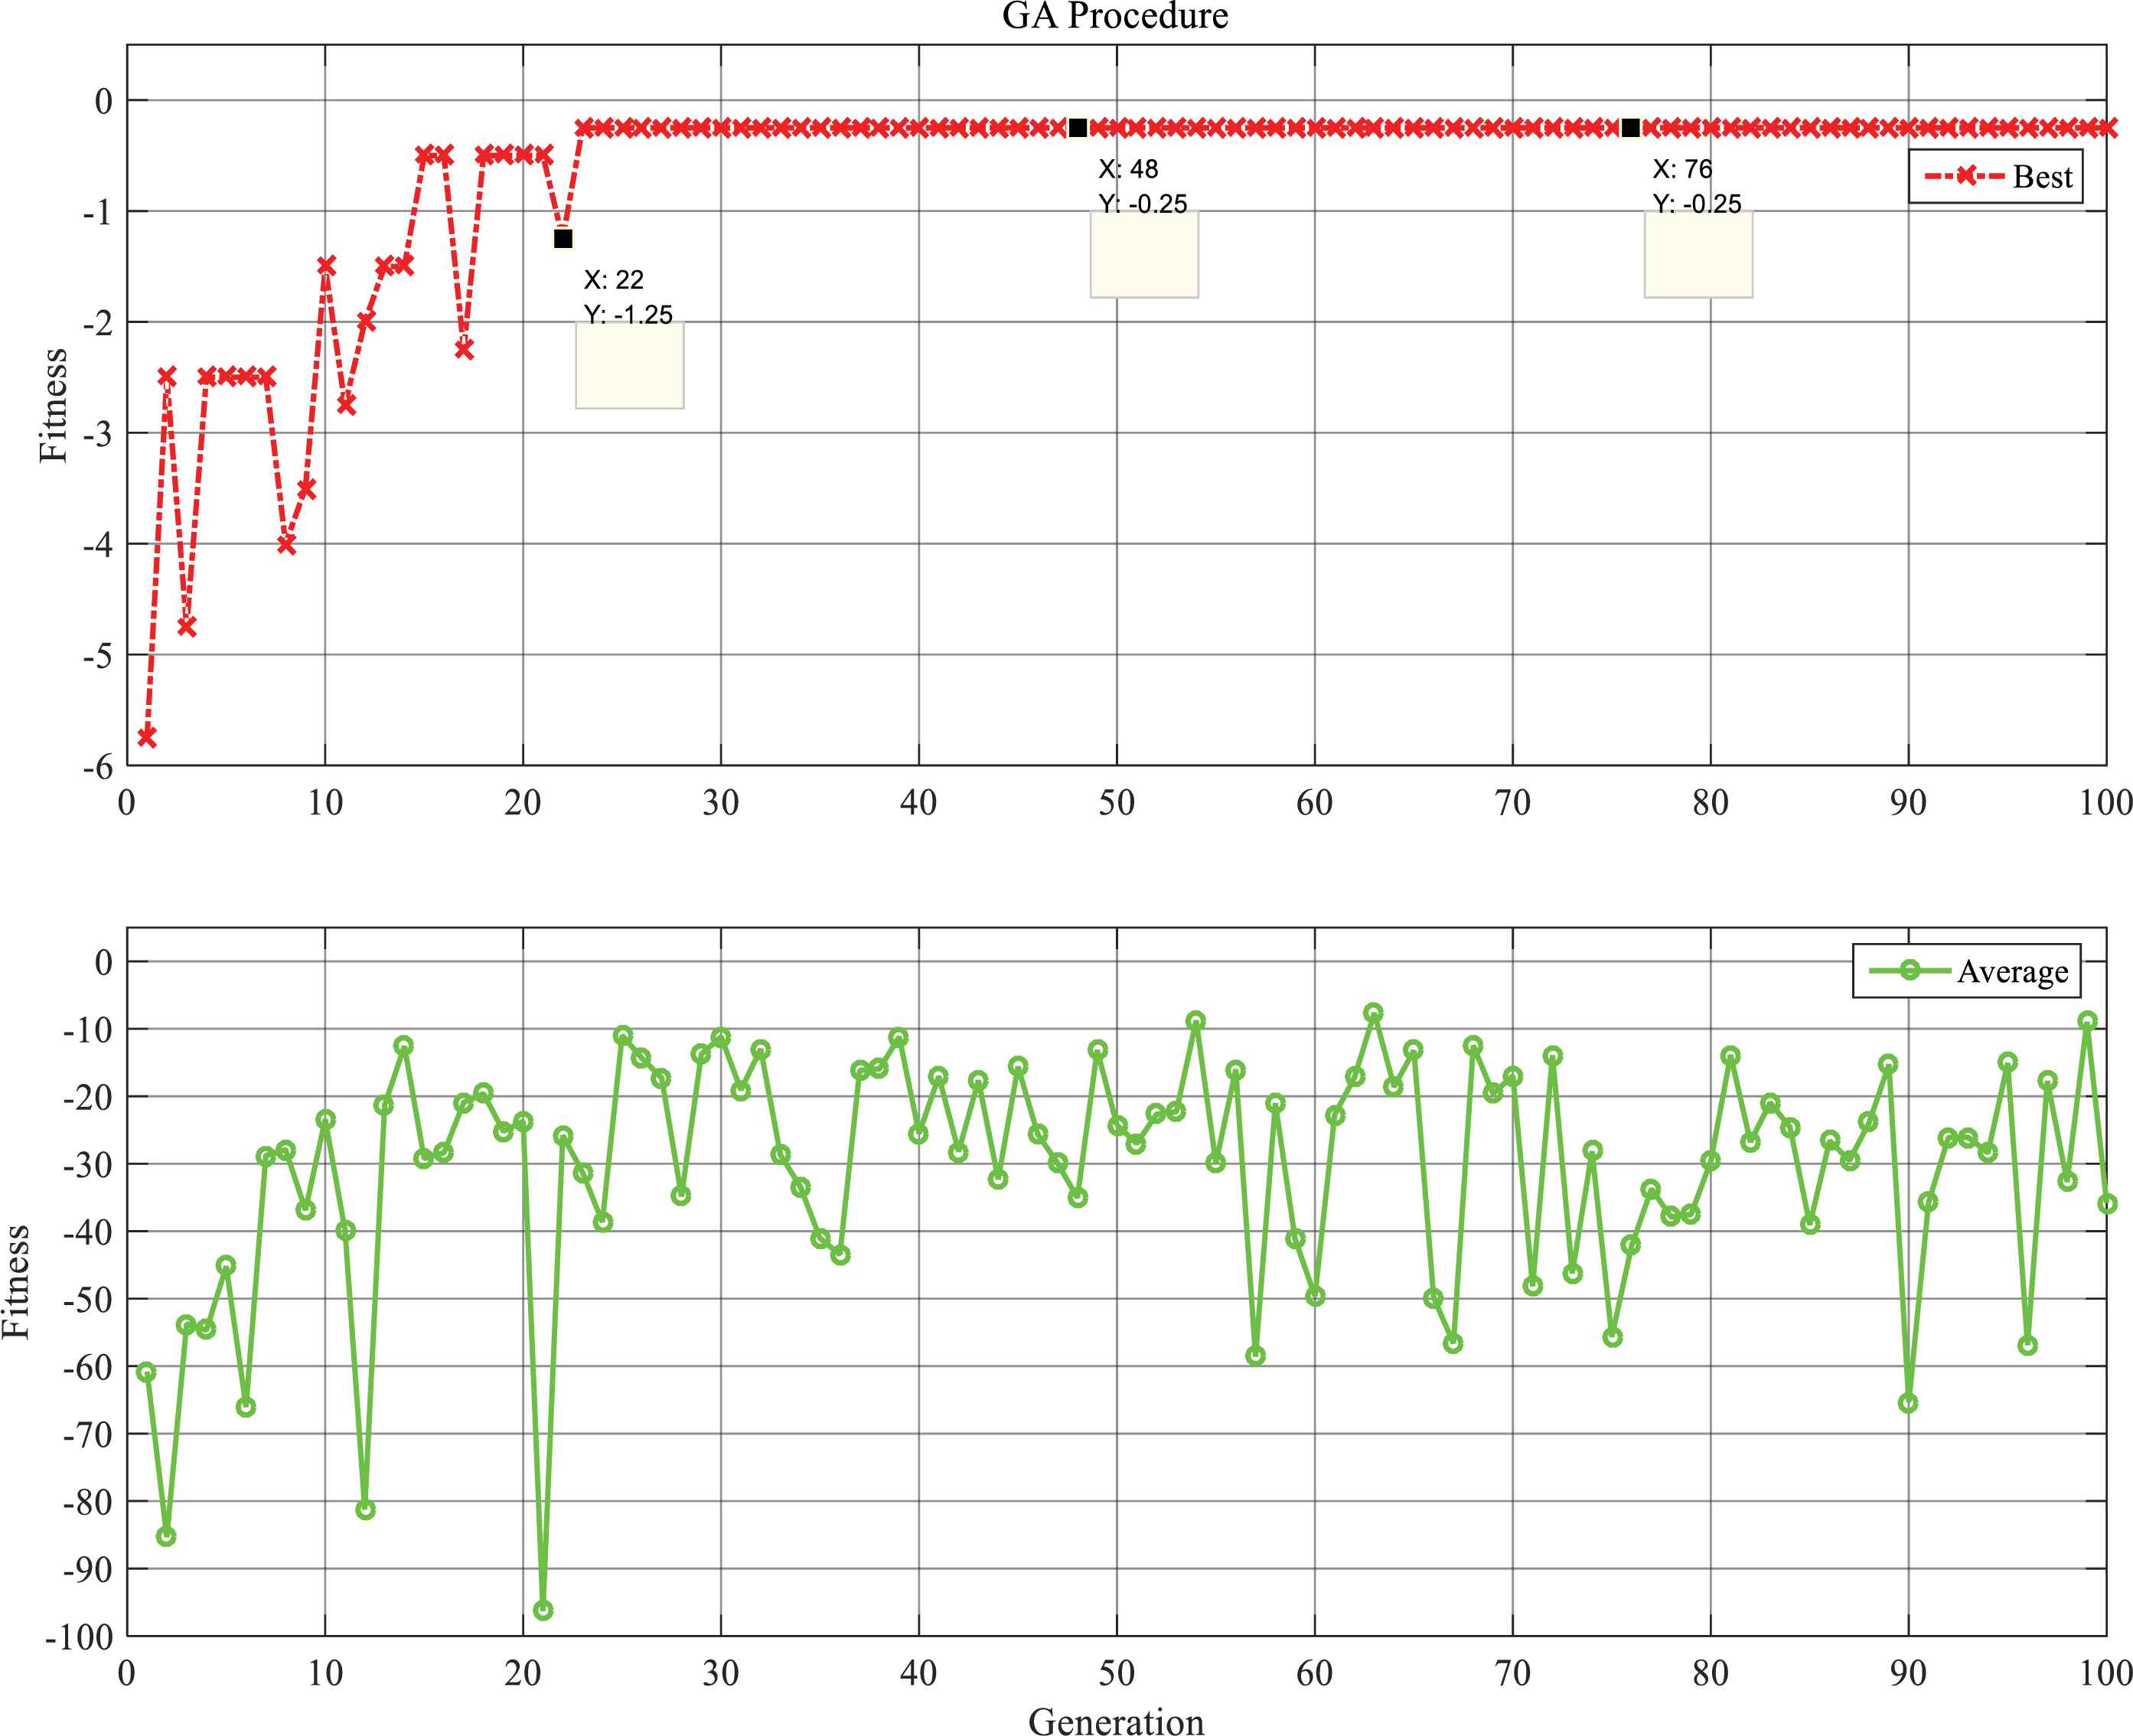
The first case study simulates the scheduling and arranging 12 aircrafts along 3 available runways with no other constraints. Therefore, the decoded chromosome will represent a 12 by 3 matrix. When two bits are used to code the runway number, the chromosome will take shape of a string of 24 bits. Table 4 shows the statistical results for scenario 1. All 20 executions using the proposed method have been successful, whilst the classic GA has never been able to achieve this fitness in the 1000 iteration limit. However, it should be noted that classic GA has been able to achieve near optimum values in very large iteration numbers. Fig. 5 shows the optimization procedure, showing the best and average of population, respectively.
GA optimization process for scenario 1 (proposed method).
| Results for 20 Simulations | Scenario 1 |
|
|---|---|---|
| Proposed Method | Classic GA | |
| Min Iteration | 6 | 1000 |
| Max Iteration | 134 | 1000 |
| Average Iteration | 33.25 | 1000 |
| Min Fitness | 0 | 44.5 |
| Max Fitness | 0 | 100.25 |
| Average Fitness | 0 | 58.085 |
| Variance Error | 0 | 255.11 |
| No. of Successful Run (Fitness=0) |
20 | 0 |
Statistical results of scenario 1 simulation.
Despite the elitism option being activated in all coding procedures, it can be seen in Fig. 5 that, due to the performance of the new operator, the proposed method does not guaranty the consideration of this function since the fitness values are constantly changing. Overall speaking, the proposed method has not shown any negative effect in this matter and even shows much faster convergence rates than elitism enabled classic GAs.
5.2. Scenario 2
The second scenario has the same runway conditions as before with a 25% increase in landing bank aircrafts. The increase will create a more challenging condition for the proposed algorithm with more close ETA options for a limited number of runways. The idea of increase in just number of aircrafts can also be used in a different matter. We can also define the minimum number of runways required to create the least delay possible. It may vary depending on the available ETAs but a margin would be determined. This is thoroughly studied in section 5.5 and compared with the classic GA. Since the number of runways has remained constant, in this case, the number of bits used for coding them has not changed as well, but with the increase in number of aircrafts the chromosome now has a length of 30 bits. Table 5 and Fig. 6 illustrate simulation results in this scenario.
GA Optimization process for scenario 2 (proposed method).
| Results for 20 Simulations | Scenario 2 |
|
|---|---|---|
| Proposed Method | Classic GA | |
| Min Iteration | 1000 | 1000 |
| Max Iteration | 1000 | 1000 |
| Average Iteration | 1000 | 1000 |
| Min Fitness | 0.25 | 101.75 |
| Max Fitness | 1.5 | 241.5 |
| Average Fitness | 0.7875 | 126.7 |
| Variance Error | 0.2452 | 1240.7 |
| No. of Successful Run (Fitness=0) |
0 | 0 |
Statistical results of scenario 2.
Even though the proposed method has failed to reach optimum fitness value of zero, the minimum value of 0.25 has been reach seven times out of the 20 simulations runs. Considering the strong results from previous scenario, it can be interpreted that this scenario might not have a solution where the delay is zero with the given number of runways. Other researchers whom have used the same case study have also failed to report a better schedule.
5.3. Scenario 3
The Dallas-Fort Worth Airport has been the test subject for many simulations by NASA30, since it has the most likelihood to a real ATC problem conditions with a large number of flights passing through every day. It has a 5 runway configuration which is the basis of this scenario. The Center-TRACON automation center has been the result of NASAs’ research center which has the difficult task of assisting in traffic management in real time. An increase of 66% in landing bank is simulated, compared to the first case, in order to create a more difficult circumstance. Similar to previous section, Table 6 and Fig. 7 show the statistical comparison and GA procedure for this scenario.
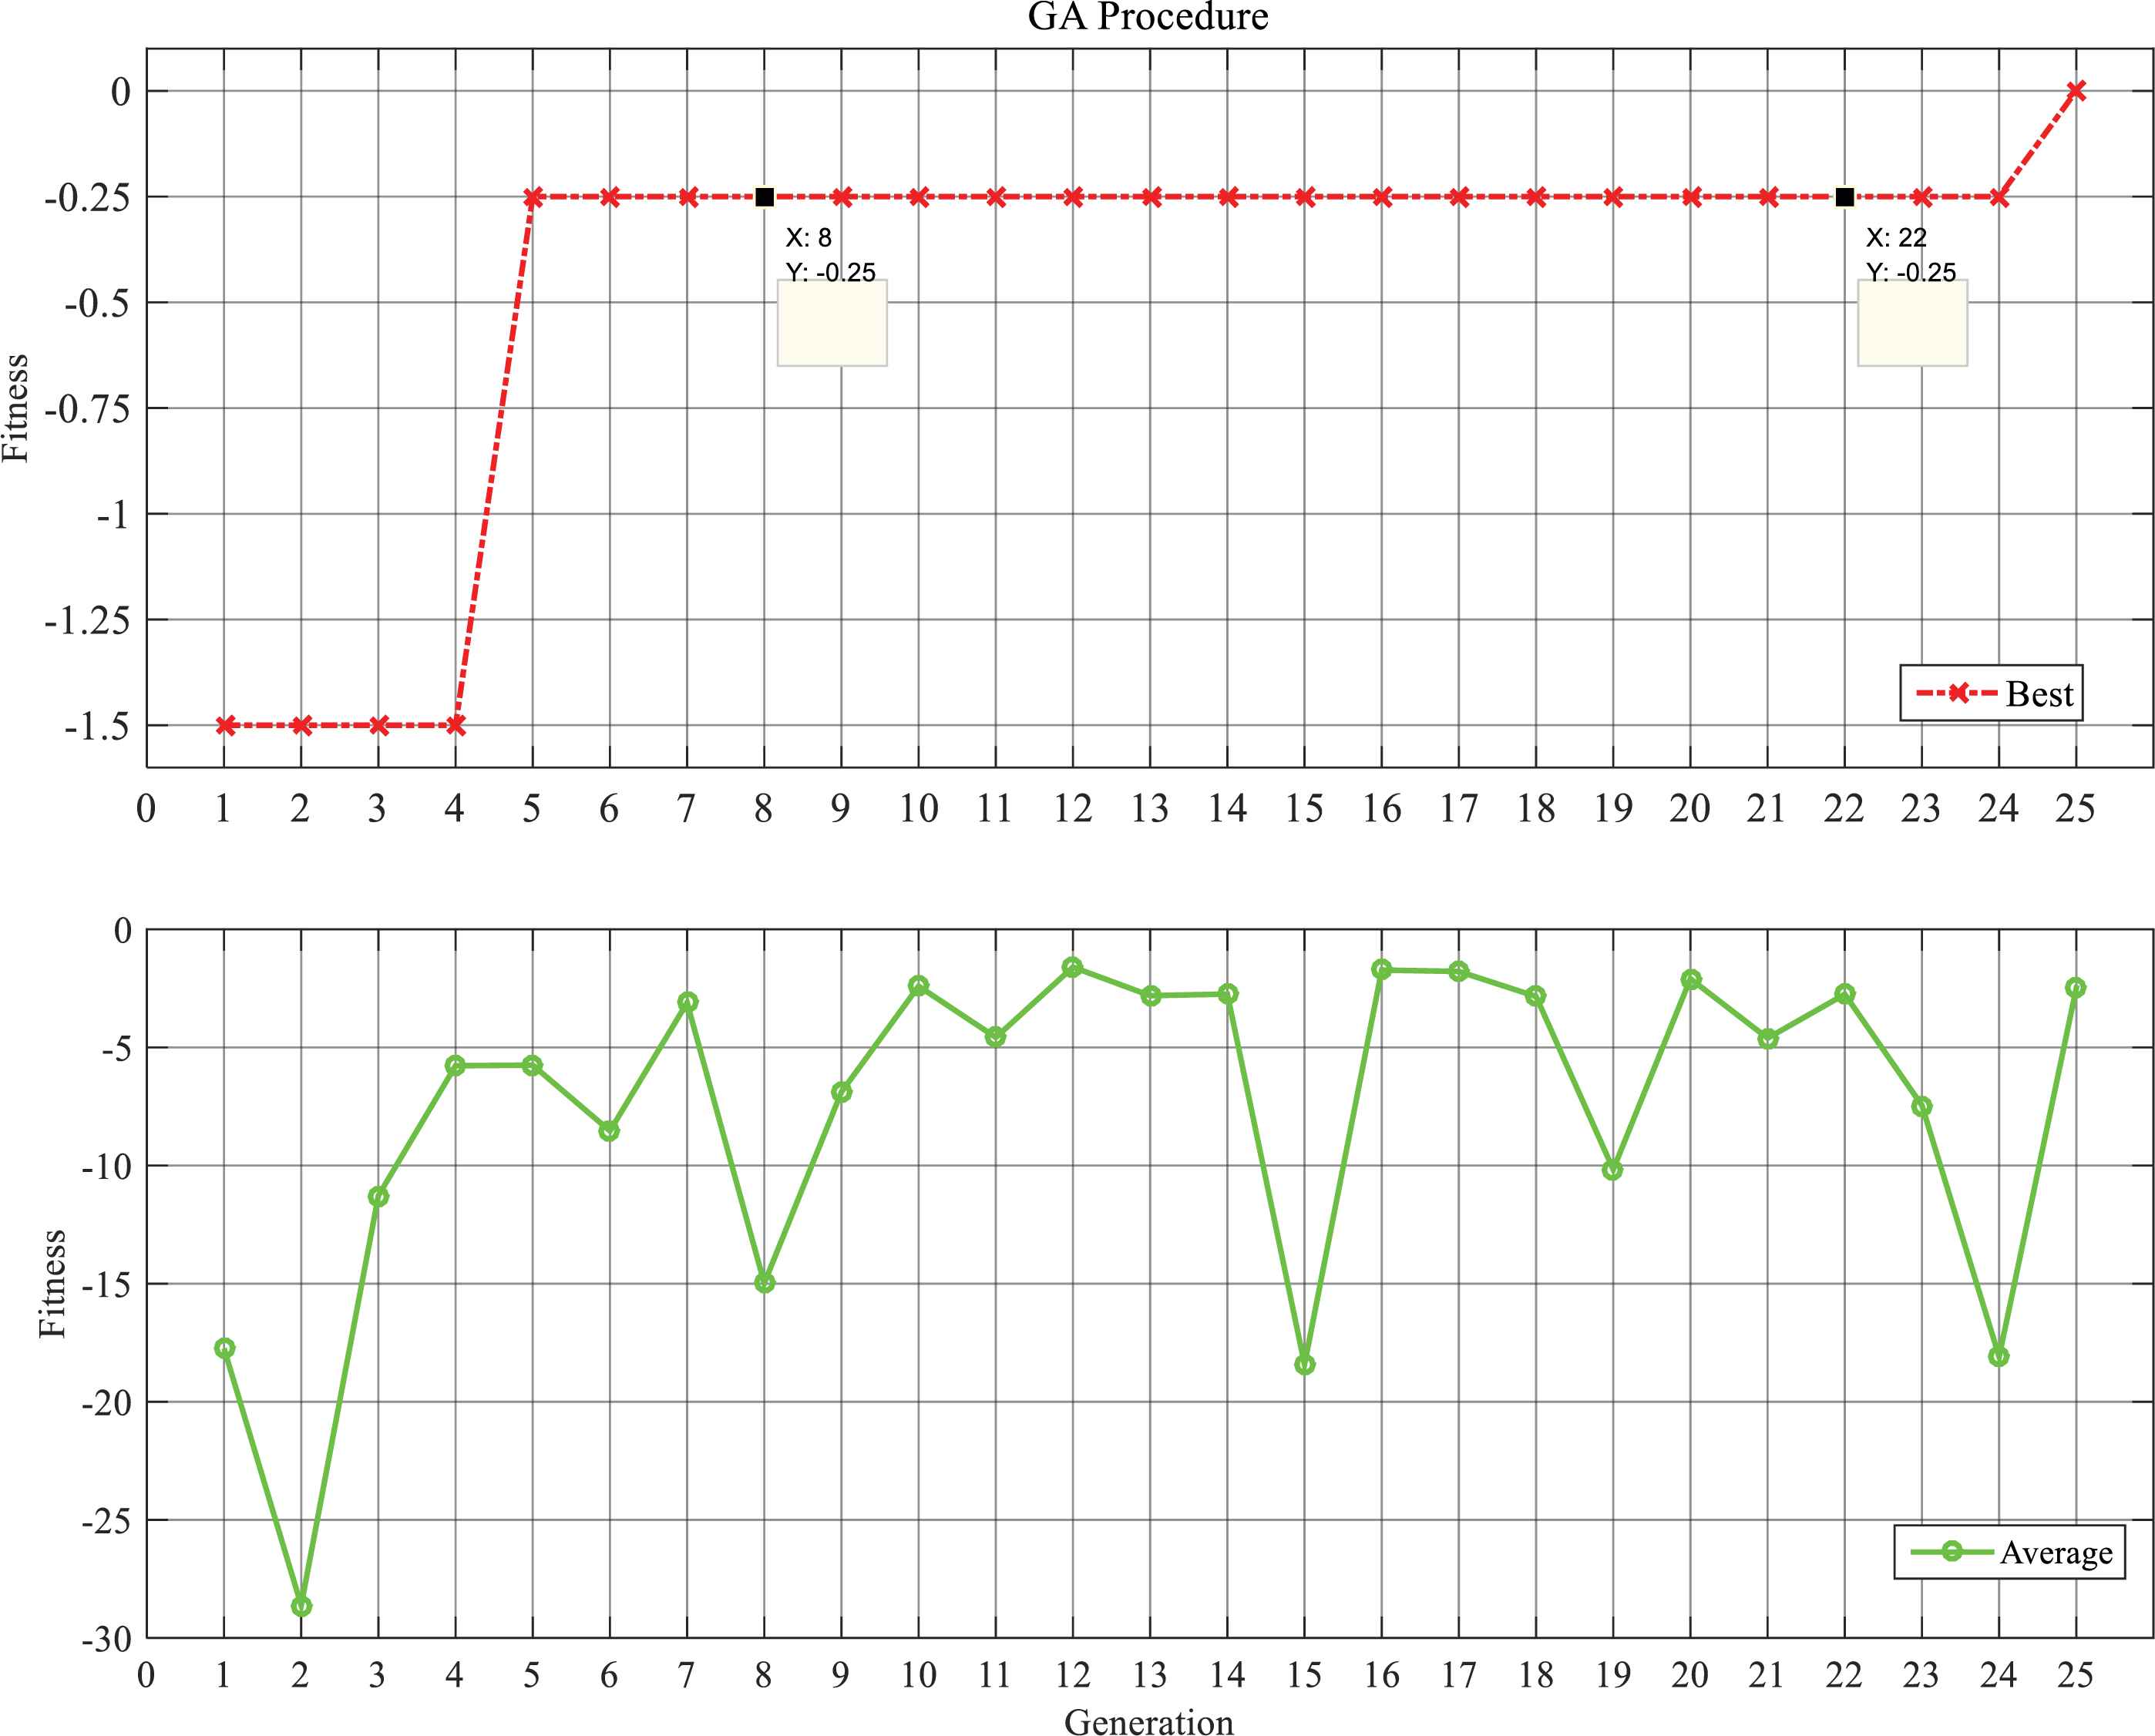
GA Optimization process for scenario 3 (proposed method).
| Results for 20 Simulations | Scenario 3 |
|
|---|---|---|
| Proposed Method | Classic GA | |
| Min Iteration | 25 | 1000 |
| Max Iteration | 1000 | 1000 |
| Average Iteration | 617.95 | 1000 |
| Min Fitness | 0 | 11.75 |
| Max Fitness | 1.25 | 133.25 |
| Average Fitness | 0.2625 | 32.13 |
| Variance Error | 0.1808 | 651.022 |
| No. of Successful Run (Fitness=0) |
12 | 0 |
Statistical results of scenario 3.
According to available data, the proposed algorithm has been able to repeatedly achieve values of zero delays (12 times) during the simulation period, whereas the classic GA has failed to do so. Furthermore, the average fitness and variance error are considerably lower compared to the classic GA. Having the most similarities to a real ATC problem has intrigued the authors to use this case study for a sensitivity analysis and airport future planning, which will be discussed in scenario 5.6.
5.4. Scenario 4
Situation may rise when some extra constraints are required to be added to the fitness function. Heavy cargo planes, for instance, might be restricted to land on runway No. 3 due to the length of the appointed runway. However, to make this a more formidable case, we have increased the number of aircrafts and runways to 20 and 4, respectively and to this end, the required data is taken from scenario 3.
Table 7 and Fig. 8 provide the simulation results as regards to this case. The results show a greater margin of error compared to the previous scenarios, but that being said, they are still significantly lower than the results produced by the classic GA. The output schedule for all four scenarios can be seen in Tables 8–11.
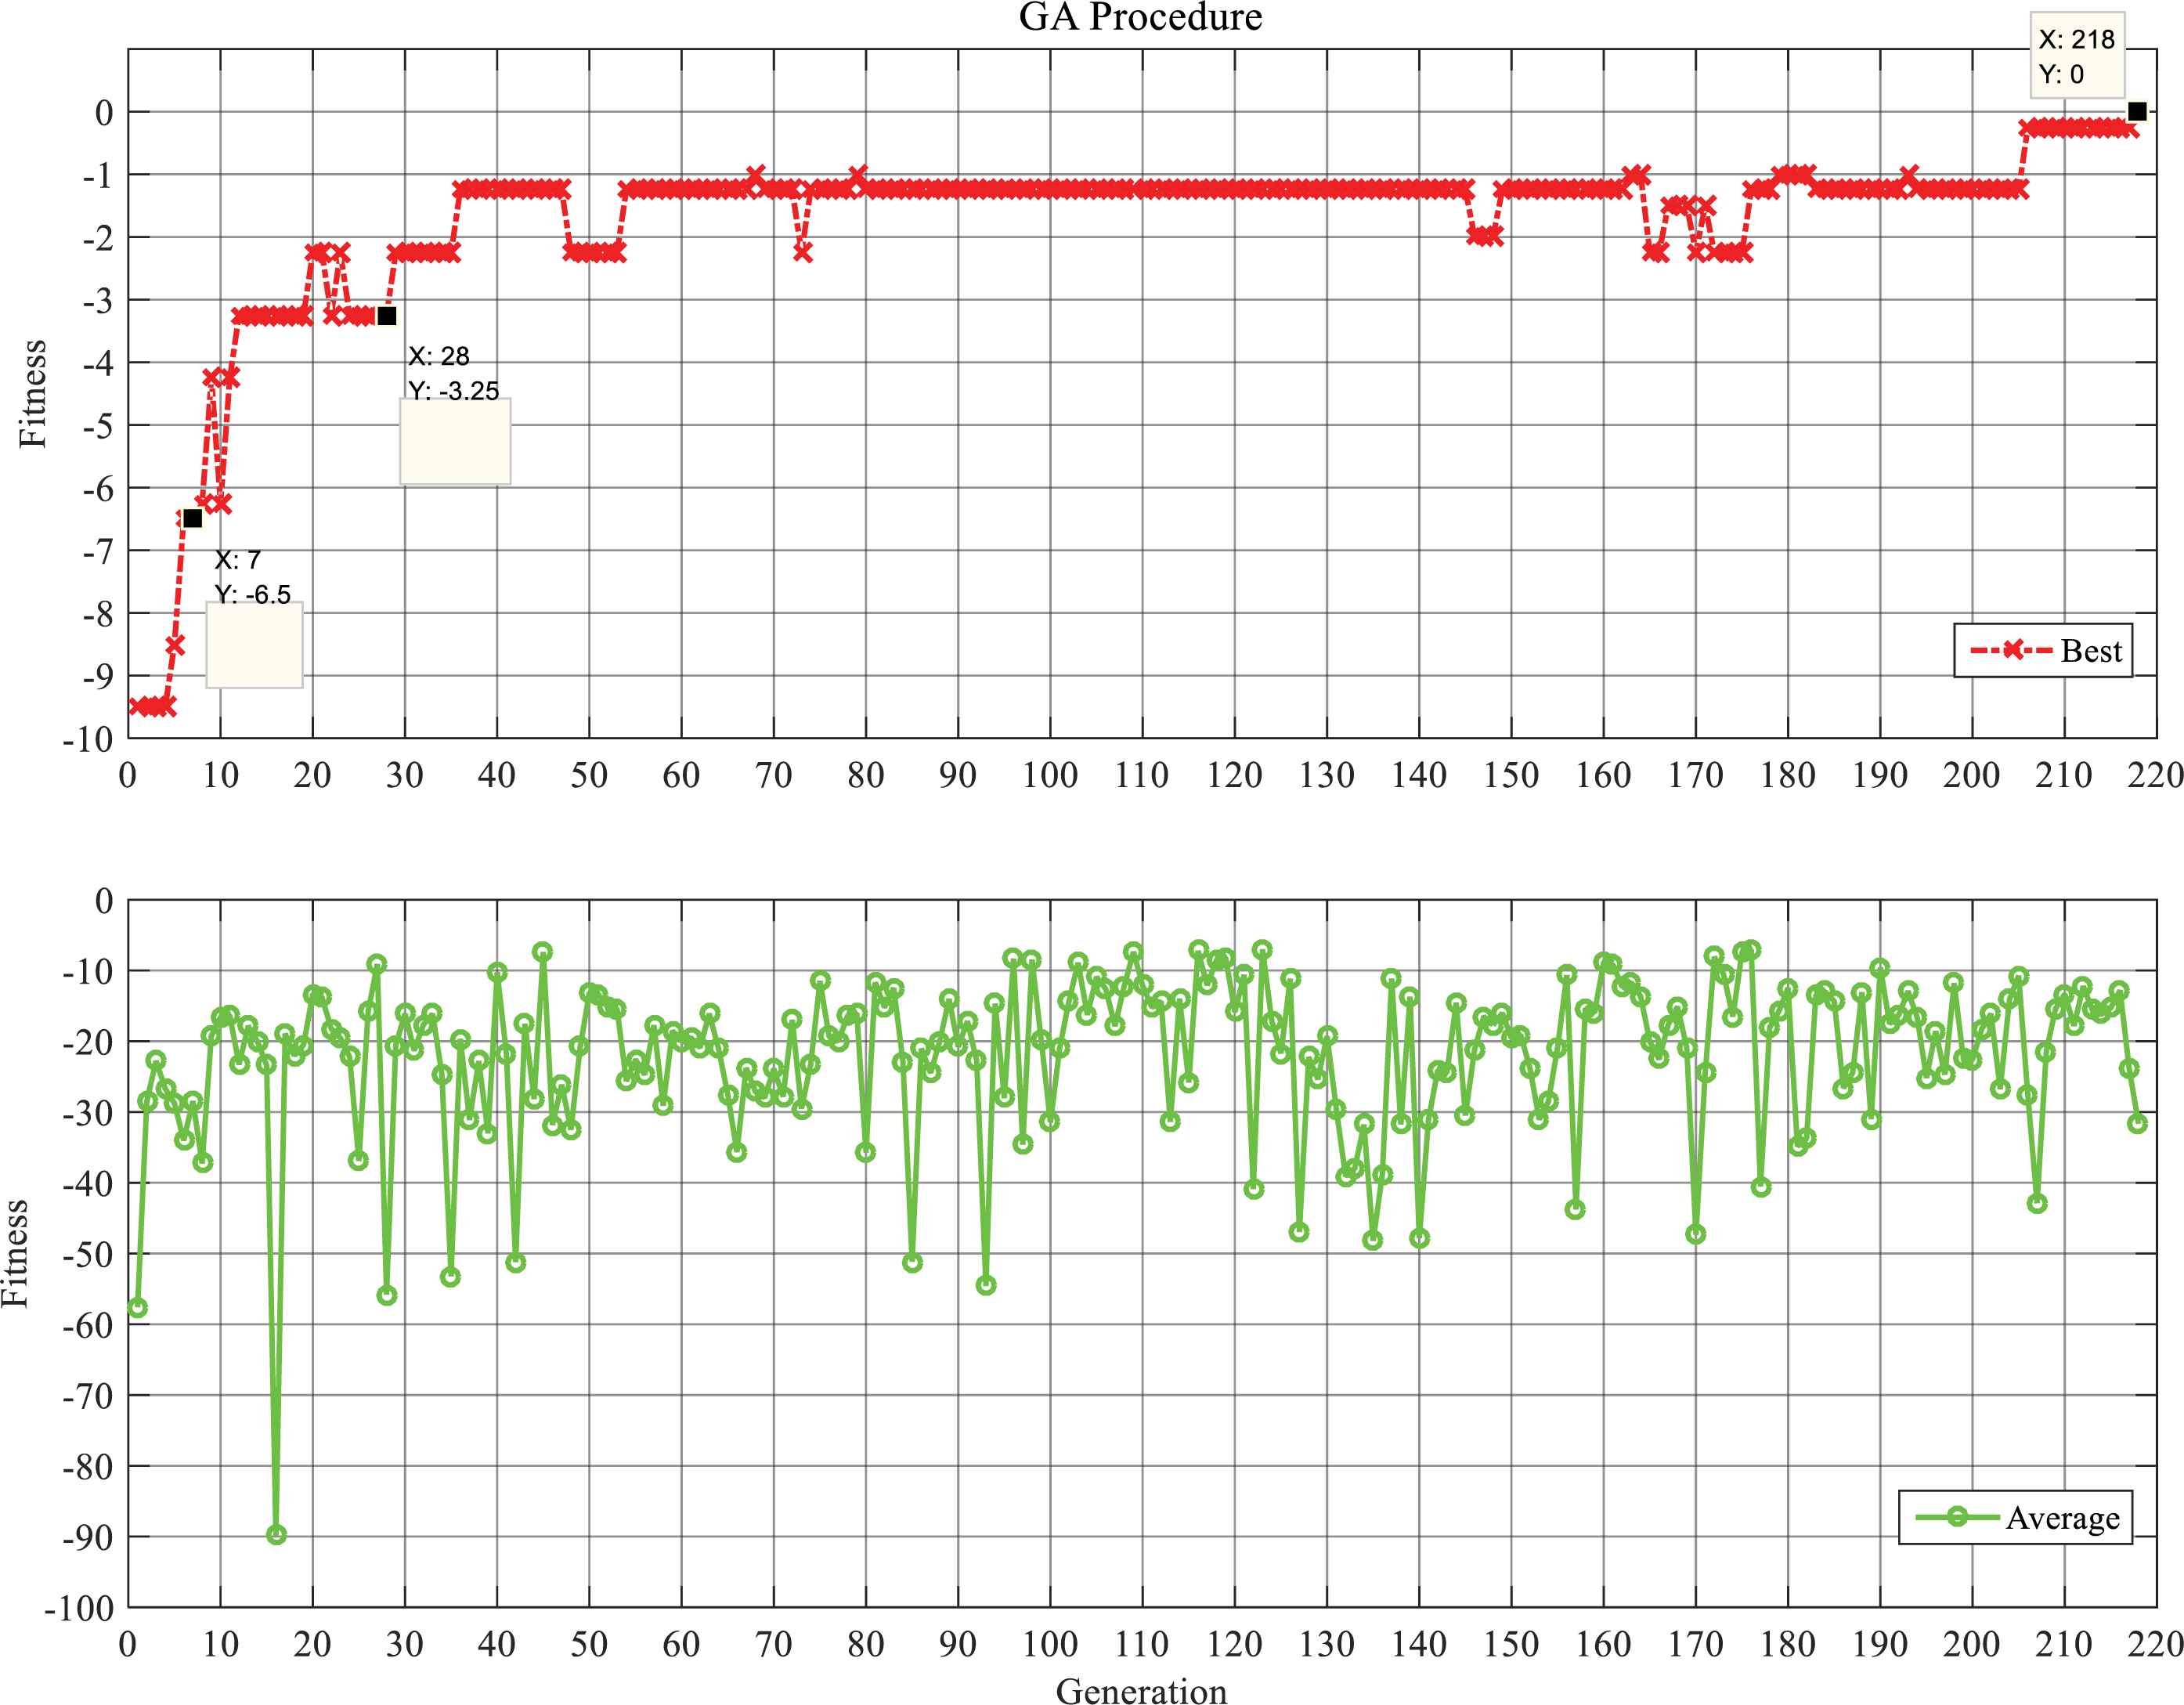
GA Optimization process for scenario 4 (proposed method).
| Results for 20 Simulations | Scenario 4 |
|
|---|---|---|
| Proposed Method | Classic GA | |
| Min Iteration | 219 | 1000 |
| Max Iteration | 1000 | 1000 |
| Average Iteration | 842 | 1000 |
| Min Fitness | 0 | 86.25 |
| Max Fitness | 5 | 224.5 |
| Average Fitness | 2.3 | 147.83 |
| Variance Error | 2.9842 | 1597.7 |
| No. of Successful Run (Fitness=0) |
5 | 0 |
Statistical results of scenario 4.
| Runway No.1 | Runway No.2 | Runway No.3 | |||||||||
|---|---|---|---|---|---|---|---|---|---|---|---|
| Name | STA | ETA | Delay | Name | STA | ETA | Delay | Name | STA | ETA | Delay |
| SW200 | 6 | 6 | 0 | NW2123 | 6 | 6 | 0 | UA410 | 4 | 4 | 0 |
| DL510 | 9 | 9 | 0 | DL3319 | 8 | 8 | 0 | SW185 | 6 | 6 | 0 |
| DL130 | 12 | 12 | 0 | UA123 | 9 | 9 | 0 | DL1920 | 8 | 8 | 0 |
| AA335 | 17 | 17 | 0 | UA1133 | 15 | 15 | 0 | ||||
| AA205 | 19 | 19 | 0 | ||||||||
| Total Schedule Delay: 0.00 | Fitness Value: 0.00 | ||||||||||
Landing schedule for scenario 1.
| Runway No.1 | Runway No.2 | Runway No.3 | |||||||||
|---|---|---|---|---|---|---|---|---|---|---|---|
| Name | STA | ETA | Delay | Name | STA | ETA | Delay | Name | STA | ETA | Delay |
| NW410 | 6 | 6 | 0 | UA410 | 5 | 5 | 0 | NW2123 | 5 | 5 | 0 |
| DL200 | 7.5 | 7 | 0.5 | DL1920 | 7 | 7 | 0 | SW200 | 8 | 8 | 0 |
| SW185 | 9 | 9 | 0 | AA1225 | 8 | 8 | 0 | DL3319 | 9 | 9 | 0 |
| DL130 | 12 | 12 | 0 | UA123 | 9 | 9 | 0 | DL510 | 15 | 15 | 0 |
| AA335 | 15 | 15 | 0 | UA1133 | 13 | 13 | 0 | AA205 | 19 | 19 | 0 |
| Total Schedule Delay: 0.50 | Fitness Value: 0.25 | ||||||||||
Landing schedule for scenario 2.
| Runway No.1 | Runway No.2 | Runway No.3 | |||||||||
| Name | STA | ETA | Delay | Name | STA | ETA | Delay | Name | STA | ETA | Delay |
| NW410 | 6 | 6 | 0 | DL200 | 8 | 8 | 0 | UA410 | 4 | 4 | 0 |
| DL3319 | 7 | 7 | 0 | AA205 | 17 | 17 | 0 | SW185 | 6 | 6 | 0 |
| AA1410 | 9 | 9 | 0 | UA123 | 8 | 8 | 0 | ||||
| AA335 | 15 | 15 | 0 | UA555 | 9 | 9 | 0 | ||||
| UA1133 | 15 | 15 | 0 | ||||||||
| Runway No.4 | Runway No.5 | ||||||||||
| Name | STA | ETA | Delay | Name | STA | ETA | Delay | ||||
| NW2123 | 6 | 6 | 0 | AA127 | 7 | 7 | 0 | ||||
| SW200 | 7 | 7 | 0 | DL1920 | 8 | 8 | 0 | ||||
| SW250 | 9 | 9 | 0 | AA1225 | 9 | 9 | 0 | ||||
| DL130 | 10 | 10 | 0 | SW442 | 11 | 11 | 0 | ||||
| DL510 | 15 | 15 | 0 | ||||||||
| Total Schedule Delay: 0.00 | Fitness Value: 0.00 | ||||||||||
Landing schedule for scenario 3.
| Runway No.1 | Runway No.2 | ||||||
| Name | STA | ETA | Delay | Name | STA | ETA | Delay |
| DL130 | 6 | 6 | 0 | UA410 | 5 | 5 | 0 |
| DL3319 | 7 | 7 | 0 | NW2123 | 6 | 6 | 0 |
| SW185 | 9 | 9 | 0 | DL1920 | 7 | 7 | 0 |
| DL130 | 12 | 12 | 0 | UA555 | 8 | 8 | 0 |
| AA205 | 15 | 15 | 0 | UA123 | 9 | 9 | 0 |
| Runway No.3 | Runway No.4 | ||||||
| Name | STA | ETA | Delay | Name | STA | ETA | Delay |
| AA1410 | 7 | 7 | 0 | AA127 | 6 | 6 | 0 |
| DL200 | 9 | 9 | 0 | SW200 | 7 | 7 | 0 |
| SW442 | 10 | 10 | 0 | AA1225 | 8 | 8 | 0 |
| SW250 | 11 | 11 | 0 | DL510 | 15 | 15 | 0 |
| UA1133 | 15 | 15 | 0 | ||||
| AA335 | 19 | 19 | 0 | ||||
| Total Schedule Delay: 0.00 | Fitness Value: 0.00 | ||||||
Landing schedule for scenario 4.
5.5. Scenario 5
The fifth scenario consists of a large number of aircrafts which are chosen for finding the right number of runways for an airport. As mentioned before, it might not be considered as certainty but a given margin could be set for selecting the right number of runways for the airport. For example, it could be predicted that a specific airport is going to face a high number of flight passages due to the rise in flight demands in a region and is required to be prepared in the near future. This scenario simulates and compares the fitness responses of 40 aircrafts via the proposed method and the classic GA. Fig. 9 illustrates the average fitness calculation of 10 executions.
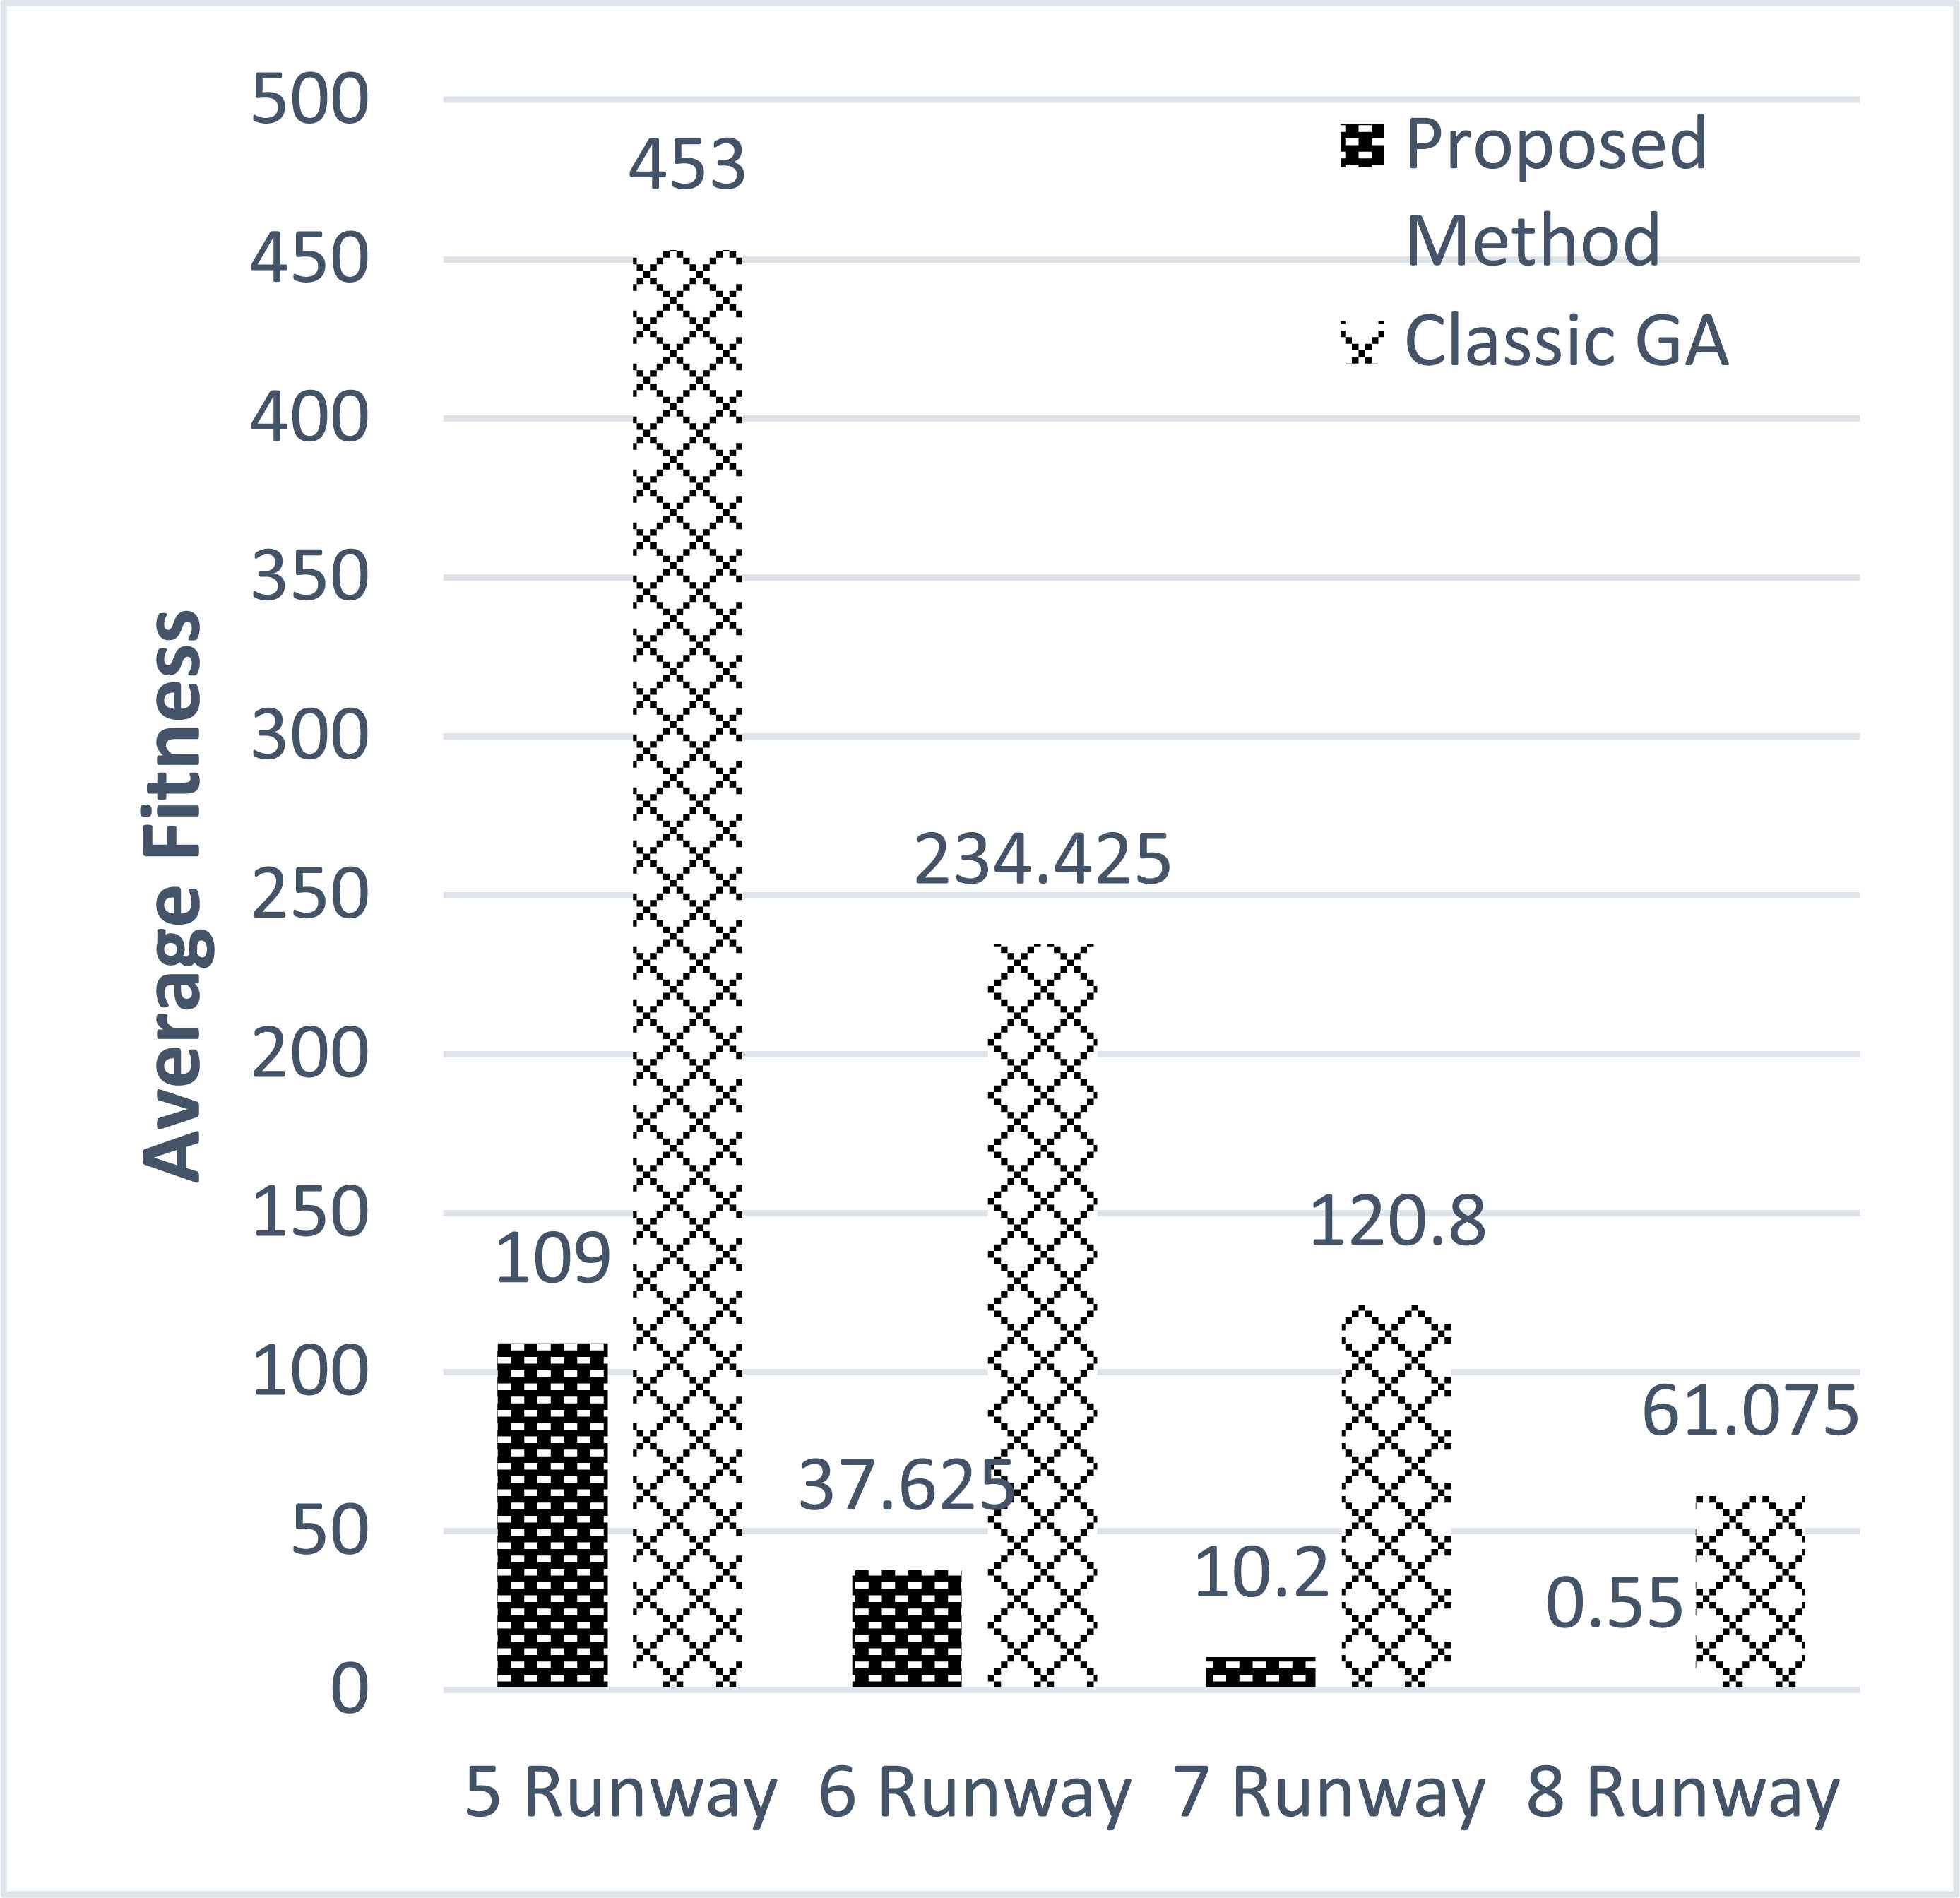
Average fitness comparison to predict number of required runways for future planning in scenario 5 (lower is better).
What stands out from the results is that both methods show an overall downward trend by increasing the number of runways, but the proposed method has achieved significantly lower fitness values compared to the original GA formulation. The addition of each runway has resulted in about 66% reduction in simulated fitness for the proposed method, whereas the classic GA only has shown a decline of just under half. Considering the results, a cautious perspective would choose 8 runways but given the fact that the results are dependable on the available data, a small window of delay is expected, therefore 7 runways should be sufficient for future planning of the airport. However, the classic GA would imply that 9 or 10 runways are required, given the decline rate in Fig. 9.
5.6. Data Analysis
The presented data in previous sections show the effectiveness of the proposed operator in the given problem. To further understand the operator parameters and assess its benefits, a parameter sensitivity analysis and convergence comparison has been carried out which are discussed in detail as what follows.
5.6.1. Sensitivity Analysis
The inner loop of Fig. 4 plays an important role finding the best fitness for each chromosome available. Therefore, it is necessary to witness the influences of changing this criterion. Table 12 shows a 10 simulation run using the data provided by scenario 3, since this case holds the most likelihood to a real world case. The table compares the fitness value, total delay and number of iterations when the variable is changed from 20 to 50 and 100.
| Simulation No. | Parameter Pressure | Iteration | Fitness | Delay |
|---|---|---|---|---|
| 1 | 20 | 748 | 0 | 0 |
| 2 | 1000 | 0.25 | 0.25 | |
| 3 | 1000 | 1 | 1 | |
| 4 | 50 | 424 | 0 | 0 |
| 5 | 1000 | 0.5 | 1 | |
| 6 | 552 | 0 | 0 | |
| 7 | 100 | 271 | 0 | 0 |
| 8 | 268 | 0 | 0 | |
| 9 | 391 | 0 | 0 | |
| 10 | 305 | 0 | 0 | |
Sensitivity analysis of the proposed operator
According to available data, the climb in this parameter has also raised the probability of achieving the lowest delay possible. All 4 executions of the last assumption (last four columns), have reached optimum point under 400 iterations, whereas the other two cases, despite reaching sufficiently low enough delays, have been less successful. That being said, this increase will undoubtly demand more computation time and power, while thoroughly searching for the best possibility for each chromosome.
Based on the matter which has been discussed before, it is widely known that classic GA suffers from the inability to make efficient use of its resources and therefore can sometimes have poor convergence rates. For this purpose, the second scenario has been chosen to perform a comparison analysis. Fig. 10 illustrates the convergence rate of the proposed method and the classic GA algorithm. It can be seen that the fitness values regarding the proposed approach is noticeably lower.
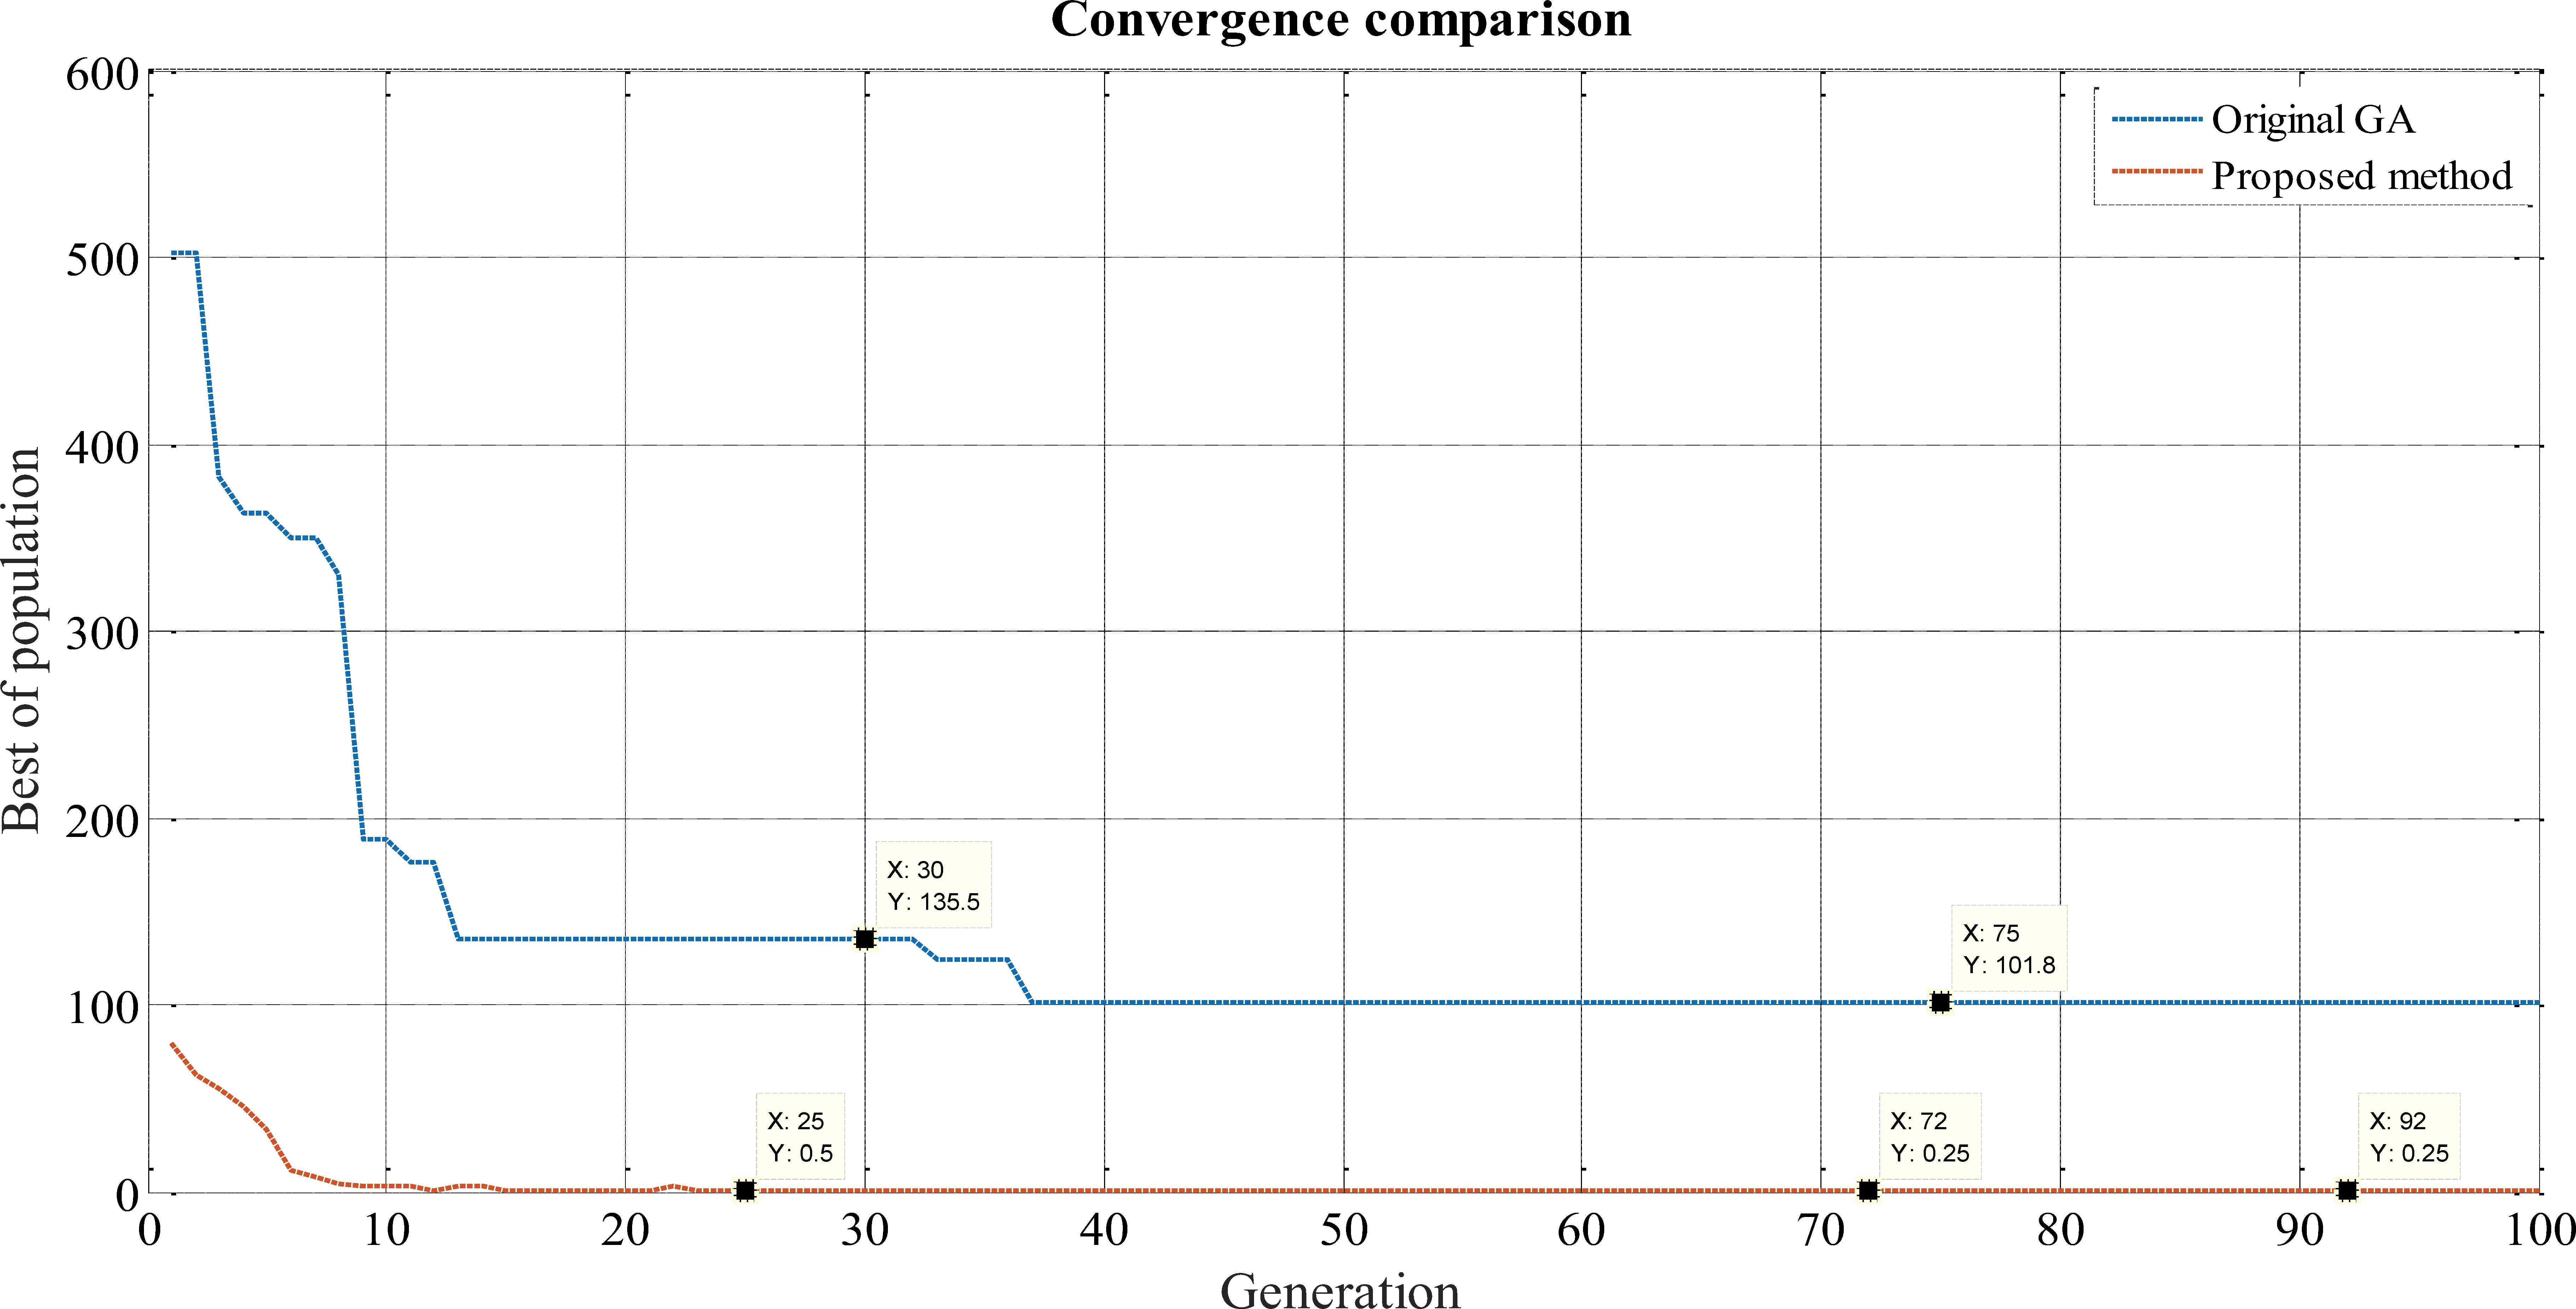
Convergence comparison between the original structure (classic GA) and proposed method in scenario 2 (lower is better).
Furthermore, a comparison of results among other researchers whom have also used the same data bank can be seen in Table 13. Considering the number of different methods introduced in each source, the best and high ranked algorithms have been chosen in order to make a clearer observation.
| Best Fitness Value |
|||||
|---|---|---|---|---|---|
| Case | NAC | NR | Method 4 from [3] | GA4 from [20] | Proposed Algorithm |
| Scenario 1 | 12 | 3 | 3.5 | 1 | 0 |
| Scenario 2 | 15 | 3 | 9 | 5.5 | 0.25 |
| Scenario 3 | 20 | 5 | 12 | 7.65 | 0 |
| Scenario 4 | 20 | 4 | - | - | 0 |
Comparison between proposed and previous methods.
6. Conclusion
A new hybrid Genetic Algorithm approach to the air traffic control optimization for scheduling and assigning landing sequences is introduced in this paper. The proposed method has shown to significantly improve the fitness value and convergence rate by adding a rearranging configuration method to fitness calculation. Dividing the responsibility of fitness calculation or in other words, delay calculation, depending on the assigned sequence of aircrafts, can insure a wide search range in short amount of time. The number of generations in which best fitness is calculated and statistical results are also proof of this claim. A sensitivity analysis and convergence comparison has also been carried out to further evaluate the influences of the proposed method. In both cases, simulated results have shown significant improvement compared to the classic GA and previous predecessors. The proposed parallel local search can be categorized as a specially designed genetic algorithm operator for the TMA optimization problem. That being said, the simulations performed in this paper only considers the landing section of each flight plan. Also, due to the lack of reliable data, required time for the landing and departing procedure itself has been neglected. For future research, authors propose the consideration of runway structures (layouts) as well. In other words, the addition of runway interconnections can alter the time required for different types of planes, since aircrafts use different lengths of each runway to land. In addition, the performance of the proposed method is yet to be determined in the case of simulating a study case which includes landing and departing time tables simultaneously.
References
Cite this article
TY  - JOUR
AU  - Adel Soheili
AU  - Habib Rajabi Mashhadi
PY  - 2016
DA  - 2016/06/01
TI  - Improvement of the Aircraft Traffic Management Advisor Optimization Using a Hybrid Genetic Algorithm
JO  - International Journal of Computational Intelligence Systems
SP  - 559
EP  - 571
VL  - 9
IS  - 3
SN  - 1875-6883
UR  - https://doi.org/10.1080/18756891.2016.1175818
DO  - 10.1080/18756891.2016.1175818
ID  - Soheili2016
ER  -