
Maximizing comfort in Assembly Lines with temporal, spatial and ergonomic attributes
- DOI
- 10.1080/18756891.2016.1204125How to use a DOI?
- Keywords
- GRASP; Assembly line balancing; Ergonomic risk; Linear Area
- Abstract
We aim at maximizing the comfort of operators in mixed-model assembly lines. To achieve this goal, we evaluate two assembly line balancing models: the first that minimizes the maximum ergonomic risk and the second one that minimizes the average absolute deviations of ergonomic risk. Through a case study we compare the results of the two models by two different resolution procedures: the Mixed Integer Linear Programming (MILP) and Greedy Randomized Adaptive Search Procedures (GRASP). Although linear programming offers best solution, the results given by GRASPs are competitive.
- Copyright
- © 2016. the authors. Co-published by Atlantis Press and Taylor & Francis
- Open Access
- This is an open access article under the CC BY-NC license (http://creativecommons.org/licences/by-nc/4.0/).
1. Introduction
Today, it is very common to think that many of the works that we perform are moderate and harmless in regard with our energy consumption. Nevertheless, the vast majority of works involve a high physical consumption by the operators or workers. This physical consumption may entail risks for the workers’ health.
For this reason, the design of workplaces must be done considering all the risk factors that can mean harmful to workers.
Specifically, in the automotive sector, the design of assembly line workstations must consider social aspects, in order to meet the general principle of adaptation of work for the person; the space required by the worker to perform their workload appropriately and the ergonomic risk associated to this load are some of these issues. Given the above, workplaces must be adapted to the workers’ physical conditions, movements and tools or machines; thereby workers will be able to carry out their assigned workload naturally and without harming their health.
This importance of considering social aspects is present in the scientist literature from the last decades. The works by Ref.1, Ref.2 and Ref.3, among others, are a sample of this increased significance. All of them focus on the Assembly Line Balancing Problem (ALBP)4, more specifically, on the Simple Assembly Balancing Problem (SALBP), which was classified by Ref.5.
First, Ref.1 extended the SALPB family through the incorporation of the spatial attribute, leading to the Time and Space Assembly Line Problems (TSALBP). Afterwards, in Ref.2, the ergonomic risk was also introduced into the balancing problems. The authors incorporated the ergonomic risk into the SALBP-1 models by means of a constraint of maximum ergonomic risk and one objective function.
On the other hand, few years later, the ergonomic risk was introduced into the TSALBP models by two ways: first, as a new constraint that limits maximum and minimum ergonomic risks3,6; secondly, as a new objective function that aims at minimizing of the maximum ergonomic risk associated with the workload of workstations7,8.
Although these last studies are an extension of TSALBP models, the authors did not consider the linear area of workstations into the computational experience; they only evaluated the effect of limiting the ergonomic risk. However, in a latter paper, Ref.9 analyzed simultaneously the impact of both attributes into the balancing problem by means of a computational experience linked with a Nissan’s engine plant in Barcelona (NMISA: Nissan Motor Ibérica - BCN). Specifically, the authors evaluated the impact of both, the available space, or linear area assigned to each workstation, and the number of workstations of the line over the maximum ergonomic risk of workstations.
Finally, Ref.10 and Ref.11, assess the impact of temporal, spatial and ergonomic risk attributes on the line configurations through a weighted model with the rectangular function.
In line with the previous works7,8,9,10,11, this research seeks to maximize the comfort of an assembly line, considering the area and the time limitations. This assembly line comfort supposes: (1) minimizing, as far as possible, the maximum ergonomic risk of the line; and (2) minimizing the range or the difference between the worst and the best workstation in regard with their ergonomic risk values.
To this purpose we use two different mathematical models. First, we use the model proposed by Ref.7 that minimizes the maximum ergonomic risk of the line. This model is evaluated, in this paper and unlike Ref.7, considering the impact of the available area limitation, such as was made in Ref.12. Secondly, from the weighted model, proposed by Ref.10, we define a specific mathematical model whose only objective is minimizing the average absolute deviation around the mean ergonomic risk of the line.
Moreover, considering the variety of solution approaches for the ALBPs13, we also compare different solution procedures. Specifically, we compare the solutions obtained in Ref.12. (solutions given by the Mixed Integer Linear Programming (MILP) and a Greedy Randomized Adaptive Search Procedure (GRASP) for the model that aims at minimizing the maximum ergonomic risk of the line12), with those obtained by the MILP and the GRASP proposed in this paper to solve the model whose objective is minimize the ergonomic risk range of the line.
Accordingly, the present document is structured as follows: section 2 introduces the Ergonomics within the framework of assembly lines. Section 3 reminds the mathematical model that minimizes the maximum ergonomic risk of the line12 and presents a specific variant, of the optimization model proposed in Ref.10, whose objective is to minimize the discrepancy between real and ideal values for the ergonomic risk. Section 4 contains the GRASPs used for the problem. Section 5 shows the computational experience based in a real engine plant and the results given by the mathematical models (MILP) and the GRASP algorithms. In this section, the MILP and GRASP algorithms are compared. Finally, in section 6, the conclusions of this research are.
2. Incorporating Ergonomics into the TSALBP
To balance ergonomically the line, we must consider all elements that may give rise to ergonomic risk for the operator. These elements are: the dimensions of the operator, the physical and mental conditions of operator, the required movements, the necessary tools, the required force, the processing time of task, the vibrations, the temperature, etc.
Therefore, it is necessary to analyze the tasks and their interaction with the elements of the line, in order to determine the risk factors to which workers are subjected throughout their workday.
The tasks may be subjected to a set of risk factors Φ(ϕ = 1,…,|Φ|) that can be physical or psychic. However, all our research only focuses on the set of physical factors. Indeed, we use a unified risk level classification proposed by Ref.10, which considers simultaneously different methods to assess ergonomic risks. This classification allows us to determine the risk level of tasks in regard with the somatic comfort, including simultaneously the postural loads, the repetitive movements and the manual handling. The classification considers the following assessment methods:
- •
Rapid Upper Limb Assessment (RULA): Method that evaluates the postural load of workers. Workers adopt poor posture so continued or repeated during work (static load). This load generates fatigue and eventually musculoskeletal disorders. Some of these postural loads are hyper-extensions, hyper-flexions and hyper-rotations14.
- •
Occupational Repetitive Action (OCRA): Method that evaluates the repetitive movements. The worker performs several operations or activities involving repetitive motion of small muscle groups. These movements can cause muscular overload, muscle pain and ultimately injury14.
- •
The National Institute for Occupational Safety and Health (NIOSH): this method evaluates the manual handling. Some tasks performed by workers involve the object lifting, movement, push, grip and transport, and therefore they may be physically harmful14.
In Table 1, we can see the unified classification of the risk levels.
| Level of risk | χ | Suggested action |
|---|---|---|
| Acceptable | 1 | No action is required because there is no risk to the worker. |
| Minor/Moderate | 2 | An analysis of the workstation is necessary. In the future, corrective actions for its improvement are recommended. |
| High | 3 | An analysis and improvement of the workstation and medical supervision are immediately required. Regular checks are also recommended. |
| Unacceptable | 4 | Immediate modification of the workstation is required because of the worker presents serious illness |
Risk level classification by categories, χ, and actions to consider.
Once the risk category, χϕ,j, of the task j ∈ J, for the risk factor, ϕ ∈ Φ, is determined, the ergonomic risk, Rϕ,j, is calculated by multiplying the χϕ,j category by the processing time of the task, tj (i.e., Rϕ,j = tj · χϕ,j).
Finally, the risk associated with a workstation is determined by adding the risks of each elemental task that is assigned to the workstation.
As an example, the following figures show the way to calculate the ergonomic risk of workstations and how to assign a set of tasks, (|J| = 8), to a set of workstations considering a maximum cycle time of c = 20s; an available area of A = 20dm, and a maximum ergonomic risk of Rmax = 60e−s (ergo-secondsa). Specifically, Figure 1 shows the tasks, their processing times, tj (j = 1,…,|J|), their required space, aj (j = 1,…,|J|), their category for the physical factor, χϕ,j (j = 1,…,|J|), and the precedence graph. On the other hand, Figure 2 shows the solution obtained considering all attribute limitations.
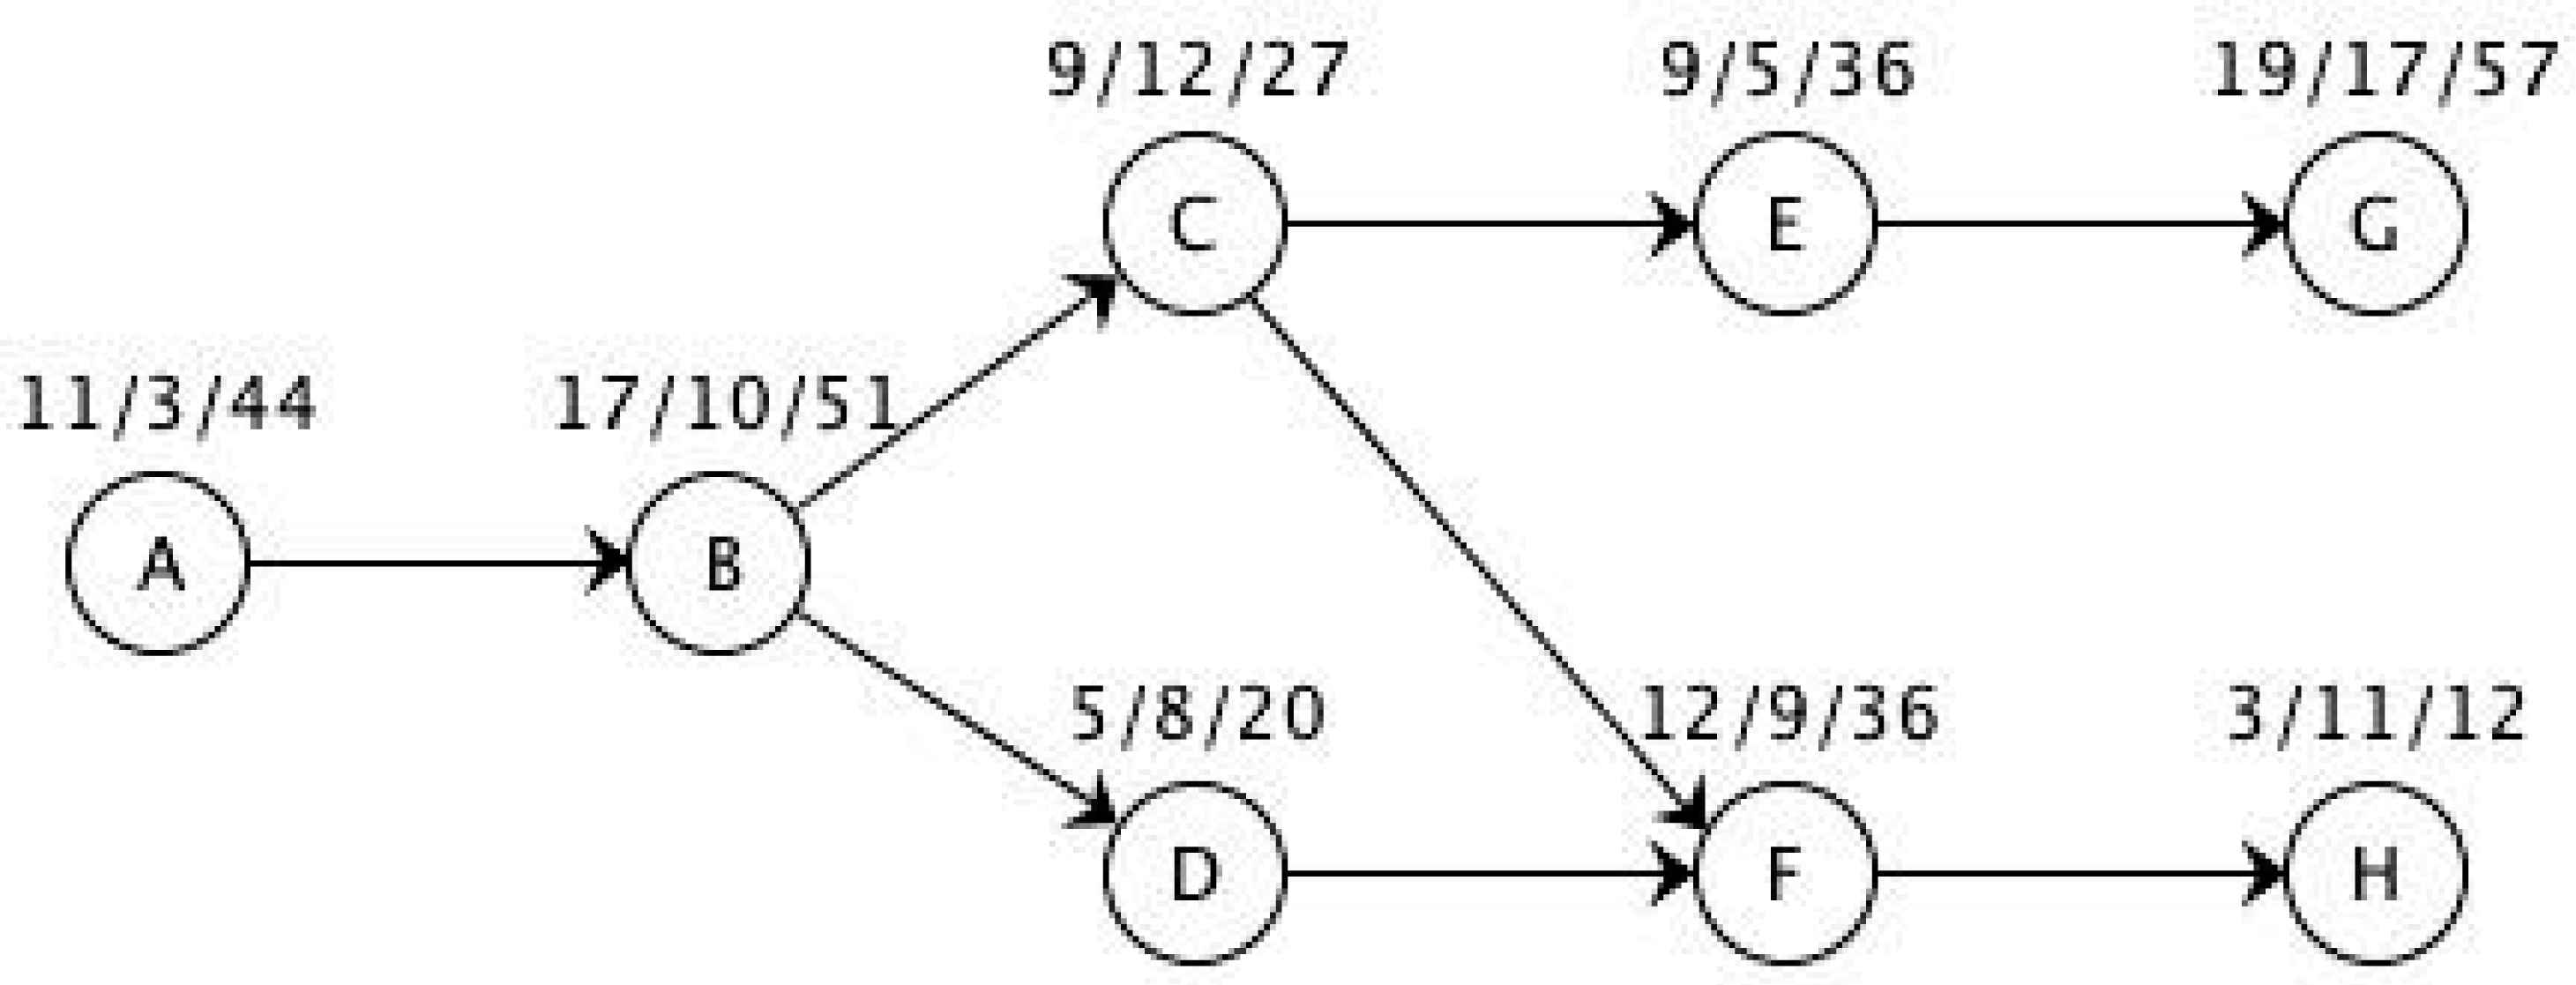
Precedence graph of tasks. We can see, at each vertex, the tuple tj / aj / χj corresponding to the task.
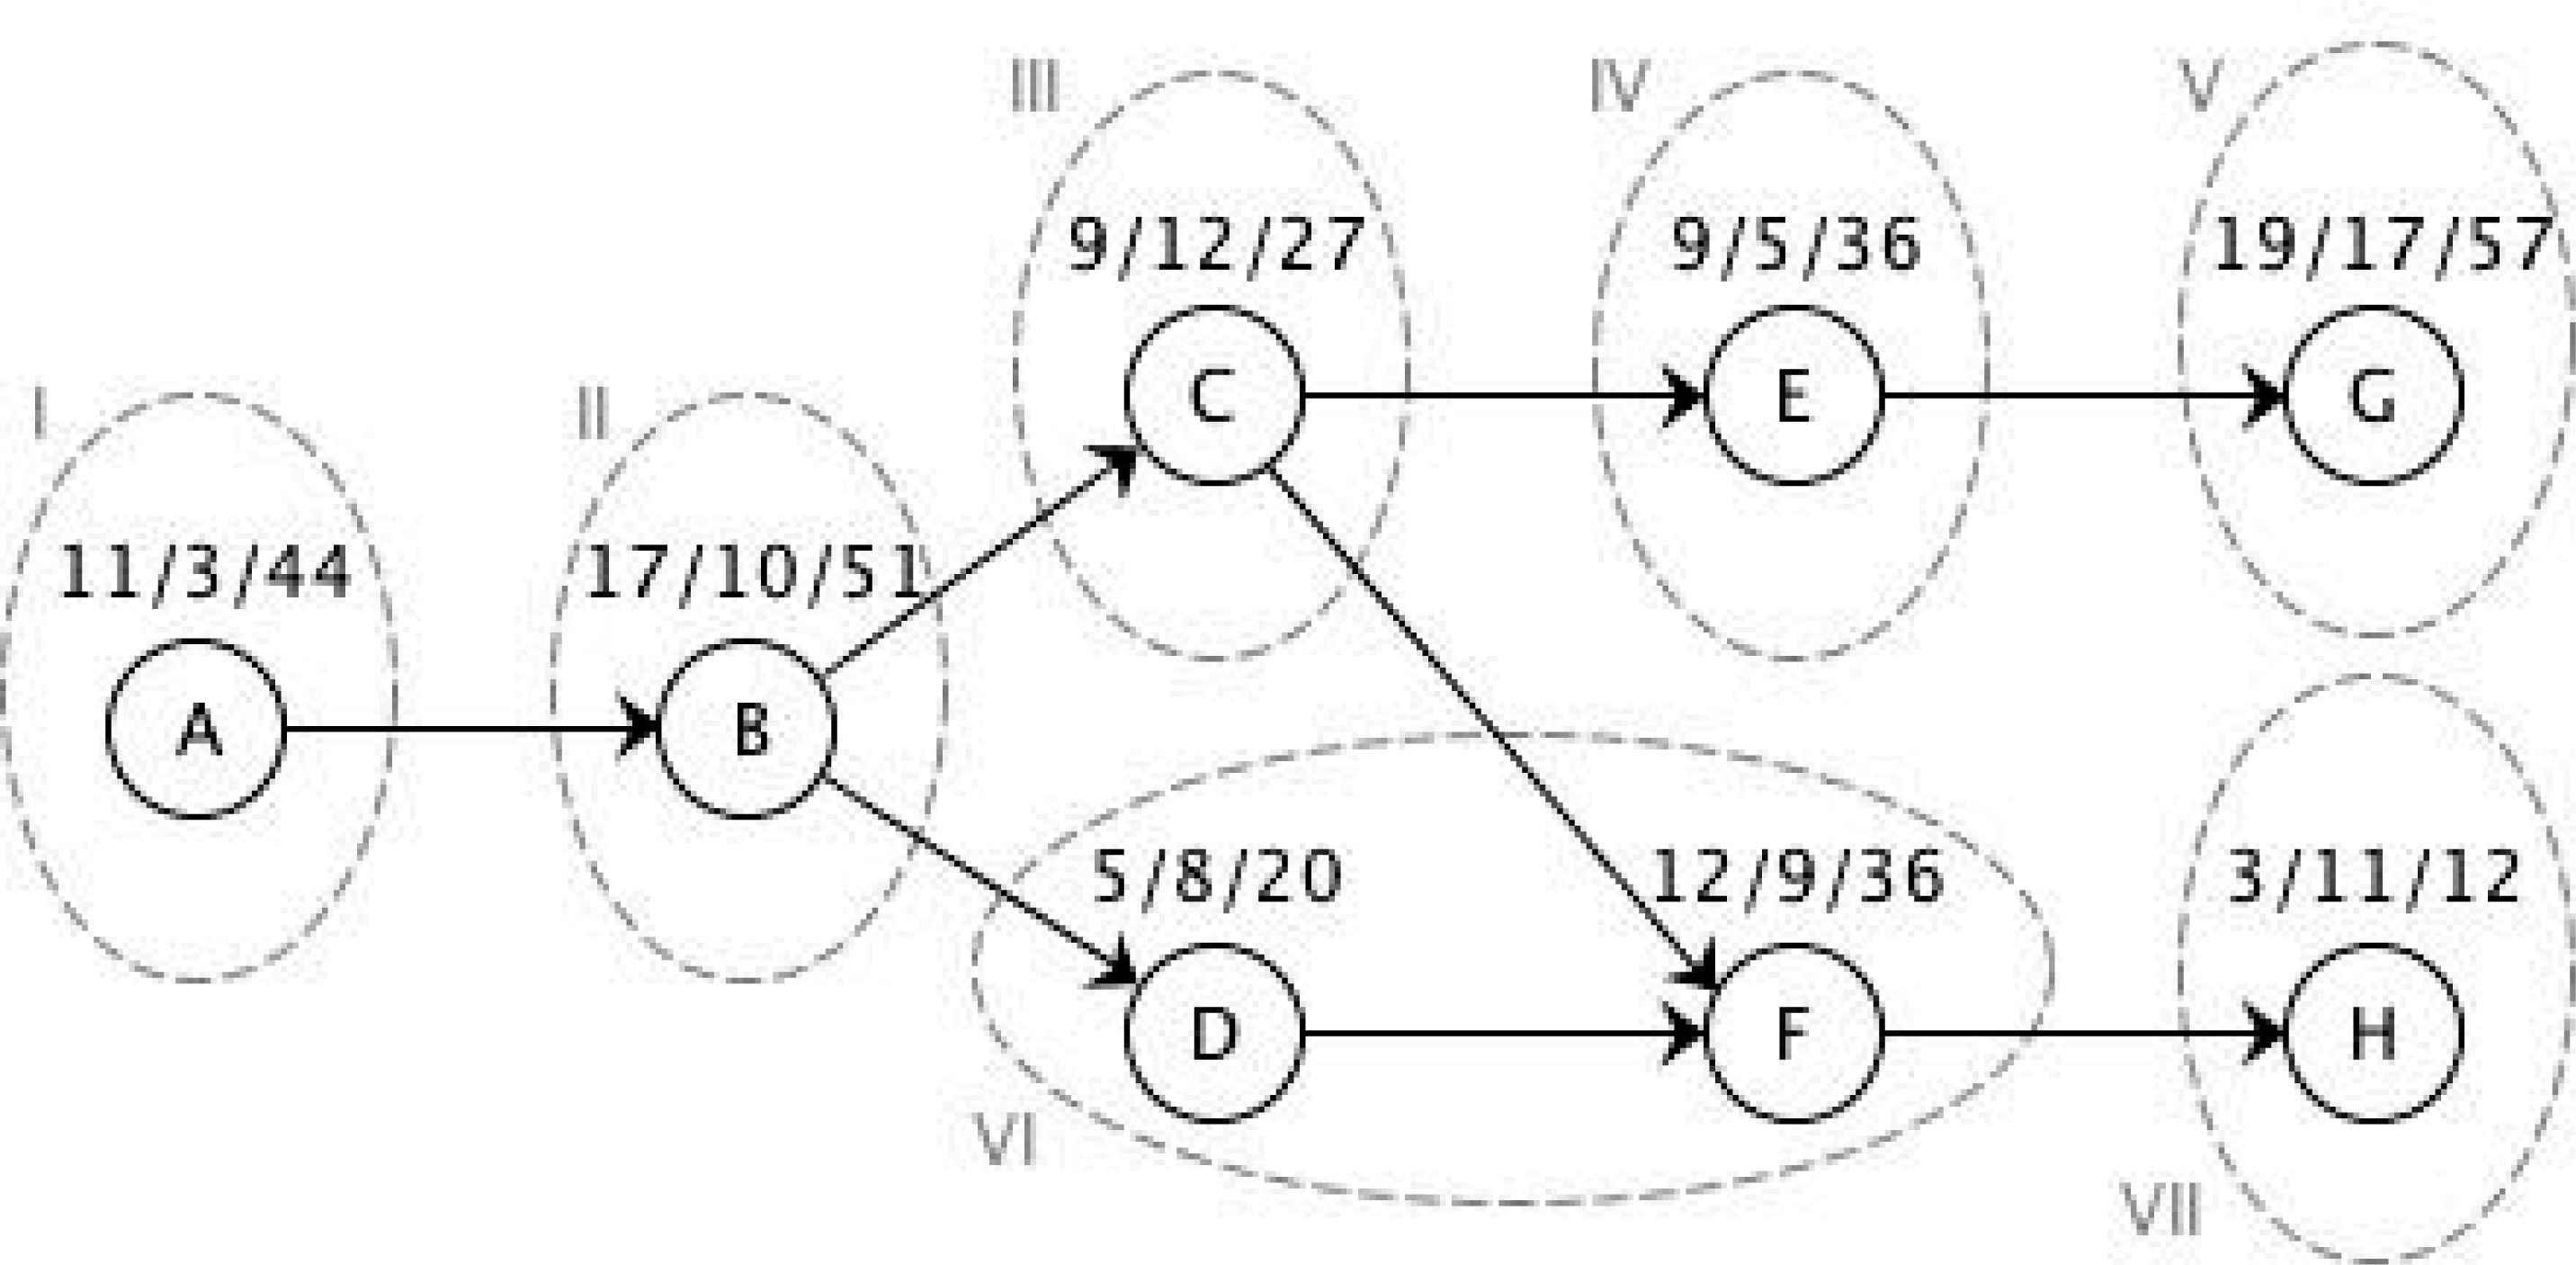
Solution obtained for all conditional factors. Each discontinuous circle corresponds to one workstation.
2.1. Incorporation of Ergonomics and problem description
Within the last years, different investigations include Ergonomics into the assembly lines2,15. Nevertheless, many of these works do not consider appreciations and requirements that must be considered in real environments. The consideration of a maximum linear area for workstations is a sample of this scarcity.
Accordingly, we use two mathematical models in order to analyze the impact of the linear area limitation on the ergonomic risk of the line.
The first model is the min−max R model. This mathematical model was presented for the first time in Ref.7. After, the model was evaluated, in Ref.12, considering the effect of the ergonomic risk and the spatial limitation.
The second one is the min AAD_R model and it is based on the M_AALB_ΔRmodel, which was proposed by Ref.10.
2.2. Nomenclature
Before the mathematical formulation, we define the parameters and variables of both models.
| Parameters | |
|---|---|
| J | Set of elemental tasks (j = 1,…,|J|) |
| K | Set of workstations (k = 1,…,|K|) |
| Φ | Set of ergonomic risk factors (ϕ = 1,…,|Φ|) |
| tj | Processing time of elemental task j(j = 1,…,|J|) at normal activity |
| aj | Linear area required by the elemental task j(j = 1,…,|J|) |
| χϕ,j | Category of task j(j = 1,…,|J|) associated with the risk factor ϕ(ϕ = 1,…,|Φ|) |
| Rϕ,j | Ergonomic risk of task j(j = 1,…,|J|) associated with the risk factor ϕ(ϕ = 1,…,|Φ|)). Here: Rϕ,j = tj · χϕ,j |
| Pj | Set of direct precedent tasks of task j(j = 1,…,|J|) |
| c | Cycle time. Standard time assigned to each workstation to process its workload (Sk) |
| m | Number of workstations, m = |K|, that is known and fixed |
| A | Available space or linear area assigned to each workstation. |
| | Average ergonomic risk present at each workstation regarding the risk factor ϕ ∈ Φ. That is: |
| Variables | |
| xj,k | Binary variable equal to 1 if the elemental task j(j = 1,…,|J|) is assigned to the workstation k(k = 1,…,|K|) and to 0 otherwise. |
| Rϕ | Maximum ergonomic risk for the risk factor ϕ(ϕ = 1,…,|Φ|) |
| | Average maximum ergonomic risk associated with the set of factors Φ |
| Sk | Workload of workstation K. The set of tasks assigned to the workstation k ∈ K: Sk = {j ∈ J: xj,k = 1} |
| Rϕ(Sk) | Ergonomic risk for the factor ϕ ∈ Φ associated with the workload |
| | Ergonomic risk excess at workstation k ∈ K depending on the factor ϕ ∈ Φ with respect to its average value, |
| | Ergonomic risk defect at workstation k ∈ K depending on the factor ϕ ∈ Φ with respect to its average value, |
2.3. Minimization of Maximum Ergonomic Risk
This model minimizes the average of the maximum ergonomic risk around the set of risk factors. Specifically, given a set of risk factors, Φ, for each factor, the maximum ergonomic risk is determined from the worse workstation, i.e., the station with greater ergonomic risk associated to each factor, and then an overall risk is calculated as the average value among the set of factors.
Therefore, the model consists of obtaining a line configuration that minimizes the average of the maximum ergonomic risks given a set of risk factors, Φ, and a set of elementary tasks or operations, J. These tasks must be assigned into a K set of workstations; each operation involves a processing time, tj(j = 1,…,|J|), a required space, aj(j = 1,…,|J|), an ergonomic risk associated with the risk factors, Rϕj(ϕ = 1,…,|Φ|;j = 1,…,|J|), and a set of direct precedence tasks, Pj(j = 1,…,|J|); therefore, besides minimizing the risk, the assignment must satisfy the following conditions: (1) the precedence constraints that exist between the tasks have to be met, (2) for each workstation, the workload time, which equals the sum of the processing times of each task performed at the station, should not exceed the cycle time, and (3) at any station, the linear area required by the workload has to be less than or equal to the available area for that workstation12.
The mathematical formulation of the min−max R model is the following:
Subject to:
In the model, the objective function (1) expresses the minimization of the ergonomic risk of the line. This risk is measured as the average of the maximum ergonomic risks due to the set Φ of risk factors. Constraints (2) indicate that each task can only be assigned to one workstation. Constraints (3) and (4) impose the maximum limitation of the workload time and the maximum linear area allowed by station. Constraints (5) determine the maximum ergonomic risk associated with the risk factor ϕ ∈ Φ at workstations. Constraints (6) correspond to the precedence task bindings. Constraints (7) and (8) limit the number of workstations and force that there is no empty workstation, respectively. Finally, constraints (9) require binary assignment variables.
If we only consider one ergonomic risk factor (physical factor) and therefore, the set of ergonomic risk factor is |Φ| = 1, the objective function would be equivalent to minimize the maximum ergonomic risk of the line.
2.4. Minimization of Average Absolute Deviations of Ergonomic Risk
The second model is a specific case from the M_AALB_ΔR model10. Now, the model has a mono-objective function that aims at minimizing the discrepancy between real and ideal values for the ergonomic risk of the line, considering the temporal, spatial and ergonomic attributes. In this case, the ideal value corresponds with the average risk of the line considering a number m of workstations and the discrepancy is measured considering the rectangular distance. The model is called min AAD_R (AAD: Average Absolute Deviation).
Subject to:
The objective function (10) expresses the average absolute deviation of ergonomic risk. Constraints (11)–(13) are the same that constraints (2) – (3) from the min−max R model. Constraints (14) determine the real ergonomic risk associated with the workload at each workstation. Constraints (15) define the ergonomic risk discrepancies, both positive and negative
3. Resolution procedures
In ALBPs, the exact procedures may be ineffective if we consider the computational time required. For this reason it is normal to find, in the specialized literature, numerous heuristic applications with the aim at solving single13 and multi-objective16,17 balancing problems. Thus, in this study the results obtained by linear programming9 are compared with those obtained by two GRASP algorithms.
3.1. Linear Programming procedures
The features from the mathematical models formulated above make necessary the use of MILP, because some variables are binary and integer.
Therefore, to solve the min−max R and min AAD_R models, we use a high-performance solver in Linear programming (LP), MILP and Quadratic Programming (QP). This solver is the IBM ILOG CPLEX Optimizer.
Particularly, the CPLEX solver uses a Branch and Cut Algorithm as main resolution algorithm for MILP. This algorithm is based on the Simplex Method, Branch and Bound and cut generators.
To differentiate each model solved by MILP, we denote as MILP-1 the min−max R model, and MILP-2 min AAD_R the model.
3.2. GRASP Algorithms
GRASP is a multi-start metaheuristic algorithm18,19 with two phases: (1) the construction phase where an initial feasible solution is built through a non-deterministic Greedy procedure; and (2) the improvement phase in which a local optimum is sought in a neighborhood of the constructed solution. These phases are consecutively applied until a stopping criterion is reached. Obviously, GRASP gives as a final solution the best solution found between all the iterations.
The construction phase requires a generator process of solutions, which gives acceptable solutions regarding the objective function and representative solutions of various regions of space to explore.
To ensure the diversity of solutions, given a sequence of decisions linked with a partial solution, the possible alternatives are randomly selected among the restricted candidate list (RCL). This RCL may contain all possible alternatives or a set of them on the basis of the best values for a function (bound, index, etc.) in line with the overall objective function of the problem to solve.
Briefly, an optimization problem solved through GRASP implies the following:
- 1.
To define the Greedy and the randomization procedure used for selecting a solution among the candidate alternatives.
- 2.
To define the neighborhood of a solution and how to explore it.
- 3.
To define the stopping criterion based on runtime or number of iterations.
In this paper, we use two GRASP procedures: the GRASP-1, which was presented in Ref.12 and whose objective is to minimize the ergonomic risk of the station of the line with greatest risk; and the GRASP-2, which is a new procedure focused on minimizing the average absolute deviation (AAD) of the ergonomic risk of the assembly line.
3.3. Constructive Phase: Greedy Procedure
Broadly, the construction phase consists of building a sequence of tasks π(N) = (π1,…,πN), progressively. For this purpose, it is necessary to create a restricted candidate list, RCL, from all possible task that can be incorporated into the sequence.
Thus, at each stage associated with the position n(n = 1,…,N) of the sequence π(N), the RCL(n) is made up for tasks that have not yet been incorporated into the π(n−1) = (π1,…,πn−1) sequence, but whose precedent tasks have already been assigned to the π(n−1) = (π1,…,πn−1) sequence, i.e., ∀j ∈ RCL(n)⇒ Pj ⊆ π(n−1).
Once the RCL(n) is formed, it is ordered according several hierarchical priority indices.
Specifically, the GRASP-1 procedure (see Ref.12) uses two indices, the
The second index (for ties) serves to get regular sequences of tasks in terms of ergonomic risk. The non-regularity index for the set of risk factors is defined as follows:
Where rϕ(J) is the ergonomic risk rate of factor ϕ ∈ Φ for the set of tasks J, i.e.:
On the other hand, GRASP-2 uses four indices because it generates two different sequences: (1) the indexes
The index
While, the index
After calculating the indexes
The ∧ factor is defined as the percentage of tasks that will be sorted among the best candidates. Thus, the
Table 2 shows the GRASP constructive phase to generate a π(N) sequence without delays and with regular ergonomic risk, and a π′(N) sequence without delays in required linear area and ergonomic risk.
| 0. Initialization: Input: ∧,J,rϕ(J),(tj,aj,χϕ,j)∀j ∈ J, ∀ϕ ∈ Φ Initialize: n = 0, π(n) = {∅}, π′(n) = {∅}, N = |J| 1. Create the candidate set: n ← n+1 Let RCL(n) = {j ∈ J: j ∉ π(n−1)∧Pj ⊆ π(n−1)} Let RCL′(n) = {j ∈ J: j ∉ π′(n−1)∧Pj ⊆ π′(n−1)} be the set of candidate tasks 2. Evaluate alternative: ∀j ∈ RCL(n) determinate: ∀j ∈ RCL′(n) determinate: >3. Sort alternatives: Let Let 4. Select alternative: Let Then: Let Then: 5. Update: π(n) = π(n−1)∪{j*} π′(n) = π′(n−1)∪{j′*} 6. Finalization test If n < N go to step 1 Else END |
Construction phase scheme of sequences without accumulated ergonomic risk or required linear area at the end of the assembly line.
This phase makes sure that final task sequences, π(N) and π′(N), are consistent with both precedent and succession constraints, and they do not accumulate the ergonomic risk (for π(N) case) or the required linear area (for π′(N) case) at the end of the assembly line.
From the π(N) and π′(N) sequences, the following stage consists of designing two assembly line configurations by imposing a fixed number of workstations, m>1.
Indeed, given a number m(m>1) of workstations, the π(N) and π′(N) sequences are divided in m segments. These segments have the following features: they are compatible with the constraints (3) and (4), i.e., with the cycle time, c, and the maximum linear area, A; they are constituted by adjacent tasks of the sequence; they are not empty; they are disjoint between them and their union corresponds with the set J of tasks.
3.4. Local Improvement Phase
The improvement phase of the GRASP-1 relies on sequentially applying four descent algorithms on four neighborhoods (see Ref.12). Similarly, the improvement phase of GRASP-2 has also four stages, which are consecutively repeated until the reached solution does not improve at none stage. Between two solutions compatible with constraints of cycle time and linear area, the solution with lower average absolute deviation of ergonomic risk will be considered the best. Specifically, the stages of the improvement phase of GRASP-2 are the following:
- 1.
Insertion of a task from the station with the greatest ergonomic risk to any other station: the workstation with the greatest ergonomic risk inserts all its tasks, one by one, into any previous station and then into any next station. The constraints linked with the cycle time, linear area and precedence rules, must be satisfied and the average absolute deviation of the ergonomic risk of the line must improve. In case of tie, the insertion will be consolidated if, after performing it, the ergonomic risk at the receiving station is greater than the current minimum ergonomic risk.
- 2.
Insertion of a task from any station to the station with the lowest ergonomic risk: the workstation with the lowest ergonomic risk increases its workload with the last task from any previous station and/or the first task from any next station. As in the previous stage, the cycle time and linear area constraints must be fulfilled and the average absolute deviation of ergonomic risk of the line must improve. In case of tie, the insertion will be consolidated if the ergonomic risk at the emitting station is greater than the minimum ergonomic risk and the ergonomic risk at the receiving station is less than the current maximum ergonomic risk.
- 3.
Exchange of a task from the station with the greatest ergonomic risk to any other station: this stage consists of performing exchanges between the tasks from the workstation with the greatest ergonomic risk, one by one, and the first task from the following workstations and, after, the last task from previous stations. As in the others stages, the exchanges must meet the cycle time, linear area and precedence constraints and obviously, no exchange can suppose the increase of average absolute deviation of ergonomic risk. In case of tie, the exchange will be consolidated if, after performing it, the ergonomic risk at both stations is greater than the current minimum ergonomic risk and the ergonomic risk at both stations is less than the current maximum ergonomic risk.
- 4.
Switch of tasks between workstations: the last step consists of exchanging tasks between two stations. Obviously, the exchanges must meet the cycle time, linear area and precedence constraints, and they do not worse the average absolute deviation of ergonomic risk. In case of tie, the exchange will be consolidated if the sum of the Euclidean discrepancies of the ergonomic risk in both stations is reduced.
4. Computational Experience
In order to compare the results given by the mixed linear programming models (MILP-1 and MILP-2) and the GRASP algorithms (GRASP-1 and GRASP-2), we have performed a computational experience linked with a case study from Nissan’s engine plant in Barcelona (NMISA, Nissan Motor Ibérica – BCN).
Specifically, we have used one instance that corresponds with a daily production plan. This plan has 270 engines, divided equally into nine types, which are grouped into three families: p1, p2 and p3 are engines for crossovers and SUVs; p4 and p5 are for vans; and p6, p7, p8 and p9 are intended for medium tonnage trucks. The assembly of any engine supposes 140 tasks with a cycle time of 180 seconds.
This experience has allowed us to assess the impact of the number of workstations of the line and the maximum available space per station, on the objectives of the problem. Therefore, we have been able to determine the maximum ergonomic risk and the ergonomic risk range of the line, in regard with the length of the line.
For that purpose we have carried out a parametric sweep of number of workstations and maximum linear area per station. Specifically, we have executed the MILPs and the GRASP algorithms for the following parameter values:
- •
Number of workstations:
m = {19,20,21,22,23,24,25}
- •
Maximum allowed linear area: A = {4,5,10} (meters).
In addition, we have also considered the following parameter values for the GRASPs:
- •
Number of iterations: Itermax = 10000
- •
Admission factor: ∧ = {25%,50%,100%}
Accordingly, we have run the GRASP algorithms 63 times on a iMac (Intel Core i7 2.93 Ghz, 8 GB de RAM, MAC OS X 10.6.8) and we have obtained the following results (table 3):
| GRASP-1 | |||||||
|---|---|---|---|---|---|---|---|
| Maximum ergonomic risk · m (Number of workstations) | |||||||
| A | 19 | 20 | 21 | 22 | 23 | 24 | 25 |
| 4 | - | - | 495 | 360 | 315 | 295 | 270 |
| 5 | - | - | 315 | 300 | 285 | 270 | 260 |
| 10 | 350 | 330 | 305 | 295 | 278 | 270 | 255 |
| GRASP-2 | |||||||
|---|---|---|---|---|---|---|---|
| Maximum ergonomic risk · m (Number of workstations) | |||||||
| A | 19 | 20 | 21 | 22 | 23 | 24 | 25 |
| 4 | - | - | 450 | 350 | 330 | 300 | 270 |
| 5 | 420 | 345 | 325 | 300 | 285 | 270 | 260 |
| 10 | 360 | 330 | 310 | 295 | 280 | 270 | 255 |
| GRASP-1 | |||||||
|---|---|---|---|---|---|---|---|
| Range of ergonomic risk · m (Number of workstations) | |||||||
| A | 19 | 20 | 21 | 22 | 23 | 24 | 25 |
| 4 | - | - | 375 | 225 | 175 | 145 | 120 |
| 5 | - | - | 120 | 90 | 75 | 65 | 50 |
| 10 | 105 | 65 | 44 | 55 | 48 | 35 | 42 |
| GRASP-2 | |||||||
|---|---|---|---|---|---|---|---|
| Range of ergonomic risk · m (Number of workstations) | |||||||
| A | 19 | 20 | 21 | 22 | 23 | 24 | 25 |
| 4 | - | - | 290 | 235 | 170 | 150 | 120 |
| 5 | 205 | 125 | 115 | 90 | 65 | 40 | 40 |
| 10 | 83 | 60 | 35 | 30 | 30 | 25 | 25 |
Best results in regard with the maximum ergonomic risk and the ergonomic risk range, given by GRASP-1 and GRASP-2 algorithms for all possible values of the admission factor ∧ = {25%,50%,100%}. The ‘-’ symbol means that not solution has been found. The maximum ergonomic risk and the ergonomic risk range are measured in ergo-seconds.
On the other hand, we have solved the mathematical models (MILP-1: min-max-R and MILP-2: min-AAD-R) on the CPLEX (v11.0) software, running on a Mac Pro computer with an Intel Xeon, 3.0 GHz CPU and 2 GB RAM memory under the Windows XP operating system, given a CPU time limit of 2 hours for each instance. In this case, each model has been run 21 times and the obtained results are the following (table 4).
| MILP-1 | |||||||
|---|---|---|---|---|---|---|---|
| Maximum ergonomic risk · m (Number of workstations) | |||||||
| A | 19 | 20 | 21 | 22 | 23 | 24 | 25 |
| 4 | - | - | 375 | 330 | 310 | 280 | 275 |
| 5 | - | - | 310 | 300 | 280 | 280 | 275 |
| 10 | 350 | 315 | 300 | 285 | 275 | 270 | 255 |
| MILP-2 | |||||||
|---|---|---|---|---|---|---|---|
| Maximum ergonomic risk · m (Number of workstations) | |||||||
| A | 19 | 20 | 21 | 22 | 23 | 24 | 25 |
| 4 | - | - | 450 | 420 | 375 | 345 | 285 |
| 5 | 440 | 390 | 320 | 300 | 275 | 265 | 255 |
| 10 | 360 | 315 | 300 | 285 | 275 | 265 | 255 |
| MILP -1 | |||||||
|---|---|---|---|---|---|---|---|
| Range of ergonomic risk · m (Number of workstations) | |||||||
| A | 19 | 20 | 21 | 22 | 23 | 24 | 25 |
| 4 | - | - | 245 | 213 | 170 | 205 | 205 |
| 5 | - | - | 100 | 130 | 85 | 160 | 165 |
| 10 | 100 | 30 | 30 | 25 | 45 | 110 | 60 |
| MILP -2 | |||||||
|---|---|---|---|---|---|---|---|
| Range of ergonomic risk · m (Number of workstations) | |||||||
| A | 19 | 20 | 21 | 22 | 23 | 24 | 25 |
| 4 | - | - | 320 | 274 | 215 | 185 | 125 |
| 5 | 240 | 162 | 92 | 50 | 25 | 15 | 19 |
| 10 | 75 | 30 | 15 | 15 | 17 | 15 | 15 |
Maximum ergonomic risk and ergonomic risk range given by the CPLEX solver with MILP-1 and MILP-2 models.
As we can see in the above tables, the MILP-1 and GRASP-1 procedures find solution for all cases, except when the number of workstations is 19 and 20 and the maximum linear area is 4 and 5 meters. However, MILP-2 and GRASP-2 only do not find solution when the number of workstations is 19 and 20 and the maximum linear area is 4 meters.
Regarding found solutions, the GRASP-1 algorithm uses a CPU time of 68.52 seconds and the GRASP-2 algorithm uses a CPU time of 136.02 seconds on average, while the linear programming reaches the CPU limit (2 hours). However, if we compare the results obtained by both methods according to the means of the gains of one procedure facing each other (formula 24), we can see (table 5) how MILP-1 and MILP-2 outperform GRASP-1 and GRASP-2 when the number of stations is more restricted.
| Δ(GRASPvMILP) | |||||||
|---|---|---|---|---|---|---|---|
| Maximum ergonomic risk · m (Number of workstations) | |||||||
| A | 19 | 20 | 21 | 22 | 23 | 24 | 25 |
| 4 | -0.20 | -0.06 | -0.02 | -0.05 | 0.02 | ||
| 5 | 0.05 | 0.13 | -0.02 | 0.00 | -0.04 | -0.02 | -0.02 |
| 10 | 0.00 | -0.05 | -0.02 | -0.04 | -0.01 | -0.02 | 0.00 |
| Δ(GRASPvMILP) | |||||||
|---|---|---|---|---|---|---|---|
| Range of ergonomic risk · m (Number of workstations) | |||||||
| A | 19 | 20 | 21 | 22 | 23 | 24 | 25 |
| 4 | -0.18 | -0.06 | 0.00 | 0.28 | 0.04 | ||
| 5 | 0.17 | 0.30 | -0.25 | -0.80 | -1.60 | -1.67 | -1.11 |
| 10 | -0.11 | -1.00 | -1.33 | -1.00 | -0.76 | -0.14 | -0.67 |
Improvement of GRASP-(1,2) combination versus MILP-(1,2) combination Δ(PvP′). The area (A) is measured in meters.
In formula (24), SP and SP′, are the solutions obtained by the four procedures (given a number of workstations, m, and a linear area, A). And ∧(PvP′) is the gain of the P procedure (or combination of procedures) versus the P′ procedure (or combination), given the same values of m and A, for both the maximum risk and the risk range.
In accordance with the maximum ergonomic risk (see table 5), when the GRASP-(1,2) combination is the winner procedure, it is obtained a gain of 6.55% on the MILP-(1,2) combination; by contrast, when the winner procedure is MILP-(1,2), the gain against GRASP-(1,2) is by 4.33%. Overall, MILP-(1,2) beats GRASP-(1,2) by a slight gain of 1.86% (5.73 ergo-seconds out of a total of 307.89 ergo-seconds).
Meanwhile, in regard with the ergonomic risk range (table 5), when the winner procedure is the GRASP-(1,2) combination, a gain of 19.61% is obtained facing MILP-(1,2) combination; whereas when the winner procedure is MILP-(1,2), the gain against GRASP-(1,2) is by 80.00%. Overall, MILP-(1,2) beats GRASP-(1,2) by a strong gain of 54.82% (49.71 ergo-seconds out of a total of 90.68).
Table 6 shows the absolute gains of each procedure (in rows) facing the other ones (in columns), in order to analyze the performance of the four procedures. In this way, we can also establish a ranking between the procedures, in terms of quality of maximum ergonomic risk and quality of ergonomic risk range.
| Maximum ergonomic risk | ||||
|---|---|---|---|---|
| Δ(PvP′) | MILP | GRASP | ||
| #1 | #2 | #1 | #2 | |
| MILP-1 | - | |||
| MILP-2 | -0.049 | - | ||
| GRASP-1 | -0.030 | 0.019 | - | |
| GRASP-2 | -0.030 | 0.025 | -0.001 | - |
| Range of ergonomic risk | ||||
|---|---|---|---|---|
| Δ(PvP′) | MILP | GRASP | ||
| #1 | #2 | #1 | #2 | |
| MILP-1 | - | |||
| MILP-2 | 2.018 | - | ||
| GRASP-1 | 0.251 | -1.094 | - | |
| GRASP-2 | 0.685 | -0.510 | 0.261 | - |
Absolute gain Δ(PvP′)of P procedure (row) versus P′ procedure (column).
From table 5 and 6 we can state:
- 1.
Considering the maximum ergonomic risk, MILP-1 is the best procedure, followed by GRASP-1, GRASP-2 and MILP-2. However, the advantage of MILP-1 over the others is very small: between 3 and 4.9%.
- 2.
If we focus on the ergonomic risk range, MILP-2 is the best procedure, followed by GRASP-2, GRASP-1 and MILP-1. Here, the absolute gain of MILP-2 (the best) against MILP-1 (the worst) is very high (201.8%), and also is significant for GRASP-1 (109.4%) and GRASP-2 (51%). However, it should be noted that GRASP-2 improves MILP-1 by 68.5%.
5. Conclusions
This paper compares four resolution procedures for a balancing problem whose objective is to maximize the comfort of the assembly line. Specifically, we compare the procedures presented in Ref.12 (MILP-1 and GRASP-1) with two new procedures proposed in this paper (MILP-2 and GRASP-2).
The procedures have been leaded to solve two variants of the assembly line balancing problem with temporal, spatial and ergonomic attributes, whose direct objective is to maximize the comfort of the line. Nevertheless, both models pursue differently that working conditions at the workstations and for all operators are as confortable as possible.
The first model, min−max R12, aims at minimizing the maximum ergonomic risk, i.e., to minimize the risk of station with less comfort (greatest risk) of the assembly line. The second model, min AAD_R, explicitly focuses on minimizing the average absolute deviation of the ergonomic risk, and implicitly it minimizes the range of the ergonomic risk, i.e., it minimizes the difference between the ergonomic risk of the least comfortable workstation and the most comfortable one.
Two different methods have been used to solve the problem min−max R: the MILP-1, based on linear programming (using the CPLEX software) and the GRASP-1 (see12).
On the other hand, we have also proposed two methods in order to solve the problem min AAD_R: the MILP-2 and the GRASP-2, whose objectives and local search rules are in line with the average absolute deviation of ergonomic risk of the assembly line.
In order to compare the procedures and models, we have used a case study linked with an assembly line from the Nissan’s engine plant in Barcelona. Specifically, we have designed assembly lines with a number of workstations fixed and comprised between 19 and 25, with a cycle time of 180 seconds and with three possible reference linear areas, 4, 5 and 10 meters.
We have used two metrics to analyze the performance of four methods: (1) the maximum ergonomic risk and (2) the ergonomic risk range.
After running the proposed GRASP algorithms and the MILP procedures, we have compared the results. On the one hand, table 7 shows the best combination of procedures, for each case, between the GRASP-(1,2) and the MILP-(1,2); on the other hand, table 8 collects the best procedure for each case taking into account the individual behavior of the four procedures.
| Winner | |||||||
|---|---|---|---|---|---|---|---|
| Maximum ergonomic risk · m (Number of workstations) | |||||||
| A | 19 | 20 | 21 | 22 | 23 | 24 | 25 |
| 4 | - | - | M | M | M | M | G |
| 5 | G | G | M | Idem | M | M | M |
| 10 | Idem | M | M | M | M | M | Idem |
| Winner | |||||||
|---|---|---|---|---|---|---|---|
| Range of ergonomic risk · m (Number of workstations) | |||||||
| A | 19 | 20 | 21 | 22 | 23 | 24 | 25 |
| 4 | - | - | M | M | Idem | G | G |
| 5 | G | G | M | M | M | M | M |
| 10 | M | M | M | M | M | M | M |
Winner combination of procedures [M:MILP-(1,2) and G:GRASP-(1,2)] for the maximum ergonomic risk and the of ergonomic risk range, in regard with the values of m and A.
| Winner | |||||||
|---|---|---|---|---|---|---|---|
| Maximum ergonomic risk · m (Number of workstations) | |||||||
| A | 19 | 20 | 21 | 22 | 23 | 24 | 25 |
| 4 | - | - | M1 | M1 | M1 | M1 | G1 G2 |
| 5 | G2 | G2 | M1 | All | M2 | M2 | M2 |
| 10 | G1 M1 | M1 | M1 M2 | M1 M2 | M1 M2 | M2 | All |
| Winner | |||||||
|---|---|---|---|---|---|---|---|
| Range of ergonomic risk · m (Number of workstations) | |||||||
| A | 19 | 20 | 21 | 22 | 23 | 24 | 25 |
| 4 | - | - | M1 | M1 | M1 G2 | G1 | G1 G2 |
| 5 | G2 | G2 | M2 | M2 | M2 | M2 | M2 |
| 10 | M2 | M1 M2 | M2 | M2 | M2 | M2 | M2 |
Winner procedure [M1:MILP-1, M2:MILP-2, G1:GRASP-1 and G2:GRASP-2] for the maximum ergonomic risk and the range of ergonomic risk, in regard with the values of m and A.
As final conclusions, we can state the following points:
- •
MILP-1 is the best procedure considering the maximum ergonomic risk. This procedure is followed by GRASP-1, GRASP-2 and MILP-2, the first with a slight advantage over the others.
- •
MILP-2 is the best procedure within the ergonomic risk range, followed by GRASP-2, GRASP-1 and MILP-1, with a great advantage of the first over the others.
- •
The GRASP algorithms are very competitive to minimize the maximum ergonomic risk. Indeed, on mean, their solutions differ only by 3% from the best procedure (MILP-1).
- •
The GRASP-1 algorithm uses a mean CPU time of 68.52 seconds and the GRASP-2 algorithm uses a mean CPU time of 136.02 seconds, while both linear programs (MILP-1 and MILP-2) reach the CPU limit using two hours for each instance.
In future works, we will attempt to formulate new models and procedures to minimize the range of ergonomic risk and maximize the productivity of assembly lines with restrictions on the maximum ergonomic risk and linear area.
Acknowledgements
This work was funded by the Ministerio de Economía y Competitividad (Spanish Government) through the FHISELM2 (TIN2014-57497-P) project.
Footnotes
An ergo-second is the time unit, measured in seconds, used to assess the ergonomic risk of a task, with a processing time of 1 second at normal work pace, bearing a risk category of 1. Thus, this scale measures the time spent by workers to perform a task (at normal pace) taking into account the level of the ergonomic risk to which they are exposed.
References
Cite this article
TY  - JOUR
AU  - Joaquin Bautista
AU  - Rocío Alfaro-Pozo
AU  - Cristina Batalla-García
PY  - 2016
DA  - 2016/08/01
TI  - Maximizing comfort in Assembly Lines with temporal, spatial and ergonomic attributes
JO  - International Journal of Computational Intelligence Systems
SP  - 788
EP  - 799
VL  - 9
IS  - 4
SN  - 1875-6883
UR  - https://doi.org/10.1080/18756891.2016.1204125
DO  - 10.1080/18756891.2016.1204125
ID  - Bautista2016
ER  -