
Proactive Control for Oversaturation Mitigation on Evacuation Network: a Multi-Agent Simulation Approach
- DOI
- 10.1080/18756891.2016.1256571How to use a DOI?
- Keywords
- Oversaturation Control; Evacuation Network; Multi-Agent Based Modeling; Throttling Strategy
- Abstract
Using a multi-agent simulation approach composing of evacuee, cell, and signal, this study aims to proactively curb the oversaturation spread in evacuation and improve the evacuation efficiency. The specific innovation lies in the en-route path choice model and oversaturation control model. A logit model incorporating fuzzy multi-attribute utility is used to describe the path choice. A three-threshold throttling strategy is proposed to assign signal parameters for oversaturated intersections. A case study demonstrates that the multi-attribute utility performs effectively in the presentation of uncertain route-choice factors under evacuation background. The throttling strategy can decrease the total evacuation time by 7.6% in the supposed scenario.
- Copyright
- © 2016. the authors. Co-published by Atlantis Press and Taylor & Francis
- Open Access
- This is an open access article under the CC BY-NC license (http://creativecommons.org/licences/by-nc/4.0/).
1. Introduction
Natural disasters and man-made emergency events have brought large loss to the world. It had been estimated that the direct economic loss caused by natural disaster has amounted to approximately $2.5 trillion during the years 2000–2012 (1). It is believed by traffic managers that improving evacuation efficiency of traffic network is a way to reduce the loss in emergency events. Therefore, the transportation agencies tried various measures such as signal control, contraflow lane reversal, information control, and intersection crossing elimination to speed up the clearance of network traffic surrounding emergency sites in the past years (2–7). Signal control at intersections has a best performance among these measures. It can improve the system performance in evacuation by 9% in average referring to the scenarios in the related literature (2–5). As a result, decision makers prefer the signal control in case of conducting an effective evacuation traffic management.
A set of software packages (SYNCHRO, TRANSYT, SCATS, and SCOOT) have been developed to assist signal optimization by adjusting supply of the tempo-spatial intersection resource, if the demand degree is lower than saturation level. However, there are few cases using these tools to handle the oversaturated conditions, which most occur in evacuation. The vast demand generated in a short time interval, such as the suddenly dissolved participants in a large-scale public event, may lead to local bottlenecks if they are evacuated under unchanged signal schemes. For instance, a queue may spill back to the upstream intersection, which can not only impact evacuation efficiency but also cause network paralysis. Therefore, it is necessary to mitigate this oversaturation phenomenon in evacuation. In fact, many studies regarding signal optimization have been conducted in order to resolve the intersection oversaturation problem by mathematical planning or iterative simulation (8–12). Gazis et al (1964) is one of the first studies to do the signal optimization at a single oversaturated intersection (8). They solved the green time by the method named switch control when the signal cycle is known in priority. The limitations of the control strategy in this type of study are summarized: no limit for the queue length; incomplete signal parameters for optimization; application limited to single intersection etc. Chang et al (2004) used bang-bang controller and TRANSYT-7F to optimize the oversaturated and unsaturated traffic of intersection groups respectively (9). These two means were combined to overcome the aforementioned limitations. Unlike such heuristic strategy, Lo et al (2004)’s mixed-integer linear programming and Girianna et al (2004)’s nonlinear programming can attain global optimal signal parameters (10–11). However, many of them focus on solving the global optimal signal parameters and thus need long computational time. Hence, a time-saving method to control oversaturation is needed when coordinating regional intersections simultaneously. Another shortcoming of these approaches is that the single threshold embedded in the incorporated throttling strategy is liable to cause excessive state switching. The frequently changed signal parameters are against the implementation of the signal controller. Designing a better throttling strategy can be a feasible solution to prevent this overfrequented signal change in oversaturation management.
In addition, the traffic control in evacuation is preparedness-plan oriented, thus the predictive traffic is used as the state object of signal optimization. The predictive traffic is related to route-choice decision. Regarding the route-choice decision in the evacuation, the majority of previous studies employ logit model to reflect evacuees’ stochastic perception error. Its expected utility is generally set as the weighted average of a few quantitative attributes, such as travel time and spent cost. In fact, the majority of the traffic information in evacuation would be qualitative and even ambiguous. People’s perception regarding numeric values of these linguistic terms may not be clear. For instance, they may just obtain a range of uncertainty interval, which can make it difficult to obtain the expected utility. In fact, this uncertainty related problem can be expressed as fuzzy set theory. Generally, fuzzy aggregation method can be applied to obtain a fuzzy multi-attribute utility as the expected utility in the logit model. Liu et al (2003) proposed a fuzzy dynamic traffic assignment model (12); its innovation point lies in that the fuzzy membership function is borrowed to represent the uncertain travel time in route choice. However, they do not apply the fuzzy aggregation exactly because only single attribute is used in their route-choice utility. Fuzzy aggregation method has been principally applied to multi-attribute fuzzy decision making processes. This method aggregates subjective data based on extended algebraic operations with fuzzy numbers. Generally, the concept of α-cut representation of fuzzy numbers is used to apply this method. The detailed procedure can refer to literature (13). There are several studies applying the fuzzy aggregation method to investigate transportation user perception of various transportation services, e.g., signalized intersections, variable message sign (VMS). Zhang (2004) used fuzzy aggregation in evaluating the service quality of signalized intersections to account for user perception (14). Lee et al (2005) used fuzzy aggregation to evaluate driver perception regarding service quality of VMS (15). If the fuzzy aggregation is used in the route-choice decision in evacuation, the selection of corresponding attributes will become the primary task.
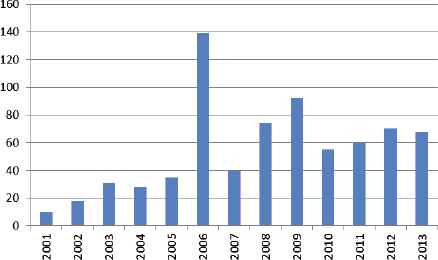
Unlike strict mathematical expression employed in optimization problem, multi-agent simulation generally adopts a set of rules. Thus, it has the potential to shorten the simulation process to save computational time by coordinating the tasks among the agents. Agent-based modelling methodology has a long lineage, beginning with von Neumann’s (16) work on self-reproducing automata. Agents are “objects with attitudes” (17). A collection of agents, programmed to follow some (often very simple) behavior rules, can form Multi-Agent Based Modelling (M-ABM) (18). Compared to analytical method and general discrete-event simulation, M-ABM has less complexity, as it focuses more on the objective of each agent rather than the achievement of system objective. Aside from the computational efficiency, it features with a simpler operation process, as we only need to answer a number of “what-if” questions by a number of “if-then” rules (19). These advantages make M-ABM’s application increasingly popular in the field of traffic-control field. Adopting combined key words of “agent simulation” and “traffic control”, this study searched a large number of academic papers in Google Scholar. The corresponding number change is illustrated in Figure 1, where upward trajectory is merging in recent years especially after Roozemond (2001)’s pioneering work (20). The reason of the sharp increase in the years 2006–2009 is that some agent-related conferences concerning traffic control problem were held in those years. Some typical applications of M-ABM in traffic control are summarized: self-organizing traffic lights (21–22), fuzzy multi-agent signal control (23–24), and multi-agent model predictive control (25). Few studies in regard to the combination studies of multi-agent traffic control with evacuation route choice can be found in the literature. The relevant literature is listed in Table 1, where vehicle movement is based on existing simulation approach. And most route-choice behavior is quite simple. Some uncertain influencing attributes in evacuation are thus not considered. Moreover, the traffic control strategy cannot respond to oversaturation conditions except for the literature (26). The throttling strategy with two thresholds in Madireddy et al (2011) is useful to modify the excessive state switching problem in oversaturation control, but the interactions of neighbor intersections are not considered in this strategy.
Literature number about agent simulation in traffic control
Note: Indexed by Google Scholar.
| Literature | Decision rules | ||
|---|---|---|---|
| Route-choice behavior | Vehicle movement principle | Traffic control strategy | |
| (27) | Routing of local and regional buses are predetermined, while data of automobiles are taken from the evacuation of New Orleans prior to the landfall of Hurricane Katrina in 2005. | TRANSIMS simulation system supporting for the run of multimodal movement. | Existing control |
| (26) | Rerouting a shortest distance path whenever congestion occurring in initial path | Cellular automation based NETLOGO traffic simulator | Throttling strategy with two thresholds |
| (28) | Route choice forces model composed of two factors: desires of taking the quickest route and being with others | Event-driven queue-based MATSIM traffic simulator | Existing control |
| (29) | Following the direction indicated by a dynamic sign at the T-junction probabilistically | Cellular automation based NETLOGO traffic simulator | Totally asymmetric exclusion process |
| (25) | Following the real-time fastest route to destination | PARAMICS simulation system | No control |
Literature Review of Decision Rules in Agent-Based Evacuation Traffic Control
In this study, the interplay between route choice behavior and signal optimization is considered in our M-ABM for oversaturation mitigation on evacuation network. A logit model incorporating fuzzy multiattribute utility is proposed to estimate the en-route path choice ratio of evacuees. In this model, the uncertain route-choice factors under evacuation background are selected. A throttling strategy with three thresholds is proposed to assign signal parameters for oversaturated intersections. This throttling strategy not only modifies the excessive state switching problem but also takes interactions of neighbor intersections into account.
2. Multi-Agent Based Modelling
When modelling multiple agents, two requirements should be met: (1) each agent needs to be endowed with specific capability of perception and decision making; and (2) the coordination mechanism among the agents needs to be constructed. As the multi-agent simulation has been widely used in the field of transport-related design, three types of agents (evacuee, cell and signal) are designed and coordinated in the oversaturation control during evacuation. By simulating the interplay between agents of evacuee and signal within the evacuation network system, this study aims to obtain the optimal signal parameters serving an efficient evacuation. More specifically, this objective is achieved by optimizing the process of perception and decision making for both the evacuees’ en-route path choice behavior under uncertain traffic information and the signal optimization under oversaturated conditions, provided the definition of cell agent is known.
The flowchart of M-ABM is shown in Figure 2, where the following factors are considered: (1) it is a one-shot simulation that can save computational time; (2) three agents as well as their operations are the basis; (3) each agent should go through the process of perception and decision sequentially per time interval, which describes the internal operation of individual agent; (4) cell agent provides physical property and various traffic feature for agents of evacuee and signal in the information perception period; and (5) the travel mode as well as route choice decision of evacuee agent, and control strategy of signal agent are the inputs of cell transmission model (CTM) to achieve the vehicle movements. The factors (4–5) represent the interplay among three agents, which can shape agent cooperation and lead to information sharing and exchanging inside the M-ABM system.
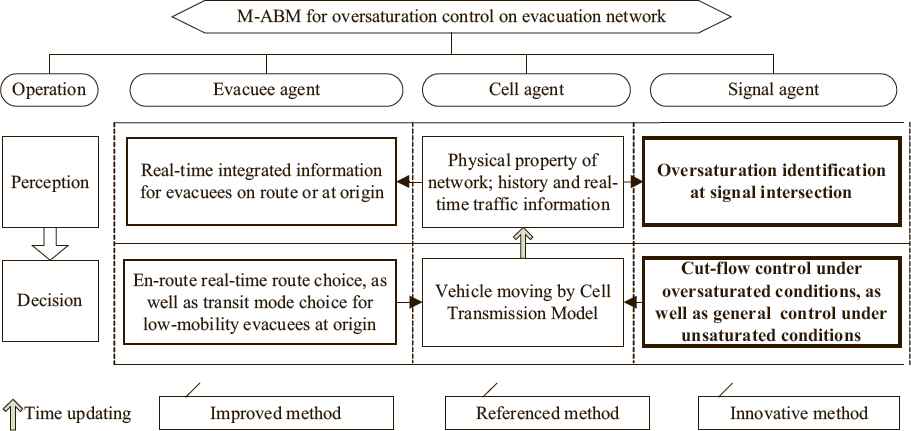
Framework of M-ABM for oversaturation control on evacuation network
Evacuees perceive evacuation-related information collected from cell agents to make the corresponding decisions. The decisions include the transit mode choice of low-mobility evacuees at origin and the en-route real-time route choice of driving evacuees. The majority of participants in developing countries usually travel by transit to attend large-scale activities. Thus these low-mobility evacuees have to make a choice among taxi, bus and metro to evacuate. For instance, more than half attendees in the opening of the 10th National Game in Nanjing Olympic Center of China have chosen transit. The information for transit mode choice and route choice would be different; and thus the investigation of these information options is the starting step in this study. Furthermore, how to employ the fuzzy aggregation approach incorporating the existing uncertain multiple attributes to conduct the decision by each evacuee becomes the second step. When each operation in evacuee agent is finished, the choice ratios regarding transit mode and route are generated. They are used to input the cell agent to direct the intersection turning behavior of each vehicle.
The function in perception period of signal agent is to identify oversaturated intersections. Therefore, provided the traffic data is input from cell agent, the choice of oversaturation index and the oversaturation-state identification of the intersections are the third step of our analysis. As for the fourth step, we treat the unsaturated and oversaturated intersections respectively under the Throttling strategy with three thresholds. The modified signal control (or general control) of Webster’s formula is applied to the former conditions, which can save computational time. Cut-flow control is applied to the latter conditions. At the end of each signal operation, updated signal parameters become the inputs of cell agent to guide the modification of physical property such as road capacity. This modification can cause the parameter updating inside CTM.
CTM (30) is a mesoscopic traffic simulation model offer a compromise between capturing accurate traffic dynamics and computational complexity. Moreover, it is discrete analog of LWR model and thus can capture shockwave when compared to other mesoscopic models. It is extensively embedded in the traffic simulation software, such as Vista (31) and CTMSIM (32). So we do not explain its detailed operation in this study. The interplay of agents of evacuee and signal is achieved within three steps of CTM at each time interval: (1) updated signal parameters are used to set several cell attributes such as capacity; (2) cell flow conservation and transmission are implemented; and (3) updated routing ratios are used to calculate cell occupancy composing of evacuees.
2.1. Information Perception by Evacuee
2.1.1. Utility Attributes for Transit Mode Choice
The transit such as taxi, bus and metro are generally provided for low-mobility evacuees at origin. These evacuees have to choose one of them to leave the affected area. The public transport choosing behavior is affected by a number of criteria including: (1) safety; (2) speed; (3) cost; and (4) comfort. We identify the attributes of each criterion based on the literature review and expert opinions presented in Table 2.
| Criteria | Attribute | Symbol | Definition | References |
|---|---|---|---|---|
| Factors affecting transit-mode choice of low-mobility evacuees | ||||
|
|
||||
| Safety | Lesser accident | LA | How often per year the accidents occur along the chosen route by the vehicle or metro | (33) |
| Personal safety | PS | What is the likelihood the traffic accidents occur in the taken vehicle per driving time | ||
| Speed | Intersection queue | IQ | How long the intersection queue length is most likely to be | (34) |
| Running time | RT | The time spent travelling between specified points | ||
| Waiting time | WT | The time spent for waiting the departure of the vehicle or metro | ||
| Accessibility | AI | How accessible the arriving point to the real destination | ||
| Cost | Travel cost | TC | How much the toll is for the transit riding | (35) |
| Comfort | Cleanliness | CI | How clear the in-vehicle air is | (36) |
| Air conditioning | AC | How comfortable the journey is regarding air temperature | ||
| Seating availability | SA | How comfortable the journey is regarding the seat vacancy rate | ||
| Lesser crowdedness | LC | How congested inside the vehicle | ||
|
|
||||
| Factors affecting en-route path choice of driving evacuees | ||||
|
|
||||
| Safety | Lesser accident | LA | How often per year the accidents occur along the chosen route by the vehicle | (37) |
| Speed | Route length | RL | How long the route length is | (38) |
| Low-grade road ratio | LR | What is the ratio of low-grade road | ||
| Intersection number | IN | Intersection number along the route to reflect the delay | ||
| Queue length | QL | How long the average queue length is before the intersections | ||
| Information availability | Information coverage | IC | What is the VMS ratio along the route | (39) |
| Congestion levelahead | CL | The congestion level of the neighbor links ahead when making en-route path choice | ||
Utility Attributes for Transit Mode Choice and En-Route Path Choice
2.1.2. Utility Attributes for En-Route Path Choice
Driving evacuees may choose an alternative route during the driving period when the originally chosen route is heavily congested. Their real-time route-choice criteria shown in Table 2 include: (1) safety; (2) speed; and (3) information availability.
The running time within the attributes of transit modes is not used in the en-route path choice, because it is not as easy to estimate the running time of private cars as that of public transport. The cars on roads are influenced by each other. So it is hard to predict its travel time even the fuzzy value. While some transit mode such as metro has specific right of dedicated way that enables the transit mode to keep a steady running speed. Another distinction is that people by transit mode cares more about the comfort-related attributes while car driver is prone to grasping the traffic information in the evacuation network.
2.2. Discrete Choice Model by Nesting Fuzzy Aggregation
2.2.1. Logit Model
The eventual probability of people choosing transit mode or route r at time interval τ can be expressed by the following logit model:
2.2.2. Fuzzy Multi-Attribute Utility
To perform the fuzzy aggregation, various techniques have been applied including a fuzzy weighted average, a similarity measure, fuzzy multi-attribute analysis, fuzzy eigenvector method, and fuzzy entropy method. The fuzzy weighted average is an improvement over classical weighting methods. It is widely used in the fields of group decision, multi-objective decision, and quality control. And it will be used in this study. In addition, we will employ severity ranges to describe the uncertain linguistic terms such as lesser accident of the attributes. If the membership functions within these severity ranges are given, the evacuees’ fuzzy perception utility can be acquired by using the following equation incorporating fuzzy operations.
The fuzzy operation in the computation of fuzzy weighted average is an extended algebraic interval operation. This operation can achieve the membership function μỸ with respect to fuzzy perception Ỹ, which is described in literature (13).
Since the output perception variable is expressed by fuzzy numbers, they should be defuzzified into a crisp number to be used as the desired utility. Out of several defuzzification methods, we choose the center of gravity method due to its simplicity and ease of computation. The estimated utility is as follows, where COA(Ỹ) can represent
2.3. Oversaturation Identification at Signal Intersection
2.3.1. Oversaturation Index Choice
Figuratively speaking, the intersection oversaturation is described as the gradual increase of queue length per signal cycle. Traffic spillback at the upstream intersection is its severe phenomenon. The generally used oversaturation indexes, such as delay, stop times, and queue length, can only reflect the temporal concept but do not have any significant spatial features such as the link length or vehicle storage capacity on the link. Even if the aforementioned oversaturation indexes are the same, the variation of physical index on the link may lead to different congestion levels. For instance, a slight congestion phenomenon on long link may be the spillback on short link. Yao et al 2010 applied the queue strength as the oversaturation index (40), which was defined as the ratio of queue length and link length. This index contains both the temporal and spatial features. Therefore, we use this index in this study and define the larger queue strength in all the access links of an intersection as the oversaturation index of this intersection. In the following sections, we use the word of near-spillback index to represent this oversaturation index, because it’s a suitable name to reflect the tempo-spatial picture.
2.3.2. Identification Conditions for Oversaturation Intersection
Throttling strategy is enforced by traffic managers on the oversaturated intersections to mitigate the oversaturation trend and reduce the total evacuation time of the network system. We set three thresholds, including upper threshold (Γu), median threshold (Γm), and lower threshold (Γl) to make oversaturation identification, and thus to coordinate the cut-flow and general control. If the near-spillback index at the intersection at a time τ surpasses Γu (below Γl), then we specify it as oversaturation (unsaturation).
If near-spillback index falls into the range between Γl and Γu, the tempo-spatial feature of the intersection control will be used to conduct the oversaturation identification in this buffer range. The influence of signal parameters at neighbor intersections on the current one and the influence of previous control on the subsequent one are two representative cases. In another word, the status of upstream intersection and the status of current intersection at last time interval will be used together for the oversaturation identification of the current intersection. There are total 8 criterion conditions shown in Table 3, where ρa (τ) means the near-spillback value on link a at time interval τ. We only explain the 3rd and 4th columns provided the near-spillback value is in the range [Γl, Γu] at last time interval: (1) if general control is the control strategy at last time interval, then it remains unsaturated under condition Γl < ρa (τ) ≤ Γm to prevent excessive state switching; but if cut-flow control as well as another condition “near-spillback index at upstream intersection of current time interval is not larger than Γu” are satisfied, then it is specified as specified as oversaturation; (2) if cut-flow control is implemented at last time interval, then it remains oversaturated under condition Γm < ρa (τ) ≤ Γu to prevent excessive state switching; but if general control as well as another condition “near-spillback index at upstream intersection of current time interval is not larger than Γu” are satisfied, then it is specified as unsaturation to ensure a smooth operation of the intersection vehicles.
| Value of near-spillback index and control strategy at last time interval | Value of near-spillback index at current time interval | |||
|---|---|---|---|---|
| ρa (τ) ≤ Γl | Γl < ρa (τ) ≤ Γm | Γm ≤ ρa (τ) < Γu | ρa (τ) ≥ Γu | |
| (ρa (τ−1) ≤ Γl) | (Γl < ρa (τ−1) ≤ Γu & General control) |
Unsaturated | Unsaturated | If-then rule | Oversaturated |
|
|
||||
| (Γl < ρa (τ−1) ≤ Γu & Cut-flow control) | (ρa (τ−1) ≥ Γu) |
Unsaturated | If-then rule | Oversaturated | Oversaturated |
Oversaturation Identification for Object Intersection at Current Time Interval
2.4. Throttling Strategy at Signal Intersection
2.4.1. Initialization with General Control
Two steps are planned for the signal control in the evacuation network: all signal intersections are initialized with general control; and then throttling strategy will replace the general control for all the selected oversaturated intersections. Regarding the general control, we adopt the method based on Webster’s formula (shown in formula 4) to solve the signal cycle and green split of each intersection; and then arrange the phase sequence to reduce the intersection delay once more.
For convenience, the intersection code is not labeled in formula 4. C is signal cycle. L is the total lost time composing of phase-based lost time (D) and all-red time (generally equal to 3 s). S is the ratio of detected flow and saturation flow at the intersection. It is the sum of the corresponding ratios of all the critical lanes. Each critical lane has highest flow compared to other lanes in the same phase. sb is the corresponding flow ratio of critical lane b. A is the yellow time. There are two notes when applying Webster’s formula: (1) the input flow comes from the previous nearest time interval with nonzero value; and the timescale of saturation flow is also equal to the span of previous time interval; (2) the minimal green time for pedestrian crossing should be satisfied when calculating Gb.
The following steps should be implemented to arrange the phase sequence: (1) the signal cycle should be set as 120 s if the calculated result exceeds 120 s; and the span of the current time interval is required to be equal to the maximal signal cycle in all the intersections; (2) each signal cycle should be equal to a number divisible by maximal signal cycle in the network system to ensure the integrity of control strategy at each time interval; and thus the variable C solved by formula 4a should be translated to the approximated number which is divisible by the maximal signal cycle and not less than the original C; (3) there are generally two phase types, denoted as the simultaneous moving of all lane vehicles in an entrance or exit approach during a phase; the choice of phase type relies on the similarity of lane vehicles number; and (4) the phase whose sb is the largest is taken as the initial phase at the beginning of each time interval; and thus the offsets among the intersections are indirectly coordinated to reduce the delay.
2.4.2. Flow-cut control for Oversaturated Intersections
The Webster’s formula is derived from the optimization of total intersection delay under unsaturated conditions. It is not appropriate for the application under oversaturated conditions. If a signal intersection is identified as oversaturated intersection, then flow-cut control will be applied. Evacuation network is generally organized as a one-way traffic system, which can improve the evacuation efficiency by reducing the number of intersection conflicts. The implementation of cut-flow control in the one-way traffic system is coded inside the following box: (1) label the codes of intersections in the order from safety to evacuation points; (2) beginning from the small code of oversaturated intersections, assign the minimal green time for the upstream exit lanes; meanwhile, assign maximal green time for the downstream entrance lanes if their corresponding downstream exit lanes do not approach oversaturated intersections. Cut-flow control may lead to a worst situation that the whole route is oversaturated and the origin is blocked (41). If this situation occurs, the evacuation vehicles can wait at the parking lot until the downstream oversaturation is resolved. Therefore, it is technically feasible to apply the throttling strategy in evacuation.
| Define max_intersection_num overs_intersection |
| ups_cutflow_lanelist downs_releasedflow_lanelist |
| Initialize code=1; |
| For code<max_intersection_num |
| Identify a candidate intersection, intersection(code); |
| If intersection(code) belongs to overs_intersection; |
| Update ups_cutflow_lanelist; |
| Creat outflow_lane(code); |
| If outflow_lane(code) not belongs to |
| ups_cutflow_lanelist |
| Update downs_releasedflow_lanelist; |
| End-If |
| End-If |
| End-For |
Algorithm (Rule) for implementation of throttling strategy at oversaturated intersections
3. Case Study
3.1. Case Field
The Jianye district of Nanjing city in China has a population of 400,000 people and a total area of 80 square kilometers. Its network with 942 links and 288 nodes is shown in the left sub-figure of Figure 3. Assumed terrorist incident is forecasted in Nanjing Olympic Sports Center of Jianye which can hold 87,000 people. The five parking lots surrounding the emergency incident location are denoted by red stars (the one in the bottom-left corner is for transit), and three shelters are denoted by green circles. The shelters from west to east are called Baochuanchang Relic Site, Yueguang Square, and South Lake. The evacuation roads are organized towards north-east as shown in the right sub-figure of Figure 3. The travelers of metro, bus, and taxi are all departing from the transit parking lot. The metro line is a Z-shaped layout. The bus line is dedicated to be the blue route on the left-hand side of Fgure 3b. Taxi drivers have the same route-choice behavior with private drivers. Numbers marked near the intersections are coded in the order from shelters to the five parking lots. The signal light control is canceled in the condition of three-leg intersection. Thus, if downstream neighbor signal intersection of the three-leg intersection is oversaturated, throttling strategy will be implemented in the upstream neighbor signal intersections of this three-leg intersection. Suppose that 47,000 people escape by transit and 10,000 people leave each parking lot by car. A loading curve of evacuation demand is assumed to be approximated by the Rayleigh probability distribution function in literature (42):
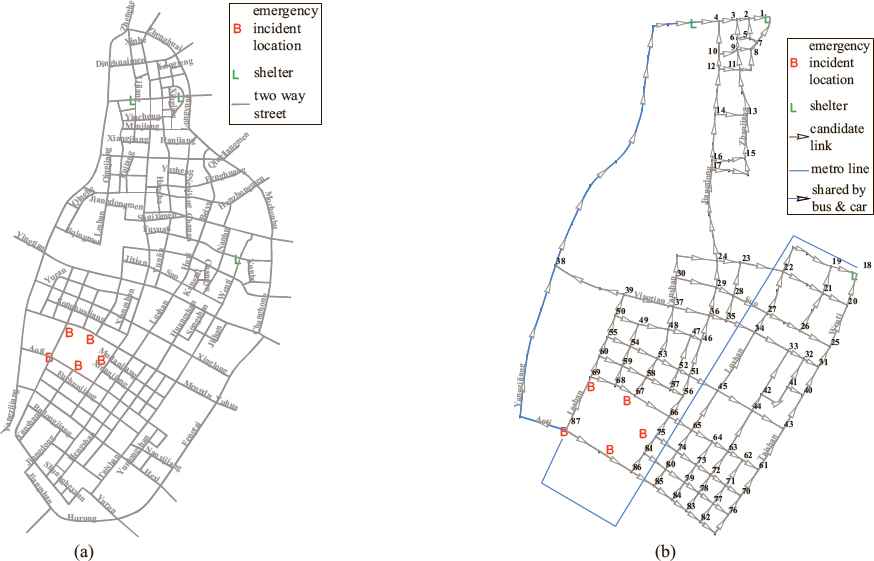
Existing network and candidate links set of Jianye district
3.2. Parameter Assignment for Logit Model
The shape of membership function for each attributes is assumed to be an isosceles triangle. The mean of investigated interval is assigned to each attribute with maximum membership value. The mean and upper values are shown in Table 4, where the left side shows the original values and the right side shows the normalized values. Some attributes, such as running time, lesser crowdedness, and congestion level ahead, are usually variables relying on the dynamic change of traffic flow. But in this paper, the former two variables are assumed to be constant values in order to make a convenient calculation. In addition, different routes have various route attribute values, such as route length, low-grade road ratio, and intersection number. The triangular membership functions of fuzzy weights are shown in Figure 4, where the diamond shows the maximal value and the two endpoints show the edge values of the fuzzy weights.
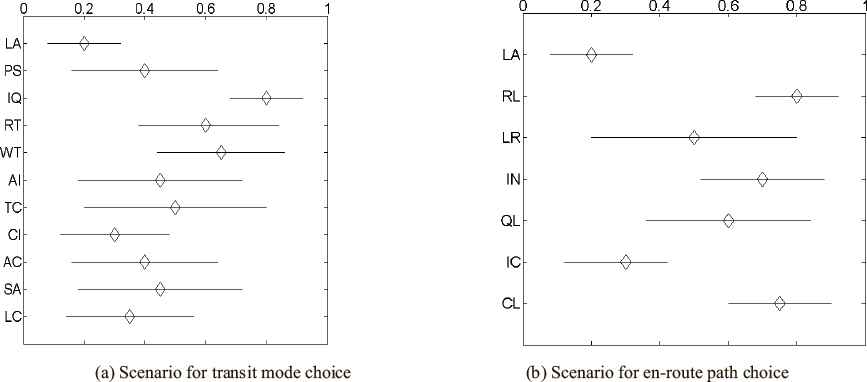
Fuzzy variable weights for each attribute
| Variable | Median (and upper value) of original function | Median of normalized function | ||||
|---|---|---|---|---|---|---|
| Metro | Bus | Taxi & Car | Metro | Bus | Taxi & Car | |
| Variable in transit route | ||||||
|
|
||||||
| LA | 0(0) | 3(5) | 6(10) | 0 | 0.15 | 0.4 |
| PS | 0(0) | 0.002(0.004) | 0.004(0.007) | 0 | 0.2 | 0.4 |
| IQ | 0(0) | 60(100) | 90(140) | 0 | 0.3 | 0.45 |
| RT | 20(23) | 30(35) | 15(20) | 0.33 | 0.5 | 0.25 |
| WT | 4(6) | 10(20) | 3(6) | 0.27 | 0.67 | 0.2 |
| AI | −0.5(−0.3) | −1(−0.6) | −1(−0.6) | −0.25 | −0.5 | −0.5 |
| TC | 3(3) | 2(2) | 30(40) | 0.06 | 0.04 | 0.6 |
| CI | −0.5(−0.4) | −0.2(−0.1) | −0.9(−0.8) | −0.5 | −0.2 | −0.9 |
| AC | −0.8(−0.6) | −0.6(−0.2) | −1(−1) | −0.8 | −0.6 | −1 |
| SA | −0.4(−0.1) | −0.3(−0.1) | −1(−1) | −0.4 | −0.3 | −1 |
| LC | −0.2(−0.1) | −0.2(−0.1) | −1(−1) | −0.2 | −0.2 | −1 |
| Variable for en-route path choice | ||||||
| LA | / | / | 6(10) | / | / | 0.4 |
| RL | / | / | x1(x1) | / | / | x1/50 |
| LR | / | / | x 2(x2) | / | / | x2 |
| IN | / | / | x 3(2·x3) | / | / | x3/50 |
| QL | / | / | 90(150) | / | / | 0.45 |
| IC | / | / | 0.7(1) | / | / | 0.7 |
| CL | / | / | x4/Cap. (2·x4/Cap.) | / | / | X4/Cap. |
Specification of Attribute Number with Triangular Membership Function
Due to the limitation of people’s capability in information handling, column generation technique is used to list at most six alternative shortest routes each time interval. Combined with the θ of 0.05, we use the logit model to generate the transit mode splits and en-route path choice ratios. The results are adopted to join the interplay with the signal optimization process.
3.3. Threshold Choice for Throttling Strategy
Because the change of threshold can influence the control effectiveness, we investigate the influence of various lower and upper thresholds on the total evacuation time (unit: minute) under the assumption that the median threshold is the mean of lower and upper thresholds. The influence is shown in Figure 5, where the bottom right zone is blank because the data are undesirable. Good threshold combinations are distributed around (0.3, 0.6) and (0.5, 0.5). The latter combination may lead to excessive state switching, thus we choose the former combination as a better option to test this evacuation network. The total evacuation time in this combination is 9.6 million minutes, which is reduced by 7.6% compared to the situation of no oversaturation control. The throttling strategy is implemented by software of Matlab R2013b. The total computation time of acquiring the best threshold Figure 6, where the majority of average speeds on evacuation network under throttling strategy are larger than that of original situation.
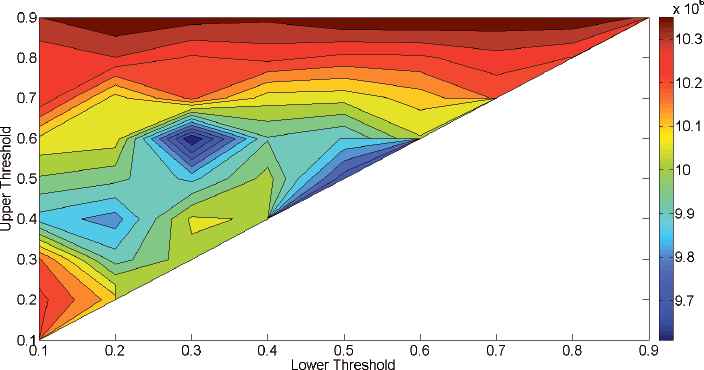
Contour plot of total evacuation time
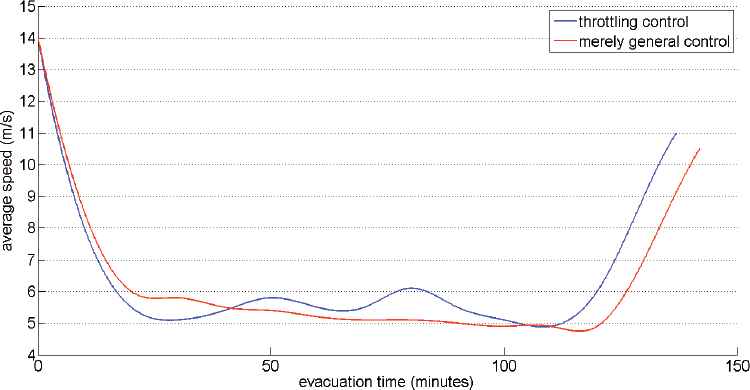
Time-varying of average speed during the evacuation process
4. Conclusion
This study investigated the application of a multi-agent model for oversaturation control on evacuation network. It is used for emergency response in the preparedness plan phase, and thus the predictive traffic is used as the state object of signal optimization. The discrete choice behaviors of internal transit modes and en-route paths are the focus to achieve traffic prediction. Based on the multi-attribute information related to evacuation upper threshold combination (0.3, 0.6) is chosen to implement this throttling strategy, which can transfer the flow from the oversaturated links to unsaturated links. The total evacuation time is reduced by 7.6% during the oversaturation control.
The oversaturation control method developed by the throttling strategy can also be used in other traffic congestion management such as commuter travel condition during peak hours. However, before the findings of this study are used in practical engineering applications, the road should be organized as a one-way network system. The reason is that the rules in throttling strategy are available to coordinate the signal between neighbor intersections of one-way street but the authors do not expand the method to a two-way traffic flow condition. Although some studies use complex self-organization constraints (43) to handle the two-way situation, the authors recommend that future studies may focus on this issue with throttling strategy for its convenience.
| Intersection code | Near-spillback index at varied time intervals with (and without) oversaturation control | |||||||
|---|---|---|---|---|---|---|---|---|
| 13 | 14 | 15 | 16 | 17 | 18 | 19 | 20 | |
| 51 | 0.38(0.39) | 0.37(0.31) | 0.56(0.6) | 0.65(0.52) | 0.31(0.83) | 0.47(0.67) | 0.66(0.63) | 0.35(0.65) |
| 52 | 0.36(0.52) | 0.39(0.75) | 0.56(0.79) | 0.33(0.32) | 0.55(0.57) | 0.67(0.47) | 0.61(0.63) | 0.56(0.6) |
| 58 | 0.5(0.79) | 0.38(0.72) | 0.66(0.78) | 0.57(0.74) | 0.34(0.6) | 034(0.63) | 0.38(0.76) | 0.66(0.58) |
| 65 | 0.37(0.41) | 0.46(0.55) | 0.67(0.46) | 0.38(0.75) | 0.51(0.74) | 0.46(0.84) | 0.39(0.87) | 0.32(0.63) |
| 66 | 0.53(0.71) | 0.37(0.36) | 0.65(0.58) | 0.4(0.54) | 0.6(0.5) | 0.45(0.86) | 0.48(0.36) | 0.31(0.69) |
| 53 | 0.63(0.19) | 0.6(0.13) | 0.5(0.21) | 0.34(0.25) | 0.54(0.24) | 0.36(0.3) | 0.49(0.27) | 0.52(0.3) |
| 54 | 0.33(0.29) | 0.65(0.13) | 0.53(0.24) | 0.36(0.28) | 0.6(0.21) | 0.66(0.32) | 0.34(0.2) | 0.53(0.39) |
| 59 | 0.39(0.17) | 0.44(0.29) | 0.67(0.23) | 0.43(0.25) | 0.43(0.12) | 0.48(0.13) | 0.5(0.38) | 0.42(0.21) |
| 74 | 0.46(0.69) | 0.67(0.46) | 0.33(0.45) | 0.61(0.61) | 0.57(0.71) | 0.5(0.75) | 0.42(0.65) | 0.51(0.7) |
| 80 | 0.57(0.2) | 0.47(0.35) | 0.41(0.12) | 0.51(0.14) | 0.45(0.25) | 0.41(0.2) | 0.63(0.13) | 0.62(0.35) |
Near-Spillback Index of Critical Intersections at Intermediate Time Intervals
Acknowledgements
This research is supported by the National Natural Science Foundation of China (Nos. 51408321, 51278257, 51408190, 51408322, 51508041), Zhejiang Social Science Planning Program (No. 16NDJC015Z), Zhejiang Provincial Natural Science Foundation (Nos. Y15E080035, Q15G020011), Ningbo Natural Science Foundation (Nos. 2015A610162), and K. C. Wong Magna Fund at Ningbo University. The authors appreciate those students from the Southeast University in Nanjing, P. R. China, who participated in data collection and processing.
References
Cite this article
TY  - JOUR
AU  - Zhengfeng Huang
AU  - Pengjun Zheng
AU  - Yanqiang Ma*
AU  - Guiyan Jiang
AU  - Gang Ren
PY  - 2016
DA  - 2016/12/01
TI  - Proactive Control for Oversaturation Mitigation on Evacuation Network: a Multi-Agent Simulation Approach
JO  - International Journal of Computational Intelligence Systems
SP  - 1055
EP  - 1067
VL  - 9
IS  - 6
SN  - 1875-6883
UR  - https://doi.org/10.1080/18756891.2016.1256571
DO  - 10.1080/18756891.2016.1256571
ID  - Huang2016
ER  -