
Recommending degree studies according to students’ attitudes in high school by means of subgroup discovery
- DOI
- 10.1080/18756891.2016.1256573How to use a DOI?
- Keywords
- Subgroup discovery; recommending degree; students’ skills
- Abstract
The transition from high school to university is a critical step and many students head toward failure just because their final degree option was not the right choice. Both students’ preferences and skills play an important role in choosing the degree that best fits them, so an analysis of these attitudes during the high school can minimize the drop out in a posteriori learning period like university. We propose a subgroup discovery algorithm based on grammars to extract itemsets and relationships that represent any type of homogeneity and regularity in data from a supervised context. This supervised context is cornerstone, considering a single item or a set of them as interesting and distinctive. The proposed algorithm supports the students’ final degree decision by extracting relations among different students’ skills and preferences during the high school period. The idea is to be able to provide advices with regard to what is the best degree option for each specific skill and student. In this regard, the use of grammars is essential since it enables subjective and external knowledge to be included during the mining process. The proposed algorithm has been compared against different subgroup discovery algorithms, achieving excellent results. A real-world experimental analysis has been developed at King Abdulaziz University, one of the most important universities in Saudi Arabia, where there is a special interest in introducing models to understand the students’ skills to guide them accordingly.
- Copyright
- © 2016. the authors. Co-published by Atlantis Press and Taylor & Francis
- Open Access
- This is an open access article under the CC BY-NC license (http://creativecommons.org/licences/by-nc/4.0/).
1. Introduction
The transition from high school 13 to university is not always an easy change and many students head toward failure. From time to time, this lack of success is caused by typical reasons of the students’ age, whose freedom to plan their learning processes and the flexibility of the university schedules give rise to a massive drop out 2. Nevertheless, this failure could also be caused by different factors 21,24 whose origin is the wrong decision of the students in choosing the right degree to be studied.
A major problem in many countries is the drop out rates in any level of the learning process and, specifically, in higher education like university studies. According to the European Union report on education and training, Italy, Hungary and Poland are the least successful European Union countries in term of higher education completion 12. In other different countries, like Saudi Arabia, the drop out rate is also growing, reaching an alarming thirty percent during the last years 1. A combination of factors leads to drop-out and many countries around the world tackle the problem by policies that offer financial support to students or even by introducing special programs to understand the skills and interests of students to guide them accordingly.
Educational data mining 28,29 and building measures to analyse the students’ behaviours 6,7 can have a positive impact on reducing drop-out 15,26. This analysis of the students’ skills and attitudes during the high school can minimize the drop out in a posteriori learning period like university. Pattern mining techniques 22 might be really useful in this regard, seeking for intrinsic and important properties of datasets, and representing any type of homogeneity and regularity in data. These patterns can also be applied to a supervised context, where a single item or a set of them is considered as interesting and distinctive, and their goal is to obtain relationships between these items and the others 25.
The aim of this paper is to propose a subgroup discovery 14 algorithm based on grammars 23. Subgroup discovery is considered as a broadly applicable 8 data mining technique whose aim is to discover some interesting relationships between patterns with respect to a specific context considered as interesting and distinctive. The information extracted by this data mining technique is normally represented in the form of rules according to the user’s interest, so the use of grammars is essential since they enable subjective and external knowledge to be included during the mining process. The proposed algorithm supports the students’ final degree decision by extracting relations among different students’ skills and preferences during the high school period. The idea is to propose a decision support system 19 based on a subgroup discovery 27 algorithm to provide advices with regard to what is the best degree option for each specific skill and student.
The proposed algorithm has been compared against different subgroup discovery algorithms, achieving excellent results. Additionally, a real-world problem has been considered. This experimental analysis has been developed at King Abdulaziz University, one of the most important universities in Saudi Arabia, where there is a special interest in introducing models to understand the students’ skills to guide them accordingly. This experimental stage were carried out by taking students for the last three non-stop years. In this study, we analyse whether the grade point average (GPA) is a real indicator of the degree a student should enrol in since, traditionally, the higher the GPA of a student the higher the number of degrees in which he/she could be enrolled. In this study, we also consider whether the final marks obtained in different subjects are relevant indicators about the best degree for a specific student, and whether a student could know at an early age the degree he/she should study. The final idea is to be able to establish mechanisms to modify the students’ skills at early ages, so they could be able to study the degree they really want to study. Educators have the conviction that those students that really take the degree they originally wanted, and also having the suitable skills for such degree, then they hardly drop out.
This paper is structured as follows. A description of subgroup discovery is included and the most relevant related work is presented in Section 2. Section 3 describes the model proposed including the methodology and the subgroup discovery algorithm as well as its main characteristics. A comparison against different subgroup discovery algorithms has been carried out (Section 4.1), and a detailed application case is provided in Section 4.2, which discusses the results and how the experiments have replied the some research questions. Finally, Section 5 presents some concluding remarks.
2. Preliminaries
In the following subsections, a brief description of subgroup discovery (SD) and some related work in this field are given.
2.1. The Subgroup Discovery Task
The SD task was first described by Klösgen 18 and Wrobel 33 as follows: “Given a population of individuals (customers, objects, etc.) and a property of those individuals that we are interested in, the task of SD is to find population subgroups that are statistically most interesting for the user, e.g., subgroups that are as large as possible and have the most unusual statistical characteristics with respect to a target attribute of interest”. According to its definition, SD combines features of both supervised and unsupervised learning tasks 20.
SD is considered as a broadly applicable data mining technique whose aim is to discover some interesting relationships between patterns with respect to a specific context considered as interesting and distinctive. The information extracted by this data mining technique is normally represented in the form of rules according to the user’s interest, and this information should be easily understandable by users, i.e., rules having a clear structure and few variables or attributes 14. Those rules are also required to be of high interest and cover as many examples of the specific context as they can.
In the SD field 31, any subgroup is represented through independent rules of the type IF Antecedent THEN Target, where Target means the variable marked as interesting and distinctive. The left hand side of a rule in SD comprises a conjunction of conditions (attribute-value pairs) defined as Antecedent, which enables the distribution of the subgroup to be described.
The choice of good quality measures in SD is a widely studied field, and a great variety of measures have been proposed by different researchers 11. Herrera et al. 14 considered the interpretability of the subgroups by describing some quality measures that are denoted as complexity measures. Two of these quality measures are the number of rules and the number of variables in the antecedent, and they state for the simplicity of the knowledge extracted.
Considering the quality of the subgroups according to the patterns covered, the most commonly used measure is support based on the examples of the target value, also known as sensitivity, a generality measure formally described in Equation 1. Let us consider a subgroup in the form of a rule R, the sensitivity of this subgroup R is defined as the fraction of retrieved transactions T that are relevant, i.e., the percentage of transactions from the dataset D that satisfy the antecedent Antc and the class (target value) of the rule on the basis of examples of the class.
As for precision measures in SD, confidence is one of the most commonly used, determining the reliability of a subgroup. It measures the relative frequency of examples that satisfy the complete rule among those satisfying only the antecedent (see Equation 2).
Finally, a really interesting and widely used quality measure in the SD field is the unusualness, which is considered as the weighted relative accuracy of a rule measures interest and a trade-off between generality and precision. It can be computed as shown in Equation 3.
2.2. Related Work
Since the concept of SD was first introduced by Klösgen 18 and Wrobel 33, this task has been studied by many researchers and a number of algorithms have been proposed 14,23. First approaches in the SD field were proposed as extensions of existing classification algorithms 16,17.
Classical or not evolutionary algorithms developed so far are very time consuming and they require a high memory with the increment of data size 14. Besides, a major problem of this type of algorithms is their inability to be applied on numerical domains, requiring a previous discretization step to transform numerical features into a set of discrete values. Many researchers analysed these drawbacks in order to deal with the SD problem from an evolutionary perspective 4, considering the task as an optimization problem. Most of existing evolutionary algorithms 32 in the SD field are based on a “chromosome = rule” approach, where each solution to the problem codifies a single rule and the whole resulting set is provided by a combination of several individuals. Other evolutionary approaches 3,10 are based on fuzzy systems to solve the discretization problem. These approaches formerly require a fixed number of linguistic labels, so previous knowledge about the domain under study is mandatory.
The extraction of subgroups of interest has been also considered as a multi-objective methodology 5, optimizing more than one quality measure at time. In multi-objective optimization, solutions of a specific iteration are organized in fronts 9 based on the objectives to be optimized. Thus, solutions from the first front are better than solutions from the second front, and so on. As for the solution from a specific front, none is better than the other solutions in the same front for all the objectives, so all of them are equally acceptable.
3. Proposed model
With the aim of obtaining useful information that could be used by students in their future decision about the degree to be enrolled in, we propose a model able to analyse the students’ preferences and skills in order to recommend a specific degree based on the students’ characteristics. Through this model, the students could be able to know both the degree that best fits to them and the specific subjects required to be studied in depth in case that they want to course a specific degree and they do not have the skills to do it yet.
3.1. Methodology
The final idea behind the proposed methodology is to avoid having students that are not appropriate for specific degrees, minimizing the risk of dropping out because of this issue. The proposed methodology (see Figure 1) is as follows:
- •
Step 1: Collecting and anonymizing data. Personal data are gathered from people that have just enrolled in a specific degree. All the personal information should be anonymized and the students’ names are required to be replaced by a student identification number. It is interesting to obtain data from the last years and comprising information about students from different degrees: Computer Science, Engineering, Medicine, etc.
- •
Step 2: Cleaning data. Many incomplete students’ information and irrelevant features have to be removed. Personal data is not relevant in the proposed model, so information about whether students are single, married or divorced should be omitted. Additionally, information about students’ economic situation are not considered, focusing only on skills and preferences about the specific degree that best fits to them.
- •
Step 3: Subgroup discovery algorithm. This model proposes an evolutionary subgroup discovery algorithm, which is able to deal with either continuous and discrete variables. This is an important feature since the data gathered includes information about the final mark of the students, which is inherently a continuous value. Like any subgroup discovery algorithm, the approach used in this methodology searches for subgroup of interest for the users, and these subgroups are formed by using a specific property users are interested in. In the proposed system, we consider the degree in which students enrol in as the feature to group students. The aim is to discover features that define characteristics of interest to define students’ preferences and skills.
- •
Step 4: Keeping rules. Interesting rules are stored in the learning database, which are analysed in a posteriori step. Step 3 could be run more than once, increasing the number of rules to be discovered and, therefore, the knowledge extracted.
- •
Step 5: Providing knowledge. The set of rules discovered are provided, denoting specific features and preferences to be considered before enrolling in a particular degree. Despite the fact that the system provides useful information about the best degree, the final decision will be made by the students.
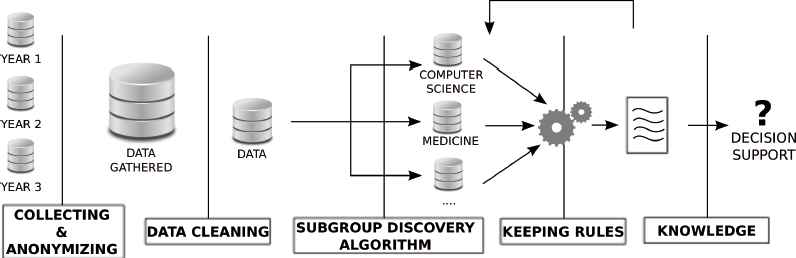
Proposed methodology to determine the best degree according to the students’ preferences and skills.
3.2. Subgroup discovery algorithm
In the subgroup discovery field 14, the main aim is to discover some interesting relationships between patterns with respect to a specific context considered as interesting and distinctive. The information extracted by any subgroup discovery algorithm is normally represented in the form of rules according to the user’s interest. In this sense, the algorithm proposed to be included in the methodology previously described is an evolutionary approach based on grammars. This approach enables subjective and external knowledge to be included during the mining process, so it is of high relevance for the problem under study: recommending degree studies according to students’ skills and attitudes.
Subgroups in the proposed algorithm are represented and encoded by means of a context-free grammar G (see Figure 2) whose language is defined as L(G)= {(Condition AND)nCondition → Target : n ⩾ 0}. Therefore, using the aforementioned language, the grammar G enables rules having at least one condition in the antecedent to be obtained, whereas the consequent is defined by a target variable. Using this grammar it is possible to mine any subgroup containing either numerical or discrete features, which is an important feature of including grammars into the mining process since the encoding of any solution can be adapted to the user’s aim and knowledge.
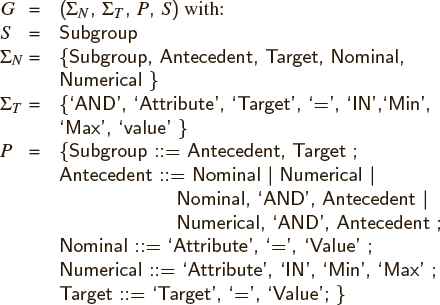
Context-free grammar used to represents subgroups in the proposed algorithm
The proposed algorithm (see Figure 3) for mining subgroups of interest is an evolutionary approach that follows an iterative rule learning model, running a complete evolution (a predefined number of generations) for each specific value of a target feature iteratively. Once this generational procedure is finished, the best rules for a specific target value are returned as bestsubgroups. This procedure is repeated for a new value of the target feature, and the number of repetitions depends on the number of distinct values for the target features.
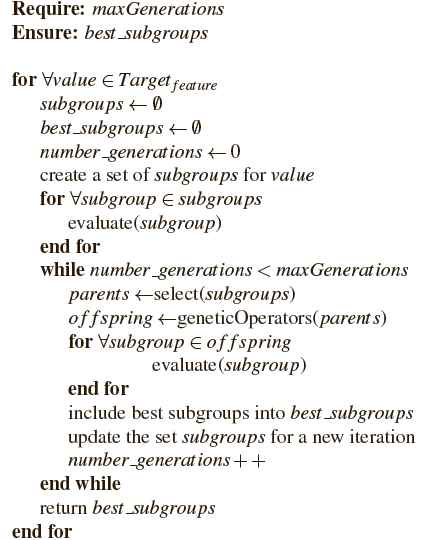
Pseudo-code of the proposed evolutionary algorithm for mining subgroups.
The aim of any evolutionary approach is to seek for solutions having a high fitness value, improving the solutions along the evolutionary process. The proposed algorithm considers the support based on the examples of the target value, or sensitivity (see Equation 1) and precision (see Equation 2) as quality measures to be maximized. In this regard, the aim is to discover rules (a rule R defined in the form Antc → Target) with a high fitness value for the function fitness(R)= sensitivity(R) × confidence(R). A high fitness function value enables measures of generality (considering the support based on examples of the target value as shown in Equation 1) and precision (see Equation 2) to be optimized. Additionally, highly frequent subgroups imply some measures of complexity to be indirectly optimized, e.g. the number of variables in the antecedent of the rule will be smaller to obtain more frequent subgroups.
In each generation of the proposed algorithm (see Figure 3), new individuals are obtained by applying some genetic operators. In this regard, the algorithm selects a subset of solutions from the set subgroups and this subset is used to work as parents. This subset of parents is used to obtain new solutions in the specific generation by applying crossover and mutation as genetic operators. The crossover genetic operator is applied to pairs of solutions from the set parents, and each of these pairs exchange conditions from the rule, giving rise to new solutions having conditions from the two parents. Then, the mutation genetic operator is applied to different solutions with a specific probability. This genetic operator works by selecting a random condition from the rule and creating a new condition completely different.
4. Experimental study
The aim of this section is twofold. First, a complete study of the performance of the proposed subgroup discovery algorithm is carried out, comparing it against well-known algorithms in the subgroup discovery field. Second, the proposed approach is applied to a real-world case of study, discovering students’ preferences and final degree decision according to their attitudes in high school.
4.1. Performance of the proposed algorithm
In this experimental stage, a series of SD algorithms were compared in detail, including NMEEF-SD 3, SDIGA 10 and MESDIF 5. Additionally, classic SD algorithms such as CN2-SD 20 and Apriori-SD 17, were also included in the study. Next, a number of nonparametric tests were performed, demonstrating the effectiveness of the proposed approach and its ability to discover subgroups with a low complexity. All the experiments were carried out over the same ten-fold cross-validation for each dataset. The experimentation was undertaken using 30 datasets from the UCI repository.* As far as the evolutionary algorithms are concerned, the optimal parameters were the ones given by the authors and analyzed in 3. The results obtained (see Table 1) by each algorithm are the average results obtained after running each one ten times. The results obtained for each quality measure are the average results for the set of subgroups discovered. Finally, it is noteworthy to mention that the results used in this comparison are those given by 3 and publicly available online.†
| Sensitivity | Confidence | Unusualness | ||||||||||
|---|---|---|---|---|---|---|---|---|---|---|---|---|
|
|
||||||||||||
| Dataset | NMEEF-SD | MESDIF | SDIGA | Proposal | NMEEF-SD | MESDIF | SDIGA | Proposal | NMEEF-SD | MESDIF | SDIGA | Proposal |
| Appendicitis | 1.000 | 0.785 | 0.950 | 0.667 | 0.906 | 0.703 | 0.701 | 0.717 | 0.098 | 0.040 | 0.092 | 0.064 |
| Australian | 0.783 | 0.577 | 0.591 | 0.855 | 0.930 | 0.807 | 0.793 | 0.858 | 0.171 | 0.060 | 0.120 | 0.177 |
| Balance | 0.530 | 0.318 | 0.501 | 0.648 | 0.698 | 0.557 | 0.636 | 0.618 | 0.070 | 0.022 | 0.050 | 0.072 |
| Breast-w | 0.846 | 0.710 | 0.674 | 0.671 | 0.955 | 0.896 | 0.852 | 0.966 | 0.162 | 0.116 | 0.118 | 0.134 |
| Bridges | 0.698 | 0.438 | 0.505 | 0.673 | 0.935 | 0.575 | 0.637 | 0.723 | 0.036 | 0.017 | 0.024 | 0.029 |
| Bupa | 0.903 | 0.598 | 0.966 | 0.278 | 0.624 | 0.516 | 0.551 | 0.861 | 0.029 | 0.015 | 0.034 | 0.050 |
| Car | 0.439 | 0.355 | 0.041 | 0.439 | 1.000 | 0.312 | 0.214 | 1.000 | 0.092 | 0.026 | 0.002 | 0.092 |
| Chess | 0.590 | 0.709 | 0.083 | 0.363 | 0.941 | 0.744 | 0.096 | 0.997 | 0.138 | 0.085 | 0.005 | 0.090 |
| Cleveland | 0.681 | 0.496 | 0.130 | 0.721 | 0.860 | 0.277 | 0.128 | 0.754 | 0.135 | 0.020 | 0.011 | 0.108 |
| Dermatology | 0.986 | 0.802 | 0.001 | 0.570 | 0.934 | 0.794 | 0.003 | 0.904 | 0.199 | 0.098 | 0.000 | 0.079 |
| Diabetes | 0.861 | 0.533 | 0.812 | 0.557 | 0.698 | 0.697 | 0.671 | 0.793 | 0.029 | 0.018 | 0.035 | 0.072 |
| Echo | 0.628 | 0.476 | 0.704 | 0.415 | 0.757 | 0.582 | 0.594 | 0.638 | 0.043 | 0.019 | 0.030 | 0.032 |
| German | 0.746 | 0.517 | 0.177 | 0.483 | 0.784 | 0.637 | 0.313 | 0.880 | 0.040 | 0.022 | 0.006 | 0.069 |
| Glass | 0.579 | 0.311 | 0.532 | 0.589 | 0.799 | 0.233 | 0.363 | 0.613 | 0.035 | 0.005 | 0.013 | 0.070 |
| Haberman | 0.933 | 0.637 | 0.837 | 0.661 | 0.803 | 0.512 | 0.635 | 0.642 | 0.050 | 0.012 | 0.042 | 0.023 |
| Hayesroth | 0.117 | 0.000 | 0.354 | 0.093 | 0.400 | 0.000 | 0.629 | 0.387 | 0.022 | 0.000 | 0.037 | 0.018 |
| Heart | 0.770 | 0.584 | 0.852 | 0.541 | 0.777 | 0.775 | 0.616 | 0.756 | 0.104 | 0.058 | 0.059 | 0.082 |
| Hepatitis | 0.750 | 0.645 | 0.550 | 0.690 | 0.869 | 0.714 | 0.582 | 0.659 | 0.053 | 0.026 | 0.019 | 0.056 |
| Hypothyroid | 0.958 | 0.667 | 0.699 | 0.848 | 0.978 | 0.733 | 0.788 | 0.905 | 0.022 | 0.016 | 0.013 | 0.031 |
| Ionosphere | 0.910 | 0.638 | 0.367 | 0.672 | 0.884 | 0.734 | 0.662 | 0.851 | 0.148 | 0.056 | 0.036 | 0.105 |
| Iris | 0.987 | 0.846 | 0.979 | 0.953 | 0.983 | 0.929 | 0.906 | 0.943 | 0.187 | 0.134 | 0.165 | 0.204 |
| Led | 0.786 | 0.818 | 0.713 | 0.840 | 0.624 | 0.377 | 0.720 | 0.653 | 0.064 | 0.045 | 0.058 | 0.067 |
| Lymp | 0.516 | 0.605 | 0.078 | 0.556 | 0.630 | 0.633 | 0.071 | 0.784 | 0.094 | 0.073 | 0.004 | 0.102 |
| Marketing | 0.244 | 0.486 | 0.020 | 0.458 | 0.265 | 0.200 | 0.093 | 0.799 | 0.032 | 0.019 | 0.002 | 0.067 |
| Mushrooms | 0.816 | 0.830 | 0.001 | 0.813 | 0.960 | 0.786 | 0.034 | 0.925 | 0.195 | 0.124 | 0.000 | 0.186 |
| Nursery | 0.890 | 0.382 | 0.120 | 0.906 | 0.890 | 0.480 | 0.670 | 0.999 | 0.198 | 0.043 | 0.020 | 0.201 |
| Tic-tac-toe | 0.584 | 0.304 | 0.152 | 0.559 | 0.799 | 0.747 | 0.824 | 0.777 | 0.069 | 0.042 | 0.026 | 0.066 |
| Vehicle | 0.000 | 0.606 | 0.417 | 0.422 | 0.000 | 0.439 | 0.332 | 0.639 | 0.000 | 0.027 | 0.016 | 0.064 |
| Vote | 0.946 | 0.827 | 0.802 | 0.943 | 0.979 | 0.957 | 0.891 | 0.958 | 0.217 | 0.187 | 0.180 | 0.216 |
| Wine | 0.827 | 0.683 | 0.677 | 0.789 | 0.920 | 0.897 | 0.803 | 0.930 | 0.107 | 0.042 | 0.058 | 0.165 |
|
|
||||||||||||
| Average | 0.710 | 0.573 | 0.476 | 0.622 | 0.781 | 0.598 | 0.517 | 0.793 | 0.095 | 0.049 | 0.043 | 0.093 |
| Standard deviation | 0.250 | 0.190 | 0.330 | 0.200 | 0.230 | 0.240 | 0.280 | 0.150 | 0.070 | 0.040 | 0.050 | 0.060 |
| Variance | 0.064 | 0.038 | 0.107 | 0.041 | 0.052 | 0.056 | 0.081 | 0.022 | 0.004 | 0.002 | 0.002 | 0.003 |
|
|
||||||||||||
| Ranking | 1.683 | 2.833 | 3.100 | 2.383 | 1.583 | 3.233 | 3.367 | 1.816 | 1.683 | 3.433 | 3.267 | 1.617 |
Comparison among different evolutionary algorithms
In order to analyze the results obtained, a series of statistical tests were carried out. The Friedman test is used to compare the results obtained and to be able to precisely analyze whether there are significant differences among the four algorithms. If the Friedman test rejects the null-hypothesis indicating that there are signicant differences, then a Bonferroni-Dunn test is performed to reveal these differences.
Analyzing the results obtained for the sensitivity and confidence quality measures, and using the Friedman statistic, values of 20.730 and 46.730 were obtained for these measures, respectively. None of these values belong to the interval [0, (FF)0.01, 3, 87 = 4.015], so it is possible to reject the null-hypothesis that all algorithms perform equally well for these two measures. Focusing on the sensitivity measure and using the Bonferroni-Dunn test, which gives a critical difference (CD) value of 0.709 for p = 0.1; 0.798 for p = 0.05; and 0.979 for p = 0.01; it is possible to assert that there are significant differences between our proposal and SDIGA using a p-value of 0.1. On the contrary, there is no significant differences betwee NMEEF-SD and our proposal at any p-value. However, the average sensitivity value obtained by NMEEF-SD is greater than the one obtained by our proposal.
As for the confidence quality measure, there are significant differences between our proposal and both MESDIF and SDIGA at a significance level of p = 0.01. Similarly to the sensitivity measure, there is no significant difference between NMEEF-SD and our proposal. Nevertheless, our proposal obtain an average confidence value greater than NMEEF-SD and a lower standard deviation.
Continuing the analysis of the results shown in Table 1, and focusing on the unusualnes measure, the Friedman statistic considering reduction performance gets a value of 52.310, not belonging to the interval [0, (FF)0.01, 3, 87 = 4.015], so it is possible to reject the null-hypothesis that all algorithms perform equally well for this measure. According to the Bonferroni-Dunn test, and using a significance level of p = 0.01, it is possible to assert that there are significant differences between MESDIF, SDIGA and our proposal, the latter being statistically better.
To sum up this analysis, our proposal is statistically better than MESDIF and SDIGA using all the measures. Only using the sensitivity measure it is not possible to assert that there are significant differences between our proposal and MESDIF. However, despite the fact that it is not possible to assert it, the ranking obtained by our algorithm in this measure is better than the one obtained by the MESDIF algorithm.
Finally, a comparison between our proposal and the classical algorithms for SD is carried out (see Table 2). In this regard, a subset of the 20 datasets was used, since classical algorithms do not work properly with high dimensionality. Similarly to the preivous analysis, notice that the results are publicly provided ‡.
| Sensitivity | Confidence | Unusualness | |||||||
|---|---|---|---|---|---|---|---|---|---|
|
|
|||||||||
| Dataset | CN2-SD | Apriori-SD | Proposal | CN2-SD | Apriori-SD | Proposal | CN2-SD | Apriori-SD | Proposal |
| Appendicitis | 0.542 | 0.688 | 0.667 | 0.205 | 0.802 | 0.717 | 0.053 | 0.094 | 0.064 |
| Australian | 0.603 | 0.592 | 0.855 | 0.737 | 0.786 | 0.858 | 0.070 | 0.078 | 0.177 |
| Balance | 0.478 | 0.431 | 0.648 | 0.555 | 0.814 | 0.618 | 0.055 | 0.070 | 0.072 |
| Breast-w | 0.911 | 0.567 | 0.671 | 0.949 | 0.965 | 0.966 | 0.191 | 0.103 | 0.134 |
| Bridges | 0.505 | 0.410 | 0.673 | 0.407 | 0.683 | 0.723 | 0.034 | 0.047 | 0.029 |
| Bupa | 0.500 | 0.514 | 0.278 | 0.565 | 0.485 | 0.861 | 0.020 | −0.004 | 0.050 |
| Car | 0.627 | 0.367 | 0.439 | 0.728 | 0.899 | 1.000 | 0.075 | 0.051 | 0.092 |
| Cleveland | 0.425 | 0.655 | 0.721 | 0.206 | 0.851 | 0.754 | 0.026 | 0.084 | 0.108 |
| Diabetes | 0.515 | 0.290 | 0.557 | 0.725 | 0.803 | 0.793 | 0.029 | 0.039 | 0.072 |
| Echo | 0.467 | 0.632 | 0.415 | 0.153 | 0.574 | 0.638 | 0.002 | 0.025 | 0.032 |
| German | 0.416 | 0.306 | 0.483 | 0.712 | 0.746 | 0.880 | 0.022 | 0.039 | 0.069 |
| Haberman | 0.500 | 0.772 | 0.661 | 0.673 | 0.817 | 0.642 | 0.009 | 0.023 | 0.023 |
| Hayesroth | 0.548 | 0.224 | 0.093 | 0.320 | 0.576 | 0.387 | 0.099 | 0.053 | 0.018 |
| Heart | 0.594 | 0.592 | 0.541 | 0.800 | 0.831 | 0.756 | 0.094 | 0.083 | 0.082 |
| Hepatitis | 0.604 | 0.431 | 0.690 | 0.637 | 0.632 | 0.659 | 0.035 | 0.044 | 0.056 |
| Iris | 0.925 | 0.815 | 0.953 | 0.819 | 0.917 | 0.943 | 0.177 | 0.133 | 0.204 |
| Led | 0.790 | 0.711 | 0.840 | 0.408 | 0.663 | 0.653 | 0.053 | 0.048 | 0.067 |
| Tic-tac-toe | 0.325 | 0.293 | 0.559 | 0.755 | 0.762 | 0.777 | 0.043 | 0.038 | 0.066 |
| Vote | 0.858 | 0.800 | 0.943 | 0.932 | 0.930 | 0.958 | 0.176 | 0.147 | 0.216 |
| Wine | 0.863 | 0.742 | 0.789 | 0.957 | 0.934 | 0.930 | 0.181 | 0.140 | 0.165 |
|
|
|||||||||
| Average | 0.600 | 0.542 | 0.624 | 0.612 | 0.774 | 0.776 | 0.072 | 0.067 | 0.090 |
| Standard deviation | 0.180 | 0.190 | 0.210 | 0.250 | 0.130 | 0.150 | 0.060 | 0.040 | 0.060 |
| Variance | 0.031 | 0.035 | 0.046 | 0.063 | 0.018 | 0.023 | 0.004 | 0.002 | 0.004 |
|
|
|||||||||
| Ranking | 1.900 | 2.450 | 1.650 | 2.650 | 1.750 | 1.600 | 2.250 | 2.275 | 1.475 |
Comparison among different classical algorithms
Focusing on Table 2 and considering senstivity measure, the Friedman test obtains a F measure equal to 3.823, which belongs to the critical interval [0, (FF)0.01, 2, 38 = 5.211], indicating that there are no significant differences between the algorithms because the null-hypothesis was not rejected. Despite the fact that there are no significant differences, our proposal appears as the algorithm that obtains the best ranking in sensitivity.
As for the confidence quality measure, the Friedman test obtains a F value of 9.044, which does not belong to the critical interval [0, (FF)0.01, 2, 38 = 5.211], so it is possible to reject the null-hypothesis that all algorithms perform equally well using this measure. Using the Bonferroni-Dunn test, at a significance level of p = 0.01, there are significant differences between our proposal and CN2-SD, the former being statistically better. On the contrary, there are not significant differences with regard to Apriori-SD, but our proposal obtains a higher ranking for this measure. Finally, as for the unusualness, a value of 4.956 is obtained for Friedman, which belongs to the critical interval [0, (FF)0.01, 2, 38 = 5.211], indicating that there are no significant differences among the algorithms. Nevertheless, it should be noted that our proposal obtains the best ranking.
To sum up, the proposed algorithm behaves really well when it is compared against different well-known algorithms for subgroup discovery. In many quality measures, our proposal obtains the best ranking and the best average values. All these results are really interesting since our proposal is able to introduce subjective knowlege by means of a context free grammar and obtaining quite promising average results. Hence, the introduction of subjective knowledge into the mining process does not worsen the results.
4.2. Real-world application field
This research study is applied at King Abdulaziz University, which aims to investigate and model students’ preferences and final degree decision according to their attitudes in high school. In this regard, we use a population under investigation that consists of all the students enrolled in one of the following degrees: Computer Science, Engineering, Medicine, and Other. Data were gathered from three non-stop years, considering information about 5,260 students just in their first year of the degree. The remain students, those in the second year of their degree, were not examined for this study since the idea is to analyse the specific degree that students usually enrol in once their preferences and attitudes are considered.
This study has been carried out using students’ data from the King Abdulaziz University, Saudi Arabia. The University’s Deanship of Admission has approved the use of this data for this research. Any personal information has been anonymized so that any information pointing to individual identification has been omitted.
Analysis.
Data comprises information about 5,260 students, and this information is stored in 11 different attributes (see Table 3). The first attribute is an unique student identifier that replaces the name of the student in the original database, therefore the personal information is omitted and data is anonymized. In a second attribute, we obtain information about the students’ gender, which is very useful since the male-female ratio in different universities is influenced by the type of subjects on offer 30. The data analysis (see Figure 4) reveals that male students usually choose Computer Science or a degree different to Engineering or Medicine. On the contrary, female students do not present a high deviation between the degrees offered in King Abdulaziz University, so these students do not have a specific preference which is probably caused by the novelty of female in continuing their higher studies. It should be noted that it was not until 2009 when an expert on girls’ education became the first woman minister in Saudi Arabia, providing one of the world’s largest scholarship programs so many female students earned scholarship programs.
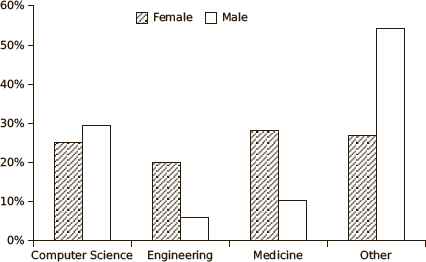
Distribution of the degree chosen by students based on the gender.
| Attribute | Values |
|---|---|
| Student_id | Unique numeric identifier |
| Gender | Female, Male |
| Biology | F, D, D+, C, C+, B, B+, A, A+ |
| Mathematics | F, D, D+, C, C+, B, B+, A, A+ |
| Computers Introd. | F, D, D+, C, C+, B, B+, A, A+ |
| Physics | F, D, D+, C, C+, B, B+, A, A+ |
| Chemics | F, D, D+, C, C+, B, B+, A, A+ |
| GPA | Range: from 0 to 5 |
| Desire | Computer Science, Engineering, Medicine, Other |
| College | Computer Science, Engineering, Medicine, Other |
Data information gathered from a three years study at King Abdulaziz University
Following with the data analysis, the next five attributes correspond to the five most important subjects in Saudi high schools. The grading system used in these subjects follow the one used in most of the schools and universities in Saudi Arabia. A grade of excellent (A+ and A) corresponds to 5.0 and 4.75 GPA values, respectively. A very good grade (B+ and B) is represented as 4.5 and 4.0 GPA values. A C+ and C grade, which mean a good grade, is represented as 3.5 and 3.0, respectively. The grade of acceptable (D+ and D) is given by 2.5 and 2.0 as GPA values. Finally, a failure (F) is represented as 1.0 GPA value.
Finally, two attributes describe both the degree desired by the students during the high school and the degree in which they definitely enrol in. As mentioned above, the degrees in which students could enrol in were divided into: Computer Science, Engineering, Medicine, and Other. As can be observed, the dataset does not contain any personal information which may lead to individual identification, fulfilling the privacy preservation requirements by law.
Experimental results.
This section assesses the knowledge extracted by the proposed system, providing useful information about the students’ preferences and skills to properly decide the appropriate degree to enrol in. It may be used to prevent students to be enrolled in degrees in which they are not skilled.
The proposed grammar (see Figure 2) has been modified to extract specific knowledge based on the user’s background. For instance, in a first analysis, the GPA value is fixed in the antecedent of the rule, so the grammar enables just rules having this fixed attribute to be extracted. Then, in a second analysis, the grammar is also modified in order to extract subgroups in the form of rules having information about the final mark in different subjects of the degree to be enrolled. All of this led us to the conclusion that the use of grammars is essential for this analysis.
In order to analyse the knowledge extracted, we have divided the information into groups according to the characteristics. In a first group, we are analysing the subgroups that share information about the GPA value. Table 4 depicts a set of rules that describe different behaviours in this sense. Rule number 1 describes that 97.6% of the students that study a degree different than Computer Science, Medicine or Engineering, have obtained a GPA value between 0.52 and 3.57. Furthermore, if a student has obtained a GPA value between 0.52 and 3.57, then he/she studies other degree with a probability of 96.4%. Rule number 2 describes that 93% of the students that study Computer Science have obtained a grade point average between 3.49 and 4.49. Moreover, if a student has obtained a grade point average between 3.49 and 4.49, then the student studies the Computer Science degree with a probability of 75.4%. Rule number 3 shows that 71.6% of the students that study Medicine have obtained a grade point average between 4.53 and 4.97. If a student has obtained a GPA value between 4.53 and 4.97, then he/she studies the Medicine degree with a probability of 75%. Finally, rule number 4 describes the relationship between GPA and the degree of Engineering but in a different way as the other three rules do. Now, this rule describes that 80.6% of the students that study the degree of Engineering have obtained a GPA value between 3.99 and 4.91, and their desire was to study Egineering. Moreover, if a student has obtained a grade point average between 3.99 and 4.91 and his/her desire was to study Egineering, then the student studies the desired degree with a probability of 80.6%.
| # | Relationship | Sensitivity | Confidence | Unusualness |
|---|---|---|---|---|
| 1 | IF GPA IN [0.52, 3.57] THEN college = Other | 0.976 | 0.964 | 0.235 |
| 2 | IF GPA IN [3.49, 4.49] THEN college = Comp | 0.930 | 0.754 | 0.164 |
| 3 | IF GPA IN [4.53, 4.97] THEN college = Med | 0.716 | 0.750 | 0.117 |
| 4 | IF Desire = Eng AND GPA IN [3.99, 4.91] THEN college = Eng |
0.405 | 0.806 | 0.036 |
Rules that relate the GPA value and the degree where students enrol in
All these four rules describe interesting behaviours, denoting that students with the highest GPA tend to enrol in Medicine. Those students with a medium GPA divide their enrolment into Computer Science and Engineering. This is quite interesting since Computer Science and Engineering share similar skills, so students with a good GPA but not as good to enrol in Medicine, tend to study Computer Science or Engineering. More specifically, for the sake of split both degrees, the system discovers a rule that groups the students of Engineering, describing that those that wanted to study this degree then they will study it if they obtain a GPA between 3.99 and 4.91. Finally, it is noteworthy that students with the worst GPA (a value lower than 3.57) tend to study a different degree.
In a second group, we are analysing the subgroups that share information about the final mark in different subjects and the degree to be enrolled in. Table 5 depicts a set of rules that describe different behaviours in this sense. The two first rules show necessary skills to be enrolled in the Medicine degree and they are analysed as a group. All of them related the fact of obtaining a maximum mark in chemical (A+) with the fact of choosing Medicine as degree to study. The first rule determines that 87.7% of the students whose desire was to study Medicine and they have obtained the maximum mark in chemical, then they will study Medicine. This rule is quite interesting and will help the student to make an effort in this subject if the really want to study Medicine. Finally, the second rule also includes biology as an important subject to choose Medicine as a future degree. It describes that 94.2% of the students with an extremely good mark (A+) in both biology and chemical, then they will study Medicine.
| # | Relationship | Sensitivity | Confidence | Unusualness |
|---|---|---|---|---|
| 1 | IF Desire = Med AND Chem = A+ THEN college = Med |
0.670 | 0.877 | 0.086 |
| 2 | IF Chem = A+ AND Bio = A+ THEN college = Med |
0.494 | 0.942 | 0.065 |
| 3 | IF Phys = A AND Desire = Comp THEN college = Comp |
0.062 | 0.719 | 0.011 |
| 4 | IF Phys = A+ AND Desire = Comp THEN college = Comp |
0.062 | 0.816 | 0.012 |
| 5 | IF Desire = Med AND Phys = C+ THEN college = Comp |
0.096 | 0.904 | 0.019 |
| 6 | IF Desire = Eng AND Phys = A+ THEN college = Eng |
0.178 | 0.760 | 0.016 |
| 7 | IF Chem = F THEN college = Other | 0.481 | 0.886 | 0.106 |
| 8 | IF Phys = F THEN college = Other | 0.226 | 0.993 | 0.412 |
| 9 | IF Desire = Other THEN college = Other | 0.206 | 1.000 | 0.051 |
Rules that relate the final mark obtained in a subject of high school to the degree where students enrol in
Rules #3, #4 and #5, share information about the final mark required in different subjects to enrol in Computer Science. Rules #3 and 4 are quite similar. The first one determines that if a student has obtained a final mark of A in physics and his/her desire was to study Computer Science, then he studies the desired degree with a probability of 71.9%. In a similar way, if a student has obtained an excellent final mark (A+) in physics and his/her desire was to study Computer Science, then he studies the desired degree with a probability of 81.6%. The most interesting point in rule #3 is when the analysis is carried out by gender. At this point, the reliability of the rule changes from 71.9% to 84.93% for males, whereas this value highly decreases till 54.54% for females. This behaviour is quite interesting, since a rule that seems to be quite accurate exceptionally change the accuracy almost 20 points of difference when the feature female comes to play. Thus, the rule could be defined as meaningless if we divide it by gender.
Finally, rule #5 is very interesting relating an association between students whose desire was to study Medicine and their final decision to study Computer Science. This rule determines that those students that wanted to study Medicine and whose final mark in Physics is C+, then they finally study Computer Science. It is quite interesting since denote how a student should behave or, more specifically, which skills the student should have to be able to study the degree of Medicine. This rule is satisfy almost always, i.e. in 90.4% of cases. Making a data analysis, there are no students with a final mark below B+ in Physics, so the most appropriate degree to be enrolled in is Computer Science.
Rule #6 show information related to the degree of Engineering. It describes that if a student wants to study Engineering, then the student should obtain an excellent final mark (A+) in Physics to be able to enrol in the degree. This interesting behaviour, which is satisfied in 76% of the cases, describes the skills that a student should have in order to satisfy his/her preferences about the degree to enrol in.
Finally, the three last rules describe information about the skills required to enrol in other degree that is not Medicine, Computer Science or Engineering. Rules #7 and #8 describe that students with a really bad mark (F) in chemical or physics tend to enrol in other degree. In fact, 88.6% of the students with an F mark in chemical tend to not enrol neither in Medicine, nor in Computer Science or Engineering. In a similar way, 99.3% of the students with an F as final mark in Physics tend to behave as aforementioned. These behaviours denote that students with low skills in these two subjects are not appropriate to be enrolled in Medicine, Computer Science and Engineering. Thus, they should improve their skills or change their preferences. To sum up this analysis, rule #9 is quite unequivocal, stating that all the students that wanted to study other degree, then they will study other degree. This rule, in relation with the other ones, imply that students with really bad marks do not usually want to study degrees that require a high skill levels, being aware of their limitations to study a hard degree.
Discussion
Behind the observed results, we could verify that the extraction of useful information from data gathered by monitoring the students’ behaviours can have a positive impact on preventing students to enrol in degrees in which they are not skilled. The proposed data analysis provides interesting advices with regard to what is the best degree option for each specific skill, enabling students to choose the right degree to be enrolled in. The appropriateness of the proposed system has been checked at King Abdulaziz University by using gathered information about students for three years.
On the basis of the results obtained, we could analyse four interesting research questions:
- 1.
Is the grade point average (GPA) a real indicator of the degree in which a student should enrol? Traditionally, the higher the GPA of a student, the higher the number of degrees in which the student could be enrolled. The extracted knowledge reveals that the GPA is a good indicator of the best degree to be chosen, and better GPA values frequently indicate that Medicine is the best degree option. Figure 5 depicts the GPA indicator, which were previously described by four rules discovered by the proposed system (see Table 4). According to the rules discovered, most of the students with a GPA value lower than 3.57 tend to study a degree that neither is Medicine, nor Computer Science or Engineering. Additionally, those students with a GPA value higher than 4.53 tend to study Medicine. Finally, there is a higher overlapping when the GPA value is higher than 3.49 and lower than 4.91, and two more rules are required (rules #2 and #4 in Table 4). First, most of the students with a GPA value between 3.49 and 4.49 tend to study Computer Science. Since there is a high overlapping, a second rule determines that a GPA value between 3.99 and 4.91 implies the degree of Engineering if and only if the students wanted to study it.
- 2.
Could the final marks obtained in different subjects be a good indicator about the best degree for a specific student? Could a student know at an early age what degree he/she will study? Table 5 shows a series of rules that describe the high relation between final mark and the best degree option. For instance, the fact of obtaining a really good final mark (A+) in biology and chemical is a good indicator that the student will enrol in Medicine. These two subjects are very important and play an important role in this degree, being specially important to have a good basis in these two subjects. More specifically, if a student is quite good in both subjects at an early age in high school, then the student has the typical skills for the Medicine degree and the student should prepare to be a student in Medicine. In a similar way, an extremely good final mark (A+) in Physics is a good indicator that the best degrees to be enrolled in are Computer Science and Engineering (see rules #4 and #6, Table 5). These are only some examples that determine that the final mark obtained in different subjects is a really good indicator about the best degree to be enrolled in, and some students could know, at an early age, what is their best degree option. Nevertheless, it should be noted that not all the students could know, at an early age, the best degree. For instance, a student with a good final mark in Physics could be appropriate to study Computer Science and Engineering, and his/her final decision will be determined by his/her desire. Finally, rule #9 is quite interesting in knowing the degree in which a student will enrol. It determines that if a student wanted to study other degree, then the student will study this degree regardless the final marks obtained, so he/she could know at early age the degree the studnet will enrol.
- 3.
Could a student modify his/her skills at early ages to study what he/she really wants? Educators have the conviction that those students that really study what they wanted and who have the suitable skills for the degree, then they hardly drop out 1. Many of the rules discovered during the DM procedure reveal the required skills by students for each specific degree. In this sense, a student that want to study Medicine, then the student should be a really good student in Chemical and he/she would be able to study Medicine. As for Computer Science and Engineering, the students that want to study any of these degrees should be really good at Physics, obtaining the maximum mark (A+). Similarly, rule #5 (see Table 5) denotes that a student that want to study Medicine in the future cannot obtain a final mark of C+ in Physics. On the contrary, the student will study Computer Science, a degree quite different to his/her desire. Finally, the worse final mark (F) in the subjects of Chemical and Physics imply that students will study other degree. Thus, students should know that in case that they do not achieve the required skills in these subjects, then they cannot study neither Medicine nor Computer Science or Engineering.
5. Conclusions
In this paper, we have studied and analysed high school information gathered from different students to prevent the enrolment in degrees in which the students are not skilled. The idea behind this work is to provide a decision support system that analyse the students’ behaviours, skills and attitudes during the high school to be able to recommend a university degree. This decision support system includes a subgroup discovery algorithm based on grammars. The use of grammars is cornerstone in the problem under study, enabling the search space to be constrained by looking for results with different features and structures.

GPA values distribution and final degree option.
The proposed analysis provides advices with regard to what is the best degree option for each specific skill. In this sense, a student will choose a specific degree according to his/her skills and the probability of dropping out in the future would be reduced. The proposed model has been applied to the King Abdulaziz University (Saudi Arabia) where the drop out rate is growing and there is an increasing interest in introducing special programs to understand the skills and interests of students to guide them accordingly.
The experimental analysis has revealed a high interesting knowledge that is able to provide interesting information to students in order to prevent them to enrol in degrees in which they are not skilled, or to advice them to improve their skills to study what they really want. The rules provided in this study has established that the grade point average is a real indicator of the degree in which a student should enrol, but there are also other features that indicate the best degree for a specific students. For instance, the final marks obtained in different subjects is also a good indicator so a student could know, at an early age, what degree he/she will study or which one best fits to he/she. Additionally, the student could modify the skills to study what he/she really wants. It should be noted that educators have the conviction that those students that really study what they wanted and who have the suitable skills for the degree, then they hardly drop out.
Acknowledgements
This project was funded by the Deanship of Scientific Research (DSR), King Abdulaziz University, Jeddah, under grant No. (2-611-35/HiCi). The authors, therefore, acknowledge with thanks DSR technical and financial support. This work was supported by the Spanish Ministry of Economy and Competitiveness under the project TIN2014-55252-P, and FEDER funds.
Footnotes
Machine learning repository. http://archive.ics.uci.edu/ml/
Further information is publicly available at http://simidat.ujaen.es/NMEEF-SD
Further information is publicly available at http://simidat.ujaen.es/NMEEF-SD
References
Cite this article
TY  - JOUR
AU  - Amin Y. Noaman
AU  - José María Luna
AU  - Abdul H. M. Ragab
AU  - Sebastián Ventura
PY  - 2016
DA  - 2016/12/01
TI  - Recommending degree studies according to students’ attitudes in high school by means of subgroup discovery
JO  - International Journal of Computational Intelligence Systems
SP  - 1101
EP  - 1117
VL  - 9
IS  - 6
SN  - 1875-6883
UR  - https://doi.org/10.1080/18756891.2016.1256573
DO  - 10.1080/18756891.2016.1256573
ID  - Noaman2016
ER  -