
A Combined-Learning Based Framework for Improved Software Fault Prediction
- DOI
- 10.2991/ijcis.2017.10.1.43How to use a DOI?
- Keywords
- Software Fault Prediction; Software Metrics; Feature Selection; Data Balancing; Machine Learning
- Abstract
Software Fault Prediction (SFP) is found to be vital to predict the fault-proneness of software modules, which allows software engineers to focus development activities on fault-prone modules, thereby prioritize and optimize tests, improve software quality and make better use of resources. In this regard, machine learning has been successfully applied to solve classification problems for SFP. Nevertheless, the presence of different software metrics, the redundant and irrelevant features and the imbalanced nature of software datasets have created more and more challenges for the classification problems. Therefore, the objective of this study is to independently examine software metrics with multiple Feature Selection (FS) combined with Data Balancing (DB) using Synthetic Minority Oversampling Techniques for improving classification performance. Accordingly, a new framework that efficiently handles those challenges in a combined form on both Object Oriented Metrics (OOM) and Static Code Metrics (SCM) datasets is proposed. The experimental results confirm that the prediction performance could be compromised without suitable Feature Selection Techniques (FST). To mitigate that, data must be balanced. Thus our combined technique assures the robust performance. Furthermore, a combination of Random Forts (RF) with Information Gain (IG) FS yields the highest Receiver Operating Characteristic (ROC) curve (0.993) value, which is found to be the best combination when SCM are used, whereas the combination of RF with Correlation-based Feature Selection (CFS) guarantees the highest ROC (0.909) value, which is found to be the best choice when OOM are used. Therefore, as shown in this study, software metrics used to predict the fault proneness of the software modules must be carefully examined and suitable FST for software metrics must be cautiously selected. Moreover, DB must be applied in order to obtain robust performance. In addition to that, dealing with the challenges mentioned above, the proposed framework ensures the remarkable classification performance and lays the pathway to quality assurance of software.
- Copyright
- © 2017, the Authors. Published by Atlantis Press.
- Open Access
- This is an open access article under the CC BY-NC license (http://creativecommons.org/licences/by-nc/4.0/).
1. Introduction
Software faults are the root causes for software failures when get executed. These affect the reliability and quality of the software system. Thus many studies has made fault prediction with a common goal of reliability and quality assurance to ensure that developed software meets and complies with defined or standardized quality specifications. A targeted software quality inspection can detect faulty modules and reduce the number of faults occurring during operations. Nevertheless, software may have thousands of modules and it’s very tiresome and time consuming to allocate human as well as financial resources to go through all modules exhaustively. Thus, statistical and Machine Learning (ML) techniques have been employed in most studies so as to predict the fault-prone modules of the software [1] – [8], [10, 13], [15] – [19], [23, 24], [27, 28, 33, 34]. Therefore, effective prediction of fault-prone software modules can enable to direct test effort and reduce costs, help to manage resources more efficiently, and be useful for software developer. This in turn can lead to a substantial improvement in software quality. Identification of fault-prone software modules is commonly achieved through binary prediction models that classify a module into either defective or not-defective category. These prediction models utilize different software metrics [4], which have been associated with defects, as independent variables. In this study, we develop a new framework which incorporates eight widely used classifiers: Naïve Bayes (NB), Neural Network (NN), Support Vector Machine (SVM), Random Forest (RF), K-Nearest Neighbor (KNN), Decision Table (DTa), Decision Tree (DTr) and Random Tree (RTr) for building Software Fault Prediction (SFP) models.
Fundamentals to employ ML for effective and improved SFP are consideration of different software metrics [4] – [7], [11] – [14], [29, 30], Feature Selection (FS) [1, 8, 9], [15] – [17], [25], [28, 34] and Data Balancing (DB) [9, 18], [35] – [38]. For SFP, many software metrics have been proposed but we favor to separate the studies according to the most frequently used metrics: Chidamber and Kemerer’s (CK) Object Oriented Metrics (OOM) and McCabe and Halstead Static Code Metrics (SCM) [11]. FS is carried out by removing less important and redundant data, so that only beneficial features are left for training the classification models and the performance of learning algorithm could be improved. The benefits of FS for learning can include a reduction in the amount of data, improve the predictive performance, learn knowledge that is more compact and easily understood, and reduce the execution time [15]. Therefore, this study investigates three Feature Selection Techniques (FST) to build SFP models with datasets that suffer from a large number of irrelevant features (software metrics), each of which has been proven good in different SFP models [13], [15] –[17], namely Correlation Based Feature (CFS), Principal Components Analysis (PCA) and Information Gain (IG). Employing different FST would help us to attain the objective of identifying which FST are suitable in various contexts (software metrics).
On the other hand, the nature of software defect datasets consists of Fault-Prone (FP) and Not-Fault-Prone (NFP) modules. It has been seen that these datasets are highly skewed toward the NFP modules and the number of FP modules are relatively very small. The skewed data problem, also known as class imbalance, brings a unique challenge when building the classification model. However, practitioners and researchers often build fault prediction models without regard to the imbalance problem. Therefore, the class imbalance problem must be addressed when building fault predictors. Thus, another fundamental aspect of SFP is the imbalance nature of defect datasets, which the ML community has addressed in two ways. One is to assign distinct costs to training examples. The other is to re-sample the original dataset, either by oversampling the minority class and/or under-sampling the majority class [18, 35, 36]. As shown in different studies [35] – [38], balancing data using Synthetic Minority Oversampling Techniques (SMOTE) gives better classification performance. Therefore, this study explores the algorithm of SMOTE for building SFP models with datasets that suffer from class imbalance.
Unlike most other studies, to assure the improvement of classification performance, our proposed framework examines both OOM and SCM with efficient combination of FS and DB techniques. With our framework, we will get a balanced dataset for training the classification models, which in turn improve the performance and help to identify best classifiers and FST for each software metrics.
Therefore, the objective of this study is to independently examine software metrics and see their performance as well as investigate multiple FST to identify which FST could be suitable for which metrics with the application of DB technique to guarantee the improvement of classification performance. Accordingly, the primary contribution of this study is the empirical analysis of multiple software metrics and FST in combination with DB. Interestingly, the proposed framework has exhibited the robustness of combined techniques, which constitutes a major contribution credited to this study. The secondary contribution is recognizing FST suitability in various contexts to reduce features as well as improve the performance in SFP.
The remainder of this study is organized as follows: Section 2 provides an overview of related works. Section 3 discusses hypothesis and details of the proposed framework. Section 4 presents the experimental design. Section 5 reports our results and discussion, comparison of eight modeling techniques, three FST and DB technique with ROC evaluation measure for both OOM and SCM. Section 6 discusses what we consider the most important threats to validity. Section 7 concludes and outlines directions for future research.
2. Related Work
In this section, we focus on the studies that have attempted to address classification problems to build fault-proneness prediction models.
Fault prediction modeling is an important area of research and the subject of many previous studies. These studies typically produce fault prediction models which allow software engineers to focus development activities on FP code, thereby improving software quality and making better use of resources [22]. Many researchers have been employing ML and statistical techniques for SFP [26, 32, 33, 34]. Shivaji et al. [1] employed NB and SVM to investigate multiple FST for bug prediction on 11 software projects. NB provided 21% improvement in buggy F-measure and SVM provided 9% improvement in buggy F-measure. Gondra [2] assessed the possible benefits of neural networks versus SVMs to perform classification. He found the accuracy was 87.4% when using SVM compared to 72.61% when using neural networks using a threshold of 0.5, suggesting that SVM is a promising technique for classification within the domain of fault-proneness prediction with the data he used from NASA’s metrics data program repository. Elish and Elish [3] evaluated the capability of SVM in predicting defect-prone software modules and compared its prediction performance against eight statistical and ML models, using four NASA datasets. The results indicated that the prediction performance of SVM is generally better than, or at least, is competitive against the compared models. On the other hand, Arisholm et al. [4] evaluated eight selected modeling techniques on different measurements. The findings are that the measures and techniques which are put forward as the “best” are highly dependent on the evaluation criteria applied. Note that all these studies don’t consider different variety of software metrics, mostly build models on static code metrics and don’t apply FST as well as DB which is the most cruci al part for performance improvement, except that Shivaji et al. and Arisholm et al. used only FST and considered different software metrics, respectively [1, 4].
In the same work, Arisholm et al. [4] evaluted the impact of using different metric sets such as source code structural measures and change/fault history (process measures). They compared several alternative ways of assessing the performance (accuracy, precision, recall, ROC and cost-effectiveness) of the models to systematically evaluate how to build and evaluate fault-proneness models in large Java legacy system development project. Furthermore, they compared eight modeling techniques and observed large differences between the individual metric sets in terms of cost-effectiveness. Kim et al. [5] used deltas from 61 traditional complexity metrics (including Lines of Code (LOC), lines of comments, cyclomatic complexity, and max nesting) and a selection of process metrics, and applied them on twelve open source projects. Kanmani et al. [6] introduced two neural network based SFP models using Object-Oriented metrics. The results were compared with two statistical models using five quality attributes and found that neural networks do better. Among the two neural networks, Probabilistic Neural Networks outperform in predicting the fault proneness of the Object-Oriented modules developed. Gyimothy et al. [7] calculated the Object-Oriented metrics given by Chidamber and Kemerer to illustrate how fault -proneness detection of the source code of the open source software can be carried out, using regression and ML methods to validate the usefulness of these metrics for fault-proneness prediction. It is also important to note that both of these studies don’t consider employing FST as well as DB for performance improvement in SFP.
In addition to that, it has been realized that the performance of classifiers can be increased by keeping the quality of software datasets, which can be done by applying either suitable FST on respected software metrics and/or applying and building model on the dataset which has recommended percentage of faulty and non-faulty instances. Some researchers have employed those techniques separately. For instance, as discussed earlier, Shivaji et al. [1] investigated multiple FST using NB and SVM classifiers. Wang et al. [8] presented a comprehensive empirical study evaluating 17 ensembles of feature ranking methods including six commonly-used feature ranking techniques and 11 threshold-based feature ranking techniques. This study utilized 16 real-world software measurement datasets including a very large telecom software system, the Eclipse project, and NASA software project. Experimental results indicated that ensembles of very few rankers are very effective and even better than ensembles of many or all rankers. In both studies, they don’t consider employing different software metrics distinctly as well as DB for performance improvement.
Though some studies attempt to employ both FS and DB, few researchers have tried to combine them. Liu et al. [9] combined FS with DB using sampling techniques. But the purpose of the sampling was to reduce the total number of instances instead of handling class imbalance. To the best of our knowledge, no research attempt has been made combining the three (metrics, FS and DB/over sampling) concepts together explicitly for SFP.
Having this gap in mind, which has not been addressed by many studies, we design a new framework that treats the following three concepts step by step: Firstly, we consider different software metrics individually and build classification models. Secondly, we apply multiple FST for each software metric to identify which FS best suits for which metrics. Finally, we apply DB technique on the best features selected and build the classification model. Details of our new framework for improved SFP are presented in the following sections.
3. A Framework for Improving Software Fault Prediction
3.1. Hypothesis
H1. A Combined learning of FS with DB on both OOM and SCM, particularly applied with SMOTE can guarantee the improvement of classification performance for SFP.
H2. Suitable FST may vary in various software metrics (OOM and SCM) to reduce features as well as improve the performance in SFP.
3.2. The Proposed framework for software fault prediction
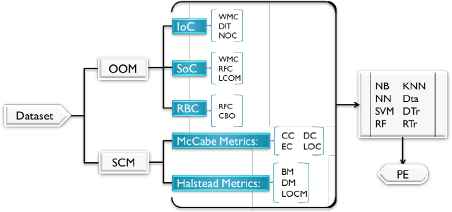
A framework for improving SFP is shown in Fig. 3.1 to Fig 3.3. We follow three strategies to train and build the classification models.
A framework for improving SFP (strategy one)
A framework for improving SFP (strategy two)
A framework for improving SFP (strategy three).
First, we start with treating multiple software metrics individually, though the natures of metrics are different. And we build classification models using eight selected, most frequently used ML algorithms (NB, NN, SVM, RF, KNN, DTa, DTr, and RTr) carried out by running a 10-fold cross-validation for SCM and OOM. Then the results are captured using ROC Performance Evaluation (PE) criteria. As shown in Fig 3.1, this strategy serves as a comparable reference in the subsequent performance experiments.
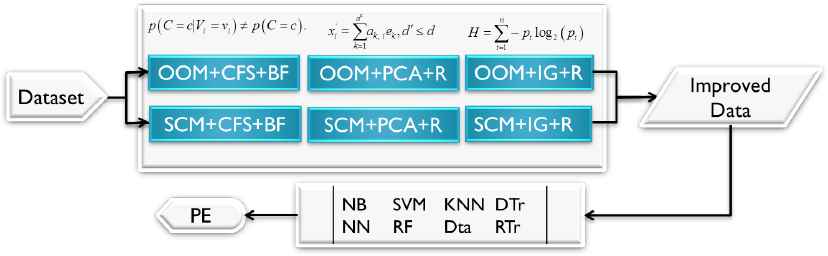
Second, we perform FS using three attribute evaluation methods (CFS, PCA and IG) and three search methods (BestFirst (BF), GreedyStepwise (GS) and Ranker (R), with 0.02 threshold to discard attributes) to identify useful features for learning. The input of the framework for this step is also SCM and OOM. Then we build the classification models on the selected features. As shown in Fig 3.2, this strategy serves as to compare with previous performance experiment and realize the effect of applying different FST on performance in different software metrics. Also we use these results as comparable reference in the subsequent performance experiment.
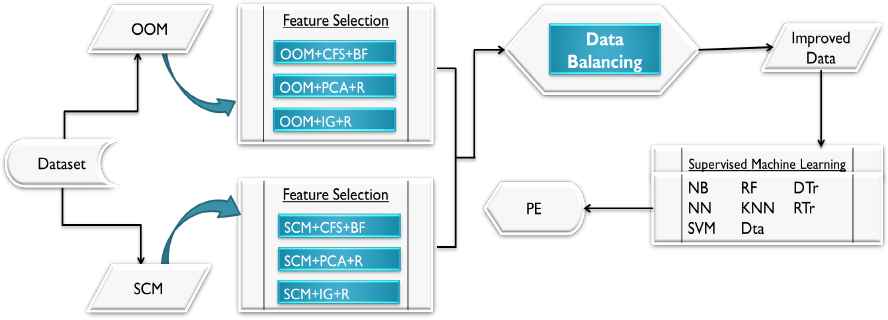
Third, we implement DB using SMOTE to manage data disproportion. To get reasonably balanced data for classification, we make the target ration for NFP and FP module as recommended to be 65% and 35%, respectively by Khoshgoftaar et al. [10]. The DB is done on the selected features only. As shown in Fig 3.3, this strategy serves as to prove the performance improvement by comparing with the previous performance experiment and finally to realize the best classifiers with respect to recommended FST for both SCM and OOM.
3.2.1. SCM and OOM
As discussed earlier, many software metrics have been proposed for SFP. But according to Radjenovic et al. [11], mostly used metrics are Object-Oriented metrics (49%) and traditional source code metrics (27%). Chidamber and Kemerer’s (CK) object-oriented metrics and McCabe and Halstead traditional or static code metrics were most frequently used once. Therefore, we favor to separate the studies according to these metrics.
Static Code Metrics (SCM): McCabe and Halstead feature attempts to objectively characterize code features that are associated with software quality. Their measures are “module” based where a “module” is the smallest unit of functionality. McCabe [12] argued that codes with complicated pathways are more error-prone. His metrics therefore reflect the pathways within a code module. His metrics are a collection of four software metrics such as Cyclomatic Complexity (CC), Essential Complexity (EC), Design Complexity (DC) and LOC. Whereas, Halstead argued that code which is hard to read is more likely to be fault-prone [13]. Halstead metrics estimates the complexity by counting the number of concepts in a module, for instance, the number of unique operators/operands. His metrics falls into three groups, such as the Base Measures (BM), the Derived Measures (DM), and LOC Measures (LOCM). The value of using static code metrics to build SFP models has been empirically illustrated by Menzies et al. [13], who stated that static code metrics are useful, easy to use, and widely used.
Object Oriented Metrics (OOM): According to Chidamber and Kemerer [14], object-oriented software metrics used at a class-level can be grouped under three stages of Object Oriented (OO) design processes. The first stage is Identification of Classes (IoC) which includes Weighted Methods for Class (WMC), Depth of Inheritance Tree (DIT) and Number of Children (NOC); The second stage is Semantics of Classes (SoC) which includes Weighted Methods for Class (WMC), Response for Class (RFC) and Lack of Cohesion of Methods (LCOM); The last stage is Relationships Between Classes (RBC) which includes Response for Class (RFC) and Coupling Between Objects (CBO).
3.2.2. Feature selection techniques
To improve the quality of software datasets and build classification models for SFP, selecting useful features has been found to be beneficial. FST could identify and extract most useful features of the dataset for learning, and these features are very valuable for analysis and future prediction. In most cases, the classification accuracy using the reduced feature set equaled to or bettered than that of using the complete feature set [1, 8, 15, 25, 31]. Nevertheless, as stated by Hall [15] in some cases, FS degraded ML performance in cases where some features are eliminated which are highly predictive of very small areas of the instance space or some features which are not predictive are selected. This shows that all FST don’t have equal performance and their performance can be varied in various software metrics. Thus for this study we employ three different kinds of FST, each of which has been proven good in SFP [13], [15] – [17], namely Correlation Based Feature (CFS), Principal Components Analysis (PCA) and Information Gain (IG). Employing different FST would help us to attain the objective of identifying which FST are suitable for which software metrics.
Correlation-Based Feature Selection (CFS): According to Hall [15], CFS quickly identifies and screens irrelevant, redundant, and noisy features, and identifies relevant features as long as their relevance does not strongly depend on other features. A feature is said to be redundant if one or more of the other features are highly correlated with it. In his work, Hall [15] has discussed the definition formalized by Kohavi and John, which is shown as follows.
Definition 1:
A feature Vi is said to be relevant iff there exists some vi and c for which p(Vi = vi) > 0 such that
In this study, we use CFS in conjunction with a BestFirst and GreedyStepwise search method, but both of them yield the same type and number of features from each dataset in both metrics employed.
Principal Components Analysis (PCA): The PCA approach was developed to reduce the dimensionality of the input features for both supervised and unsupervised classification purposes by Malhi et al. [16]. As they pointed out that the PCA technique transforms n vectors (x1, x2, … xi, …, xn) from a d -dimensional space to n vectors (x′1, x′2, … x′i, …, x′n) in a new, d′ -dimensional space as
Information Gain (IG): IG feature selection technique evaluates attributes by measuring their information gain with respect to the class. It measures the expected reduction in entropy caused by partitioning the class according to a given attribute. The entropy characterizes the impurity of an arbitrary collection of class. In this study, we use IG in conjunction with a ranker search method. According to Witten et al. [17], the IG associated with an attribute and a dataset is calculated using a straightforward implementation of Equation (3). First, the entropy of the dataset is computed. Then the difference between the former entropy and the weighted sum of the latter ones gives the information gain.
InfoGain = H(parent) – [weighted] average H(child), where H is the information entropy.
3.2.3. Data balancing
The performance of ML algorithms is typically evaluated using predictive accuracy. However, this is not appropriate when data is not proportional. A dataset is imbalanced if the classification categories are not approximately equally represented. Often software defect datasets are composed of none faulty instances with only a small percentage of faulty instances. According to Nitesh et al. [18], ML community has addressed the issue of class imbalance in two ways. One is to assign distinct costs to training instances. The other is to re-sample the original dataset, either by oversampling the minority class and/or under-sampling the majority class. For this study, we employ the special form of over-sampling the minority class, which has proposed in [18]. They confirmed that previous research has discussed over-sampling with replacement and has noted that it doesn’t significantly improve minority class recognition. Hence, they came up with their proposed over-sampling approach, in which the minority class is over-sampled by creating “synthetic” examples rather than by over -sampling with replacement. In conclusion to get reasonably balanced data for classification, we make the target ration for NFP and FP module as recommended to be 65% and 35%, respectively by [10].
3.2.4. Performance evaluation
The performance of ML algorithms is typically evaluated using predictive accuracy. However, this is not appropriate when the data is imbalanced. For instance, a typical software defect dataset might contain 95% NFP instances and 5% FP instances. A simple default strategy of guessing the majority class would give a predictive accuracy of 95%. However, SFP requires fairly high rate of correct detection in the minority class and allows for a small error rate in the majority class in order to achieve this. Simple predictive accuracy is clearly not appropriate in such situations. Therefore, we adopt the Receiver Operating Characteristic (ROC) curve, which is a standard technique for summarizing classifier performance over a range of tradeoffs between true positive and false positive error rates, which has been employed by different studies [1, 4, 8, 13, 18].
4. Experimental Design
As recommended by Kohavi [19], in this study, performance evaluation is carried out by running a 10-fold cross-validation. Each dataset is randomly partitioned into 10 mutually exclusive subsets (the folds) of approximately equal size. For 10 times, 9 folds are picked to train the models and the remaining fold is used to test them, each time leaving out a different fold. The performance of each classifier is evaluated against each software metrics. Experimental results are generated and analyzed by using WEKA version 3.6 [20] and MATLAB R2014a. Classification performance is measured using the ROC measure. As discussed earlier, ROC curves are popular metrics to evaluate classification algorithms against imbalanced datasets.
The proposed SFP framework is implemented step by step following three strategies, staring from building models normally using the widely used eight classifiers (NB, NN, SVM, RF, KNN, DTr, DTa, and RTr), which has been employed by many studies [1] – [8], [13], [15] – [19], [23, 24]. Moreover, three FS (CFS, PCA and IG) and DB techniques, in our case SMOTE are used to attain the study objective. Finally, the classification performance based on the proposed framework is evaluated using four publicly available software defect datasets.
Datasets: Four datasets which are publicly accessible from PROMISE repository of NASA software projects [21] are selected. These datasets have been widely used by many studies [22]. Table 4.1 summarizes some main characteristics of the datasets used in this study. The datasets are different in software metrics used, number of metrics, number of rows, and percentage of defects. Two datasets (mc1 and jm1) consist of commonly used Static Code Metrics (SCM). Camle1.6 and prop-4 datasets are based on OOM and consist of commonly used CK object-oriented software metrics. A comprehensive list of the metrics included in SCM and OOM of software defect datasets is listed in Table 4.2. In addition to SCM and OOM, to show the effect of our proposed framework while tackling the challenges of SFP mentioned in this study and ensure robust classification performance, we also used other group of software metrics (AEEEM ML and LC datasets) which combine six different groups of software metrics. This dataset was gathered by D’Ambros et al. [41] and have been used in different studies [39, 40]. It contains 61 metrics: 17 object oriented metrics, 5 previous-defect metrics, 5 entropy metrics measuring code change, and 17 churn-of-source code metrics. Details of this metrics are discussed in [41]. Note that data imbalance is consistently observed in all datasets.
| Dataset | Metrics | level | size | #Features | #Instances | NFP/FP Instances |
|---|---|---|---|---|---|---|
| prop-4 | OOM | class | 670k | 23 | 8718 | 7878/840 89.44%/10.56% |
| camel-1.6 | class | 119k | 24 | 965 | 777/188 80.5%/19.5% |
|
| mc1 | SCM | module | 998k | 39 | 9466 | 9398/68 99.28%/0.72% |
| jm1 | module | 841k | 22 | 10885 | 8779/2106 80.65%/19.35% |
|
| ML | Combined | class | 374k | 61 | 1862 | 1617/245 86.84%/13.16% |
| LC | Combined | class | 146k | 61 | 691 | 627/64 90.74%/9.26% |
A description of datasets
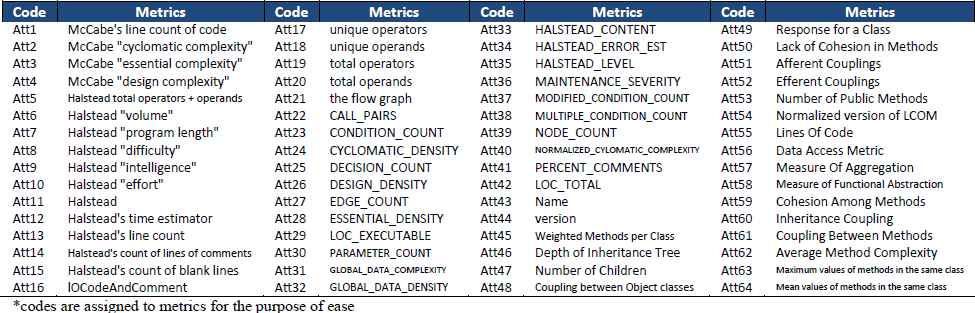
Metrics used in the study,
Before the experiments, during the data cleaning, we remove non-numeric attributes like name, which has only one value that is the name of the dataset. It’s found to be unnecessary and increase the prediction time. In addition to that, some modules that contain one or more faults are labeled as FP.
5. Analysis and Discussions
In this section, we present the experimental analysis and discussions based on the objective of the study. Performance comparison in terms of ROC among widely used three feature selection (CFS, PCA and IG), one DB (SMOTE) and eight supervised ML techniques (NB, NN, SVM, RF, KNN, DT, DTr and RTr) investigating both OOM and SCM datasets have presented in the following figures and tables. The results are based on the performance of classifiers before FST (Normal), after FS and combining FST with DB.
5.1. Classification performance evaluation
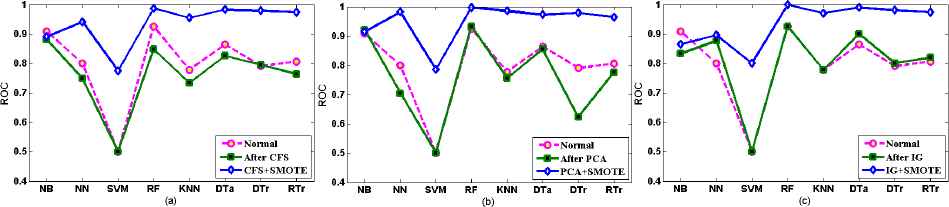
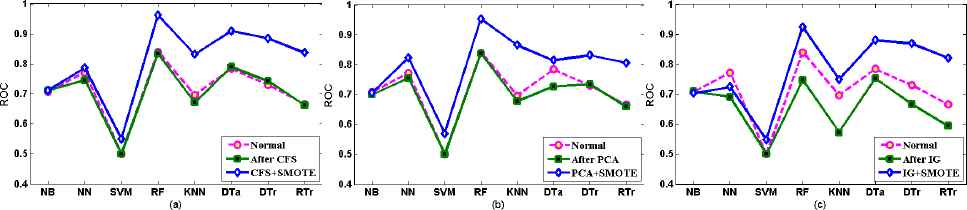
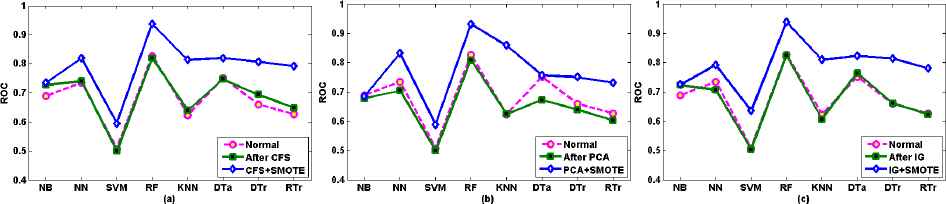
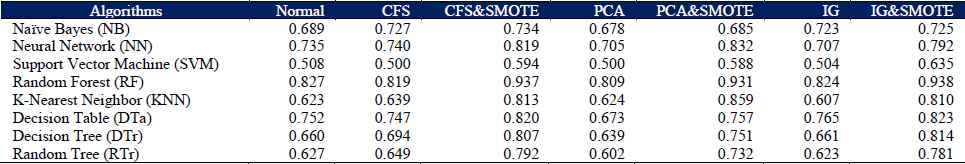
According to Fig 5.1 (a), (b), and (c) referring to Table 5.1 using three FST, except NB using CFS and IG, all other classifiers after DB exhibit better performance than performance before FS and using FST for mc1 SCM dataset. Specifically RF, KNN, DTa, DTr and RTr demonstrate the highest ROC values in all three FST when applied with DB technique, particularly RF (close to 1.0 ROC value) outperforms other classifiers, followed by DT, DTr and RTr using CFS; KNN, NN, DTr and DTa using PCA; and also DTa, DTr, RTr, and KNN using IG after DB.
Comparison of prediction performance before FS (Normal), after FS, and combined FS and DB for mc1 SCM
Classification results of different classifiers using ROC measure, before FS (Normal), after CFS, PCA and IG FST, and combined FS and DB for mc1 SCM dataset.
Although FS with DB contributes for the highest classification performance, the performance inconsistency has been observed when employing FS without DB. For instance, CFS approach seems to pick many poor features, which affects negatively the classification performance except DTr and SVM (which generates the same ROC value in all FST), as evidenced by Fig. 5.1(a). In the case of PCA for the same dataset mc1, slight differences have been exhibited, where RF and NB attains high values when compared with their values before using FS, as evidenced by Fig. 5.1(b). When it comes to IG, all classifiers achieve higher ROC value using FS when compared with ROC values before FS except for NB, as shown in Fig. 5.1(c). The performance inconsistency of classifiers can be considered to prove that not all FST are suitable for all metrics and classifiers. This also has been seen in different studies [15], as discussed earlier in Section 3, FS degrades ML performance in cases where some features are eliminated which are highly predictive of very small areas of the instance space or some features which are not predictive are selected. It is also confirmed that the performance can increase with fewer features due to noise reduction but can also decrease with fewer features due to important features missing. This is what has observed in this particular experiment. Generally, it shows that using IG selected features has been shown to be able to improve the ROC value of the classifiers. So that IG becomes better FST for mc1 SCM because except KNN, the rest seven classifiers reveal better performance. One thing should be noted here that under all circumstances (using all three FST), the combination of FST and DB yields improved performance results.
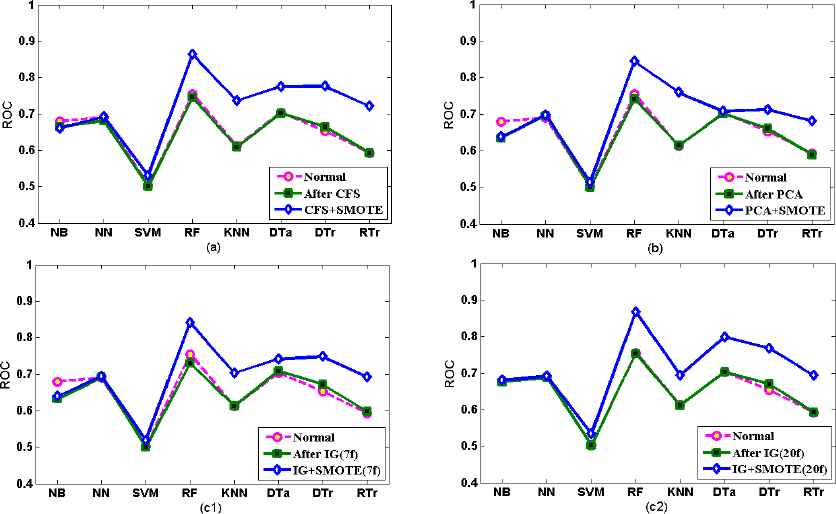
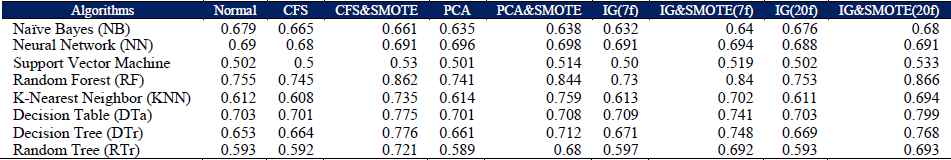
Yet again interesting development in classification performance has achieved after combined implementation of FST and DB in jm1 SCM dataset, except that to some extent NB in all selected FST shows less performance Fig 5.2 (a), (b), (c1), and (c2) referring Table 5.2 reveal different facts before FS (Normal), after FS and also applying FS with DB techniques. Furthermore, since IG FST is found to be a good choice for FS in this metric, we apply IG FS with 20 metrics (20f) and 7 metrics (7f) to realize the effect of reducing features on the classification performance. As discussed under Section 3, we have used threshold to select useful features as well as to discard less useful features from the datasets. In this case 20 metrics (20f) and 7 metrics (7f) were selected from jm1 SCM dataset based on the threshold value of 0.02 and 0.05, respectively. RF outperforms other classifiers, followed by DTr, DTa, KNN and RTr using CFS; KNN, DTr and DTa using PCA and also DTr, DTa, and KNN using IG after DB.
Comparison of prediction performance before FS (Normal), after FS, and combined FS and DB for jm1 SCM dataset
The highest classification performance has exhibited using FS with DB, as shown in Fig. 5.2(a) to (c2) and Table 5.2 but classification performances varied when applying FS without DB. This once again proves that DB is an important part to build classifiers for SFP. As we can see from Table 5.2, except DTr, CFS approach seems to pick many poor features, which affects negatively the classification performance. In the case of PCA for the same static code metrics (jm1), minor ROC value differences have exhibited, where NN, KNN and DTr attains high values when compared with their values before using FS, as shown in Fig. 5.2(b). As discussed earlier IG FST applied with 20f and 7f. With 7f all classifiers achieve higher ROC values using FS when compared with ROC values before FS except for RF and NB, as shown in Fig. 5.2(c1). But for 20f except RF, NB and KNN, the rest classifiers exhibit either equal (SVM, DTa and RTr) or higher (NN and DTr) performance. The finding here confirms that, not only performance inconsistency among classifiers but also the performance improvements observed when applying IG FS with less number of features (7f) (NN 0.691, KNN 0.613, DTa 0.709, DTr 0.671, and RTr 0.597) can also be considered as a proof that if we employ suitable FST for software mercies and classifiers, then the better result can be attained with small features which in turn reduces training and prediction time and memory requirement for classification [1, 9, 15]. Therefore, considering appropriate FST for software metrics is another important part to build SFP model.
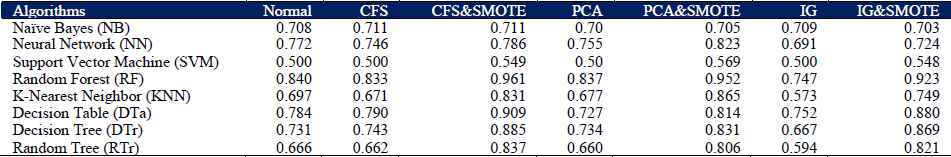
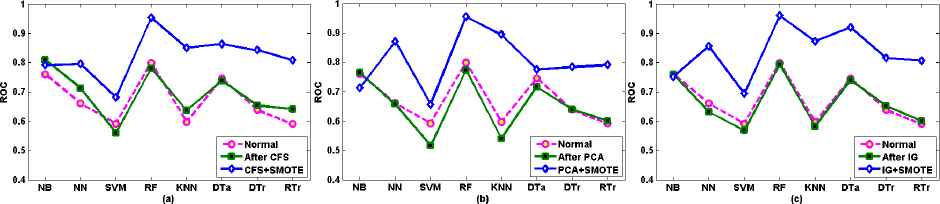
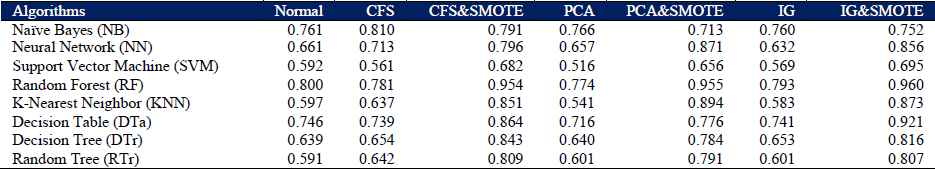
Referring to Fig 5.3 (a), (b), and (c) and Table 5.3 using three FST, except NN using IG FST, all other classifiers after DB exhibit better performance than those before FS and using FS techniques for camel-1.6 OOM dataset. Considering the general performance of classifiers, RF, NN, DTr, DTa, and KNN demonstrate highest ROC values after DB. Specifically RF outperforms other classifiers, followed by NN, DTr, DTa and KNN using CFS; NN and KNN using PCA; and also KNN and DTa using IG after DB. Alike SCM, here we also observe the performance discrepancy due to the suitability of FST in OOM datasets (camel-1.6). This reconfirms that regardless of the software metrics if FST are not suitable enough, the prediction performance can be compromised. To mitigate that as well as to get good prediction performance, data must be balanced, which is proved to be useful and give much better prediction performance irrespective of all three FST employed, as supported by the results in Fig 5.3 (a), (b), and (c), and Table 5.3. Another interesting finding observed in this OOM is using CFS selected features have shown to be able to improve the ROC value of the classifiers. So that CFS is found to be more suitable than other FST because CFS with four classifiers (NB, RF, DTa and DTr) outperforms other FST followed by PAC with three classifiers (NN, SVA and KNN) and IG with one classifier (RTr).
Comparison of prediction performance before FS (Normal), after FS, and combined FS and DB for camel-1.6 OOM dataset
Classification result of different classifiers using ROC measure, before FS (Normal), after CFS, PCA and IG FST, and combined FS and DB for jm1 SCM dataset
Classification result of different classifiers using ROC measure, before FS (Normal), after CFS, PCA and IG FST, and combined FS and DB for camel-1.6 OOM dataset.
The second OOM datasets called prop-4 performances are presented in Fig 5.4 (a), (b), and (c) and Table 5.4 using three FST. Except NB using PCA and IG, and NN using IG FST, all other classifiers exhibit better classification performance after DB. Again in this OOM, CFS is found to be more suitable than other FST because CFS outperforms other FST with five classifiers (NB, RF, DTa, DTr and RTr) followed by PAC with three classifiers (NN, SVA and KNN). However, all classifiers show great performance improvements in prop-4 OOM, RF outperforms other classifiers, and its ROC value is close to 1.0. It’s very surprising that some FST when implementing alone have performed poorly in the case of OOM than SCM. This inconsistency in classification performance may require further investigation on the nature of OO software metrics particularly camel-1.6 and prop-4 datasets, and its underlying features.
Comparison of prediction performance before FS (Normal), after FS, and combined FS and DB for prop-4 OOM dataset
Classification result of different classifiers using ROC measure, before FS (Normal), after CFS, PCA and IG FST, and combined FS and DB for prop-4 OOM dataset.
From the above, we tried to show the classification performance evaluation with respect to two groups of datasets (SCM and OOM). Because of lack of datasets, we couldn’t be able to perform a comparison between these two groups of metrics from the same project. However, we used AEEEM ML and LC datasets to show that our proposed framework tackling the challenges of SFP mentioned in this study and ensure robust classification performance. The experimental analysis and discussions based on these datasets and focusing on the objective of the study are presented as follows:
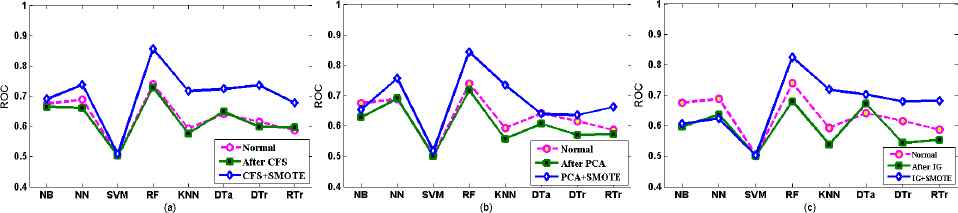
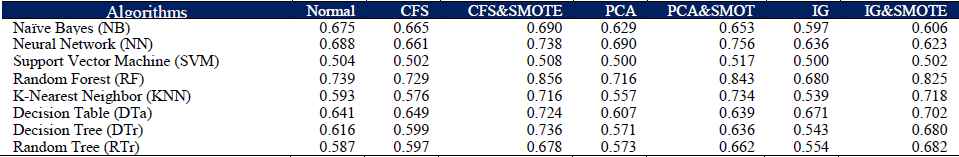
Referring to Fig 5.5 (a), (b), and (c) and Table 5.5 using three FST, except NB using PCA, all other classifiers after DB exhibit better performance than those before FS and using FS techniques for ML combined software metrics dataset. Considering the general performance of classifiers, RF, KNN, NN, DTa, and DTr demonstrate the highest ROC values after DB. Specifically RF outperforms other classifiers, followed by DTa, NN, KNN and DTr and RTr using CFS; KNN, NN, DTa, and DTr using PCA; and also DTa, DTr, KNN, NN and RTr using IG after DB. Alike SCM and OOM, here we also observed the performance discrepancy due to the suitability of FST in combined metrics (ML). This reasserts that regardless of the metrics selected and/or combined if FST are not suitable enough, the prediction performance can be compromised. Moreover, the power of DB has also observed again with the combined metrics. Better prediction performance has achieved, as demonstrated by the results in Fig 5.5 (a), (b), and (c), and Table 5.5. Another interesting finding observed in this combined metrics is using IG selected features have shown to be able to improve the ROC value of the classifiers. So that IG is found to be more suitable than other FST in the case of combined metrics as well, because IG with four classifiers (RF, SVM, DTa and DTr) outperforms other FST followed by both PAC with two classifiers (NN and KNN) and CFS with two classifier (NB and RTr).
Comparison of prediction performance before FS (Normal), after FS, and combined FS and DB for ML dataset
Classification result of different classifiers using ROC measure, before FS (Normal), after CFS, PCA and IG FST, and combined FS and DB for ML combined metrics dataset
Regarding LC combined software metrics, results are presented in Fig 5.6 (a), (b), and (c) and Table 5.6 using three FST. Except NB using CFS, PCA and IG all other classifiers after DB exhibit better performance than those before FS and using FS techniques. Considering the general performance of classifiers, RF, DTa, KNN, NN, DTr and RTr demonstrate the highest ROC values after DB. Specifically RF outperforms other classifiers, followed by DTa, KNN DTr, RTr, NN and NB using CFS; KNN, NN, RTr, DTr and DTa using PCA; and also DTa, KNN, NN, DTr and RTr using IG after DB. In this case, the performance inconsistency due to the suitability issue of FST in combined metrics (LC) has also been observed. This could be mitigated by employing suitable FST for combined metrics. This once again reaffirms that the prediction performance can be compromised if FST are not suitable enough regardless of the software metrics are selected and/or combined. In addition to that, contribution of DB for the performance of classifiers has also observed with the combined software metrics. Better prediction performance has achieved, as demonstrated by the results in Fig 5.6 (a), (b), and (c), and Table 5.6. Another interesting finding observed in this combined metrics is that it seems using both IG and CFS, selected features have shown to be able to improve the ROC value of the classifiers. IG with three classifiers (RF, SVM and DTa) as well as CFS with three classifiers (NB, DTr and RTr) perform better than PCA FST, which show good performance with two classifiers (NN and KNN). However, considering the average performance of eight classifiers, IG (0.835) outperforms other FST followed by CFS (0.824) and PCA (0.805). Therefore, it is found that IG FST is more suitable than CFS and PCA FST in the case of LC combined metrics.
Comparison of prediction performance before FS (Normal), after FS, and combined FS and DB for LC dataset
Classification result of different classifiers using ROC measure, before FS (Normal), after CFS, PCA and IG FST, and combined FS and DB for LC combined metrics dataset
Finally, the performance results, observed consistently from Fig 5.1–Fig 5.4, including Fig 5.5 and Fig. 5.6 for both datasets, confirm the assertion given by the first hypothesis of this study. As claimed, combining FS with DB assures the classification performance improvement in terms of ROC value. Interestingly enough, this is true with all employed FST, even including with some irrelevant elements seems selected in the feature set except inconsistent performance shown by certain classifiers (NB and NN) in some cases. This in turn shows the robustness nature of combined techniques. Therefore, we accept the first Hypothesis.
5.2. Comparison: SCM and OOM
As it has been seen above, a combination of FS and DB gives best classification performance using all eight employed ML techniques in all three employed FST applied on four datasets used in this study except minor performance inconsistency. Therefore, the following comparison between object oriented and static code metrics are based on the ROC value generated from balanced data.
5.2.1. FS and ML techniques performed best
Fig 5.7 (a) (SCM) and (b) (OOM) presents the average result of ROC value generated by each classifiers with respect to FST for four datasets employed using both SCM and OOM. The results reveal that high performing classifiers are RF, DTa, DTr and RTr if using CFS; the high performing classifiers are RF, KNN, DTr and DTa if using PCA; and the high performing classifiers are RF, DTa DTr and RTr if using IG. This shows that RF, DTa, DTr, KNN and RTr are high performing classifiers in a decreasing order for SCM, as evidenced by Fig 5.7(a) (SCM).
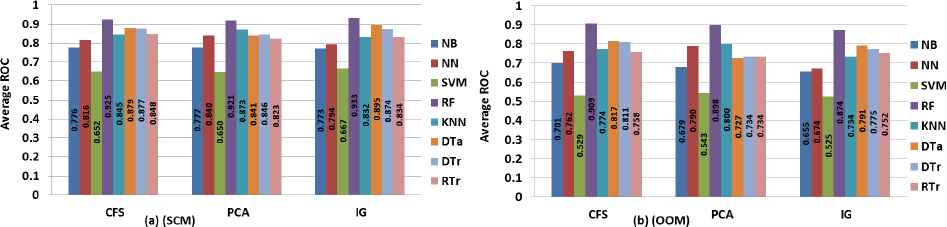
Average Performance of FS and ML techniques of SCM and OOM
On the other hand, as shown by Fig 5.7(b) (OOM), the results reveal that the high performing classifiers are RF, DTa, DTr and KNN if using CFS; the high performing classifiers are RF, KNN, NN and RTr if using PCA; and the high performing classifiers are RF if using IG, DTa DTr and RTr. This shows that the high performing classifiers are RF, DTa, DTr, KNN, RTr and NN in a decreasing order for OOM. Thus based on the amazing performance of RF in all datasets (including the combined metrics datasets) irrespective of metrics, we can conclude that RF is the best classifiers.
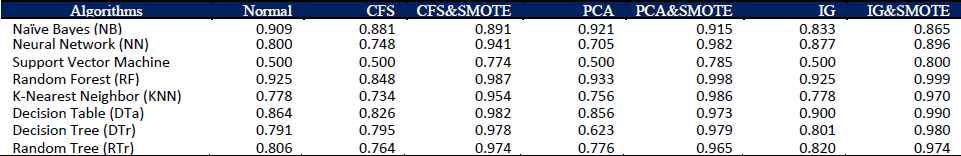
One interesting finding here is a combination of RF with IG FS yields the highest ROC (0.993) value and is found to be the best combination for SFP when SCM are used, with regard to the combined metrics RF with IG yields better performance results as well (see Fig. 5.5 and 5.6), whereas the combination of RF with CFS generates the highest ROC (0.909) value and is found to be the best choice for SFP when OOM are used.
In conclusion, the performance results, summarized in Fig 5.7 (a) (SCM) and (b) (OOM), confirm the assertion given by the second hypothesis of this study. As expected, the suitable FST vary for both software metrics. The IG and CFS techniques in our case are suitable for SCM and OOM, respectively. It has not only contributed significantly in improving the classification performance but also reducing execution time and the number of features (software metrics) required to achieve such performance. Therefore, we accept the second Hypothesis.
5.2.2. Static Code and Object Oriented Metrics contributed for classification performance
As discussed earlier, IG feature selection is found to be better choice for SCM because IG is able to pick better features as indicated by the ROC values shown in Tables 5.1 – 5.2. However, this performance of IG does not compete with that of achievement by the CFS method for OOM as shown in Tables 5.3 – 5.4. So CFS turns out to be good choice for OOM. On the other hand, a careful inspection of the feature list produced indicates that the Att1, Att13, Att29, Att18, Att12, Att10, Att5, Att20, Att19, Att42, Att6, and Att2 (refer to Table 4.2) by the IG technique and the Att46, Att47, Att48, Att51, Att49, Att50, Att52, and Att53 (refer to Table 4.2) by the CFS technique are the most meaningful features that help to boost the classification performance.
6. Threat to Validity
There are a number of threats that may have an impact on the results of this study. The prediction models proposed in this study were built by using default parameters. That is, we have not investigated how the models are affected by varying the parameters. In addition to that, many software metrics are defined in literature. Thus other metrics might be better indicator to defects. However, we used metrics which were widely used in different studies [11] and that were available from the selected datasets. The study conclusions presented are based on the selected software metrics. These datasets may not be characteristic of all industrial domains. These datasets may not also be good representatives in terms of the numbers and sizes of classes. However, this practice is common among the fault prediction research area.
7. Conclusion and Future Works
This study has empirically evaluated the capability of eight widely used classifiers (NB, NN, SVM, RF, KNN, DTr, DTa, and RTr) in predicting defect-prone software modules and compared its prediction performance normally, after FS and combined FST with DB technique in the context of four NASA datasets of which two of them are based on SCM and the rest two datasets are based on OOM. Moreover, the study has verified the proposed framework on other groups of software metrics using AEEEM Datasets. We also employed three carefully selected FST, namely CFS, PCA and IG, with DB techniques, in our case SMOTE. The experimental results demonstrated both robust and little inconsistent results while employing FST on both software metrics based on ROC measurement criteria. This confirms that regardless of the software metrics if not suitable FST are used, the prediction performance can be compromised. To mitigate that as well as to get good prediction performance, data must be balanced. Our combined technique assures the classification performance improvement in terms of ROC value. This in turn shows the robustness nature of combining techniques. On the tested datasets, the suitable FST were found to be varied for both software metrics. The IG and CFS techniques outperformed the rest. So that they are found to be suitable for SCM and OOM, respectively. In our case, a combination of RF with IG, FS yields the highest ROC (0.993) value when SCM and combined metrics are used whereas the combination of RF with CFS generates the highest ROC (0.909) value when OOM are used. It has not only contributed significantly in improving the classification performance but also reducing the number of features (software metrics) required to achieve such performance. Therefore, this study shows that software metrics used to predict the fault proneness of the software must be carefully examined and the FST which is suitable for metrics must be cautiously selected. Moreover, DB must be applied in order to get robust results. Thus, dealing with the challenges of SFP mentioned in this study, our proposed framework ensures remarkable classification performance and lays the pathway to software quality assurance.
For the future work, we plan to apply more datasets which consist of process and delta software metrics including SCM and OOM generated from single projects; investigate why several classifiers shows inconsistency in some FST and metrics as well; explore more FST and realize how the proposed framework improves the performance of classifiers. We also planned to incorporate and explore the benefit of using combined over-sampling and under-sampling DB techniques with our new framework. In addition to that, we found that, the problem of cross-project fault prediction and the bugs with more specific features [42] are very interesting and if this problem area can be broadly addressed, it will have invaluable contribution in the area of SFP, which we plan to work on it in the future.
References
Cite this article
TY  - JOUR
AU  - Chubato Wondaferaw Yohannese
AU  - Tianrui Li
PY  - 2017
DA  - 2017/01/25
TI  - A Combined-Learning Based Framework for Improved Software Fault Prediction
JO  - International Journal of Computational Intelligence Systems
SP  - 647
EP  - 662
VL  - 10
IS  - 1
SN  - 1875-6883
UR  - https://doi.org/10.2991/ijcis.2017.10.1.43
DO  - 10.2991/ijcis.2017.10.1.43
ID  - Yohannese2017
ER  -